Article

Molybdenum Modified Sol–Gel Synthesized TiO2 for the Photocatalytic Degradation of Carbamazepine under UV Irradiation

by
Chukwuka Bethel Anucha
1,*,
Emin Bacaksiz
1,
Vassilis N. Stathopoulos
2,
Pavlos K. Pandis
2,3,
Christos Argirusis
3,
Constantina-Dia Andreouli
4,
Zoi Tatoudi
4 and
Ilknur Altin
1
1
Department of Chemistry/Physics, Faculty of Science, Karadeniz Technical University, Trabzon 61080, Turkey
2
Laboratory of Chemistry and Materials Technology, Department of Agricultural Development, Agrofood, and Management of Natural Resources, National and Kapodistrian University of Athens, Psachna Campus, 34400 Evia, Greece
3
Laboratory of Inorganic Materials Technology, School of Chemical Engineering, National Technical University of Athens, 9 Iroon Polytechniou Str., Zografou Campus, 15780 Athens, Greece
4
Materials Industrial Research and Technology Center S.A., Anthion-Lamias National Road (76th Km), P.O. Box 18646, 34100 Chalkida, Greece
*
Author to whom correspondence should be addressed.
Processes 2022, 10(6), 1113; https://doi.org/10.3390/pr10061113
Submission received: 13 April 2022 / Revised: 26 May 2022 / Accepted: 27 May 2022 / Published: 2 June 2022
(This article belongs to the Special Issue Wastewater Treatment by Advanced Oxidation Processes)

Abstract

:
Pharmaceutical CEC compounds are a potential threat to man, animals, and the environment. In this study, a sol–gel-derived TiO2 (SynTiO2) was produced and subsequently sonochemically doped with a 1.5 wt% Mo to obtain the final product (Mo (1.5 wt%)/SynTiO2). The as-prepared materials were characterized for phase structure, surface, and optical properties by XRD, TEM, N2 adsorption–desorption BET isotherm at 77 K, and PSD by BJH applications, FTIR, XPS, and UV-Vis measurements in DRS mode. Estimated average crystallite size, particle size, surface area, pore-volume, pore size, and energy bandgap were 16.10 nm, 24.55 nm, 43.30 m2/g, 0.07 cm3/g, 6.23 nm, and 3.05 eV, respectively, for Mo/SynTiO2. The same structural parameters were also estimated for the unmodified SynTiO2 with respective values of 14.24 nm, 16.02 nm, 133.87 m2/g, 0.08 cm3/g, 2.32 nm, and 3.3 eV. Structurally improved (Mo (1.5 wt%)/SynTiO2) achieved ≈100% carbamazepine (CBZ) degradation after 240 min UV irradiation under natural (unmodified) pH conditions. Effects of initial pH, catalyst dosage, initial pollutant concentration, chemical scavengers, contaminant ions, hydrogen peroxide (H2O2), and humic acid (HA) were also investigated and discussed. The chemical scavenger test was used to propose involved photocatalytic degradation process mechanism of CBZ.

1. Introduction

Socio-economic advancement and high global population are among the factors that have put unrivaled pressure on the water environment. To meet human demand for improved personal and social welfare, strengthen the health care system to tackle ailments and diseases, and boost food production to fight off hunger and starvation, more synthetic chemical compounds have been produced, marketed, and used [1,2]. Undoubtedly, these efforts have an advanced and improved societal livelihood. However, as good as that may sound, it has also led to global water quality issues, which now is one of the greatest challenges faced by humanity in the 21st century [1,2,3,4]. Aquatic pollutants comprise a vast variety of organic and inorganic chemical compounds [1,2]. A group of these chemical compounds that have, in the last few decades, caught attention as to what their occurrence, environmental fate, and potential toxicity might be is the so-called contaminants of emerging concern (CECs) [5,6,7]. CECs, as defined by the network of reference laboratories, research centers, and related organizations for monitoring of emerging environmental substances (NORMAN), are anthropogenic or naturally occurring chemicals that are not routinely monitored in the environment but have the potential to enter the environment and cause known or pose adverse ecological and/or human effects [8]. Additionally, they well might have been in the environment for a long time due to their incessant release but have not been detected until recently following the advent of sophisticated analytical instruments suitable for their low detection limit of ng/L- µg/L [8]. They have spread over a wide coverage of chemical compounds, including pharmaceuticals and personal health care products (PPCPs), pesticides, flame retardants (FRs), surfactants, artificial sweeteners (ASWs), endocrine disrupting substances (EDSs), veterinary products, engineered nanomaterials, industrial compounds/by-products, food additives, and a host array of different compounds, including their metabolites and transformation products [4,8,9,10,11,12,13]. More than 700 out of over 100,000 documented CEC compounds, their metabolites, and transformation products are listed as present in the European aquatic environment by NORMAN, which is an indicator of their continental presence and global ubiquity [6,8].
Prominent among the classified categories of CECs by the NORMAN based on their origin are pharmaceuticals and personal healthcare products (PPCPs), and a variety of them have been reported across continental European water sources [8,14,15,16,17,18,19,20]. Several compounds of pharmaceutical origin have been reported in water sources from across Europe, and one such compound is carbamazepine (CBZ), 5H-dibenzo[b,f]azepine-5-carboxamide [8,14,15,16,17,18,19,20]. As a dibenzazepine derivative with a structural resemblance to tricyclic antidepressants, it is used as an antiepileptic drug for seizure control, pain relief due to trigeminal neuralgia, as well treatment of different relevant psychiatric disorders. Amongst the number of established sources and pathways through which these compounds enter the environment, effluents from municipal wastewater treatment plants (WWTPs) have been identified [15,17,21,22]. The poor removal efficiency of CECs by the WWTPs has been seen as the reason for the proliferated concentrations of these compounds and their metabolites in the environment, even after treatment [23,24]. To tackle the challenge of poor removal susceptibility of CECs by WWTPs operating on conventional treatment methods, advanced oxidation processes (AOPs) as alternatives have been introduced for the ultimate eradication of these compounds [14,15,16,17,18,25]. Efforts focused on the development of practical and efficient solar-based AOPs have eventually led to the adoption of various technologies including heterogeneous photocatalysis as a means of enhanced degradation and detoxification of WWTP effluent discharges [14,15,16,17,18,26,27,28]. Semiconductors play key roles in solar-driven heterogeneous photocatalysis and one such material that has been prominent and widely studied amongst other semiconductor materials is titania (TiO2) [29,30,31,32]. Extensive studies on the application of TiO2 stem from its unprecedented properties of chemical inertness and stability, easy UV activation, environmental friendliness, corrosion resistance, low cost, availability, etc. [33]. However, despite all these excellent properties, the practical realization of TiO2 photocatalyst environmental remediation and other related application is still farfetched. Wide energy band, restriction to low-end UV activity and less UV-Visible spectrum energy harvesting, the fast tendency of photogenerated charge recombination, low quantum yield, etc., are part of the major setbacks challenging TiO2 photocatalyst deployment for full scale-up environmental remediation applications [34,35,36].
On this note, several strategic effects have been found to further improve the performance of TiO2 semiconductor-based photocatalysis. Metal oxide semiconductor coupling, surface morphology regulation, carbonaceous and nanomaterial hybridization, dye/noble metal sensitizations, heterojunction constructions, as well as heteroatom doping, etc., are various forms of modification strategies that have been executed by different studies with a show of TiO2 photocatalyst performance enhancement [37,38,39,40].
By heteroatom doping and/or semiconductor metal oxide coupling, studies have been performed investigating the photocatalytic activity enhancement of Mo modified TiO2-based photocatalyst material either in mono-doped form or in co-existence with other dopants for the degradation of organic chemical pollutants in water. For instance, by evaporation-induced self-assembly (EISA), Aviles-Garcia et al. synthesized 1 wt% (W and Mo) co-doped TiO2 and reported the highest degradation and mineralization of 97% and 74%, respectively, over 4-chlorophenol oxidation by the photocatalyst after 100 min UV irradiation [41]. Huang et al., with a sol–gel, synthesized Mo (2 wt%)-doped TiO2 reported ≈100% methylene blue (MB) degradation after 300 min of solar light irradiation [42]. In another study, Zhang et al. prepared by anodizing associated hydrothermal method Mo and N co-doped TiO2, and after 180 min reported an impressive visible light photocatalytic degradation activity by the photocatalyst composite of 1% dopant content each over 10 mg/L initial methylene blue (MB) [43]. Yang et al., with an optimum MoO3/TiO2 mass ratio of 0.25, reported a 38% methylene blue (MB) conversion under visible light after 150 min by the photocatalyst obtained via wet impregnation and attributed the enhanced activity of the modified TiO2 in comparison to the unmodified TiO2 to both bandgap shrinkage and added a suitable amount of the crystalline MoO3 [44]. CuMoO4-doped TiO2 achieved via the chemical synthesis route has been reported to deliver a highly efficient degradation of 96.9% of 4-chlorophenol at an optimized 0.05 wt% of the dopant contents under visible light irradiation, for 3 h and at pH 9 condition [45].
Specifically, carbamazepine (CBZ) as a target classified model CEC of pharmaceutical origin has been studied by research groups for activity performance enhancement evaluation of modified photocatalyst materials, including TiO2-based ones. For example, by microwave synthesis, Surenjan et al. reported a highly effective C-doped spherical anatase TiO2 of more than 98% degree of CBZ mineralization after 4 h of visible light irradiation under pH 6.5–8.5 conditions [46]. In a related study, and by the same synthesis method but a different approach, Sambandan et al. deposited graphitic carbon on TiO2 and leveraged its surface morphology via a conjugated co-exposed low/high energy thermodynamically favored facet. As an outcome, they generated enhanced visible-light photocatalytic activity performance in the degradation of CBZ and attributed that to the rice grain-shaped crystal morphology outcome following the modification of the base TiO2 material [47]. Successful test outcome of TiO2-SiO2/MWCNT nanocomposite fabricated over the 0.01–17.8% range of CNT content in the TiO2-SiO2 base tested over the photocatalytic degradation of carbamazepine (CBZ) by Czech and Buda has been reported [48]. The authors cited that while SiO2 addition to the composite improved TiO2 dispersion, the multiwalled-carbon nanotube (MWCNT) reduced the energy bandgap of the composite by a unit in comparison to the unmodified TiO2 for an enhanced visible-light photocatalytic activity performance [48]. More recently, our group reported an impressive performance of B/NaF-TiO2 and its silicon phthalocyanine form (SiPc), respectively, synthesized by sol–gel and Schiff base process assisted sol–gel method over CBZ with ~100% degradation achieved of the former and about 70% achieved of the later after 4 h UV irradiation [15]. In the same vein, with formulated CuWO4-TiO2 containing 0.05 wt% CuWO4 prepared by the co-precipitation-assisted hydrothermal protocol in the anatase TiO2 base prepared by sol–gel method, we reported a high photocatalytic activity performance of ~100% CBZ degradation after 2 h of UV irradiation [17].
Given the background of the few highlighted studies introducing reports of titania (TiO2), and other semiconductor-based materials modification with Mo and/or other transition metal dopants for improved photocatalytic activity performance over the degradation organic pollutants, various modification outcome effects have been credited for such enhanced activity performances by the photocatalyst materials [49]. Changes in optoelectronic properties, generation of defect sites, variable oxidation states, and enhanced charge mobility, etc., are some of the attributes shown by transition metal dopants on their base material hosts for enhanced optical and catalytic properties when employed and evaluated for their potential environmental, energy, and other related applications [50,51,52,53,54,55].
By these effects, promising photocatalyst materials have been developed and studied, displaying near or total removal of organic compound pollutants from water sources, underpinning the importance of metal oxide materials in the realization of improved performance semiconductor-based material composites for application in water decontamination purposes [56,57]. Comparatively, out of a wide range of reports involving Mo dopant in modified TiO2 and other semiconductor-based photocatalyst materials for activity improvement, few of the highlighted studies focused on in this paper did not show a total or near-complete removal of the investigated model pollutant. For instance, while with 1.5 wt% (Mo)/SynTiO2 we achieved almost a complete removal of CBZ in 240 min, in this study, 2 wt% Mo modified TiO2 was investigated by Huang et al., though 100% MB under solar irradiation was also removed; however, a more prolonged time of exposure of 300 min was adopted. Here again, higher catalyst dosage was also employed by the authors against what is normally a benchmark model pollutant for evaluating photocatalyst material activity performance. In another scenario, Aviles-Garcia et al. achieved 97% degradation and 76% mineralization of 4-chlorophenol under UV exposure of 100 min irradiation time. This again was with a 1 wt% (Mo-W) co-doped TiO2 as compared to what was achieved in this study with the 1.5 wt% Mo single doped TiO2, removing almost 100% CBZ after 240 min UV irradiation, although their investigated photocatalyst made an impressive performance achievement with a total dopant weight of 2 wt% in the co-doped form. Our study achieved, with a single doped form, almost total CBZ removal with a lower dopant amount of 1.5 wt% Mo.
While Mo/SynTiO2 material, to the best of our knowledge, is for the first time employed in the photocatalytic degradation of CBZ as a classified CEC compound, the sonochemical preparation method used in its realization sets the study further apart on the basis of a greener approach as compared to the known nanomaterial synthesis routes usually involving high bulk temperature, and high pressure demand as well as longer reaction time for the realization of nanomaterials.
In light of these, this study demonstrates the evaluation of the photocatalytic activity performance efficiency of Mo (1.5 wt%) doped sol–gel synthesized TiO2 (Mo/SynTiO2) prepared via sonochemical procedures for the degradation of carbamazepine (CBZ) as the target model CEC compound.

2. Results and Discussion

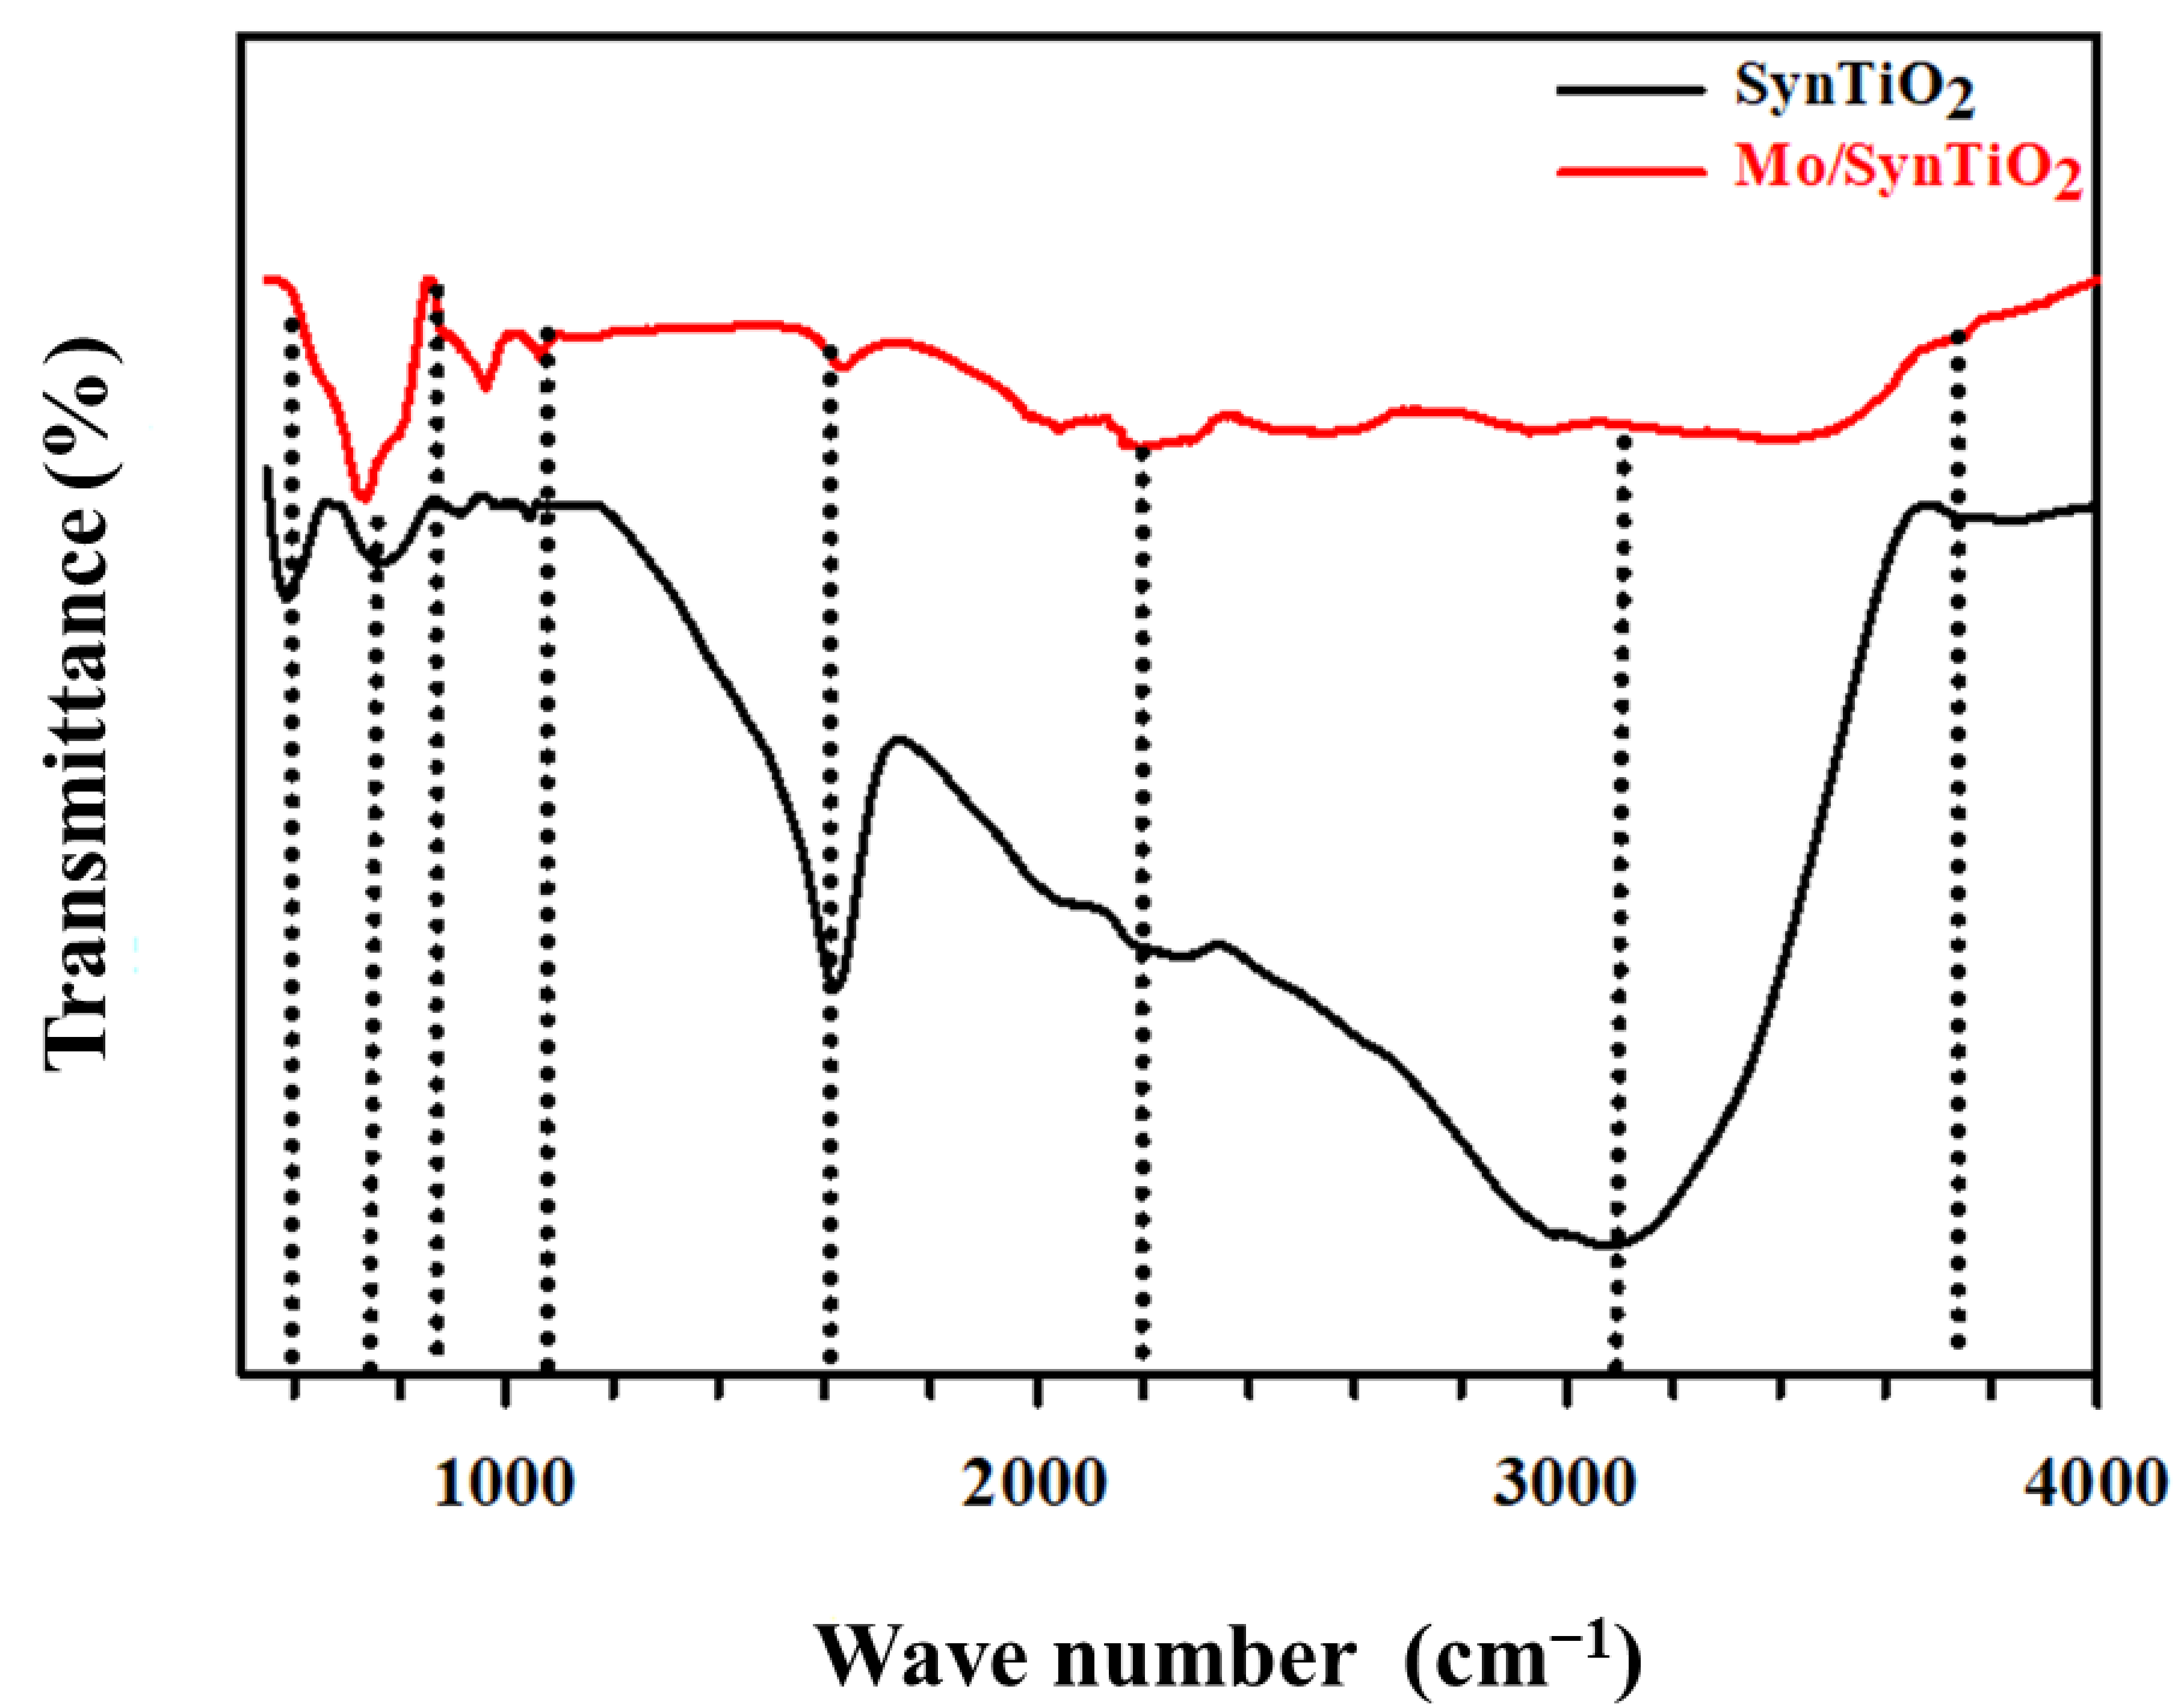
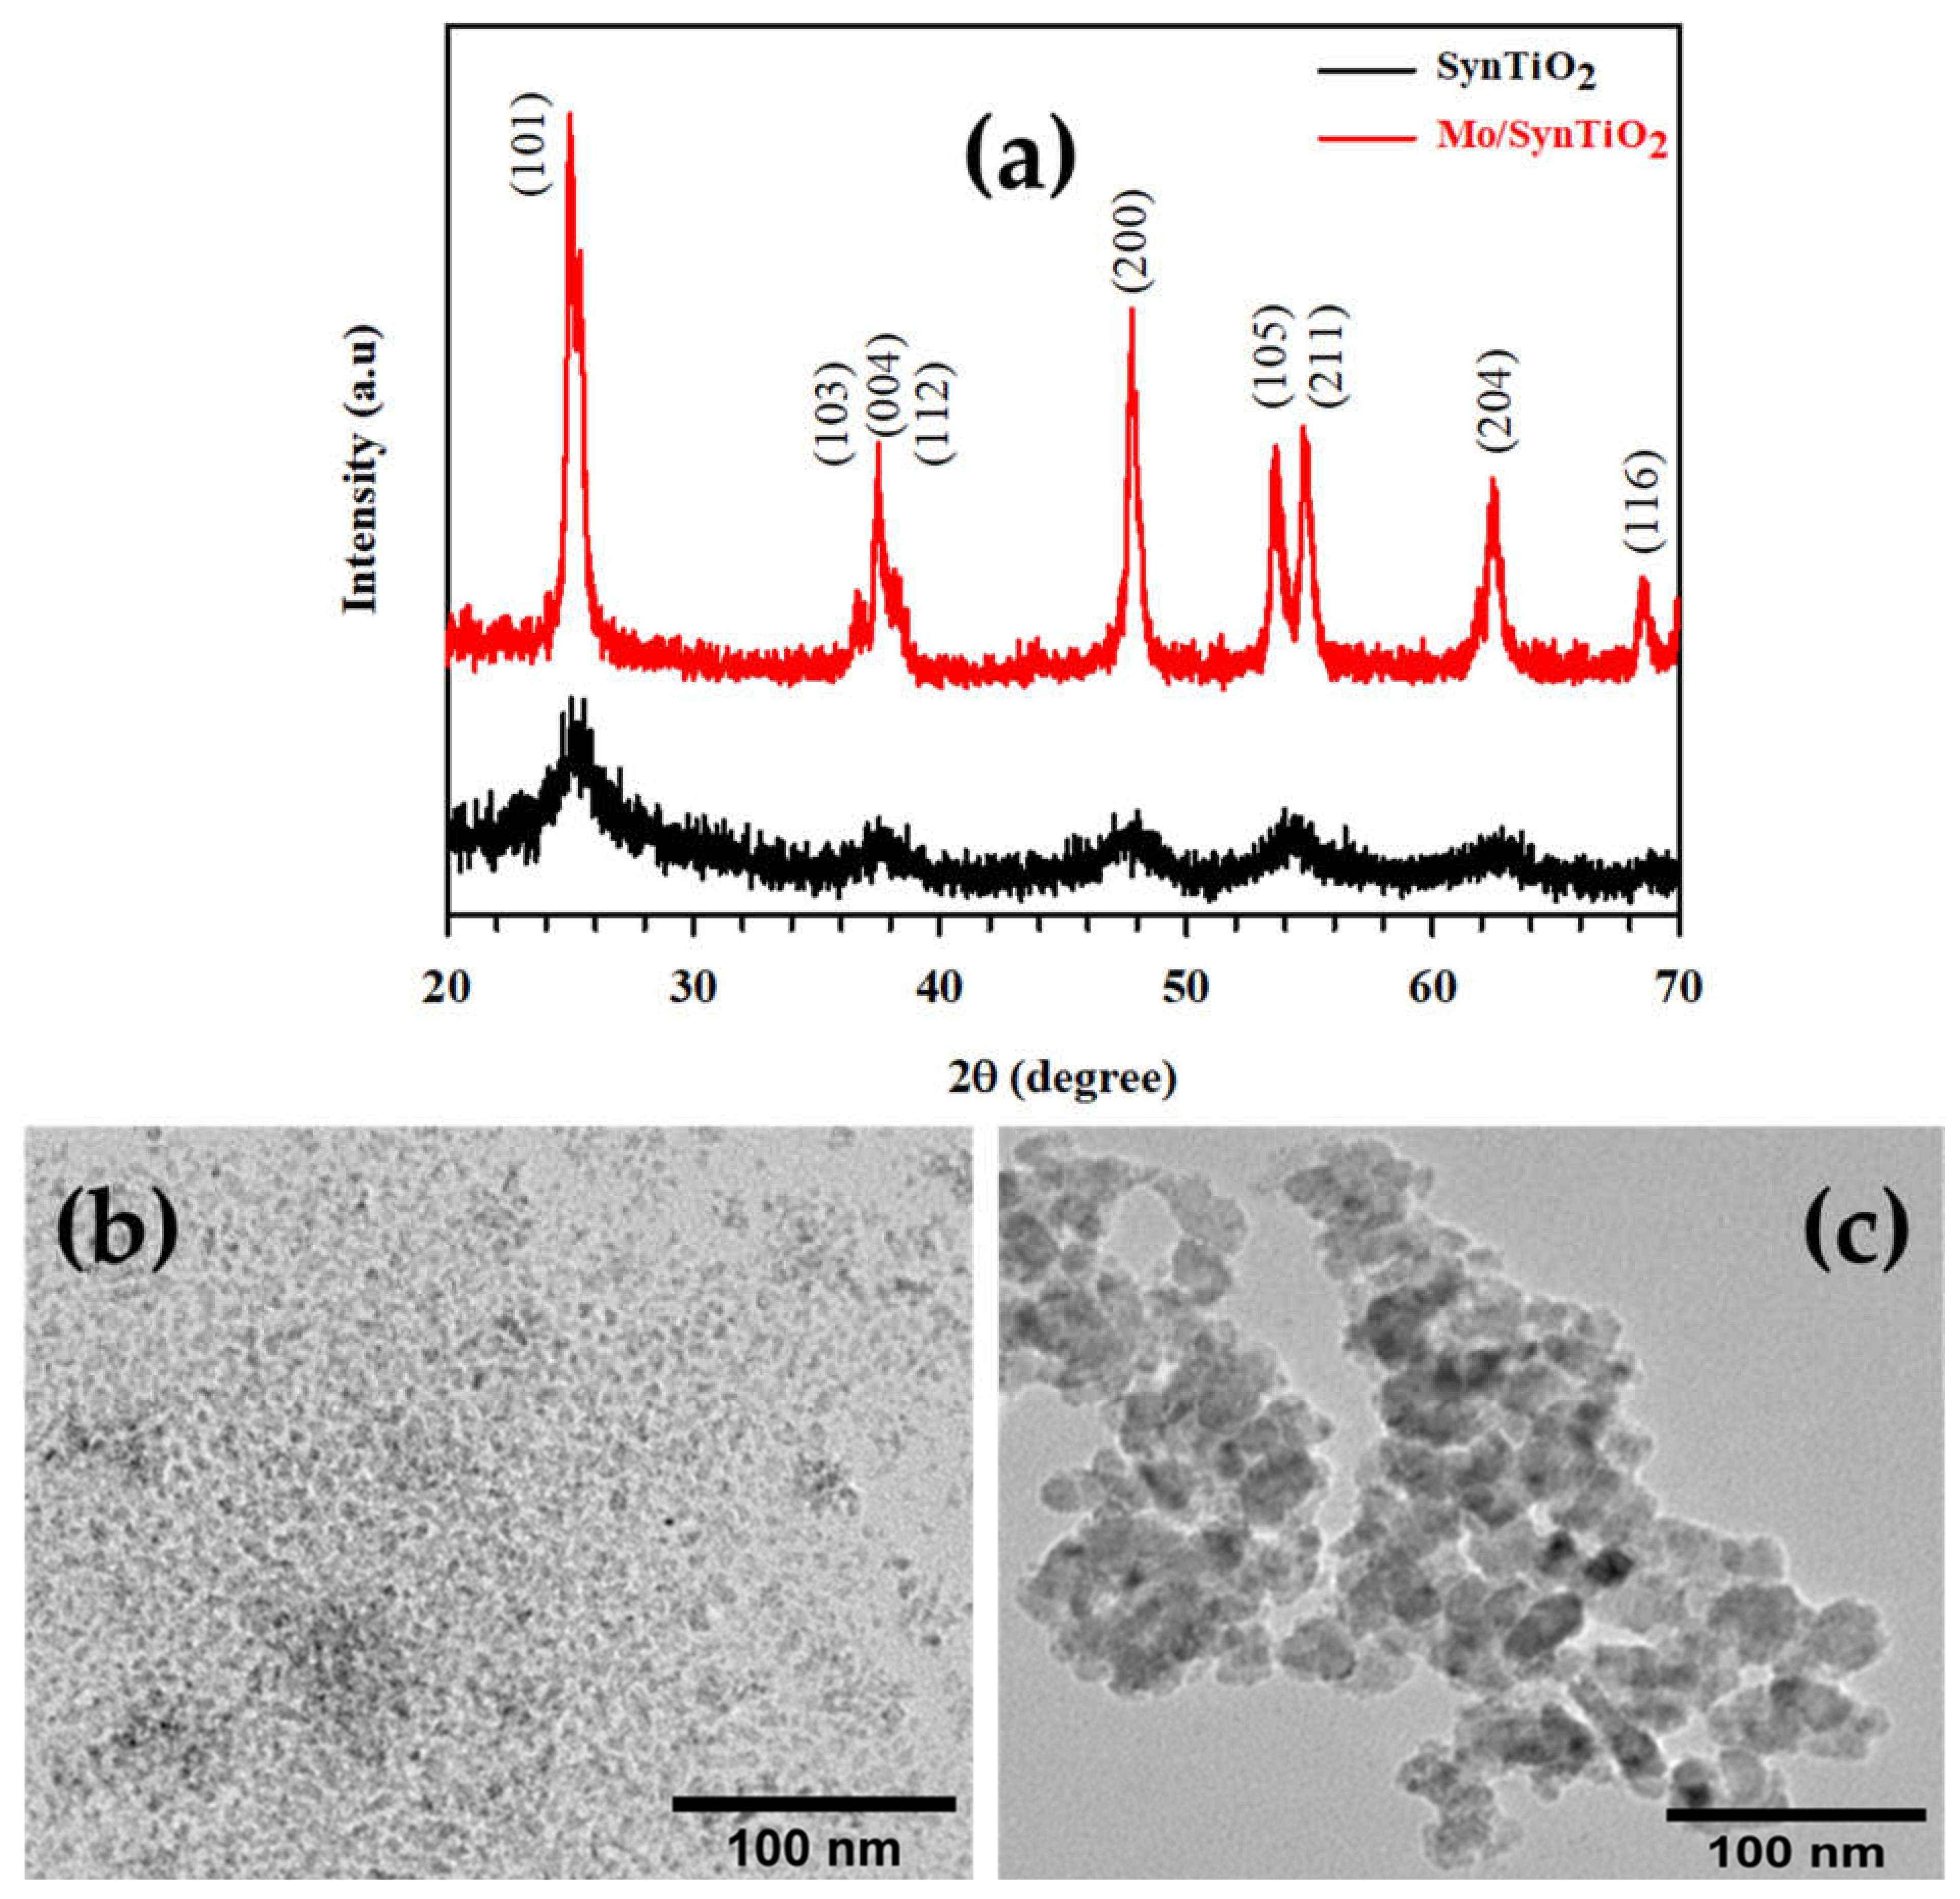
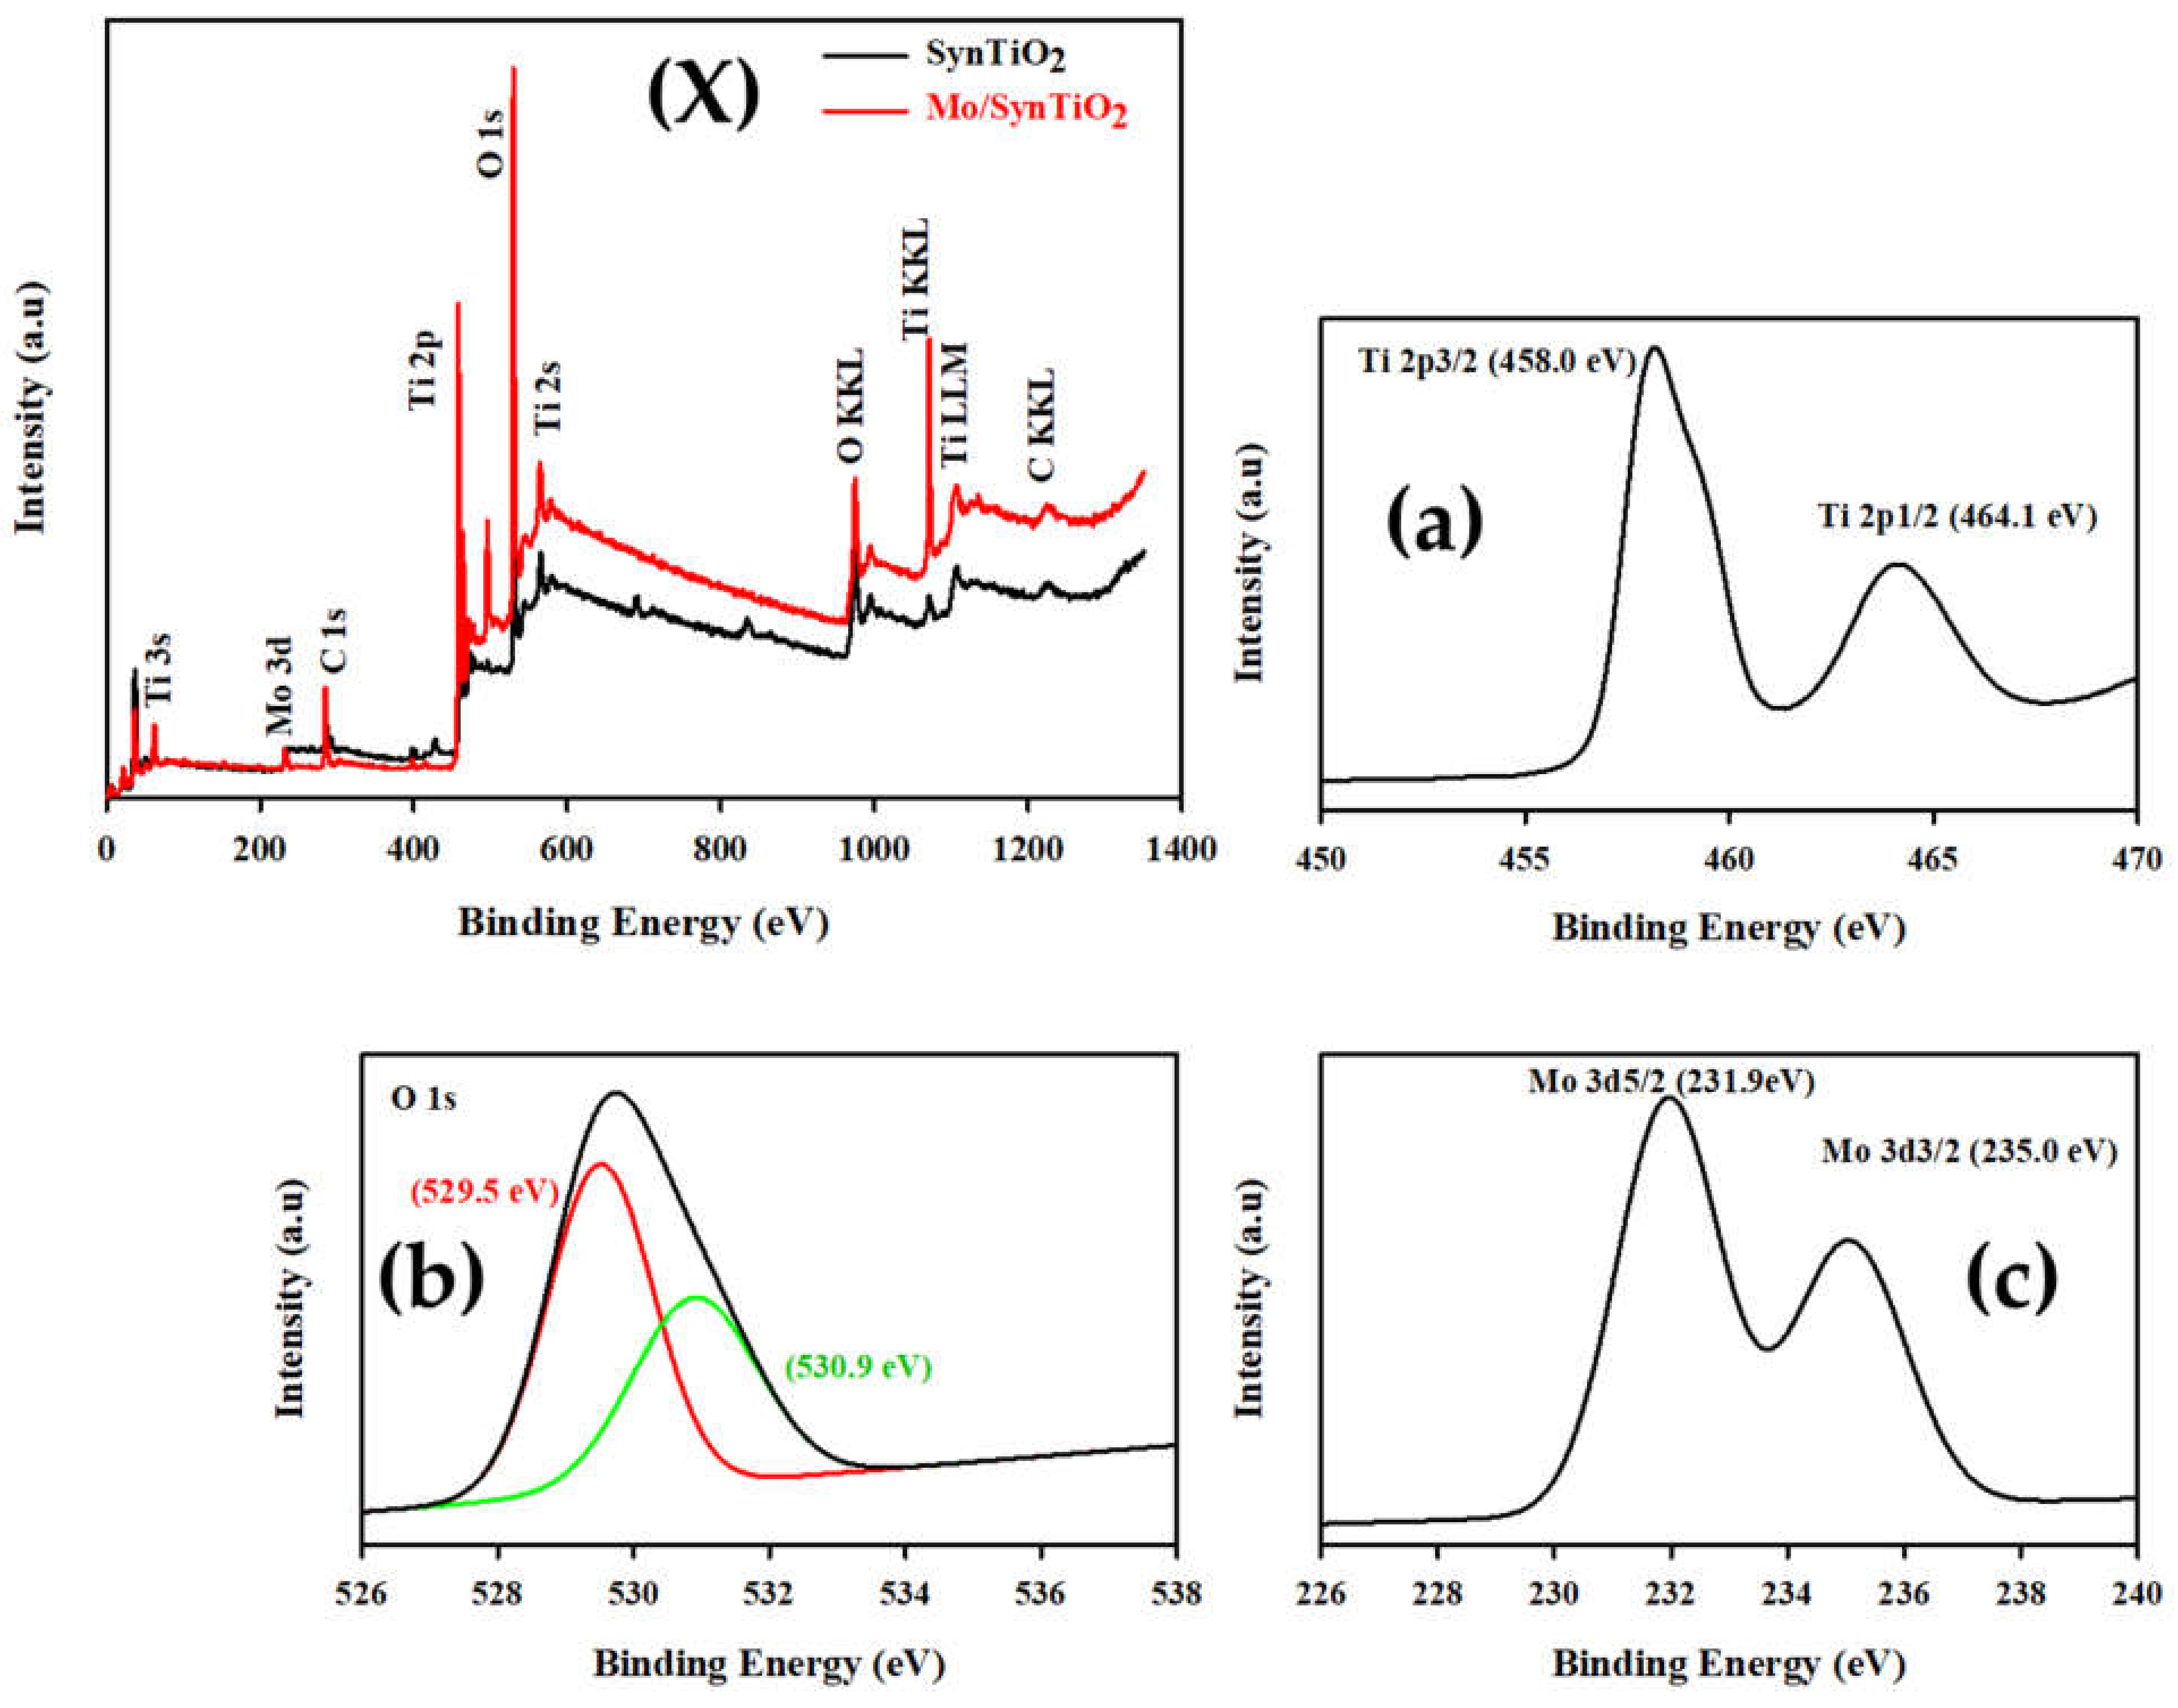
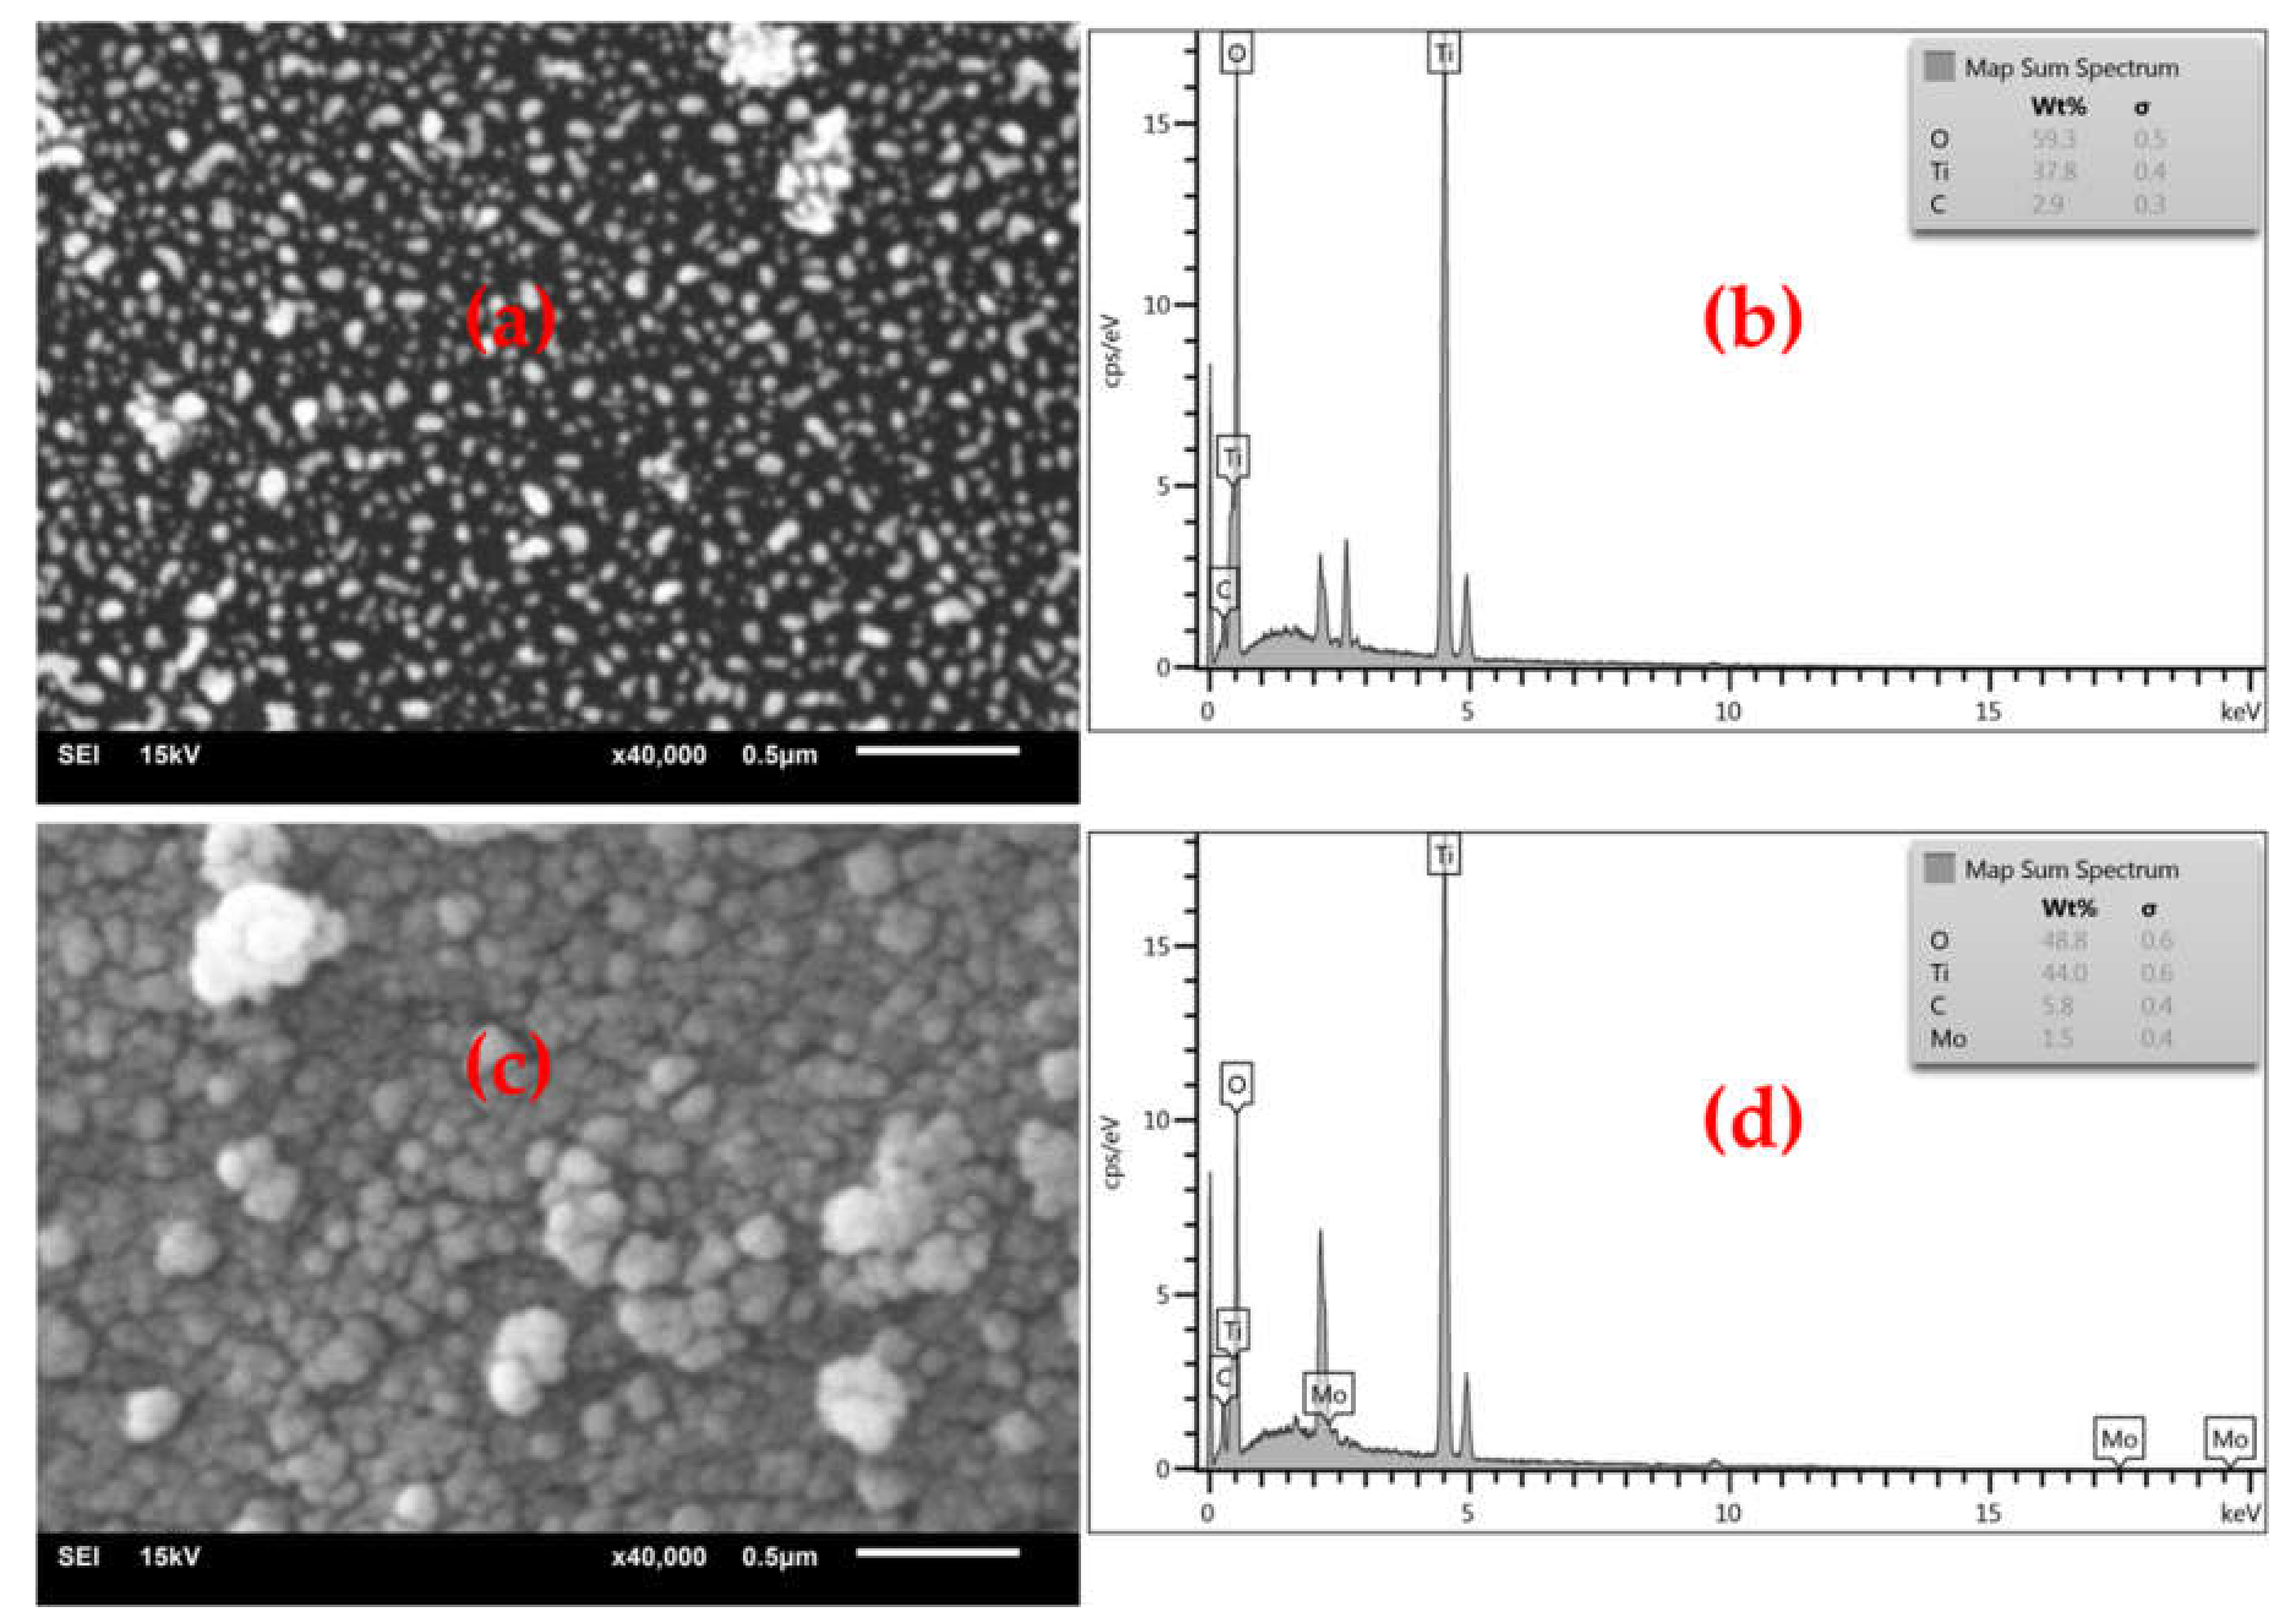
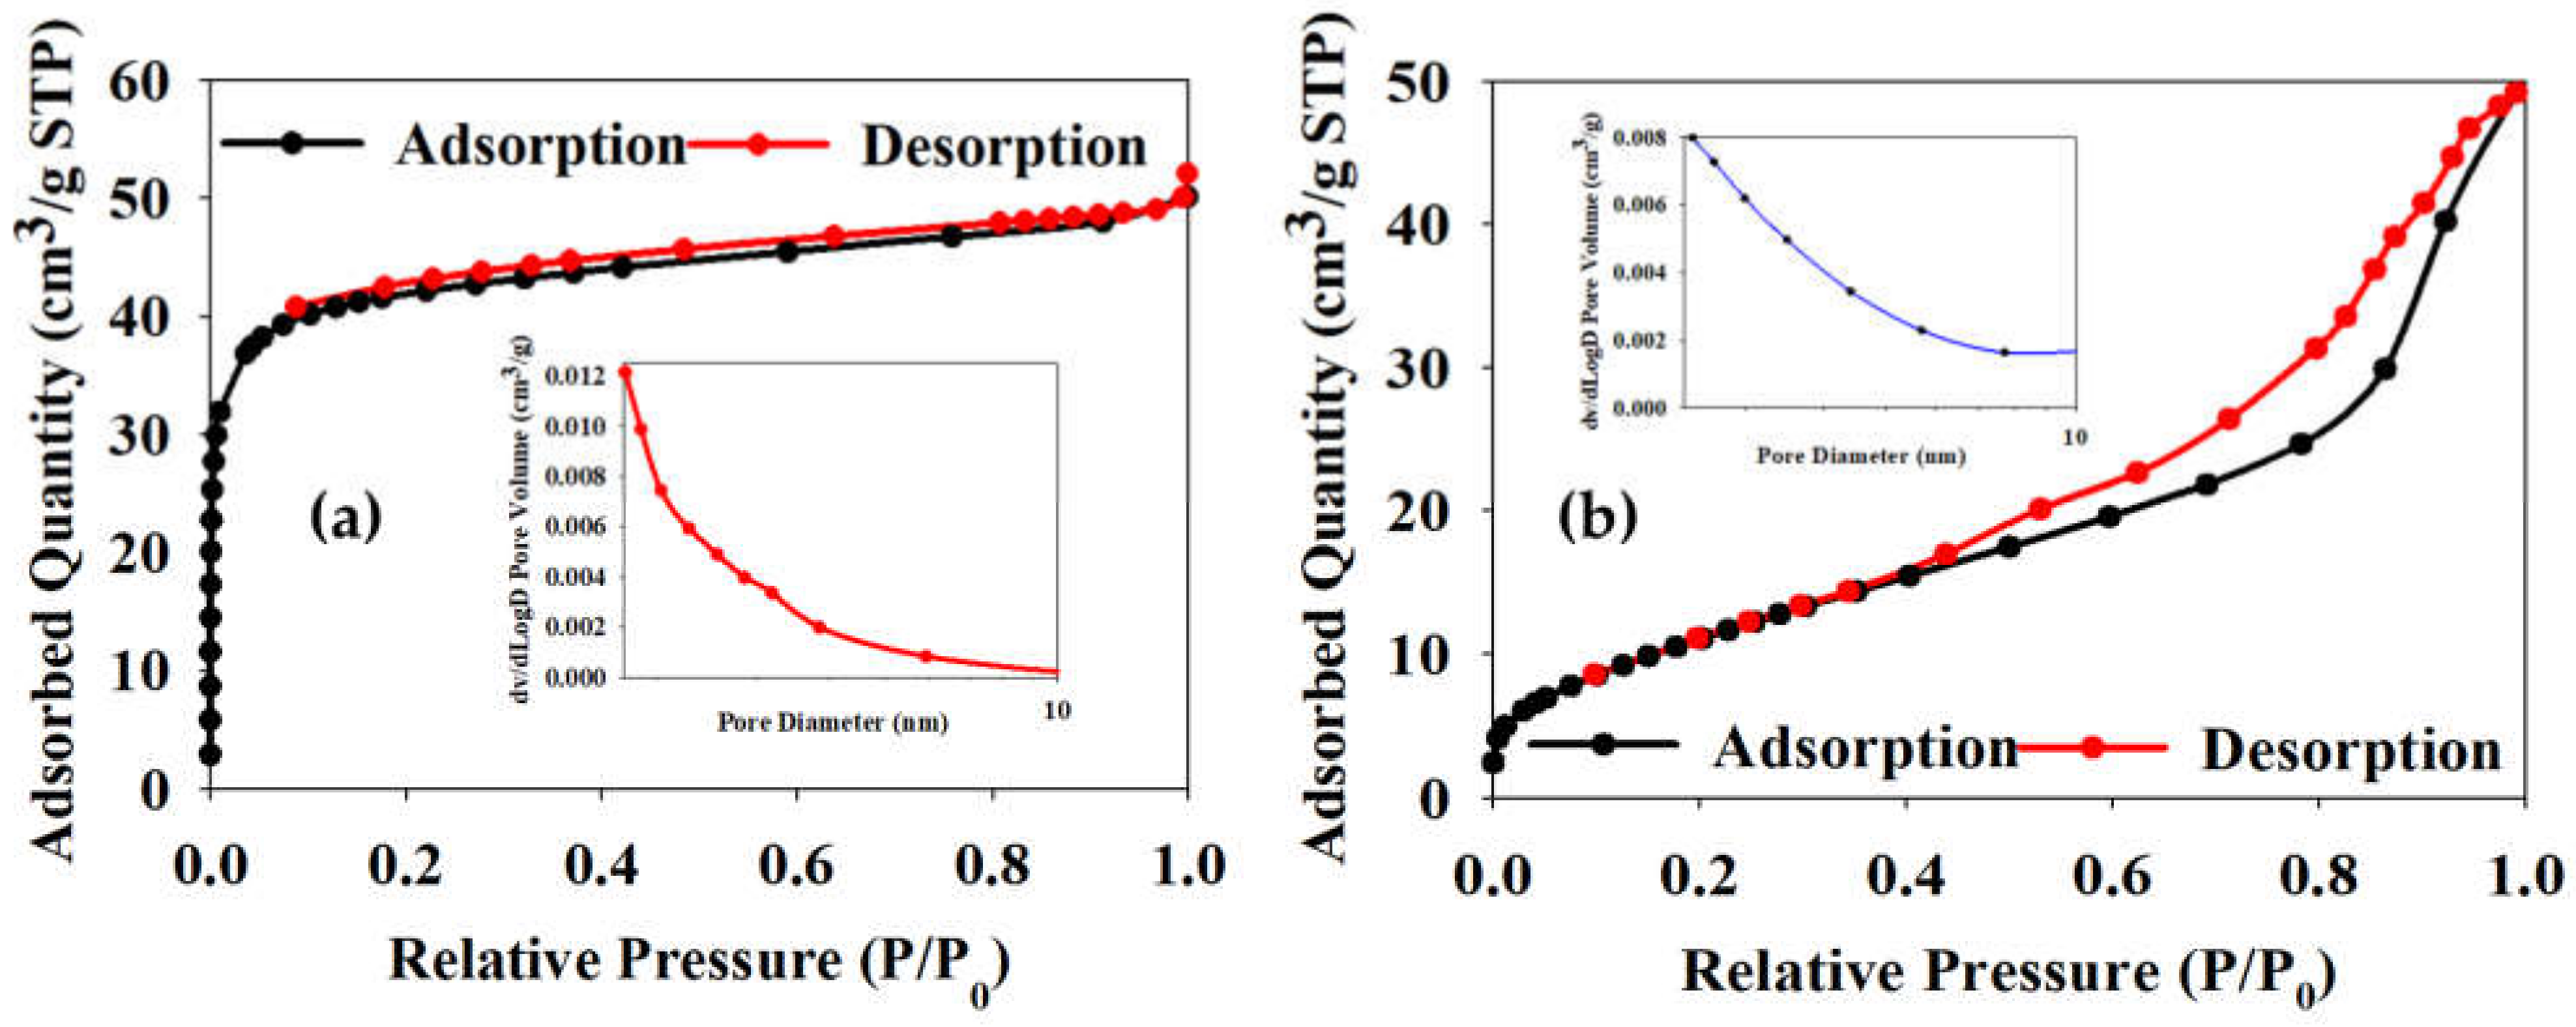
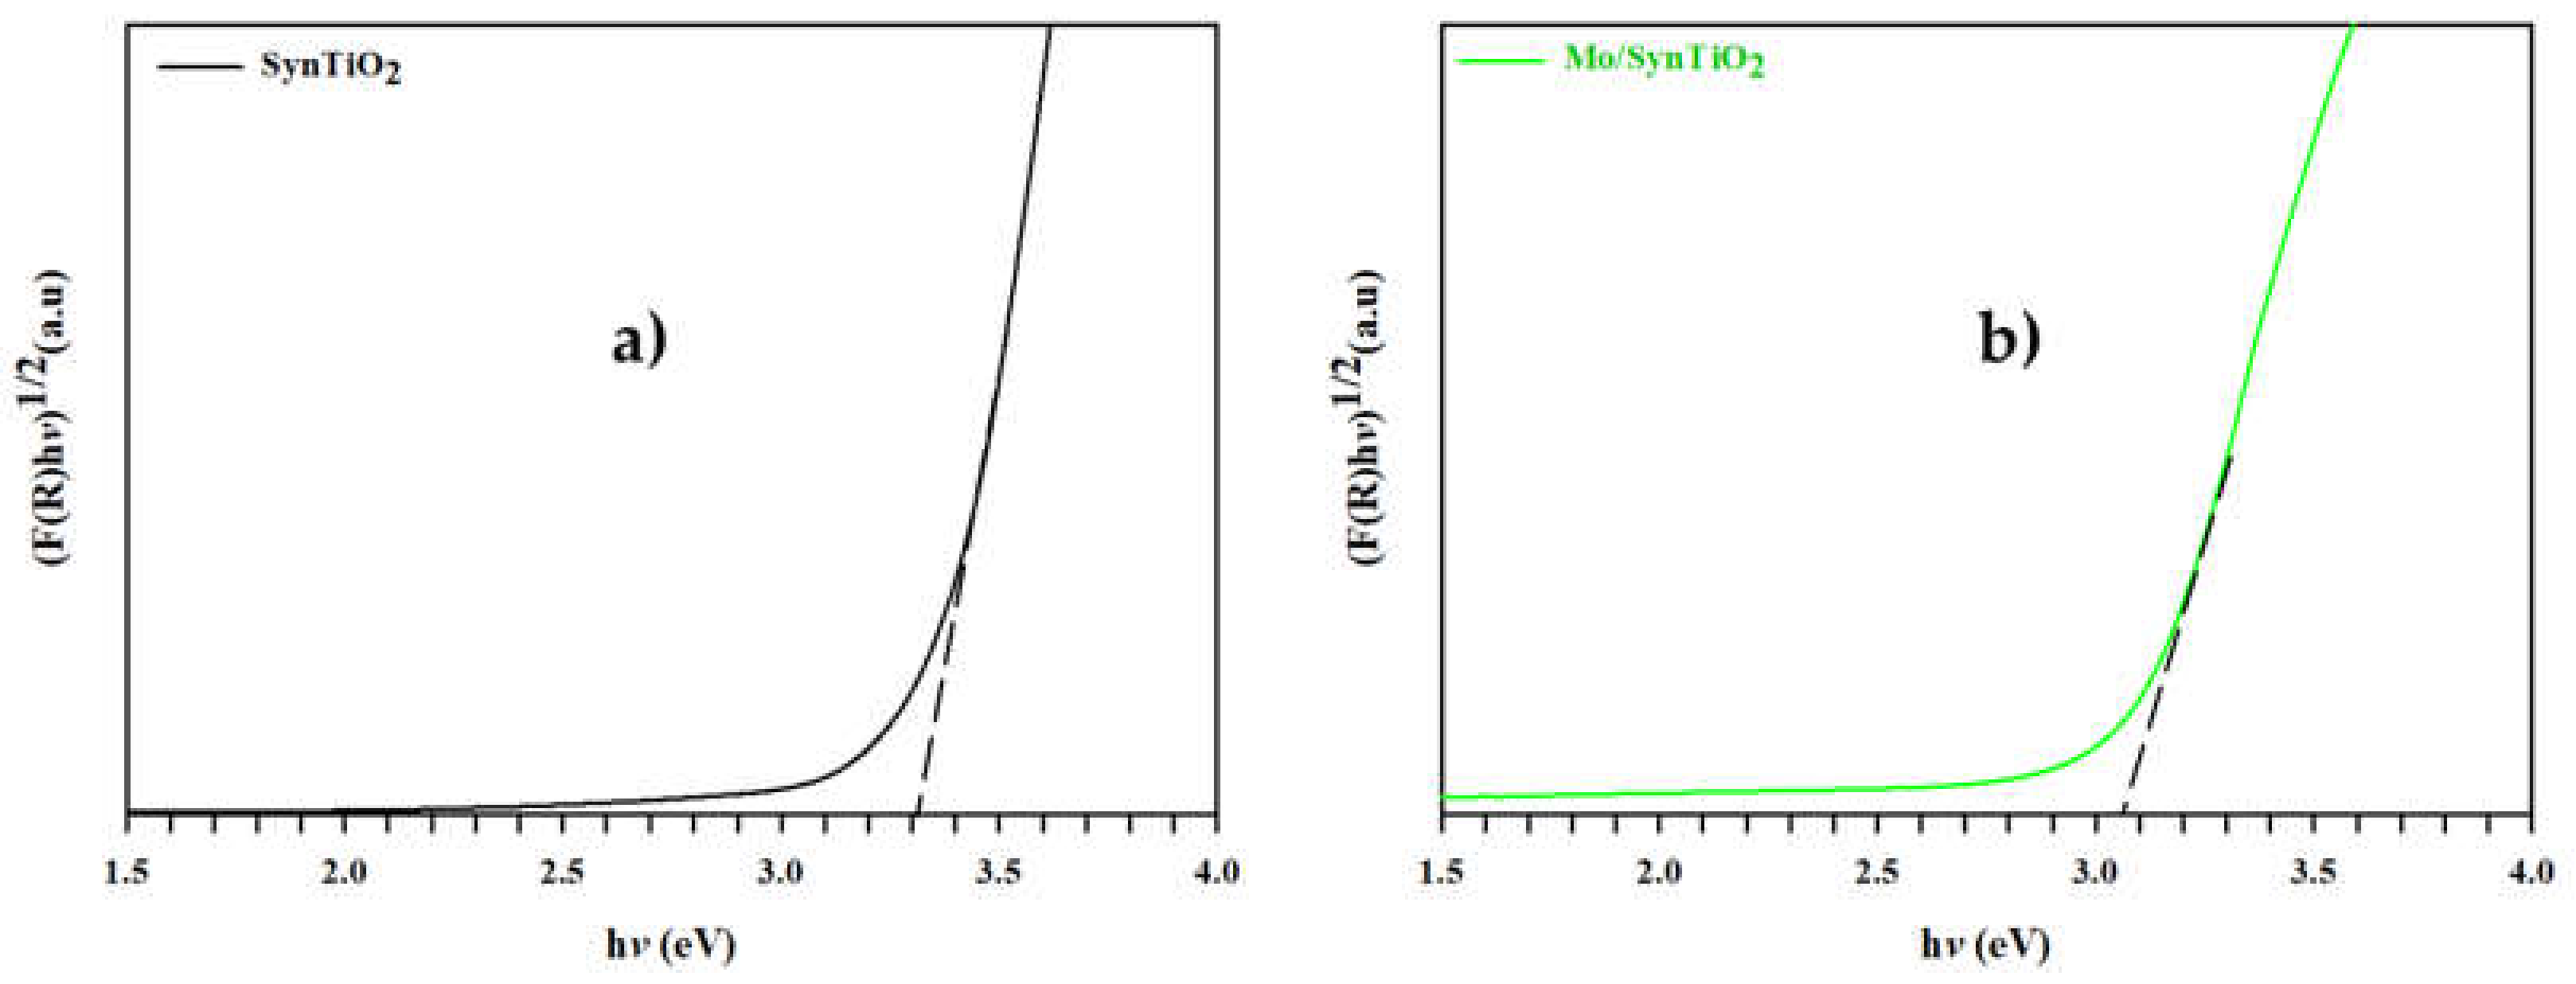
2.1. Characterization of Synthesized Materials

Characterization of Mo/SynTiO2 and SynTiO2

The crystal phase composition/crystallinity and average particle size of the materials, Mo/SynTiO2 and the unmodified SynTiO2, were respectively measured and analyzed by x-ray diffraction (XRD) and transmission electron microscope (TEM) measurements. As expected, identified crystal phase structures known for pristine TiO2 material were similar and matched in both sample materials (Figure 1a) [58,59,60,61]. Mixed anatase and rutile pristine TiO2 peak phases of {101}, {103}, {004}, {112}, {200}, {105}, {211}, {204}, and {116} corresponding to respective angle reflections of 2θ = 25.39°, 36.9°, 37.79°, 38.57°, 48.07°, 53.89°, 55.07 °, 62.69°, and 68.76°, and indexed according to JCPDS card # 01-071-168 were identified and corresponded in both the unmodified and modified samples. The peak prominence of the unmodified SynTiO2 material sample was not sharply intense due to the adopted low temperature for the sol–gel synthesis, as well as the moderate heat treatment at 80 °C and calcination temperature of 450 °C (Figure 1a) [62,63]. However, the identified sample materials’ peak phases and their positions agreed with the reported literature data, while the addition of Mo to the base SynTiO2 reflected improved sample material peak intensity and stability of Mo/SynTiO2 (Figure 1a) [63,64,65,66,67]. The prominence of the {101} crystal phase at 2θ = 25.39° (Figure 1a) is an indication of the ordered crystalline structure of the Mo/SynTiO2 and can further be confirmed through the estimated crystallite sizes of the materials according to the Deybe–Scherrer function in Equation (1) [15,17,18]. Where λ = 1.54059 Å is the wavelength of the CuKα source, β is the integral breadth of XRD peaks depending on the width of the particular hkl plane obtained at full width at half height maximum (FWHM) in degrees, θ = diffraction angle obtained from XRD data of the most intense reflected phase, and K as the shape factor constant with an assigned value of 0.9.
D hkl = K λ β hkl   cos θ
The estimated crystallite sizes of the materials, according to Equation (1), were 14.24 nm for the unmodified SynTiO2 and 16.1 nm for the modified Mo/HRTiO2 sample material (Table 1). The presence of the Mo dopant on the SynTiO2 brought about the improved crystallite size of the modified material over the unmodified one. This can further be confirmed from Figure 1a, where the crystal peak phases in the modified material sample and more specifically the {101} phase exhibited a narrower, intense, and sharper peak in comparison to the unmodified material sample peak phases. In all, the presence and recognition of the pristine TiO2 affiliated peak phases in Mo/SynTiO2 material confirms the fact that despite the Mo addition to the SynTiO2, the pristine base TiO2 state did not alter.
The respective TEM images in Figure 1b,c show finely divided and sparsely distributed nanoparticles of SynTiO2, while aggregated clustered particle lumps with a larger size in comparison to the unmodified SynTiO2 are seen in the Mo/SynTiO2 material and attributed to the Mo addition to SynTiO2 [15,41,68,69]. The estimated particle size value of 24.55 nm for the Mo doped SynTiO2 sample in comparison to 16.02 nm for the unmodified SynTiO2 sample shows an appreciation and agreed with obtained average crystalline sizes of the material samples from the XRD measurement (Table 1).
The bonding interactions in the synthesized sample materials were measured and analyzed by Fourier transform infrared (FTIR) spectroscopy. As can be seen from Figure 2, the functional group signatures in the unmodified SynTiO2 sample material and its Mo doped form are identical and agree with the already-reported bond functionalities of pristine TiO2. Bond signals at 581.08 cm¹ and 751.07 cm¹ are representatives of Ti-O stretching and Ti-O-Ti network linkages, respectively [15,16,17], while 958.93 cm¹ and 1084.64 cm¹ are absorption bond signals for Ti-OH vibrations assigned to carbonates or carboxylic acid (C=O) stretching mode and/or C=C stretching due to the presence of unsaturated compounds (Figure 2) [15,16,41]. The bond signal at around 1600 cm¹ is an attribute of the bending and stretching hydrogen bond of the surface adsorbed water (H-O-H) molecule [14,15,17,41]. The vibrational signal around 2195.59 cm¹ originated from the -CH2 functional group (Figure 2) [14]. The signal at around 3100 cm¹ in the unmodified SynTiO2 and that of the extended stretching bond signal in the modified Mo/SynTiO2 up to around 3485 cm¹ are respective attributes of the -CH vibrational bond and broader stretching signal for the -OH functional group of surface adsorbed water molecule [14,15,16,17,41]. The added Mo dopant in the modified Mo/SynTiO2 material is confirmed by the overlapping 958.93 cm¹ and around 2958.75 cm¹ extended stretching bond signals for the respective symmetric and asymmetric stretching vibrations of cis MoO2 entities (Figure 2) [61,62,63,64,65,66,67,68,69,70]. Besides, the respective 1600 cm¹, and 3100 cm¹ bond signals curve shift in appearance from a more defined vibrational mode in the unmodified SynTiO2 to a more extended stretching mode in the modified Mo/SynTiO2 indicates the affinity of the added Mo dopant to surface adsorbed water molecules of the modified sample material as part of the surface modification outcome effect (Figure 2).
The binding interactions and oxidation states of the chemical contents in the synthesized sample materials were elucidated by x-ray photoelectron spectroscopy (XPS). As expected, the constituent elemental compositions of the materials revealed the same element components of Ti and O in the unmodified SynTiO2 sample, while Mo, in addition to the Ti and O atoms, was identified in the Mo/SynTiO2 modified sample (Figure 3X). The presence of core C 1s in the spectrum at ~285 eV has been reported and attributed to adventitious carbon with possible affiliation to C-H and/or C-C, C=C, C-O-H, C=O bond functionalities (Figure 3X) [15,18,64,71]. Figure 3a–c display the XPS spectral images showing the elemental compositional peaks of the Mo/SynTiO2 material. The 2p energy level distinguished, as expected, Ti 2p3/2 and Ti 2p1/2 at respective binding energies of 458 eV and 464. 1 eV (Figure 3a). These binding energies agree with reported literature data, confirming the presence of the Ti4+ state in the material sample. The non-significant shift to high BE of the Ti 2p degenerate energy levels conform to what has already been reported of their respective data values concerning the unmodified base TiO2 Ti 2p energy degenerates [15,16,41,67]. This further confirms the non-alteration in the state of the pristine SynTiO2 material after Mo addition. The O 1s were resolved at binding energies of 529.5 eV and 530.9 eV (Figure 3b). The respective O 1s subcomponent peaks belonging to the Ti-O bond and the surface hydroxyl (-OH) group were enhanced by the addition of the Mo dopant onto the surface of the SynTiO2 base material (Figure 3b) [14,15,17,18,41,67,70,71]. Resolved peaks at binding energies of 231.9 eV and 235 eV were respectively credited to Mo 3d5/2 and Mo 3d3/2 of Mo6+ and Mo5+ oxidation states and have been reported (Figure 4c) [41,67,70]. The surface anchored Mo dopant by its promotional redox effect in the photogeneration of hydroxyl radical (OH) via surface adsorbed hydroxyl (-OH) group supports the observed subcomponent resolved peaks at the reported binding energies of the make-up contents in the Mo/SynTiO2 sample material [11,63,68,69,72,73]. As such, the enhanced photocatalytic activity outcome of the modified Mo/SynTiO2 material is suggested to have been facilitated amongst other factors, like surface modification defect promotional effects, and also by restrained electron–hole recombination process and subsequent charge carrier lifetime prolongation.
The structural morphology of the unmodified SynTiO2 and the modified Mo/SynTiO2 were investigated by scanning electron microscopy (SEM) measurement coupled to energy dispersive spectroscopy (EDS) for the atomic element compositional analysis measurement. As can be seen from the SEM images, SynTiO2 showed a galactical morphological outlook of small densely populated spherical particles (Figure 4a). Upon the addition of Mo on SynTiO2, it can be seen that the distinct spherical particles of SynTiO2 aggregated and formed larger lumps in the resultant Mo/SynTiO2 sample material (Figure 4c) [62,67]. The Mo/SynTiO2 displayed a more aggregated lump structure with some prominence of swollen surface edges (Figure 4c) [62,67]. The accompanied EDS maps revealed the elemental contents in the synthesized sample materials (Figure 4b,d). Here, Ti and O atoms as the main elemental composition of SynTiO2 were revealed, while in addition to O and Ti, Mo was on display upon the realization of the Mo/SynTiO2, indicating the successful decoration of SynTiO2 with Mo atom modifier (Figure 4b,d). Presence of C in the samples is of adventitious origin (Figure 4b,d) [17].
The surface area and the pore size distribution analysis of the synthesized material samples were obtained from the N2 adsorption–desorption Brunauer–Emmett–Teller (BET) isotherm curve measurement at 77 K and Barett, Joyner, and Halenda (BJH) application methods, respectively [63]. As shown in Figure 5a, the observed isotherm curve of the unmodified SynTiO2 material exhibited a Type-Ib kind of isotherm curve of a continuous N2 adsorption uptake with pressure increment and the development of a very narrow hysteresis loop at high-end relative pressure (P/P0) ratio [74]. Upon the modification of the SynTiO2 with Mo, a transformation can be seen of the exhibited Type-Ib isotherm curve of SynTiO2 into Type-IV isotherm curve of the Mo/SynTiO2 sample material with a better developed H3 hysteresis loop due to the interlocking of the adsorption and desorption isotherm branches at about 0.4 relative pressure value (Figure 5b) [41,74]. This indicates that the introduction of the Mo dopant onto the SynTiO2 material led to the exhibition of an isotherm curve with a classified and defined characteristic structural adsorption–desorption phenomenon (Figure 5b). The BET surface area of the unmodified SynTiO2 material was 133.87 m2/g in comparison to 43.3 m2/g for the modified Mo/SynTiO2 sample material (Table 1). While pore volume for SynTiO2 and Mo/SynTiO2 did not differ significantly with values at 0.08 cm3/g and 0.07 cm3/g, respectively, the pore size of SynTiO2 was 2.32 nm and appreciated to 6.23 nm for the Mo/SynTiO2 upon modification (Table 1). Though there was no significant change in pore volume–outcome, the reduction in the surface area of the modified Mo/SynTiO2 sample material in comparison to the unmodified SynTiO2 is attributed to the surface addition of the Mo dopants onto the SynTiO2, resulting in a proportional increase in surface population density with a consequent reduction in the specific surface area [66]. The BJH particle size distribution (PSD) of the sample materials were present in a seemingly not outrightly defined modal confined pattern (Figure 5a,b (inset)). Evidently, this outcome is supported by the BET isotherm curve of SynTiO2 with a show of almost complete absence of hysteresis loop, indicating the microporous nature of the material (Figure 5a) [71,74]. However, with an improved H3 hysteresis upon the addition of Mo onto the SynTiO2, a contrast outcome in PSD with a wider spread and extended pore channel without confinement in the Mo/SynTiO2 sample material can be observed (Figure 5b (inset). This is attributed to the reported compact surface accompanied surface area fluctuation upon the addition of Mo for the modification of SynTiO2 material [67]. The addition of Mo to SynTiO2 led to a blockage or decrease in microporous network of Mo/SynTiO2 material and can also be confirmed from TEM particle size as the material agglomerated more.
The energy bandgap (Eg) of the sample materials was estimated from their optical property analysis with data obtained from UV-Visible/Diffuse Reflectance Spectroscopy (UV-Vis/DRS) measurement. Energy bandgap (Eg) plot estimates of the unmodified SynTiO2 and modified Mo/SynTiO2 are displayed in Figure 6.
The Kubelka–Munk function, according to Equation (2) [14,15,17,18], was used to obtain the Tauc’s plot generated from a transformed reflectance spectra into absorption spectra data for the derivation of the Eg of the material samples.
F R = S ( 1 R ) n 2 R
where F(R), R, and S are absorbance, reflectivity, and scattering factor, respectively. The S factor was assumed to be a unit as the employed material is in powder form, while n = ½ for indirect bandgap semiconductor materials energy transition was adopted. Figure 6 shows the Tauc’s plot of hν Vs [F(R)hν)]½ with linear part extrapolation to the point where the [F(R)hν)]½ axis is equal to zero. The estimated Eg value of SynTiO2 and Mo/SynTiO2 materials were obtained as 3.30 eV and 3.05 eV, respectively (Figure 6a,b, Table 1). There was no significant difference seen of the Eg value estimates between the unmodified SynTiO2 and modified Mo/SynTiO2 materials. As much as the shift in the Eg of the modified Mo/SynTiO2 did not make a significant difference, the little observed can be attributed to the likelihood of lattice entry of some of the (1.5 wt%) Mo dopant into the TiO2 lattice network structure. This is a result of the preparation/synthesis protocol route of both the base material and the dopant itself seen contributing to the reductive effect in the Eg value of the modified material sample (Figure 6b). Above all, co-operative interactive effect during material synthesis that would have resulted in a much larger shift to low Eg value of the modified Mo/SynTiO2 is absent, partially due to effect of excess amount 1.5 wt% Mo dopant addition to SynTiO2 base material and the sonochemical Mo surface anchorage rather than invasive interstitial doping protocol [41,42,43,44,45].
Table 1 gives, in summary, the data estimate and/or measurement of the characterized properties of the SynTiO2 and Mo/SynTiO2 material samples.
Data analysis outcome of characterization measurement and estimation output of the prepared materials projected expected photocatalytic activity enhancement effect of the modified Mo/SynTiO2 material as not dependent on surface area increase (Table 1) [41,44]. On one hand, the enhancement effect of the photocatalyst material is suggested to have been due to some surface modification alterations (e.g., surface defects) inherent in the combined material synthesis protocols that enriched the catalyst material with surface reactive oxygen species (e.g., OH, O2, etc.) [75,76,77,78,79,80,81]. Facilitated photoinduction charge mechanism/photogeneration, including the photocatalytic promotional effect of efficient surface charge separation/transfer phenomenon, is also envisaged to be involved in the expected enhanced activity performance of the photocatalyst material. By virtue of the estimated optical energy bandgap reduction of 3.05 eV for the Mo/SynTiO2 material to that of 3.30 eV for the SynTiO2, this can be confirmed [15,65,82].

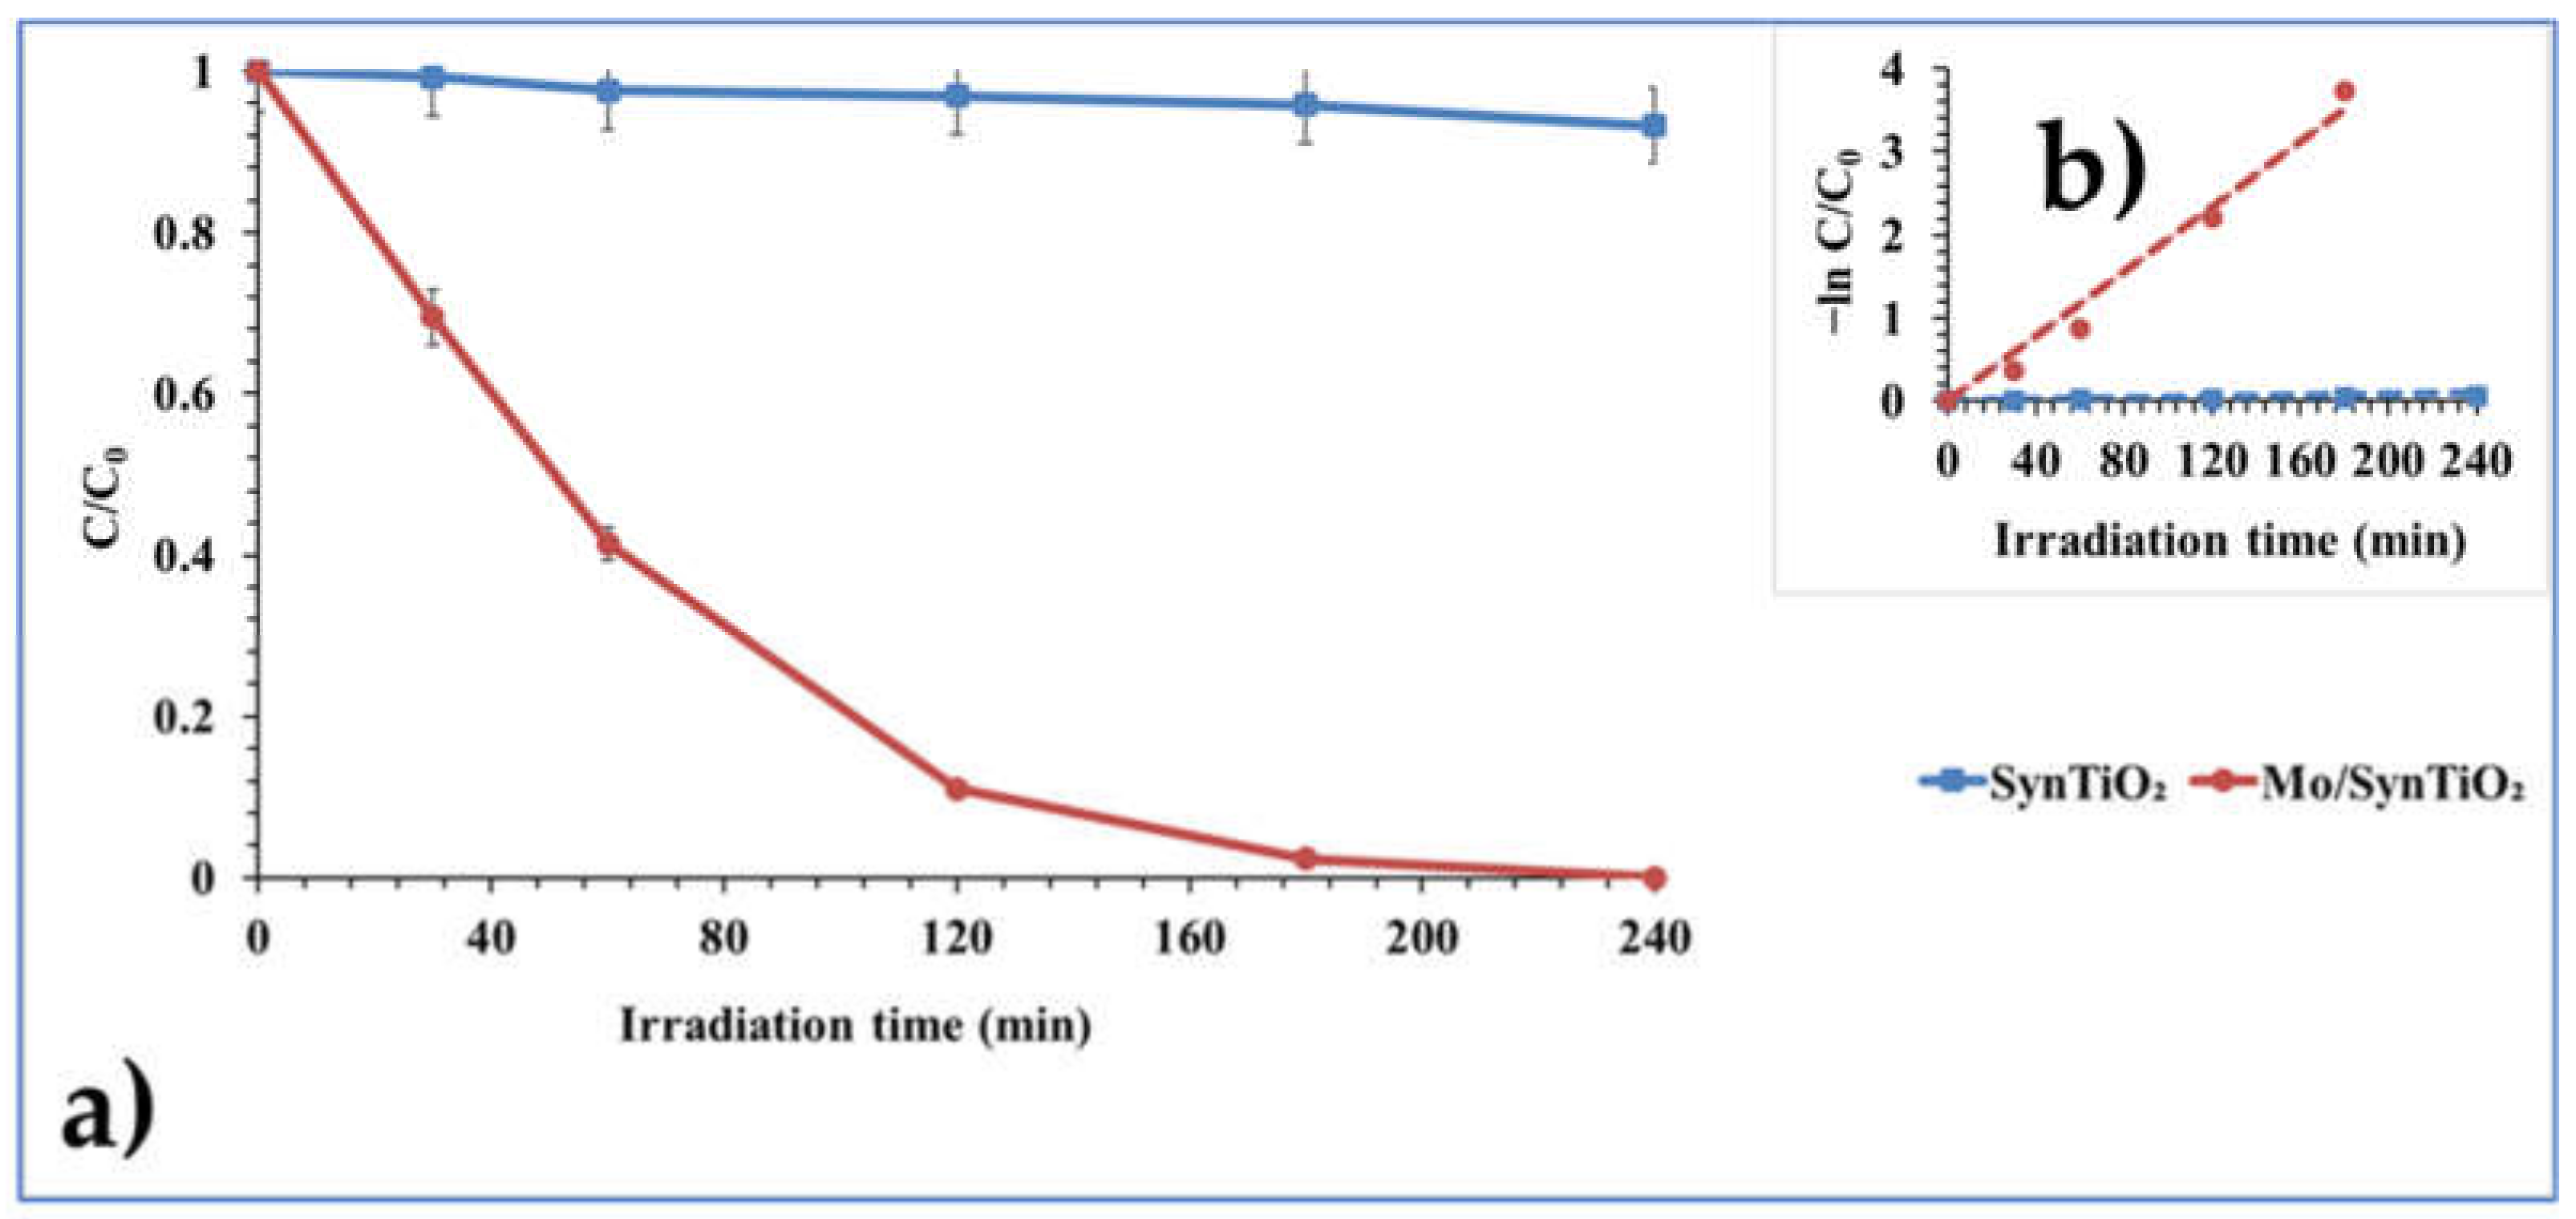
2.2. Photocatalyst Test Evaluation

On a preliminary basis, the characterized unmodified SynTiO2 and modified Mo/SynTiO2 materials were evaluated for their photocatalytic performance towards the degradation of carbamazepine (CBZ). After this time, other photocatalytic activity evaluation tests towards CBZ degradation were performed with the modified Mo/SynTiO2 material.
  • Physicochemical Properties of Carbamazepine (CBZ)
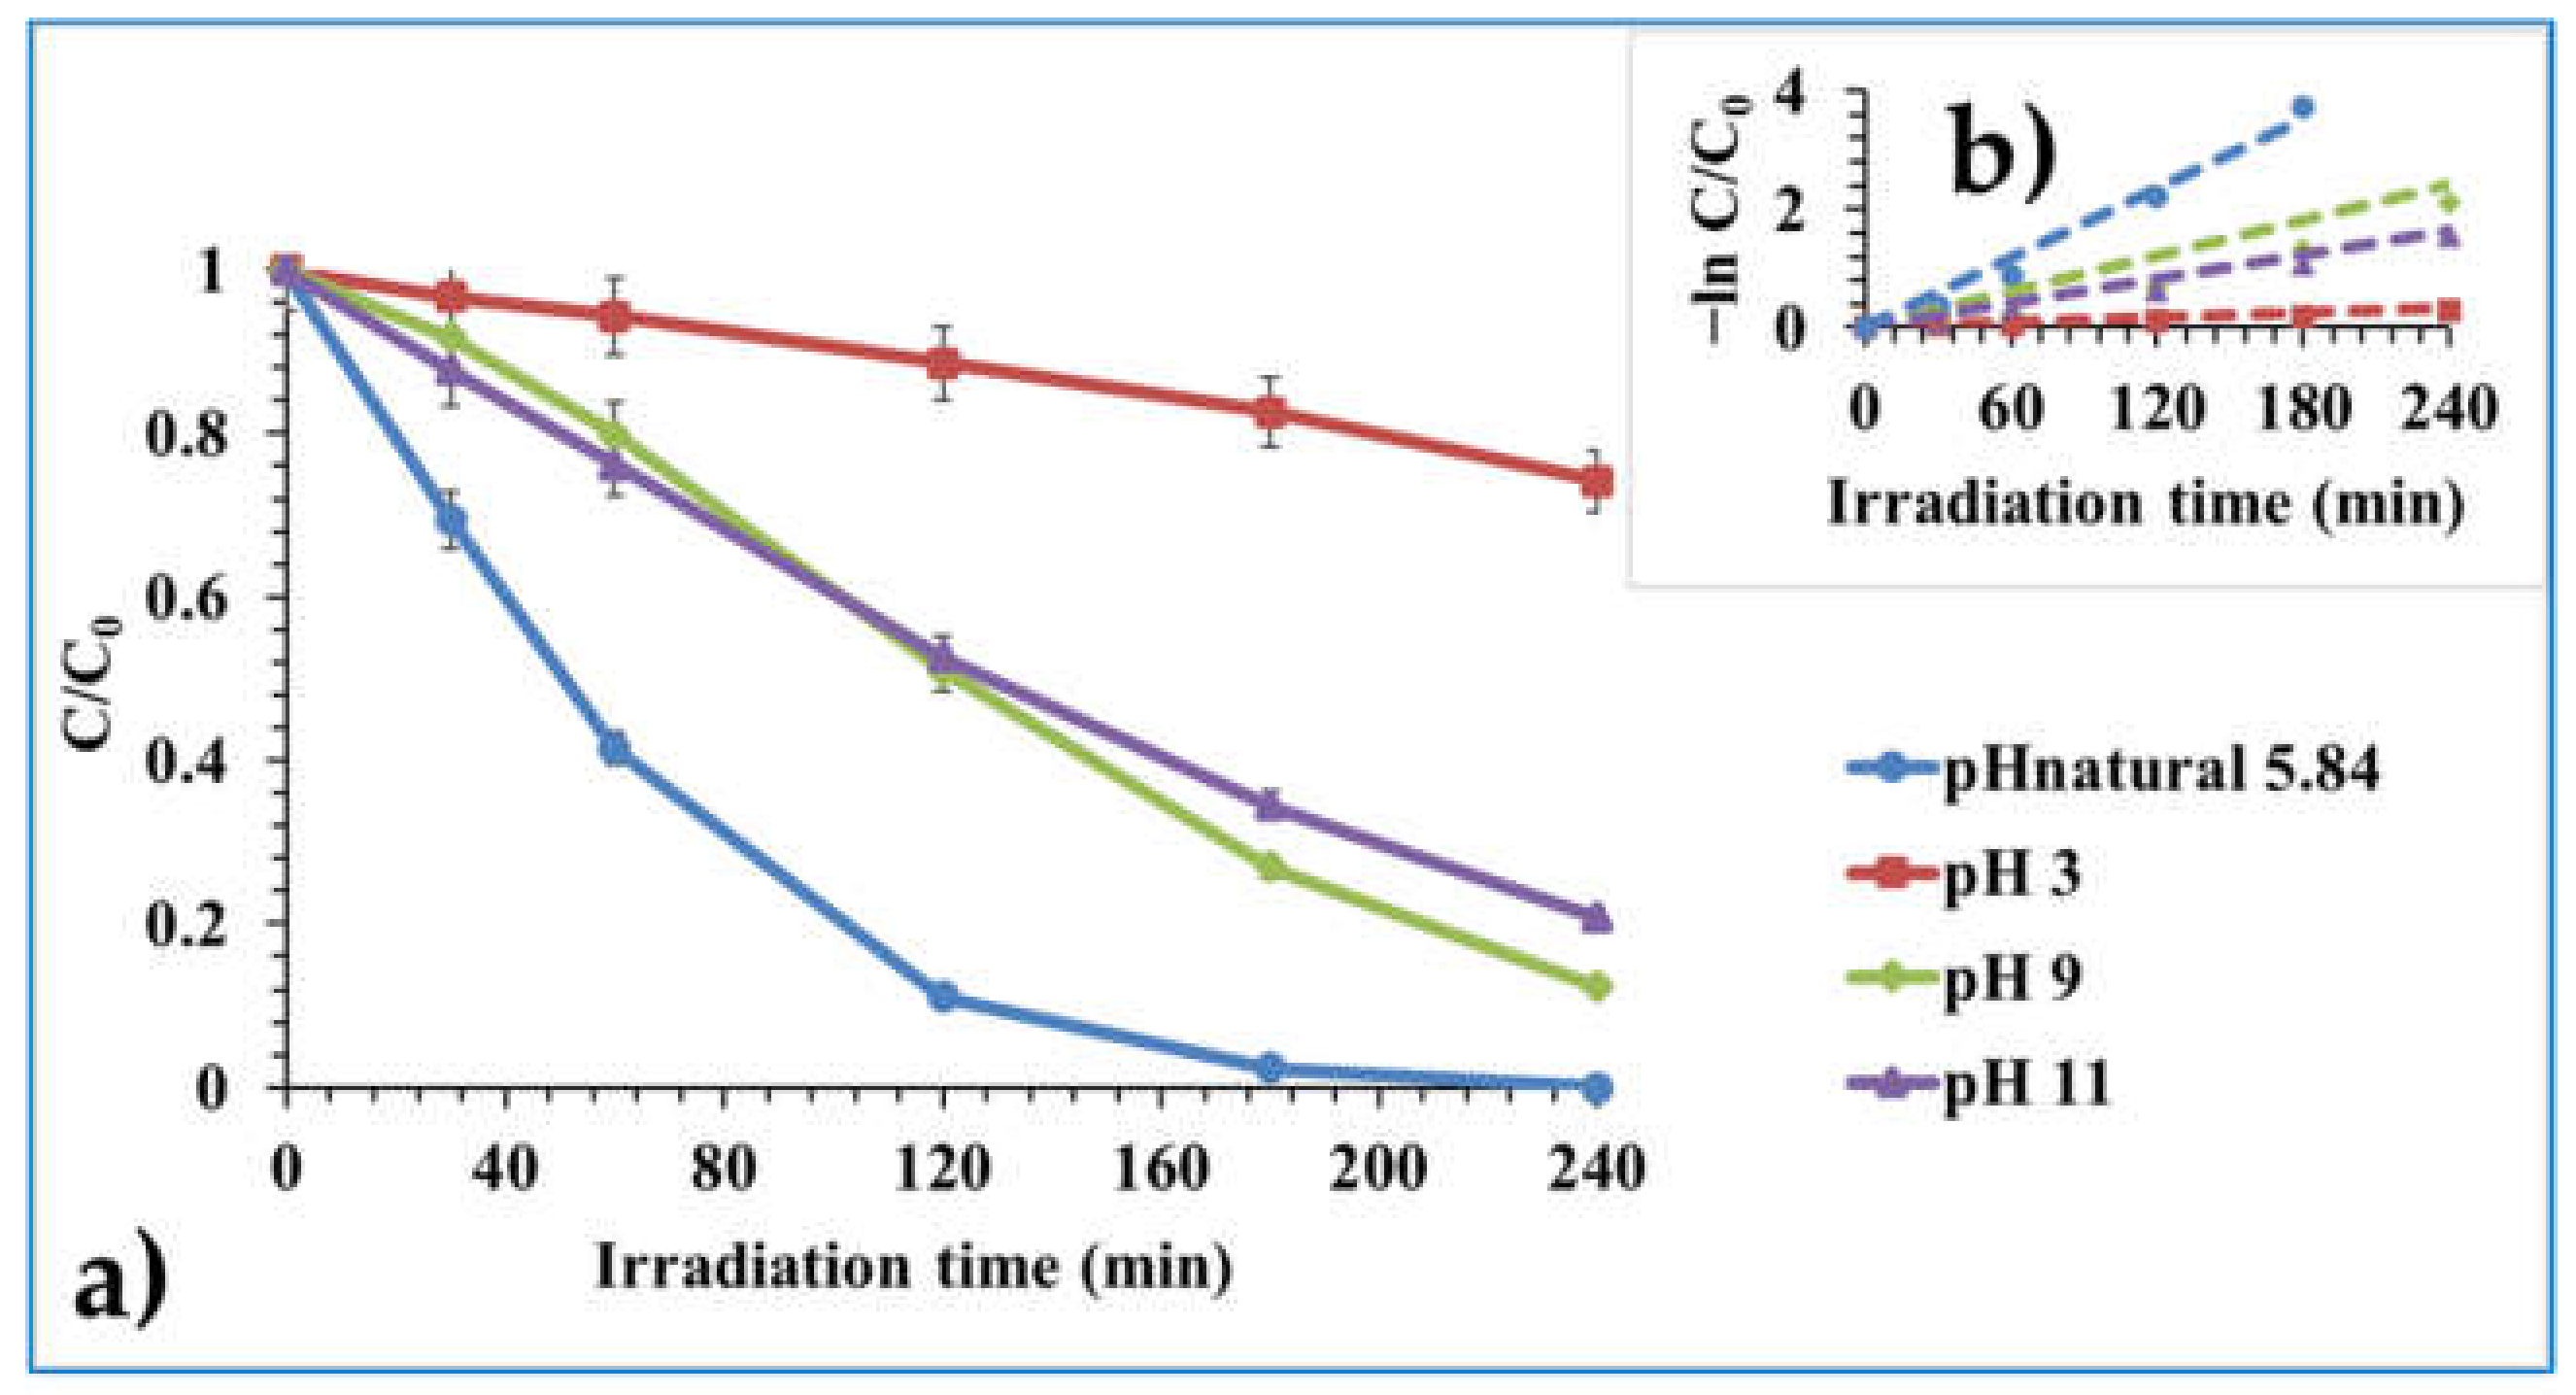
Carbamazepine (CBZ) is an antiepileptic drug for seizure control, pain relief due to trigeminal neuralgia, as well as the treatment of different relevant psychiatric disorders [15,17]. Table 2 gives a summarized outlook of the physicochemical properties of CBZ.
The photocatalytic activity performance of the SynTiO2 and Mo/SynTiO2 materials towards CBZ degradation on preliminary basis was evaluated, and 1 g/L catalyst dose for each of SynTiO2 and Mo/SynTiO2 was tested against 5 mg/L initial CBZ concentration under 365 nm UV irradiation and natural (unmodified) initial pH 5.84 condition. As can be seen from Figure 7, while Mo/SynTiO2 degraded ≈ 100% of the initial 5 mg/L CBZ concentration, SynTiO2 was almost completely non-photoactive over the degradation of same initial IBU concentration after 240 min of 365 nm UV irradiation exposure.
In retrospect, the comparative assessment of the few highlighted modified photocatalyst materials in the introduction section of this study, where Mo content as a dopant modifier for improved photocatalyst activity performance was employed either in lone or mixed form with other atoms, is shown in Table 3 with a summary of their operating conditions.
Since Mo/SynTiO2 showed a strong photoactivity response over the degradation of CBZ in comparison to the unmodified SynTiO2 (Figure 7), it was deployed for further photocatalytic test evaluations in the degradation of CBZ.

2.2.1. Effect of pH

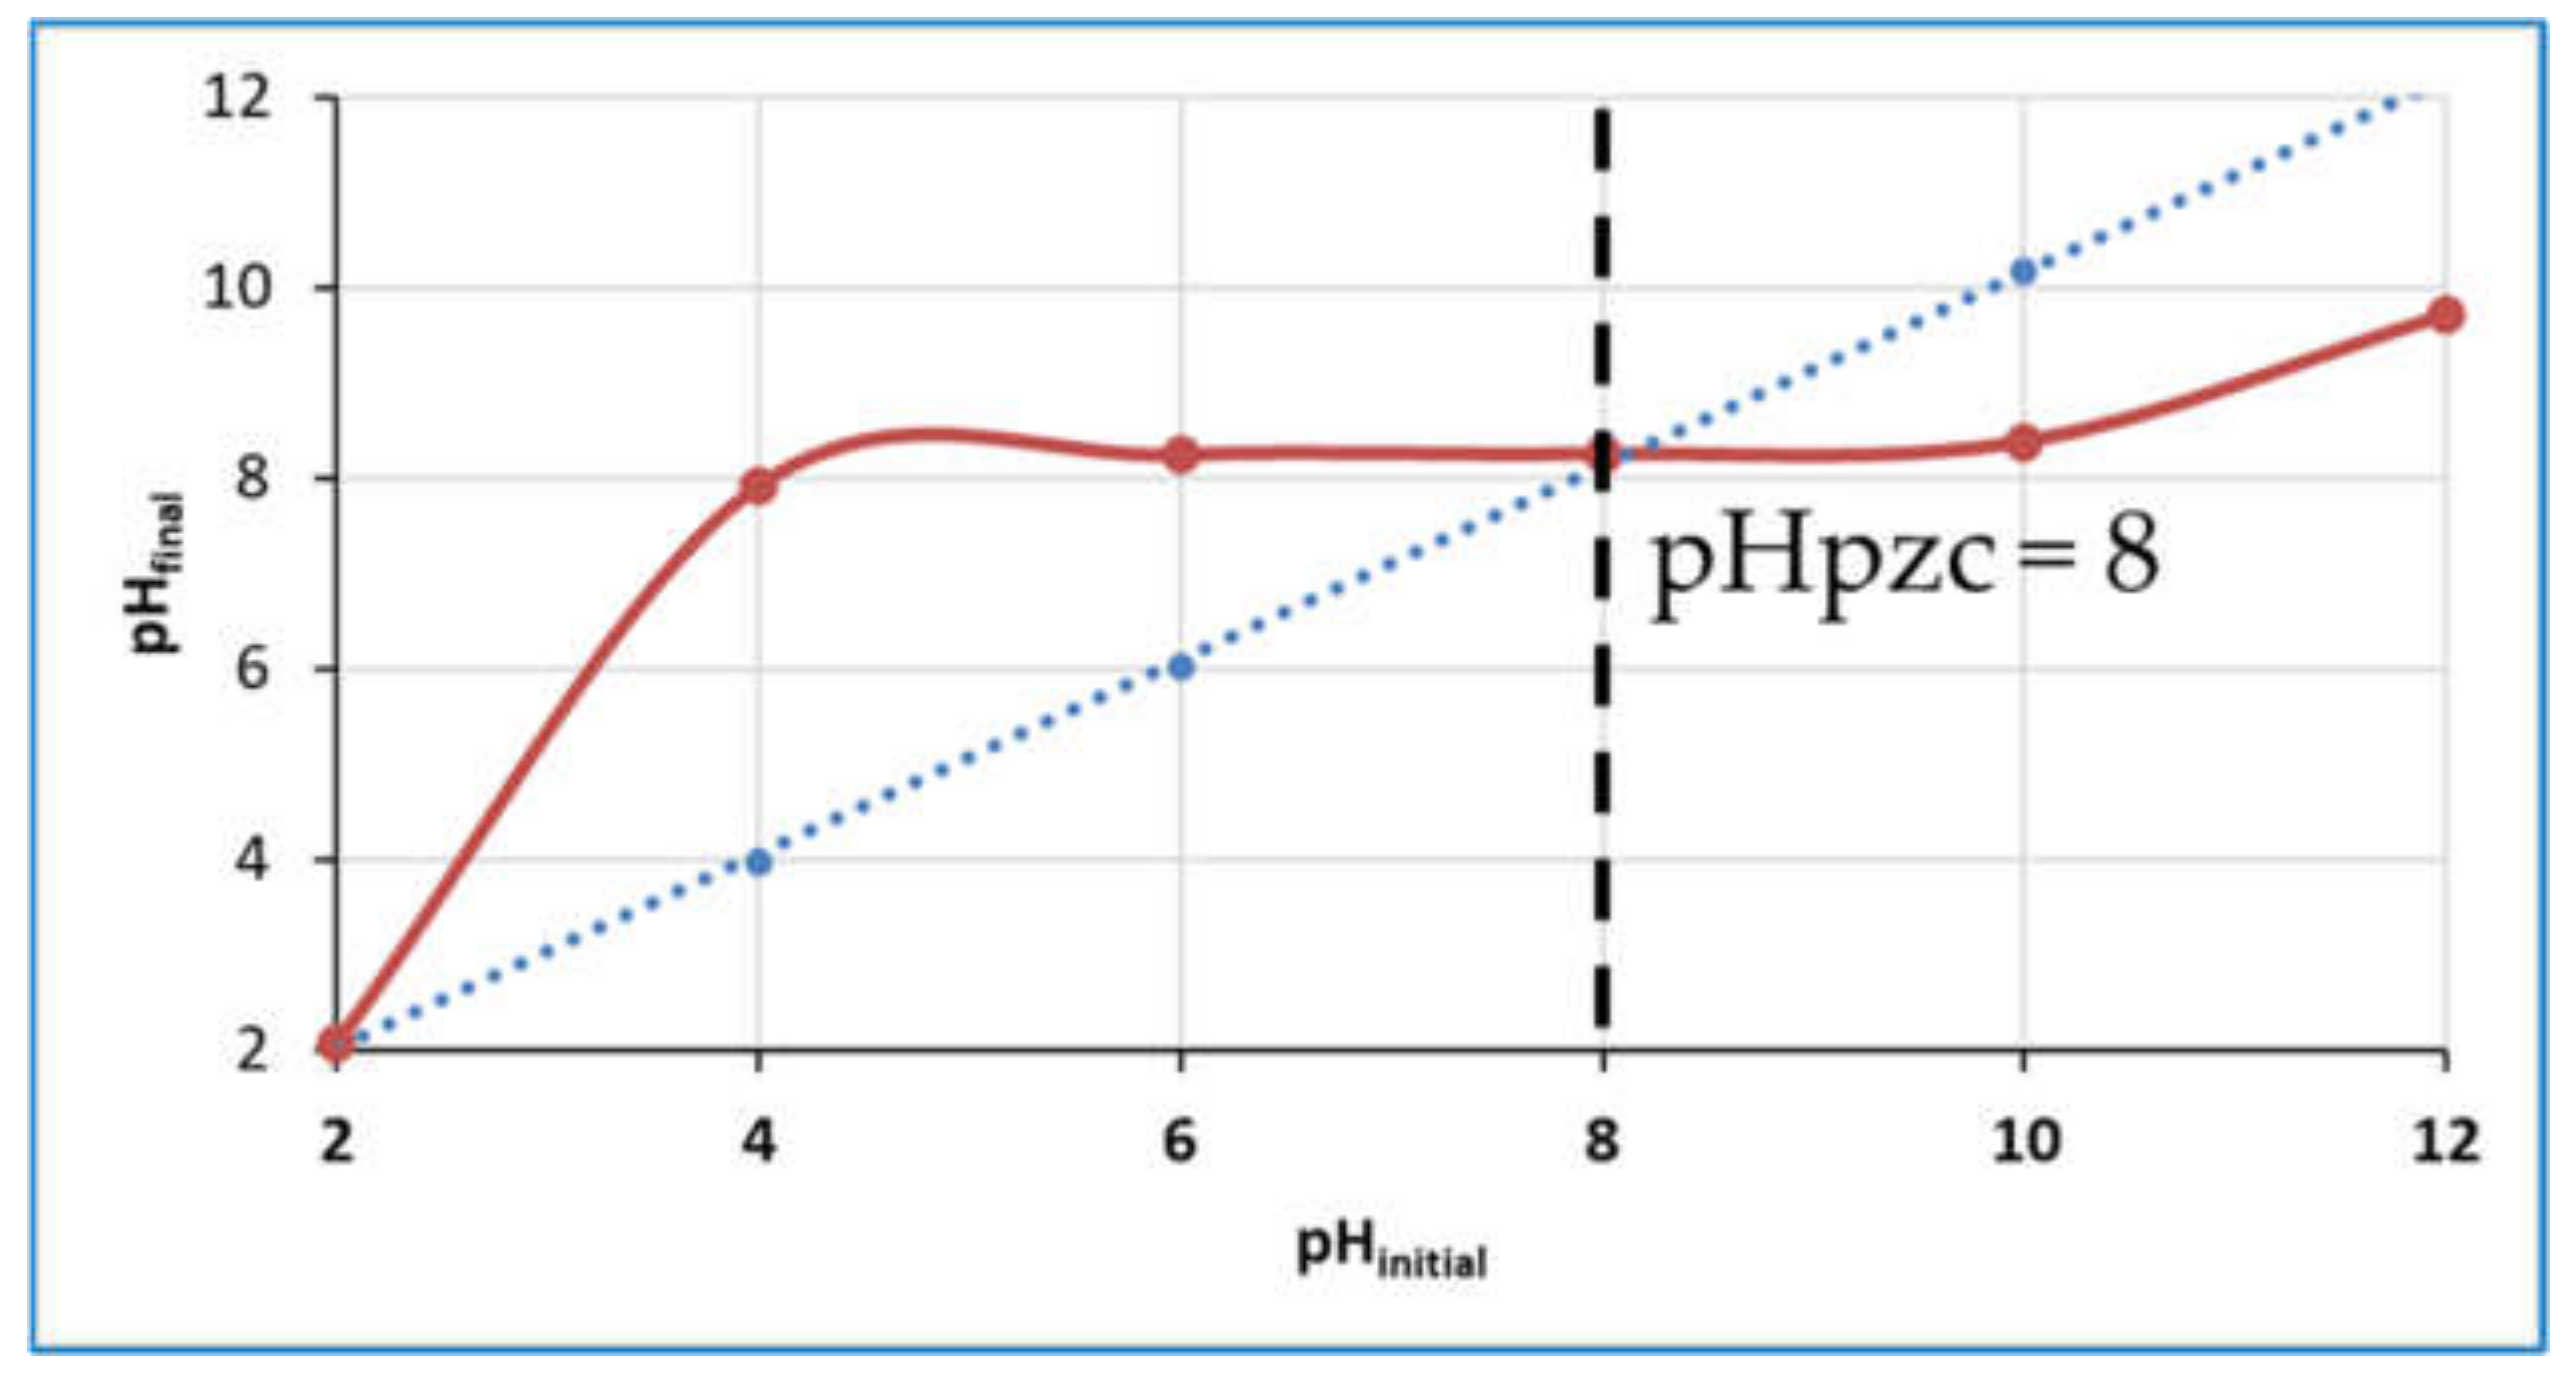
  • pH Point of Zero Charge (pHpzc) Value
The influential role of pH in the degradation of organic compound molecules in aqueous media has been reported, and a strong one for that matter [14,16,17,18]. As part of the pH effect evaluation on the photocatalytic degradation efficiency of Mo/SynTiO2, its pHpzc was determined and found to be 8 (Figure 8). Though the pHpzc of pristine TiO2 lies between 5.5–6.5 [17], there was a shift to even high-end pH value in the pHpzc of the Mo/SynTiO2, despite the acidic Mo semiconductor nature presence [44]. This outcome is attributed to the peculiarity of the synthesis protocol of the base TiO2 material concerning the added Mo dopant, which triggered a surface aggregation in aqueous media that led to the surface modification of the nanoparticles to a basic pH point character [83].
In addition to the already tested initial natural (unmodified) pH 5.84 condition at a preliminary level, other pH values of 3, 9, and 11 were further evaluated as to their effects on the photocatalytic degradation of CBZ based on the pHpzc of Mo/SynTiO2 and pKa value of CBZ (Figure 8, Table 2).
As can be seen from Figure 9, under the initial natural (unmodified) pH 5.84 condition, 1 g/L of the photocatalyst degraded ≈ 100% of the initial 5 mg/L CBZ concentration after 240 min of 365 nm UV irradiation exposure. Under the initial pH conditions of 9 and 11, about 88% and 80% of the initial 5 mg/L CBZ concentration was respectively degraded after 240 min UV irradiation time window (Figure 9). The least photocatalytic activity performance over CBZ degradation was observed under initial acidic pH 3 condition, with only about 26% degradation achieved by the photocatalyst after 240 min irradiation exposure time (Figure 9). The measured pHpzc charge of the photocatalyst (pHpzc 8) and the pKa value of CBZ (pKa 13.9), with respect to prevailing initial pH condition of the aqueous media, can be connected. In this sense, when the initial pH condition of the aqueous suspension media is above the pHpzc of the photocatalyst and the pKa of the CBZ molecule, the surface of the photocatalyst acquires a negative charge, while the CZB organic compound molecule is deprotonated; conversely, the reverse is the case [17,18]. This connection can be extended to the tested prevailing initial pH condition effect on the photocatalyst activity performance over CBZ degradation (Figure 8 and Figure 9). The performance observed under initial pH 9 and pH 11 can be attributed to favored surface charge interaction between a negatively charged photocatalyst surface and a protonated CBZ molecule which subsequently led to the degradation of CBZ, as they are closer to the photocatalyst point of generated reactive species needed for the degradation process [14,16,17,18]. The least positive effect in photocatalyst activity at initial pH 3 is an outcome supported by the positively charged photocatalyst surface and the protonated-NH2 functional group of the CBZ molecule (Figure 9). The resulting charge repulsion in effect at this initial pH 3 condition finally led to the distancing of the CBZ molecule from the photocatalyst surface where reactive species needed for degradation are present, thus the poor removal result was observed (Figure 9) [14,16,17,18]. The impressive activity shown by the photocatalyst at the natural (unmodified) pH 5.84 in effect is not supported by a favorable outcome based on the photocatalyst surface charge and ionized CBZ molecule in the aqueous suspension media (Figure 8 and Figure 9, Table 2). However, the shown enhanced activity by the photocatalyst under this initial pH 5.84 condition can be attributed to relative contribution of electrons, holes, and hydroxyl radicals present at this initial natural pH point for the degradation of the CBZ organic substrate molecule. Again, this is feasible at this natural (unmodified) pH condition as no pH condition alteration is affected and the prevailing pH 5.84 condition favors the possible dominating reactive species under conditions of moderately acidic and partially neutral rather than outright high acidic or alkaline pH values [84,85]. Furthermore, from Table 4, an extended corroboration can also be made between initial pH condition effect on the photocatalytic degradation process of CBZ with the measured final pH outcome. As observed, the natural (unmodified) initial pH 5.84 dropped to a relatively moderate acidic final pH value of 5.16, a point still balanced for the maintenance of the possible dominating reactive species for the photocatalytic degradation of CBZ (Figure 9, Table 4). Based on the analogy of initial pH 9 and 11 conditions that showed somewhat enabled impressive photocatalyst performance effect over the degradation of CBZ, their respective recorded final pH values of 7.47 and 10.46 are still hydroxyl radical species-promoting needed to sustain the photooxidation process (Table 4) [84]. While the final pH 10.46 condition enables and promotes charge acquisition to remain in favor of CBZ photocatalytic degradation, the final pH 7.47, though not at this point supported by the photocatalyst and CBZ adopted charges based on pHpzc and pKa values, remains promotional of CBZ photocatalytic degradation due to other reported phenomenon such as facilitated suspension dispersion for more available photocatalyst surface area in the degradation of CBZ [84]. The case of initial pH 3 with a final pH of 3.71 continues to suppress the photocatalytic activity of CBZ (Figure 9, Table 4). The reason is that with highly acidic pH conditions, there was no balance for the maintenance of dominating reactive species. The possible presence of aggregated photocatalyst material in suspension thereby limited surface area, and a lack of the establishment of promotional charge system for CBZ degradation based on pHpzc and CBZ pKa value is also responsible for poor removal under this initial pH 3 condition (Figure 8 and Figure 9, Table 4). On a general outlook, the effect of the tested initial pH conditions over the photocatalytic degradation of CBZ was not totally dependent on connecting the measured pHpzc of the photocatalyst and the pKa value of CBZ. This is justified by the electrostatic interaction between the photocatalyst and the CBZ molecule which, under the investigated initial pH conditions, were not all supported. Carbamazepine (CBZ) is a neutral molecule at a broad range of pH, and the fact that solution pH is complex and can influence photocatalytic reactions in several ways supports the holistic approach of looking at the pH influence in the degradation of most organic compounds like CBZ from a range of factors. Thus, the factors considered of the initial pH effect over CBZ degradation by the photocatalyst in this study and based on what has been reported are supported. Going forward, the rest of the photocatalytic test evaluations were performed under initial natural (unmodified) pH 5.84 to keep test conditions minimally interfered as much as possible.

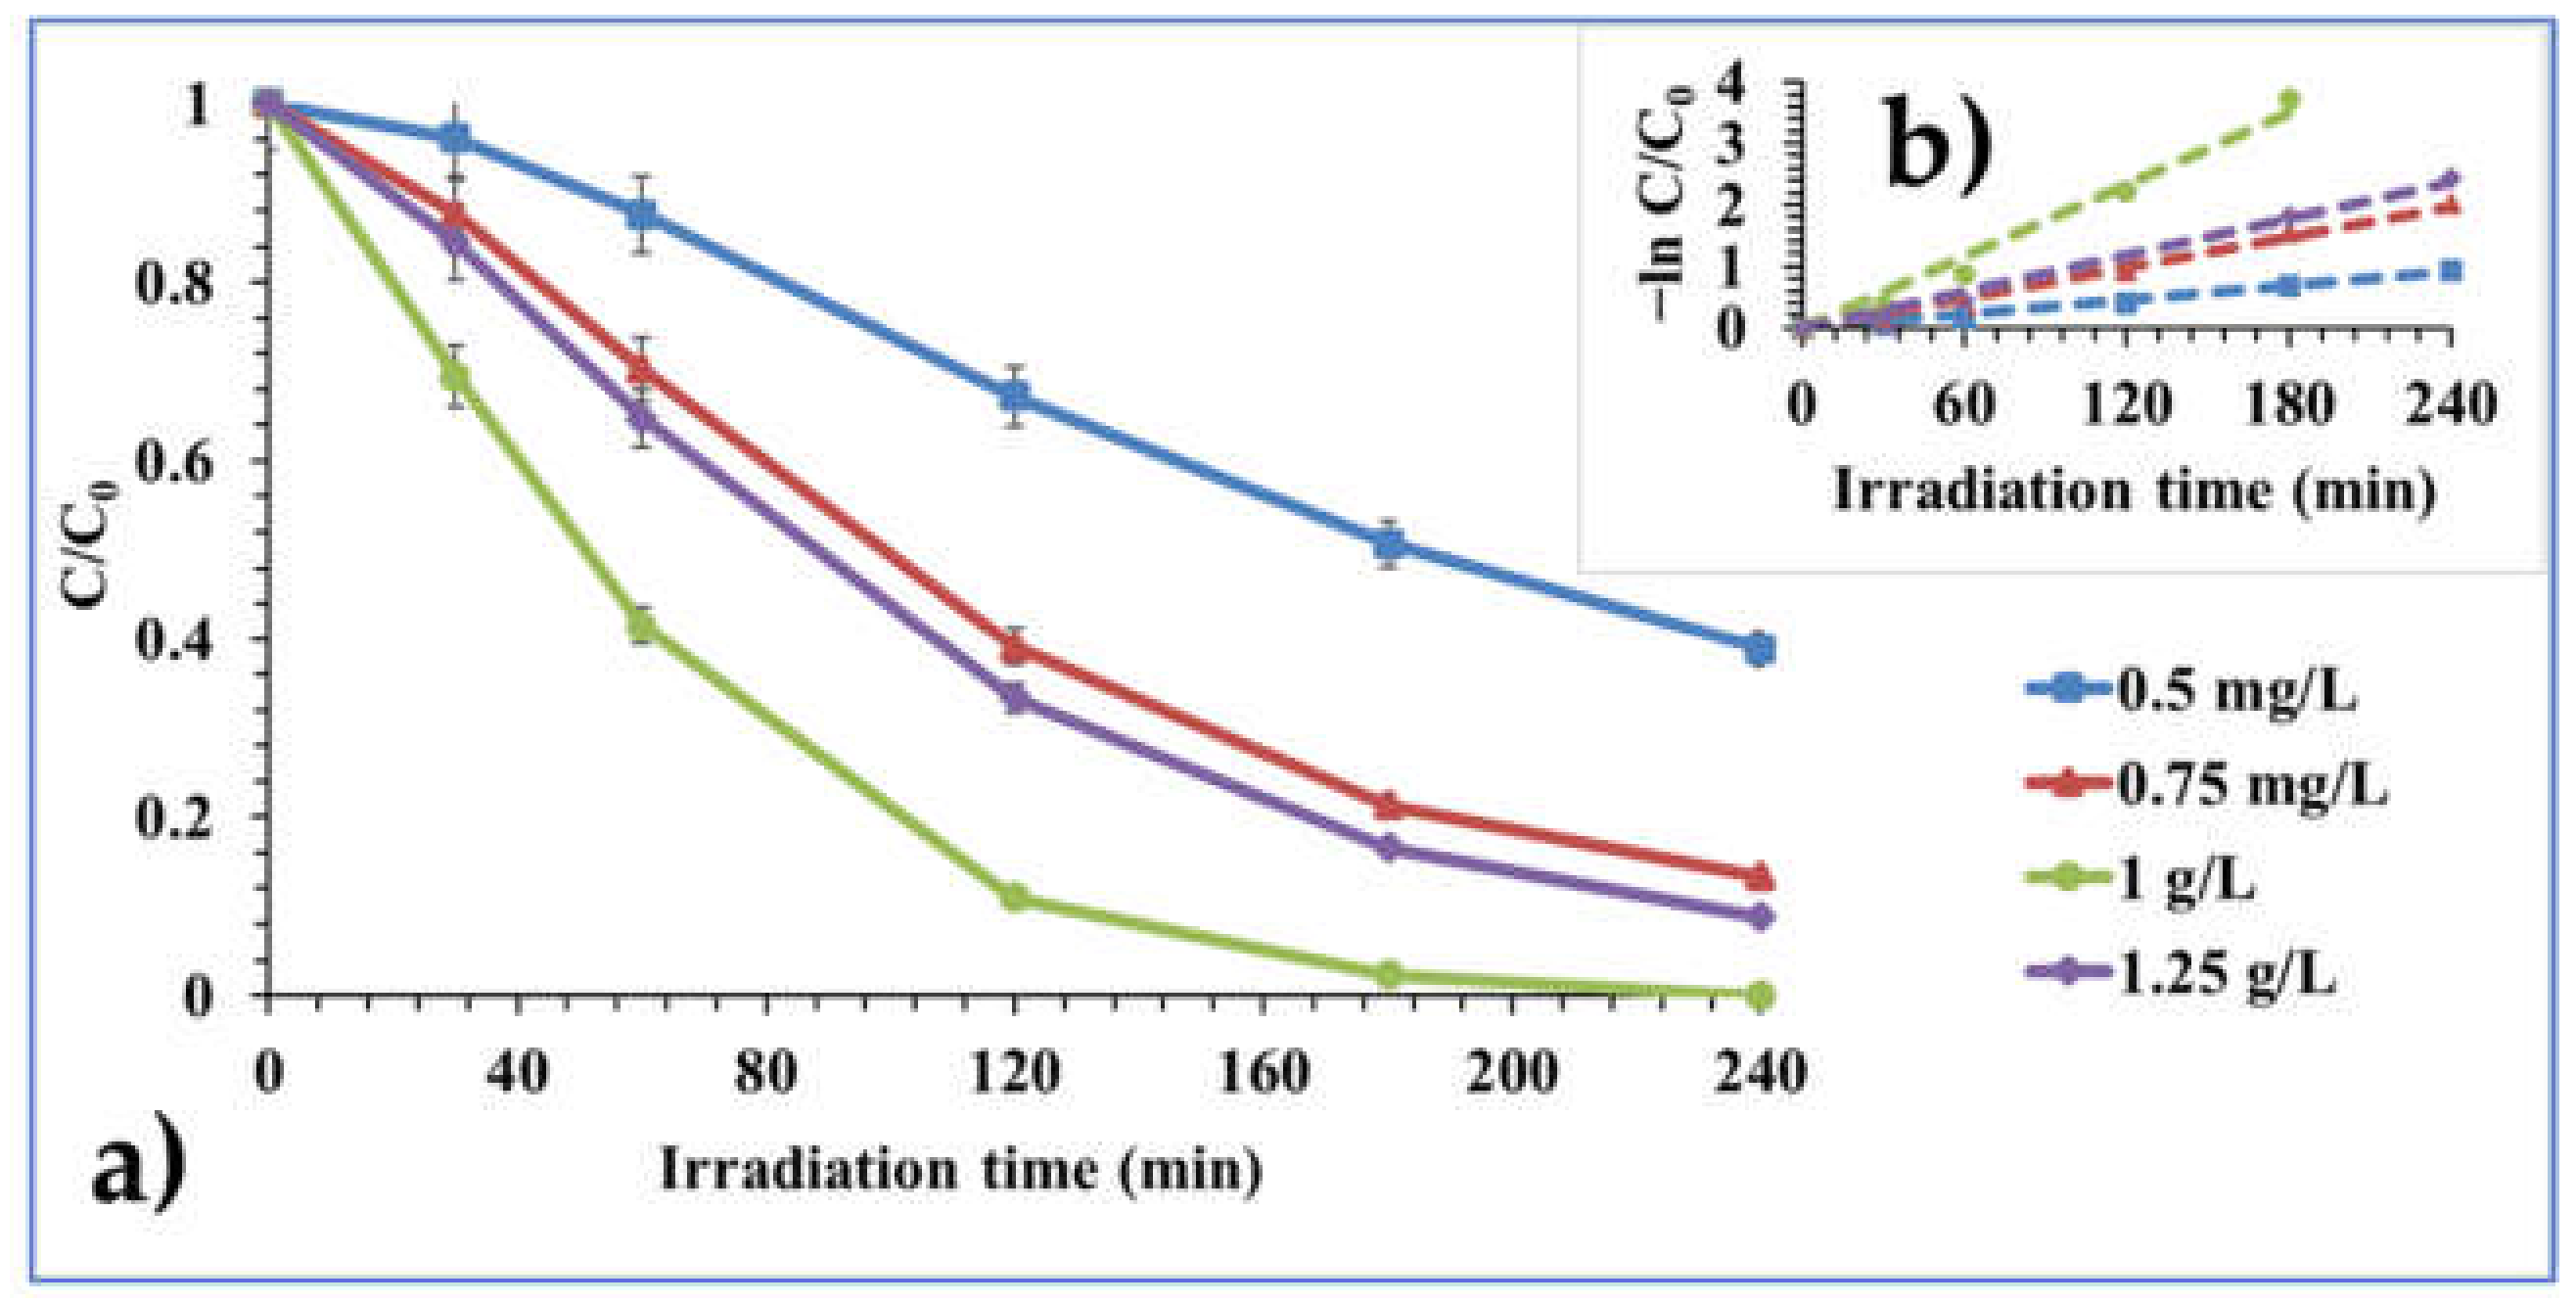
2.2.2. Effect of Catalyst Dosage

Catalyst dosage effect was evaluated over the photocatalytic degradation of CBZ. In addition to the already tested 1 g/L catalyst dosage, other dosages of 0.5 g/L, 0.75 g/L, and 1.25 g/L were also tested for CBZ photocatalytic degradation. As can be seen from Figure 10, an increment in catalyst dosage resulted in improved photocatalytic degradation removal of CBZ. This can be attributed to the participation of more active photocatalyst sites at a certain catalyst dosage amount that favors and facilitates the photocatalytic degradation of organic compounds [14,18]. Conversely, while a 1 g/L catalyst dosage ≈ 100% CBZ was degraded, about 90% CBZ was degraded by the 1.25 g/L catalyst dosage (Figure 10). The reason for this outcome is that at a certain catalyst dosage amount, photocatalyst activity performance can diminish due to catalyst shielding or screening of radiation light penetration effect at certain amount levels [14,18]. The 0.75 g/L catalyst dosage, being of a convenient higher amount, performed more efficiently than 0.5 g/L catalyst dosage with a degradation of ~87% CBZ for the former and about 61% CBZ degradation for the latter (Figure 10) [14,18].
With a better performance activity over CBZ degradation than the rest of the tested dosages and to keep catalyst dosage balanced, the next test evaluating the effect of initial pollutant concentration on the photocatalyst activity performance was performed at 1 g/L catalyst dosage.

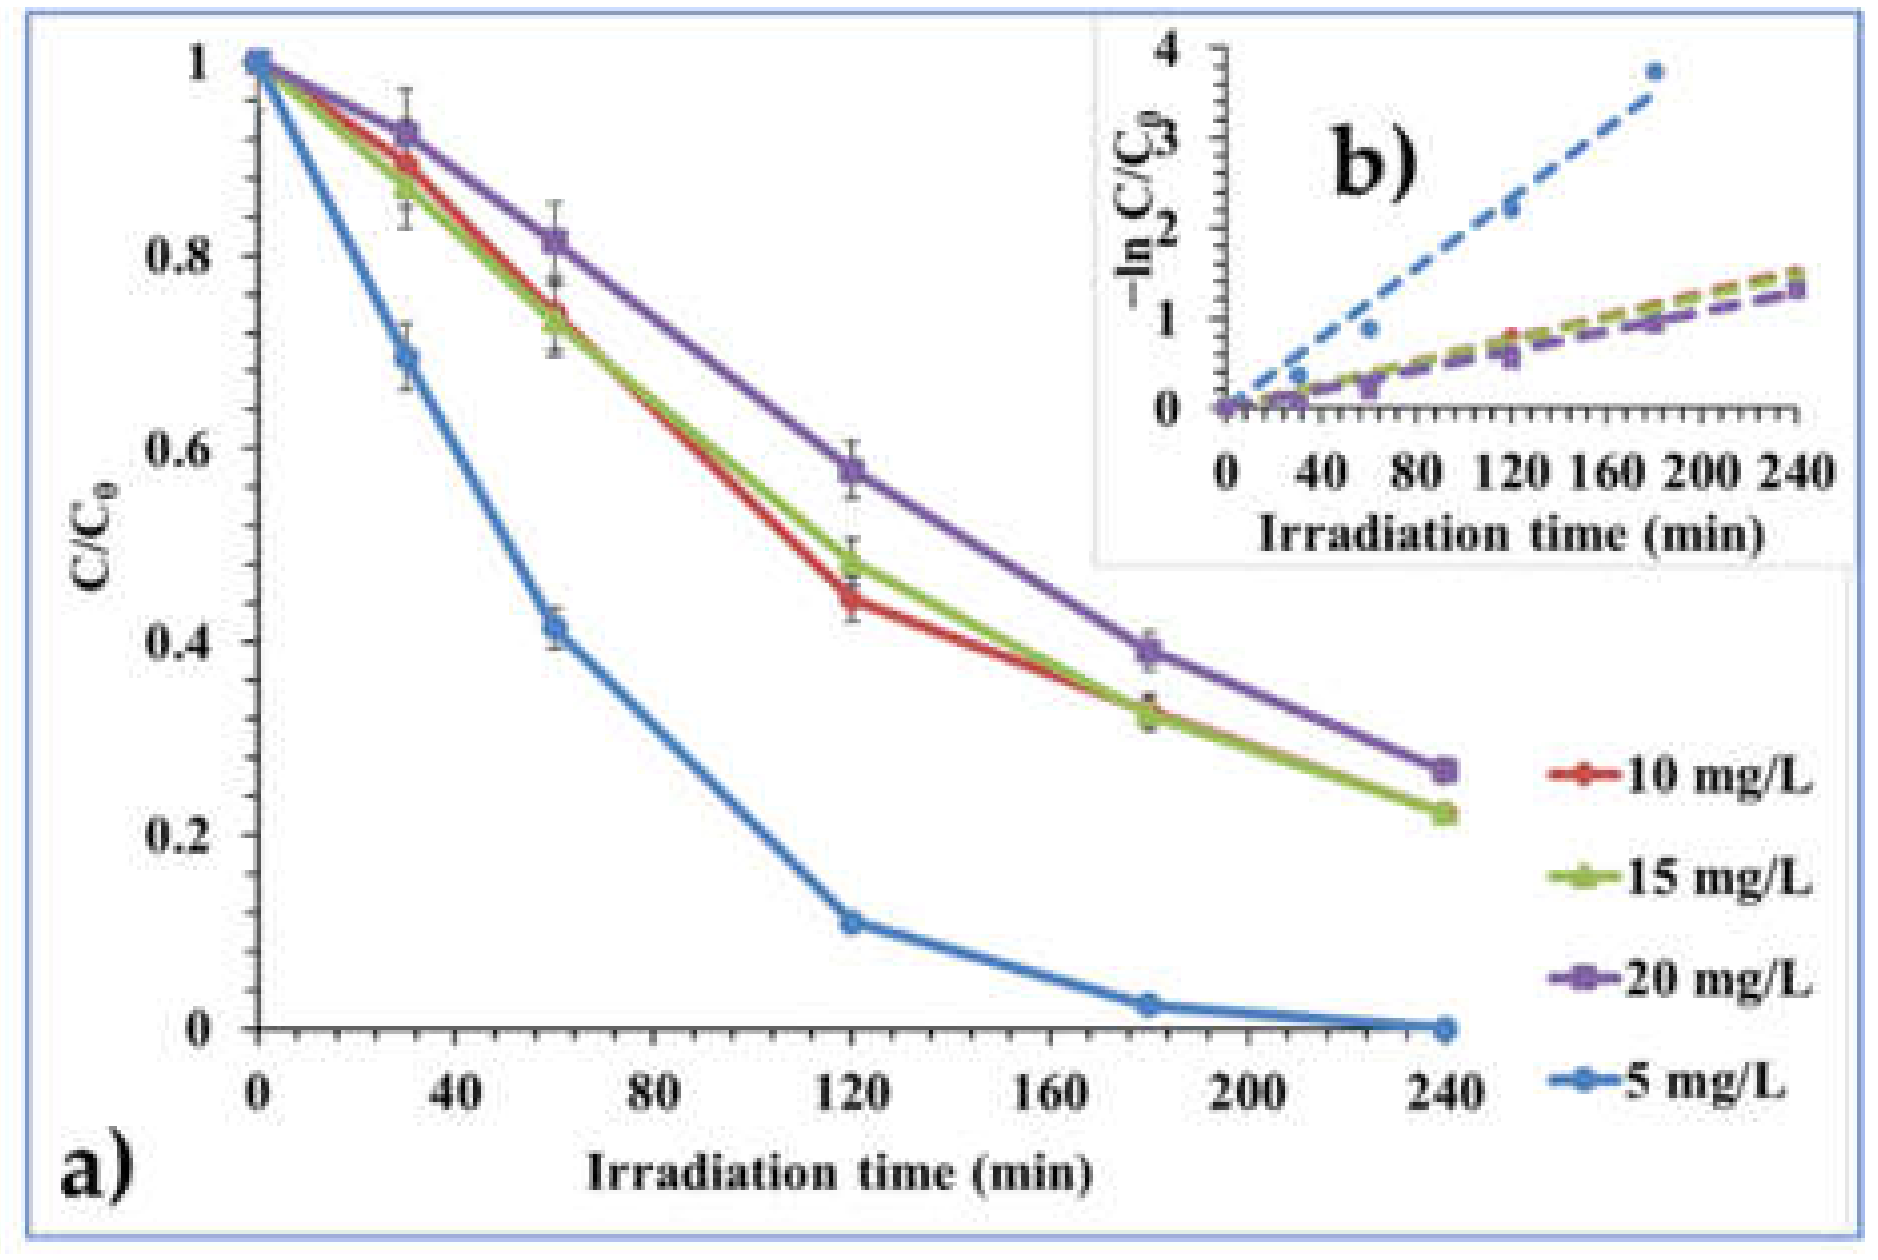
2.2.3. Effect of Initial Pollutant Concentration

In addition to the already tested 5 mg/L initial CBZ concentration, initial CBZ concentrations of 10 mg/L, 15 mg/L, and 20 mg/L were also tested for their effect on the photocatalyst activity performance over CBZ degradation. As shown in Figure 11, in response to an increase in initial CBZ concentration, photocatalyst activity performance decreased accordingly. This effect has been reported to have attributed to the overwhelming saturation of available photocatalyst surface active sites at high initial pollutant concentrations [14,18]. Higher photocatalyst activity performance can be observed at the least initial CBZ concentration of 5 mg/L, where ≈100% was degraded after 240 min UV irradiation (Figure 11). Further increase of the initial CBZ concentration to 10 mg/L and 15 mg/L returned a declined photocatalytic degradation rate, with about 78% equal CBZ degradation achieved by the photocatalyst under those initial CBZ concentrations (Figure 11). The least activity performance was witnessed for the photocatalyst at the higher initial CBZ concentration of 20 mg/L, with only about 73% CBZ degraded by the photocatalyst (Figure 11). In essence, with a 5 mg/L initial CBZ concentration, the photocatalyst delivered the most efficient performance for CBZ degradation.
As such, catalyst dosage of 1 g/L, initial CBZ concentration of 5 mg/L under initial natural (unmodified) pH 5.84 were adopted as the respective catalyst amount, initial pollutant concentration, and initial pH conditions for the rest of the photocatalyst test evaluations.
Additionally, tests were performed in the dark in the presence of the Mo/SynTiO2 photocatalyst powder as well as CBZ photolysis test in the absence of Mo/SynTiO2. Resultant test effects showed negligible adsorption and photodegradation of CBZ under the related test conditions of 5 mg/L initial CBZ concentration, 1 g/L catalyst dosage, natural (unmodified) pH 5.84, and 240 min of 365 nm UV irradiation (Figure 12). In the same manner, heat effect with catalyst and heat effect without catalyst (with the photocell reactors adequately wrapped with thin aluminum foils in each test case scenario) to ward off light penetration interferences did not result in any significant CBZ degradation (Figure 12).

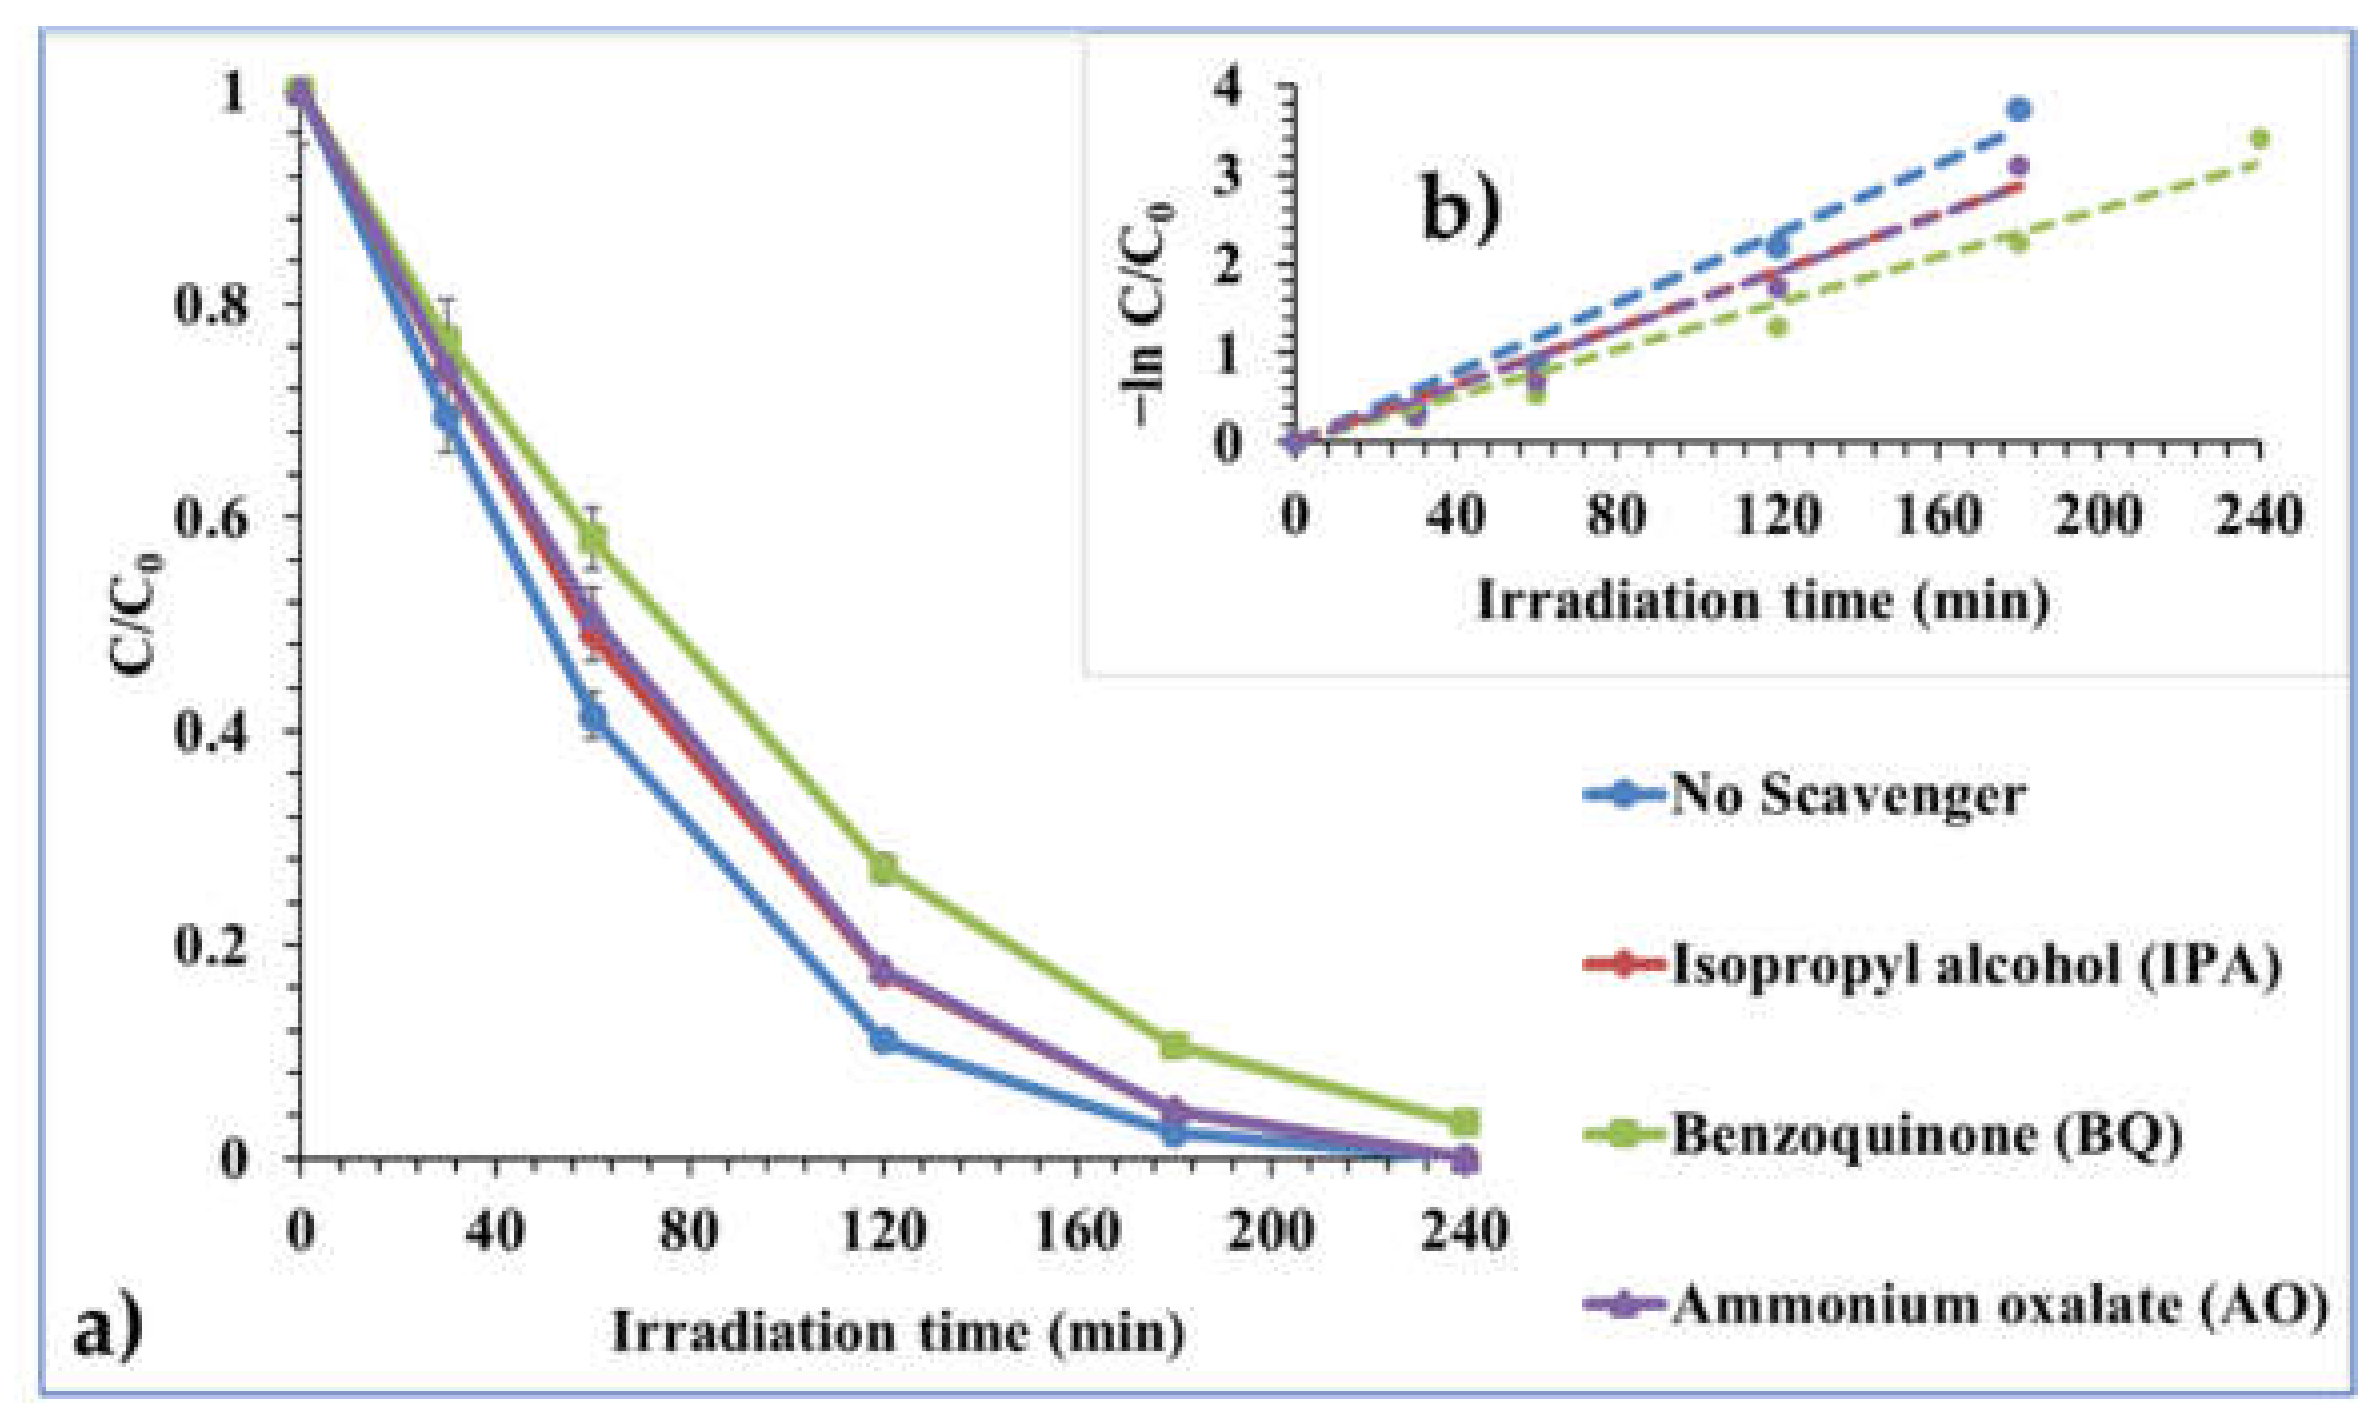
2.2.4. Effect of Chemical Scavengers

Chemical scavenger effect was conducted over the photocatalyst degradation of CBZ to probe for the reactive species responsible in driving the degradation process. 1 mM each of isopropyl alcohol (IPA), benzoquinone (BQ), and ammonium oxalate (AO) were employed as the chemical scavengers for the respective probe of hydroxyl (HO·) radical, superoxide (O2) anion, and hole (h+) charge carrier reactive species [14,16,17,18,86,87,88].
As can be seen from Figure 13, all the tested chemical scavengers with respect to no added scavenger impeded the photocatalytic degradation of CBZ during the 240 min UV irradiation. In comparison to no added scavenger, IPA and AO slightly suppressed the photodegradation reaction rate until 180 min of the 240 min irradiation time window. At this time, equal degradation performance of ≈100% of the initial 5 mg/L CBZ concentration was achieved by the photocatalyst in the presence of IPA and AO scavengers with respect to no added scavenger (Figure 13). The implication here is that the introduced presence of IPA and AO exerted, on a slight level, a suppression effect on the photocatalytic degradation process, but with a loss in the antagonistic effect as the reaction proceeded. On the other hand, BQ exerted a stronger suppression effect on the photocatalytic degradation process of CBZ in a way that, even as the suppressive effect waned down with time, about 3% of initial CBZ was remaining after 240 min UV irradiation in comparison to near or total CBZ removal in the presence of IPA and AO at this time (Figure 13). In essence, going by the early and initial slightly suppression effect exerted on the photocatalytic degradation process in the presence of IPA and AO, it can be suggested that hydroxyl (HO·) radical and hole charge (h+) carrier reactive species respectively probed by these two tested scavengers were to some extent involved in the photocatalytic degradation of CBZ (Figure 13) [14,16,17,18,88]. In the case of BQ, a much higher degree of involvement can be suggested for the superoxide (O2.) anion specie in the photocatalytic degradation of CBZ since much stronger and maintained suppression effect was seen in the presence of BQ in comparison to both IPA and AO over the photocatalytic degradation process (Figure 13). Variation between the initial pH values upon the addition of these chemical scavengers and their final recorded pH values did not vary as widely, as can be seen from Table 3.
Based on this analogy, such a proposal where photodegradation process mechanism involving directly or indirectly primary photogenerated charge carriers and their corresponding photoinduced/other charge species accompanied transfer mechanisms is foreseen and will be more elucidated in the paper section dedicated to the proposed photocatalytic degradation process mechanism of CBZ.

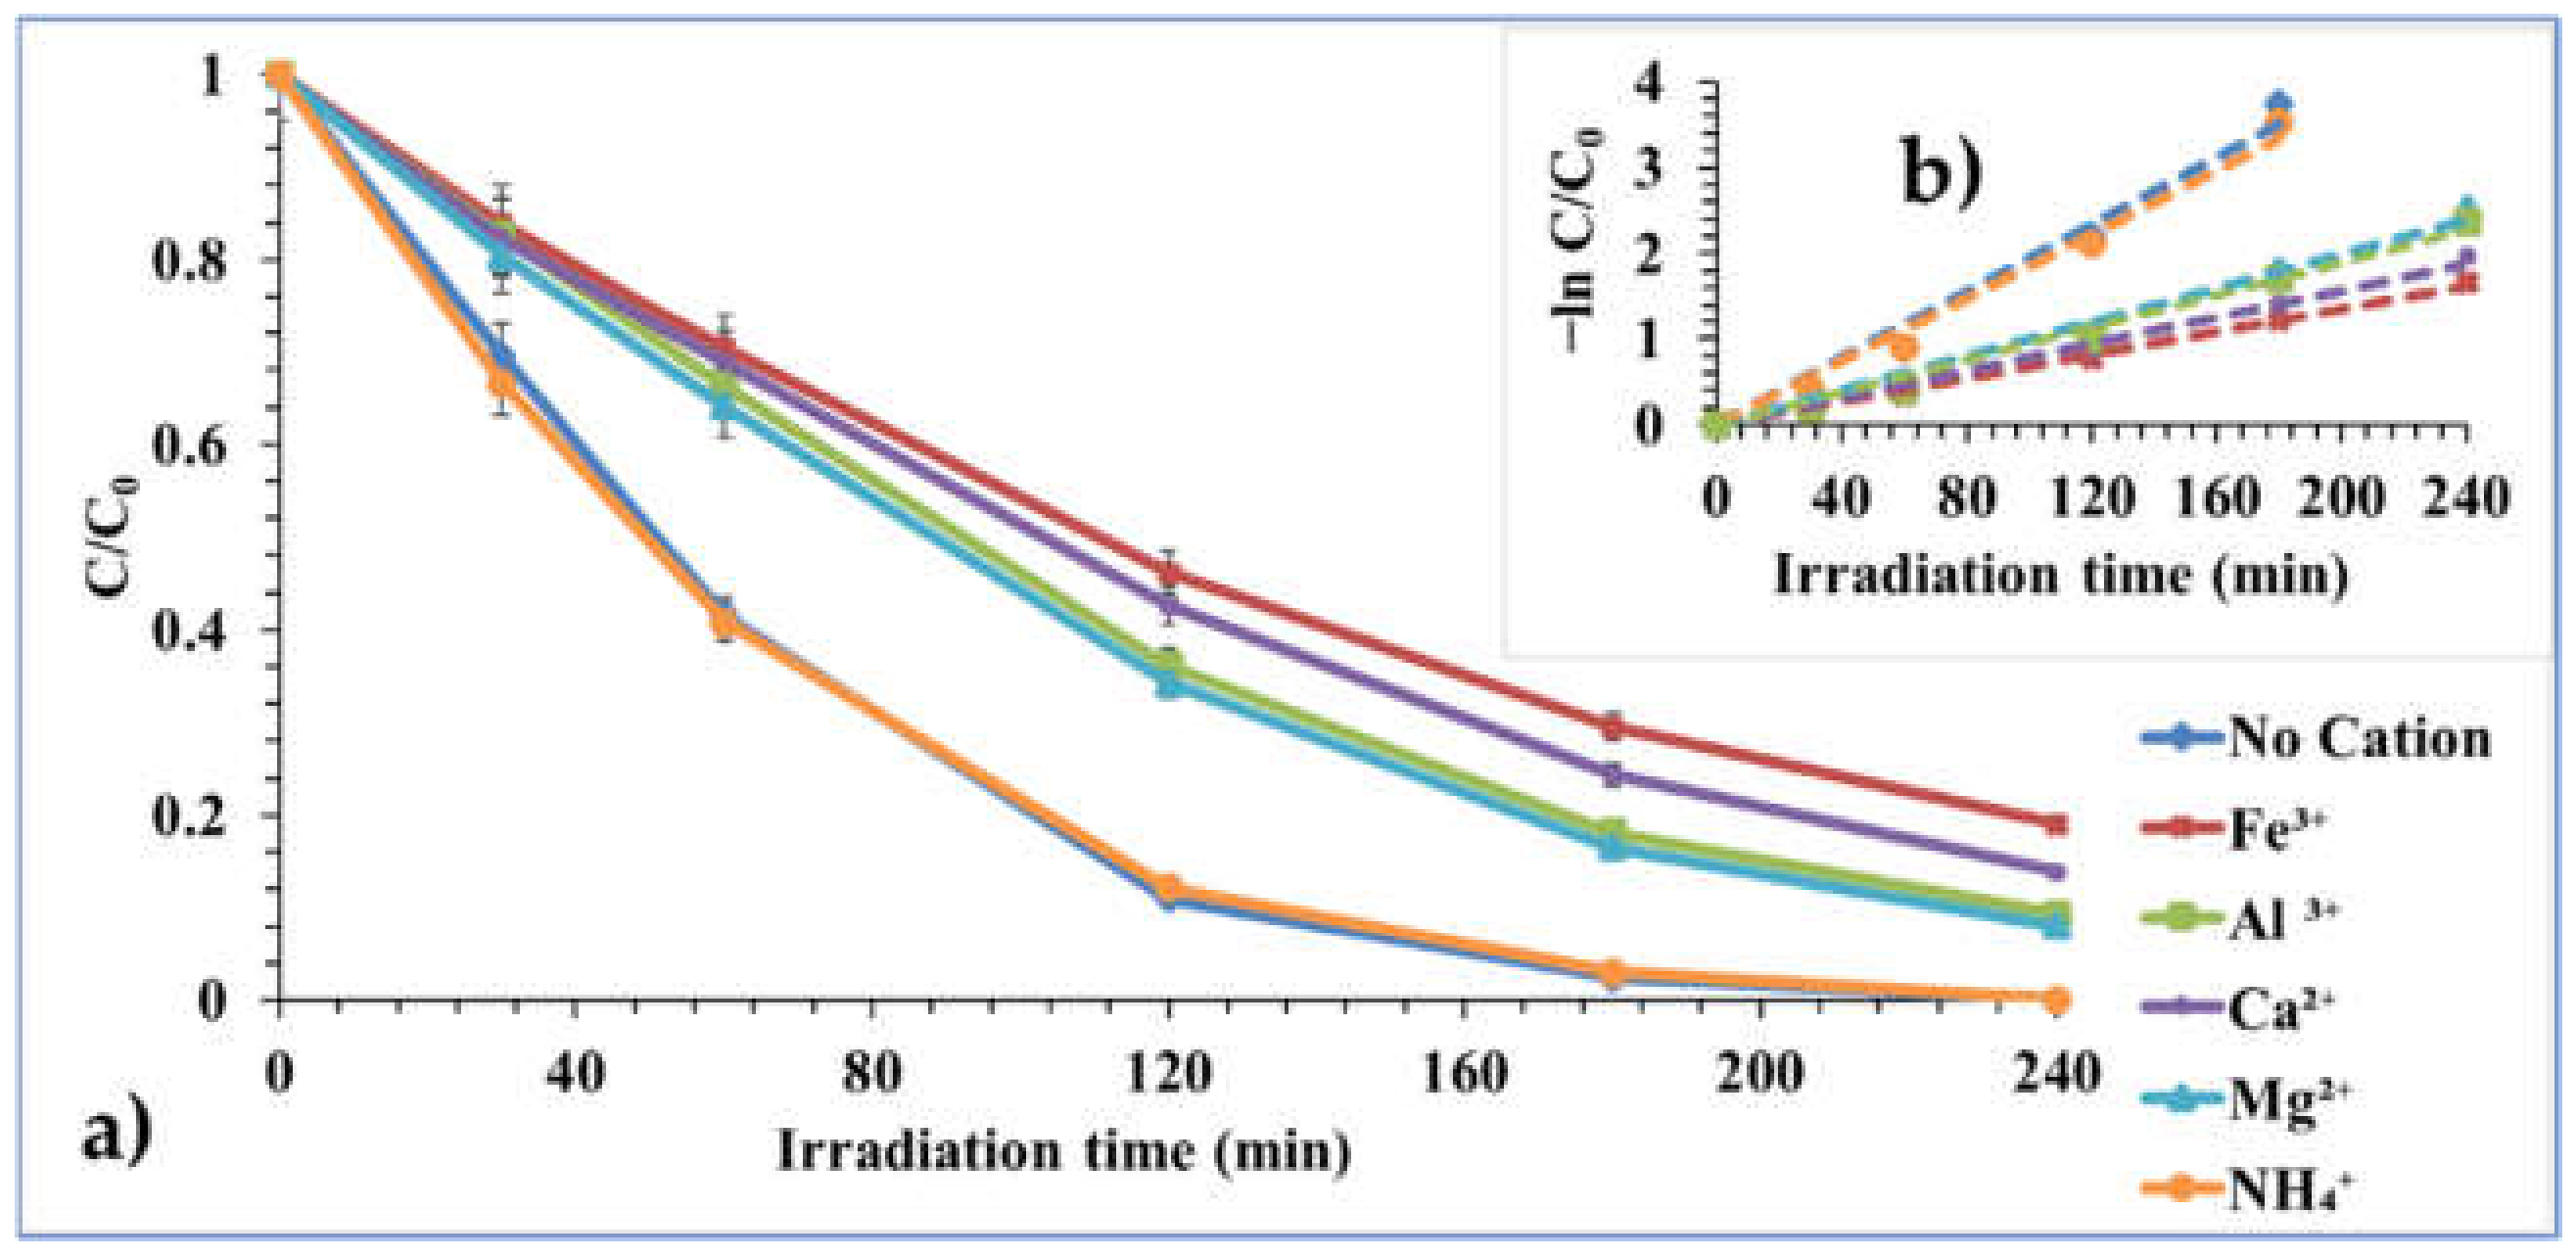
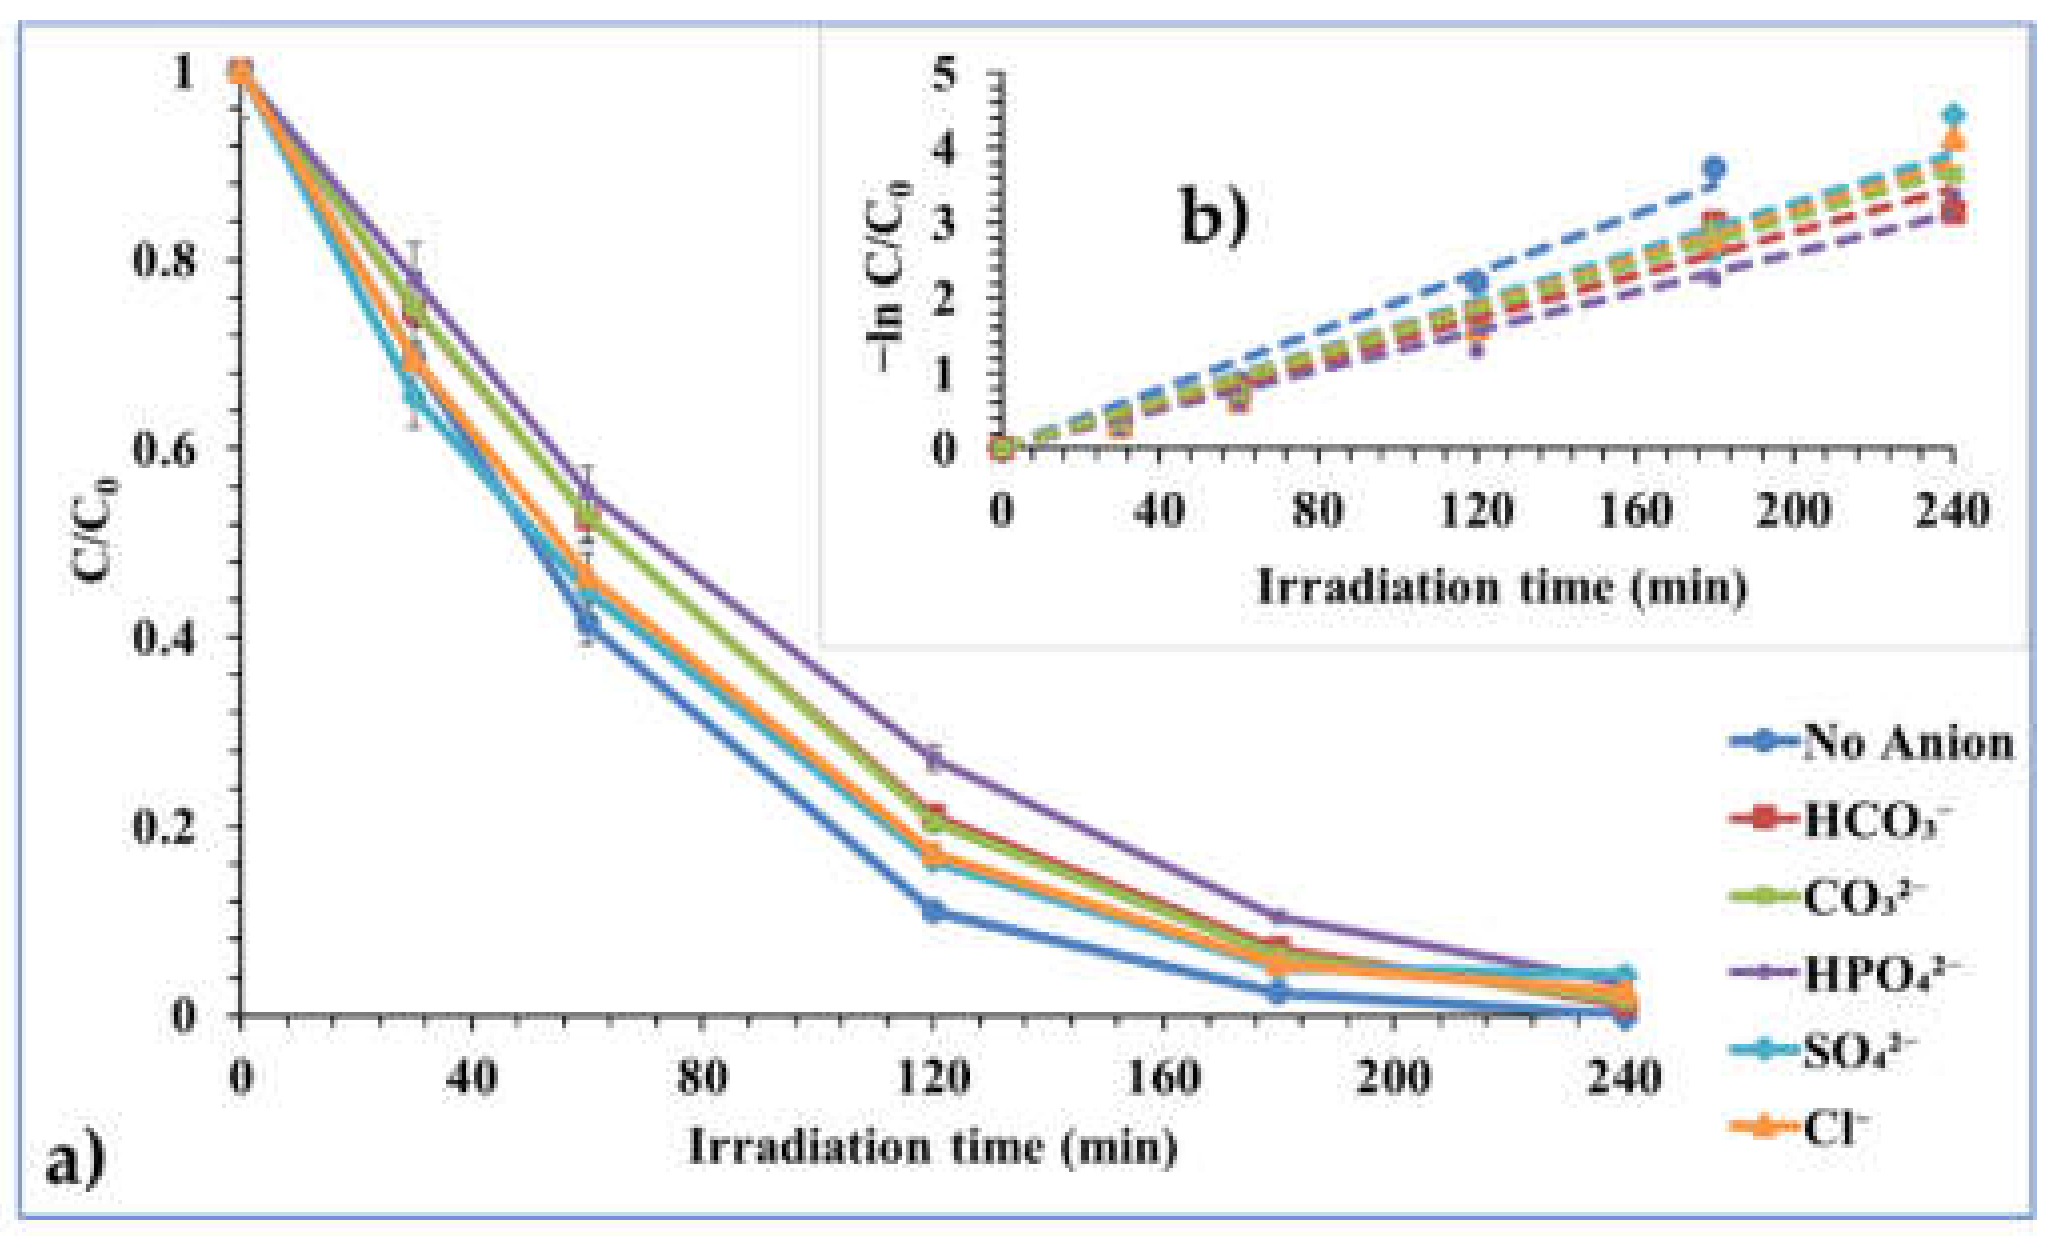
2.2.5. Effect of Contaminant Ion (Cations and Anions)

The effect of contaminant ion on the photocatalytic degradation process was also investigated. One molar equivalent (1 mMeq) concentration for each of the tested cations and anions was employed. For the cations, chloride cationic salts of NH4+, Mg2+, Ca2+, Al3+, and Fe3+ were tested, while for the anions, sodium anionic salts of Cl, SO42, HPO42, CO32, and HCO3 were tested.
As shown in Figure 14, in the presence of NH4+ ion, the photocatalytic degradation process remained with no observable positive or negative effect, but rather the same achievement of ≈100% CBZ degradation by the photocatalyst was observed, like in the case of no added cation. The report that in the presence of some inorganic ions like NH4+, Mg2+, and Ca2+, etc., organic pollutant photocatalytic degradation process may or may not be impacted to a greater extent or even not impacted at all, supports this outcome [89]. In comparison to no added ion (cation), the presence of Mg2+ and Al3+ retarded the photocatalytic degradation process with about 92% CBZ degradation recorded for each of the tested ions at this point after 240 min irradiation. The effect recorded upon the respective addition of Ca2+ and Fe3+ ions over the photocatalytic degradation process of CBZ showed a higher impedance in comparison to no added ion (cation), with ~86% and 81% CBZ degradation achieved after 240 min irradiation (Figure 14). Although NH4+ ion displayed a neutral effect over CBZ degradation, the slight retardation effect observed in the case of Mg2+ and Al3+ and that of a higher suppression in the presence of Ca2+ and Fe3+ ions was reported [14,17,89]. When observed, the suppression effect on photocatalytic degradation of organic compounds due to cations has been attributed to factors like hydroxyl radical scavenging, pH change of aqueous media suspension due to foreign ion addition, as well as catalyst active sites competition between substrate organic molecules and the present cationic species [14,17]. In this sense, the mixed outcome observed with respect to the degree of suppression exerted by the presence of Mg2+, Al3+, Ca2+, and Fe3+ ions over the photocatalytic degradation of CBZ has been down to one or more combinations of those stated factors (Figure 14) [14,17]. Interestingly, linking the effect outcome of the tested cations to their recorded final pH values is a trend where the more acidic the pH value is, the higher the degree of suppression, and the more alkaline or closer to neutral the pH point is, the less the suppression effect existed (Figure 14, Table 4). This observation corroborates with the investigated pH effect where, initial pH 3 and its corresponding final pH 3.71 being the most acidic of the recorded pH values, achieved the least CBZ degradation by the photocatalyst (Figure 9 and Figure 14, Table 4).
The effect of anions over the photocatalytic degradation process was investigated and showed such a trend where on a general basis, there was exertion of suppression though with a non-significant exertion (Figure 15). As can be observed, the introduced anions exerted a slight suppression effect at the early irradiation stages of the photocatalytic degradation process which gradually waned after 240 min irradiation time with almost the same 100% CBZ degradation achieved, just like in the case of no anion addition. Similarity of trend in suppression effect was displayed by the presence of SO42 ion and that of Cl, while that of CO32 and HCO3 displayed, in a similar manner, their suppression effect (Figure 15). HPO42 ion exhibited, in a more concerted and noticeable manner, at least for the first 180 min, irradiation suppression effect over the CBZ photocatalytic degradation process in comparison to the other tested anions and no anion addition condition (Figure 15). The outcome of the suppression effect exerted by the introduced anions over the CBZ photocatalytic degradation process in comparison to no anion addition on a general basis is attributed to the scavenging attitude of these anions towards hydroxyl (OH) radical, consequently leading to photodegradation process rate retardation [14,18,89]. The mixed outcome in suppression effect amongst the tested anions and their overall retardation of the photocatalytic degradation process can also be linked to variation between the initial and final measured pH values (Table 4). The outlook over the measured final pH values portrays the scenario where the moderately acidic or near-neutral pH conditions translated to a lesser suppressed photocatalytic degradation process outcome in comparison to the more advanced towards alkaline pH condition (Table 4).

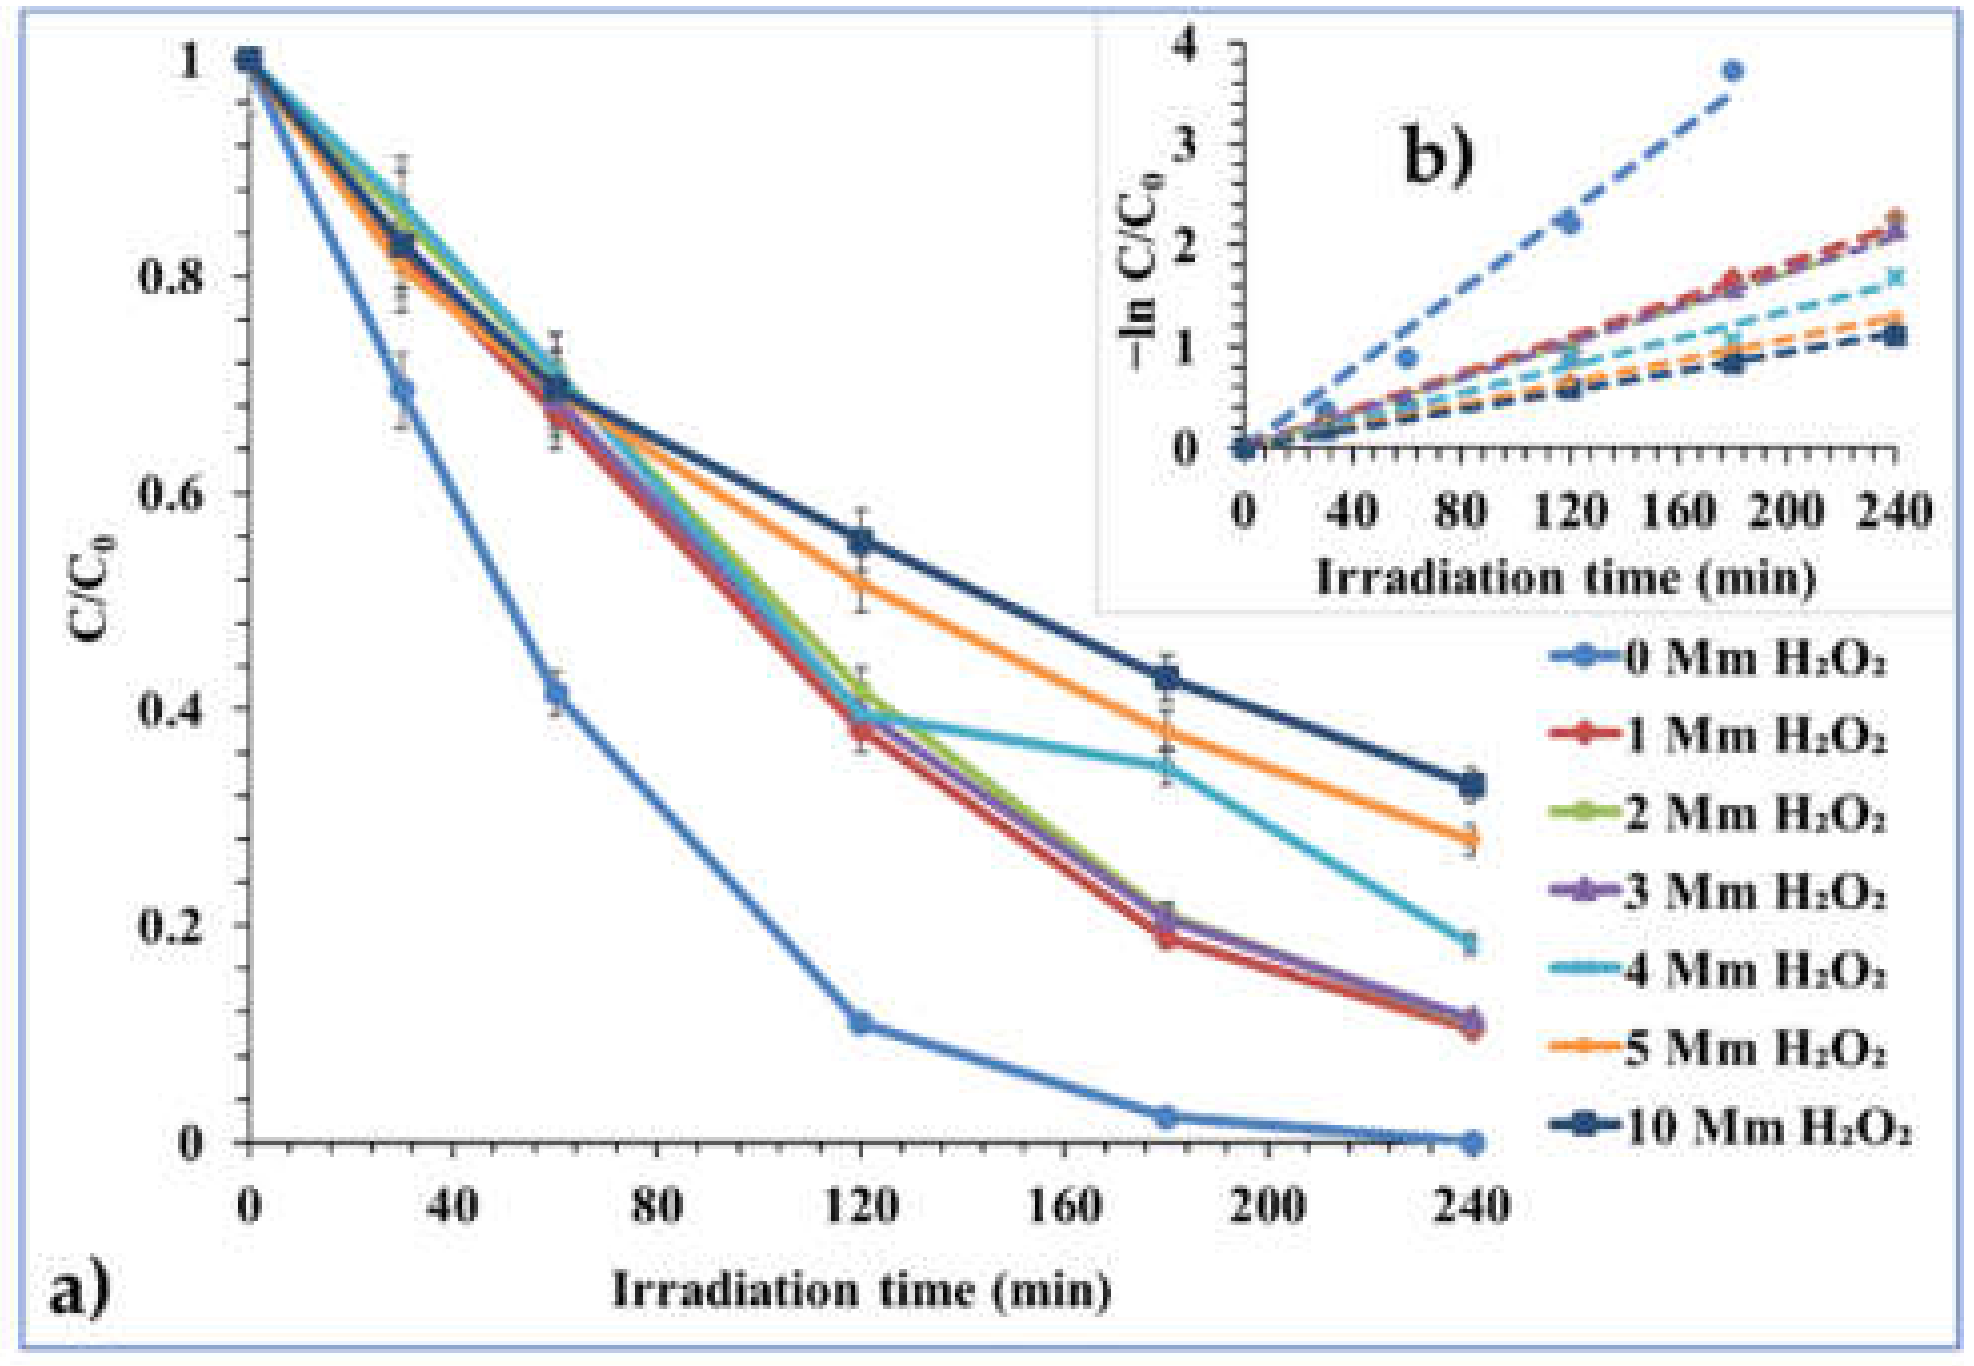
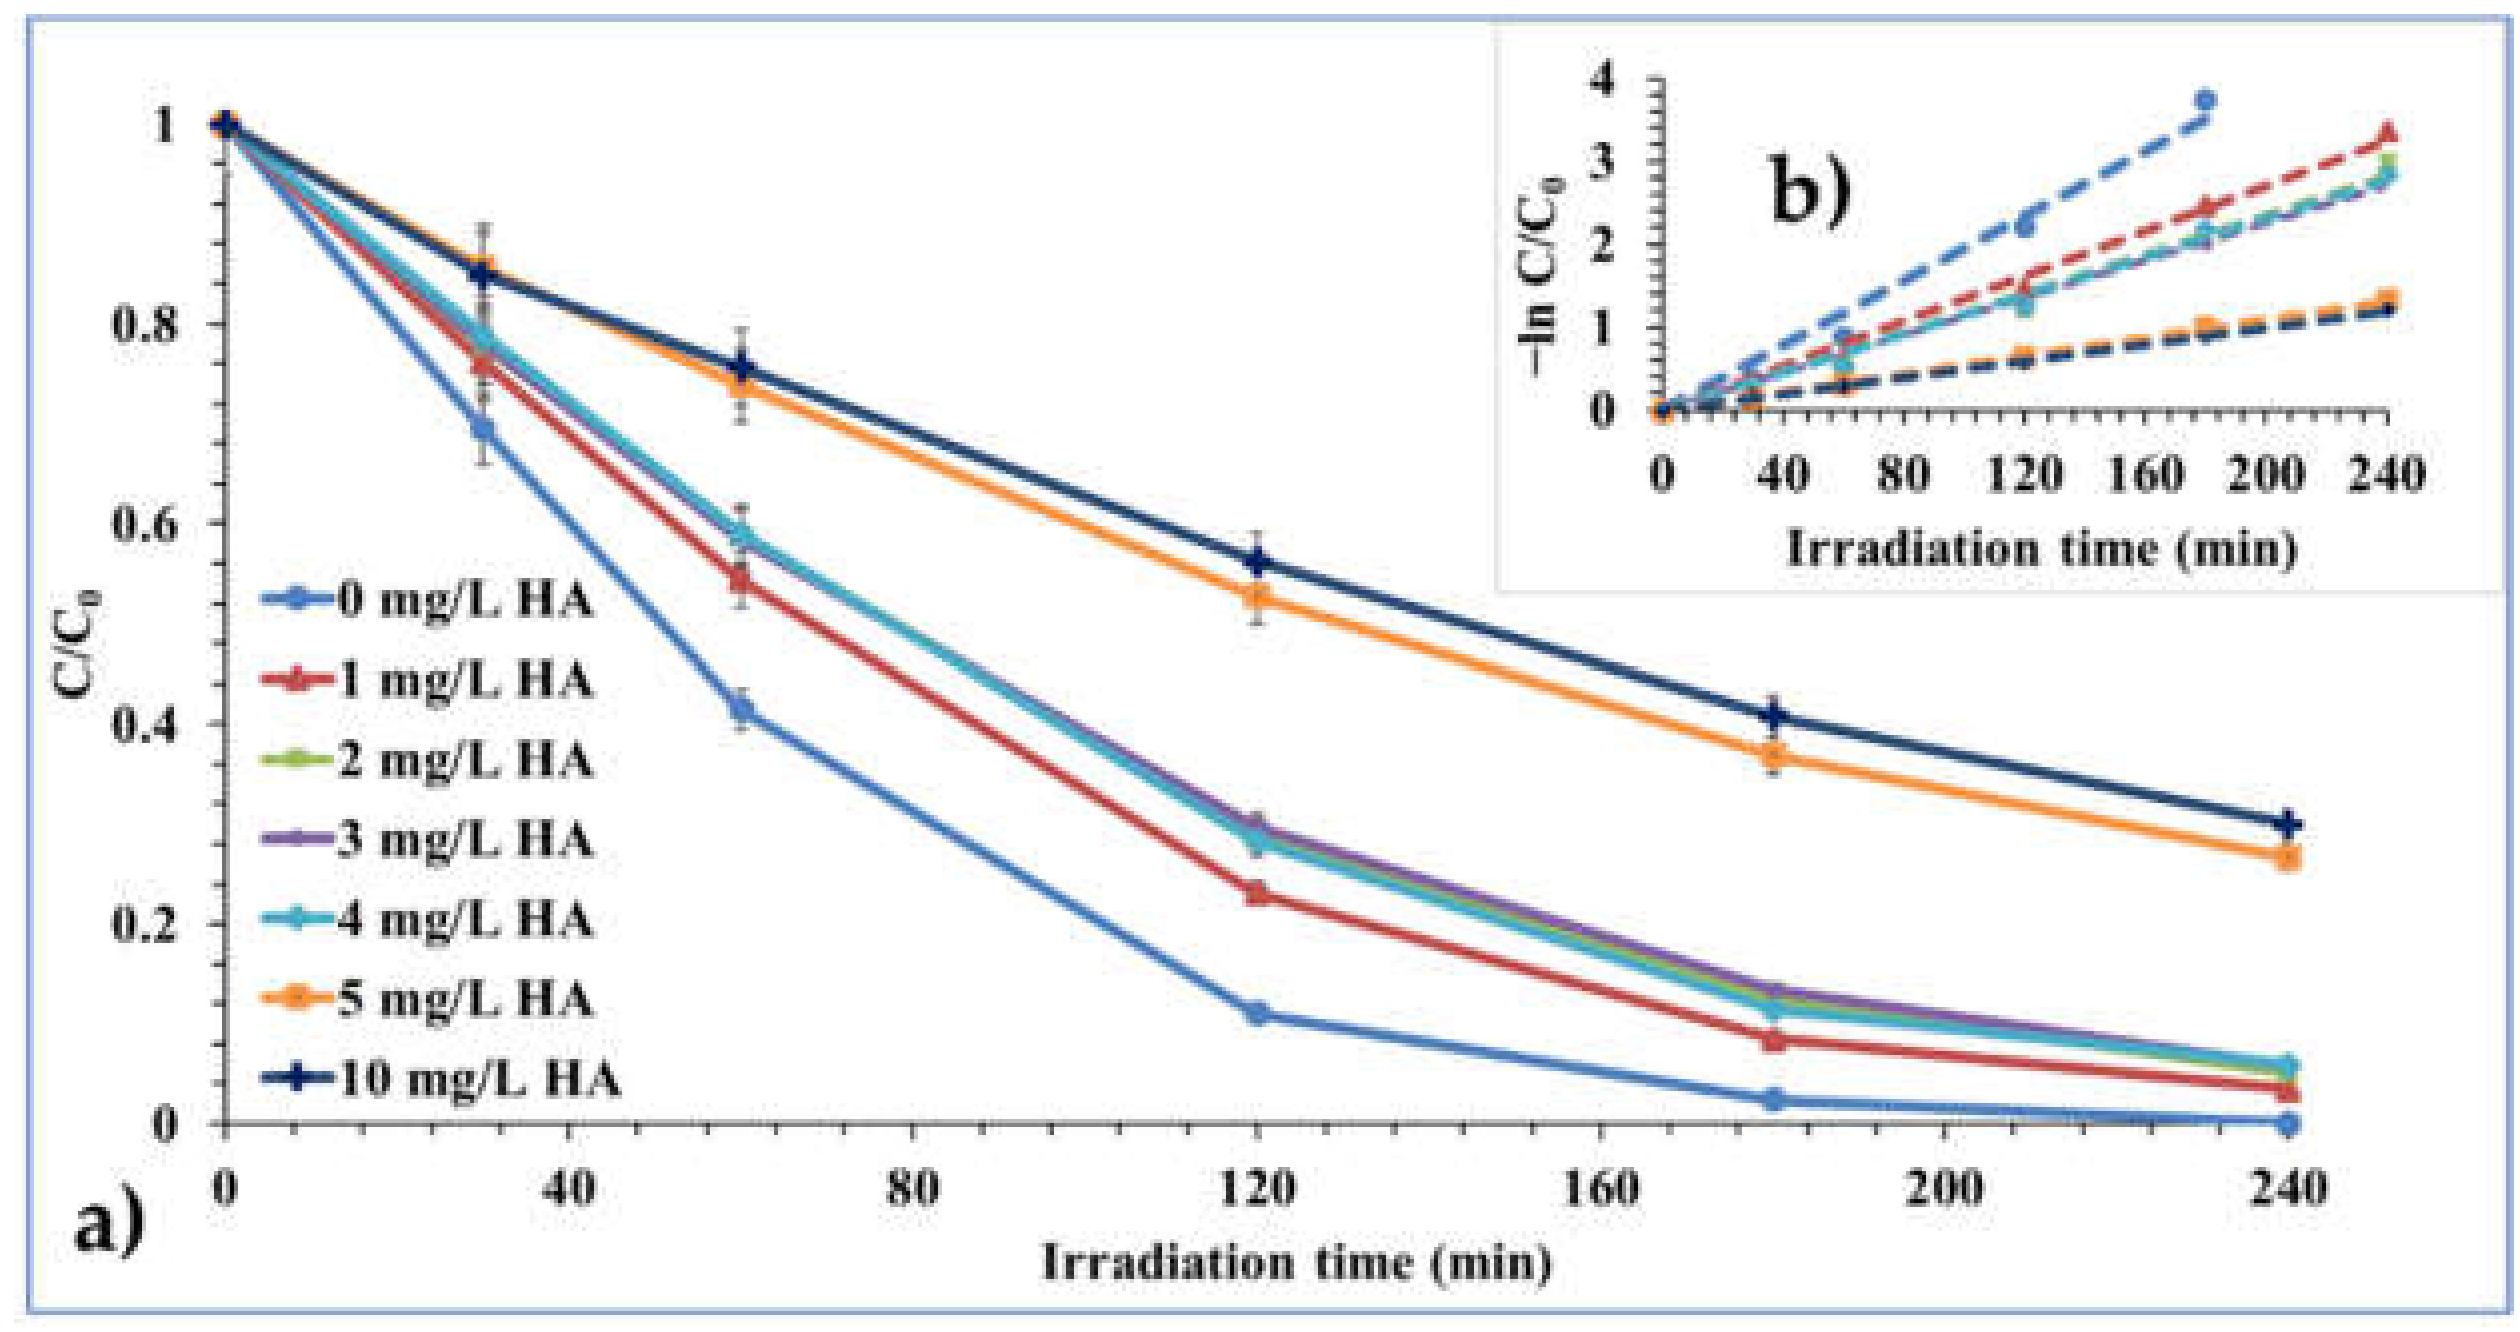
2.2.6. Effect of Hydrogen Peroxide (H2O2) and Humic Acid (HA)

The effects of both hydrogen peroxide (H2O2) as an external oxidant and that of humic acid as a surrogate dissolved organic matter (sDOM) were investigated over the photocatalytic degradation of carbamazepine. Additionally, 1–10 mM and 1–10 mg/L range in concentration for H2O2 and HA, respectively, were tested for their effect over the CBZ photocatalytic degradation process (Figure 16 and Figure 17). From Figure 16, it can be seen that the introduction of H2O2 as an externally added oxidant impeded the photocatalytic degradation rate process. In comparison to 0 mM H2O2, tested concentrations of 1 mM, 2 mM, 3 mM, 4 mM, 5 mM, and 10 mM H2O2 exerted suppression effect over the photocatalytic degradation process of CBZ by the degree of the higher the H2O2 oxidant concentration, the greater the suppression effect exerted (Figure 16). In essence, while the least suppression effect over the photocatalytic degradation process of CBZ was recorded at 1 mM H2O2 with ~90% CBZ degraded, a higher suppression effect occurred at 10 mM H2O2 with ~67% CBZ degradation in comparison to the ≈100% CBZ degraded with no suppression effect exertion and under 0 mM H2O2 condition (Figure 16). Such an outcome of suppression effect from externally added oxidants like H2O2, more so within certain concentration range, has been reported and attributed to factors like extremely low absorption of UV light and scavenging attitude of H2O2 towards hydroxyl (OH) radical under certain reaction conditions [14,18,90].
On the other hand, the introduction of humic acid also exerted a suppression effect over the photocatalytic degradation of CBZ. As can be seen from Figure 17, the introduction of 1 mg/L HA, 2 mg/L HA, 3 mg/L HA, 4 mg/L HA, 5 mg/L HA, and 10 mg/L HA exerted suppression effect over the photocatalytic degradation process of CBZ by the degree of the higher the HA concentration, the greater the suppression effect exerted and vise-versa (Figure 17). Comparatively, while with 0 mg/L HA condition almost ≈100% CBZ degradation was achieved at 240 min irradiation, 1 mg/L HA, 2 mg/L HA, 3 mg/L HA, and 4 mg/L HA concentration were added on the average degraded ~95% CBZ (Figure 17). The photocatalyst CBZ degradation performance depreciated more, even in the presence of a higher 10 mg/L HA concentration where ~71% CBZ degradation was achieved after 240 min irradiation (Figure 17). The decrease in photocatalytic degradation process rate of organic compounds in the presence of humic acid (HA) has been reported and attributed hydroxyl (OH) radical scavenging, photocatalyst surface active site competition, and turbidity effect in presence of HA, which reduces proper light illumination of photocatalyst suspension media [17,90].
Table 4 gives a summarized display of all the investigated photocatalytic parameters per photocatalytic material and their respective effect on CBZ degradation as identified by their estimated photocatalytic degradation rate constant k (min¹), their corresponding correlation factor (R2), half-life t½ (min), and initial and final pH condition variation. For all tested parameters, an average triplicate has been reported with assigned error bars of ±0.05 standard deviation.

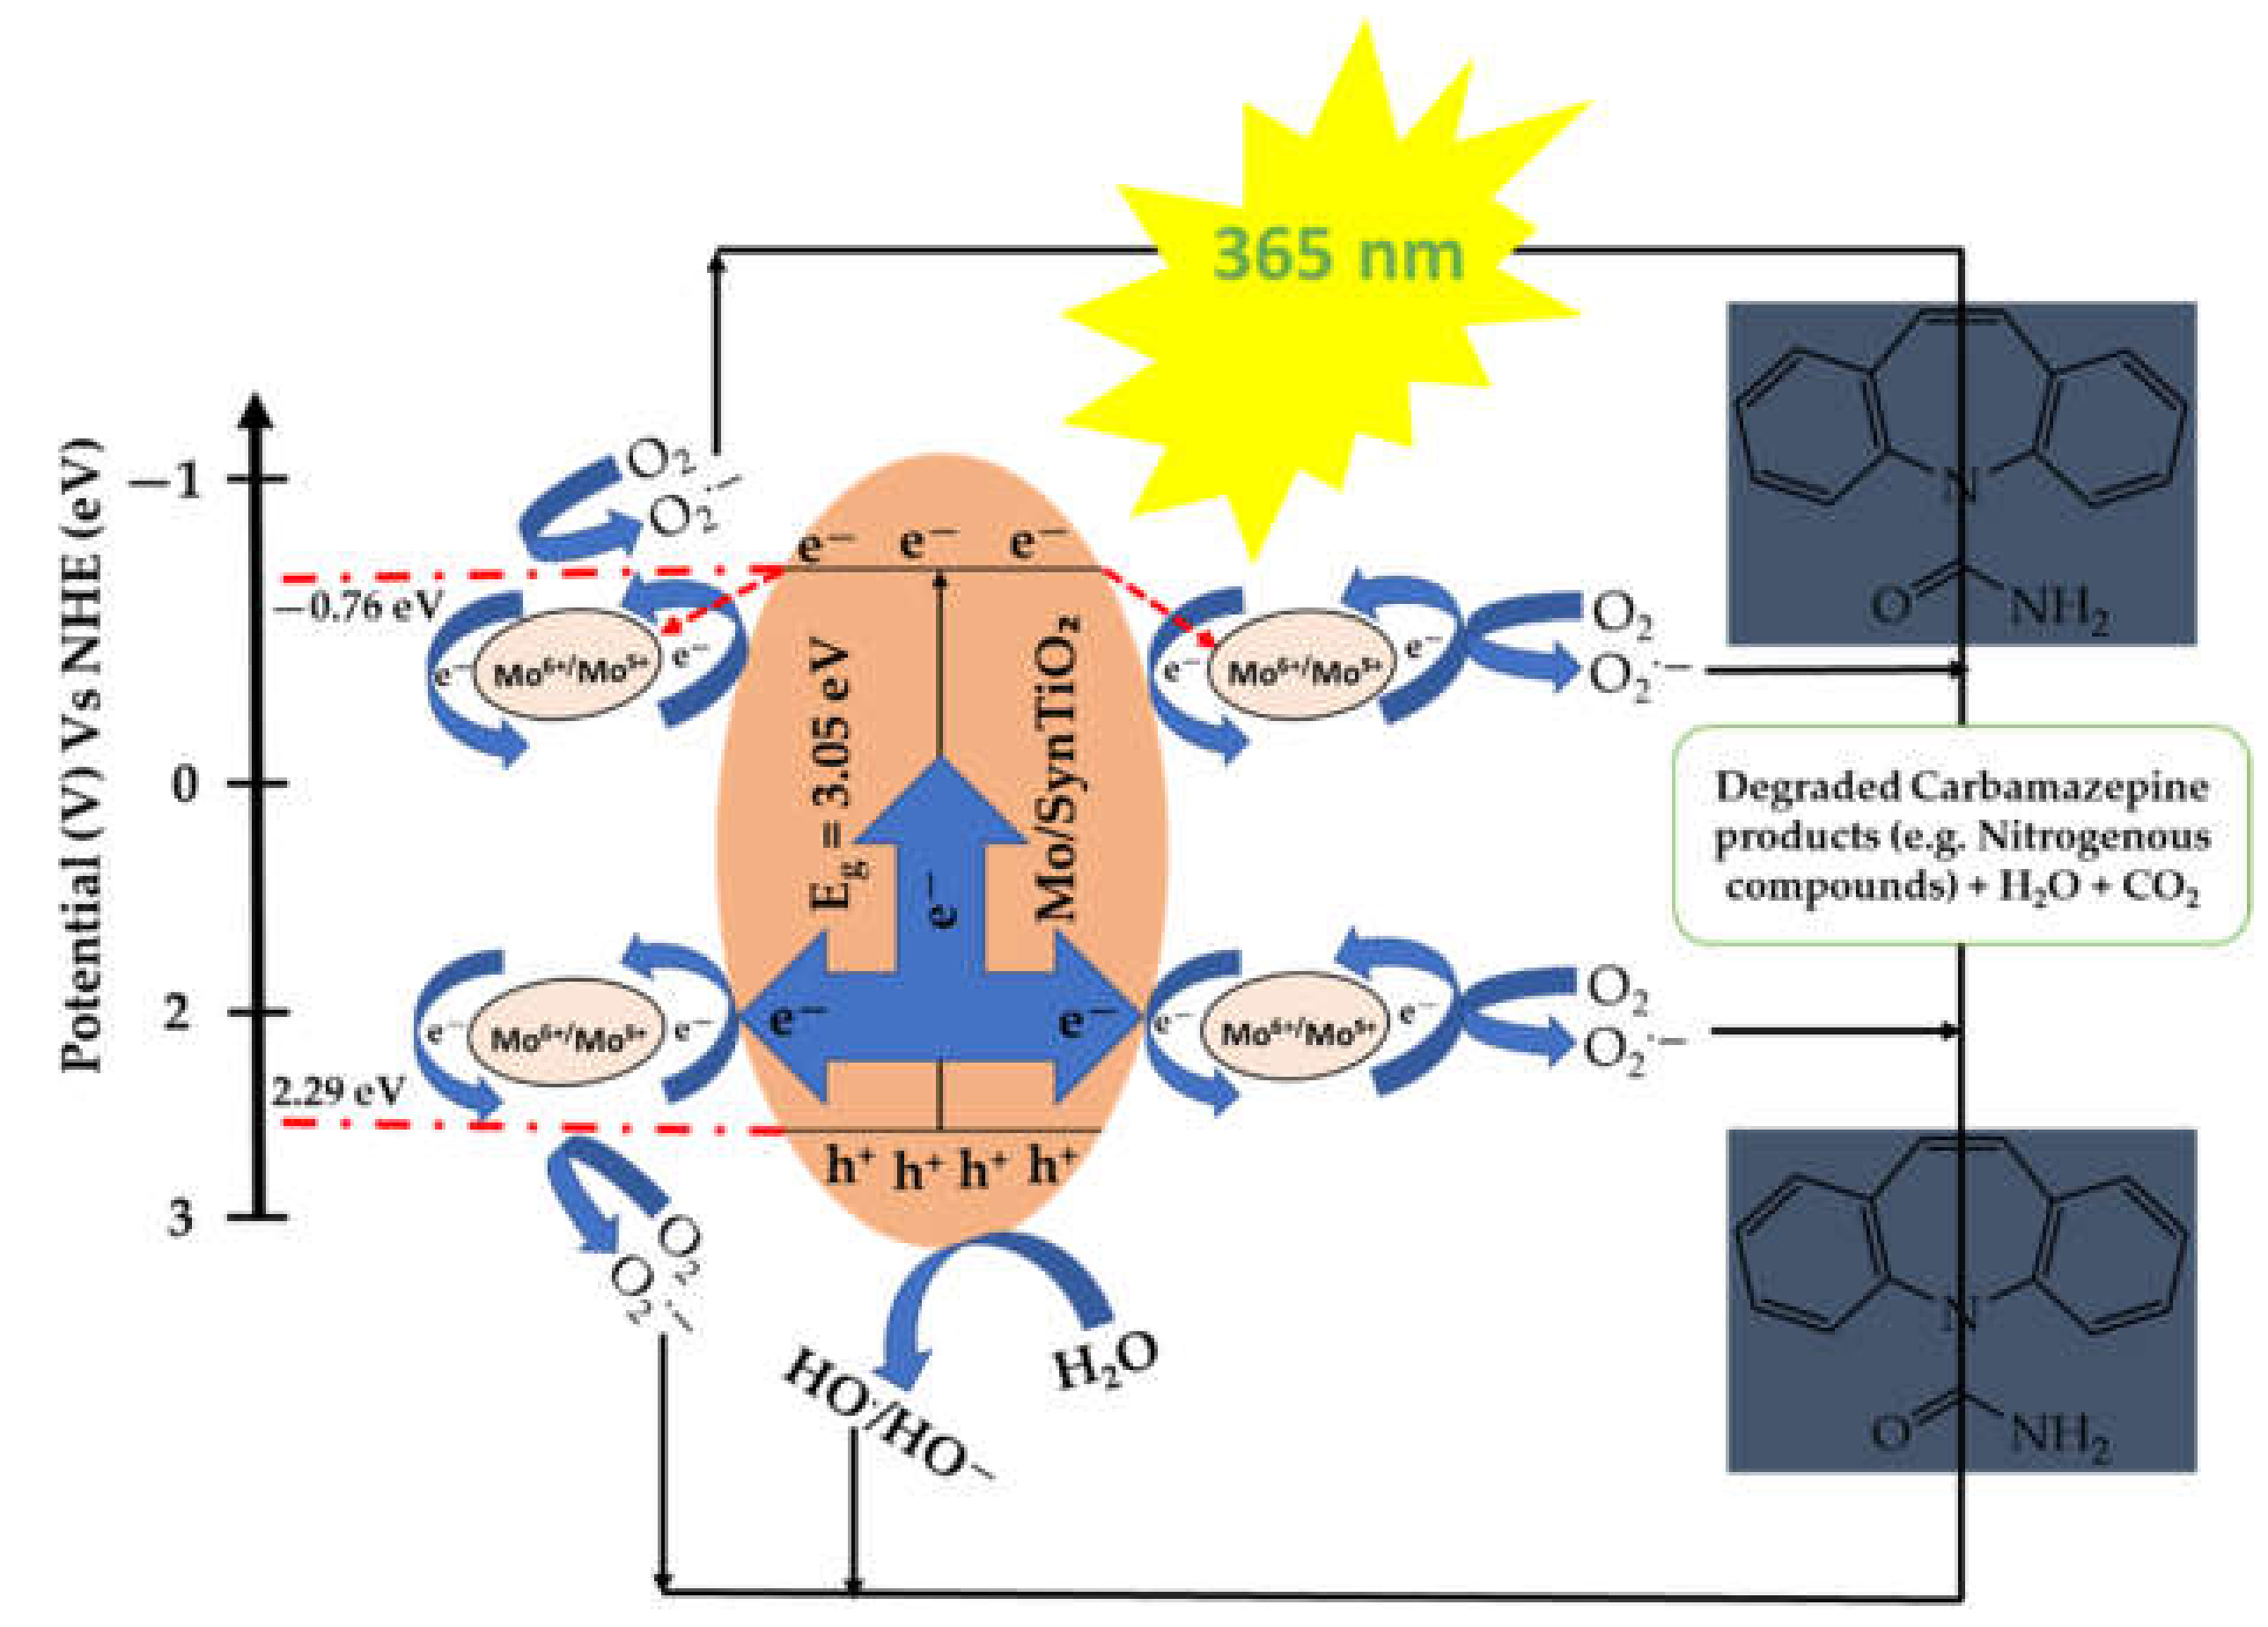
2.3. Proposed Reaction Mechanism

In support of a proposed surface reaction mechanism, the result outcome of the chemical scavenger test was brought into consideration. From Figure 13, Section 2.2.4, basically all the tested chemical scavengers for the investigation of the responsible reactive species into the photocatalytic degradation of carbamazepine exerted a suppressive effect on the degradation rate at some point of the irradiation time window, and in comparison to no scavenger addition. This outcome shows that hole (h+), and electron (e) charge carriers and their respectively photogenerated hydroxyl (OH) and super-oxide anion (O2•−) radicals were involved in the reaction mechanism that eventually drove the photocatalytic degradation of carbamazepine.
Firstly, upon the irradiation of the photocatalyst material and with a sufficient photon energy (E), the electrons at the valence band (VB) are ejected. In about the same time, there is also the generation of hole charge (h+) carriers. The ejected electrons (e) under favorable energetic condition drifts to the conduction band (CB) and by reduction interacts with surface adsorbed oxygen (O2) molecule to generate superoxide anion (O2•−) radicals. In a related charge interaction phenomenon, the generated hole (h+) charge carriers by oxidation interacts with surface adsorbed water molecule to yield hydroxyl (OH) radicals at the valence band (VB).
These radical species are now available to attack the carbamazepine compound and subsequently degrade it to end products of nitrogenous substances, water, and carbon dioxide (Scheme 1) (Figure 13).
In the formation of the reactive species for the degradation of carbamazepine, the Mulliken electronegativity function according to Equations (3) and (4) [18,86,87,88] was employed to derive the potentials of the energy band edge levels of the conduction band (CB) and valence band (VB).
E CB =   χ 0.5 E e E g
E VB =   E CB + E g
where the functions are as follows: ECB is the conduction band edge potential (eV), χ is the electronegativity value estimated as the geometric mean of the individual element electronegativity values (eV) of the Mo/SynTiO2 composite material, Ee is the energy of the free electron on the standard normal hydrogen electrode (NHE) scale (eV), Eg is the estimated energy bandgap (eV) of the Mo/SynTiO2 material composite, while EVB is the valence band edge potential (eV) of the Mo/SynTiO2 material composite, as appropriately expressed in Equations (3) and (4) above.
The obtained band edge energy potential values were adopted to support the interpretation of the involved mechanisms in the proposed CBZ photocatalytic degradation process. From Equation (3), the conduction band (CB) edge potential of the photocatalyst was obtained as (−0.76 eV) (Scheme 1). In comparison to the standard normal hydrogen electrode (NHE) scale potential value of (−0.046 eV) needed for the generation of superoxide anion (O2•−) via e + O2/O2•− pathway, the derived CB edge potential is negative enough to favor the formation of this reactive specie at this level [86,88].
In a similar manner in Equation (4), the obtained valence band (VB) edge potential 2.29 eV of the photocatalyst, in comparison to the (OH/•OH) pair formation value of 1.99 eV on the NHE, is positive enough to favor the generation of hydroxyl (•OH) radical and makes it available at this level [87,88]. More so, superoxide anion (O2) radical generation at the CB via O2 + H+/O2 pathway is also favored as the CB edge potential at a value of 2.29 eV (Scheme 1) which is high and positive enough compared to the 0.682 eV on the standard normal hydrogen electrode (NHE) required for its generation via (O2 + H+/O2) pathway. Additionally, Mo6+/Mo5+ redox pair system energy potential has been reported at +0.4 V [64]. This value is high enough compared to the value (−0.34 eV) obtained in this study by Equation (3) for the SynTiO2 base material and agrees with already-reported value (−0.51 V) for pristine TiO2 [82]. As such, there is favor for the capturing of the generated mobile electron charge (e) by the Mo6+/Mo5+ redox pair in the photocatalyst system. This is vital, as the tendency for charge recombination is restrained and photocatalyst performance efficiency promoted (Figure 8, Scheme 1), although conclusive inference of involved participating reactive species for the elucidation of photocatalytic degradation reaction process mechanism cannot solely be drawn based on trapping test with chemical scavengers given the complex nature of heterogeneous photocatalytic process systems. However, it thus serves as a good base for deeper confirmatory reactive species participatory role tests in the photocatalytic degradation process of organic pollutants in such systems [86,87,88].
In the light of these presented analogies for charge generation, transfer, and reactive species formation, etc., a mechanism that encompasses the participation of all the basic charges/reactive species is therefore suggested for the photocatalytic degradation of carbamazepine according to Scheme 1, and can further be validated by deeper mechanistic insights using advanced measurement protocols like room temperature photoluminescence (RTPL), electrochemical impedance spectroscopy (EIS), as well as electron spin resonance (ESR), etc., for a deeper insight.

3. Materials and Methods

3.1. Chemical Reagents

All chemicals used in the present study were of analytical grade and deployed as purchased without further purification. Titanium isopropyl oxide (TiP) [Ti(O4C12H28] (97%) (Sigma Aldrich, Darmstadt, Germany) and ammonium molybdate tetrahydrate [(NH4)6Mo7O24·4H2O] (99.98%) (Sigma Aldrich, Darmstadt, Germany) were respectively employed as synthesis precursors for Ti and Mo. Ethanol (C2H5OH, 99.5%) (Sigma Aldrich, Darmstadt, Germany) and nitric acid (HNO3, 70%) (Sigma Aldrich, Darmstadt, Germany) were used as solvents for the sol–gel synthesized titania (SynTiO2). Carbamazepine (5H-Dibenz[b,f]azepine-5-carboxamide) [C15H12N2O] (>99%) (Sigma Aldrich, Baden-Württemberg, Germany) was investigated as the model CEC compound for the photocatalytic degradation test. Sodium hydroxide [NaOH] (≥98%) and hydrochloric acid [HCl] (37% wt/v) were both purchased from (Sigma Aldrich, Darmstadt, Germany) and employed for aqueous media pH controls. p-benzoquinone-BQ (2,5-Dimethyl-1,4-benzoquinone) [C6H4O2] (≥98%), isopropyl alcohol-IPA [(CH3)2CHOH] (≥99%), and ammonium oxalate (AO) monohydrate [(NH4)2C2O4·H2O] (≥99%), sodium chloride [NaCl], sodium sulphate [Na2SO4], sodium carbonate [Na2CO3], sodium hydrogen carbonate [NaHCO3], sodium hydrogen phosphate [NaHPO4], ammonium chloride [NH4Cl], iron (iii) chloride [FeCl3], magnesium chloride [MgCl2], aluminum chloride [AlCl3], calcium chloride [CaCl2] (all inorganic salts ≥99% purity), as well as hydrogen peroxide [H2O2] (30 wt./v) and sodium humic acid salt (≥99%), were all purchased from (Sigma Aldrich, Darmstadt, Germany) and employed for their investigative effect on the photocatalytic degradation of carbamazepine by the photocatalyst. Milli-Q water was used for all the photocatalytic test measurements.

3.2. Synthesis of Mo/SynTiO2 Material

  • Sol–Gel Synthesized TiO2 (SynTiO2)
In a typical procedure to prepare TiO2 by sol–gel method [15,16,17], titanium isopropoxide (TiP–8.4 mL) was mixed with ethanol (5 mL) at room temperature, mechanically agitated for about 15 min, and designated as solution A. Meanwhile, solution B was prepared as a mixture of ethanol (10 mL), water (1 mL), and nitric acid (1 mL) added in a precautious way. Afterwards, solution B was added to solution A under stirring to initiate hydrolysis and lasted for 24 h. The resultant thick gel white solution formation was heated to dryness at 80 °C for 12 h, after which the formed powder material was calcined in a muffle furnace at 450 °C for 3 h. Obtained powder material was cooled and collected. The final material was labeled sol–gel synthesized titania (SynTiO2) and stored in an airtight space to protect from humidity while ready for use in the next step of the Mo doping process of the SynTiO2.
  • Mo doping of the Sol–Gel Synthesized TiO2 (SynTiO2)
The doping of sol–gel synthesized titania (SynTiO2) was realized by means of sonochemical preparation route. Specifically, ammonium molybdate tetrahydrate [(NH4)6Mo7O24·4H2O] was used as the inorganic precursor material of Mo. The precursor material was diluted in an aqueous solution of 200 mg of the sol–gel synthesized titania (SynTiO2) powder calculating a 1.5 wt% for the Mo doped SynTiO2 in final solution before sonication. Sonication was performed by a UIP 500HD transducer (Hielscher) as the ultrasound generator in a double-walled glass container with an external cooling regulator under 25 °C during the entire process. The sonication process involved a continuous U/S generation of 1000 W/cm2 for 3 h duration. Afterwards, the solution was centrifuged, substrate was collected, and was dried at 80 °C overnight. A final thermal treatment was performed under ambient temperature up to 150 °C for 2 h. Finally, the obtained molybdenum (1.5 wt%) sonochemically doped sol–gel synthesized titania: Mo (1.5 wt%)/SynTiO2 was deployed for photocatalytic activity test performance evaluations and compared to the sol–gel synthesized titania (SynTiO2) for the preliminary photocatalytic activity performance test.

3.3. Characterization of Mo (1.5 wt%)/SynTiO2 Material

Following successful synthesis, the obtained SynTiO2 and Mo (1.5 wt%)/SynTiO2) materials were characterized. The X-ray diffraction (XRD) analysis measurement for the crystallographic phase analysis of the materials was carried out using a Rigaku D/Max-IIIC diffractometer (RIGAKU, Corp., Tokyo, Japan) with operational functions of CuKα radiation (λ = 0.1541 nm) over the range 2θ = 20–70° at ambient temperature and 35 kV at 25 mA at the rate of 3°/min scan speed [14,15,16,17,18]. Transmission electron microscopy (TEM) measurement was performed with FEITecnaiG2 Spirit (FEI, Hillsboro, OR, USA) for the particle size analysis of the material samples, while Fourier transform infrared (FTIR) spectroscopy measurement was carried out with a Perkin-Elmer Spectrum one FT-IR spectrometer (Thermo-Fischer Scientific, Leicestershire, UK), employing the attenuated total reflection (ATR) method to understand the chemical functional groups present in the synthesized material samples. X-ray photoelectron spectroscopy (XPS) measurement was performed with a PHI 5000 VersaProbe spectrometer (ULVAC PHI, Inc., Kanagawa, Japan) with an AlKα radiation source for the elucidation of the elemental compositions within the chemical environment of the synthesized materials [14,15,16,17,18]. Scanning electron microscopy (SEM) measurement for the surface morphological analysis was done with Zeiss EVO LS10 (Carl Zeiss Microscopy, Hamburg, Germany), with 0.2–30 kV acceleration voltage and 0.5 pA–5 µA probe current attached with energy dispersive x-ray spectroscopy (EDS) detector (Carl Zeiss SmartEDX, Hamburg, Germany), with samples attached to sample holder and prepared with Au using sputter-coating (SEM coating System Machine). The surface area of materials and other related parameters of pore size distribution was measured by the Brunauer–Emmett–Teller (BET) technique recorded on the nitrogen adsorption–desorption isotherm at 76 K employing a Micromeritics 3 Flex version 5.00 (Micromeritics, Norcross, GA, USA) after degassing, while the pore size distribution (PSD) was obtained by Barret Joyner Halenda (BJH) application method [14,15,16,17,18]. The optical properties of the synthesized materials were measured with UV-Vis diffuse reflectance spectroscopy (UV-Vis/DRS) in absolute measurement, employing BaSO4 as the reference plate on a Shimadzu UV-2550 (Scintek Instruments LLC., Manassas, VA, USA) [17,18].

3.4. Determination of the pH Point of Zero Charge (pHpzc) of Mo (1.5 wt%)/SynTiO2 Material

The pH point of zero charge (pHpzc) of the Mo (1.5 wt%)/SynTiO2 material was determined by the reported drift method [14,18]. By procedure, 50 mL of 0.01 M NaCl solution was measured out in conical flasks. The initial pH values of these solutions were adjusted and maintained at room temperature between 2 and 12, using 1 M each of either HCl or NaOH. Upon the stability of the initial pH values, 0.05 g of the catalyst powder was added to each of the measured flask solutions, stirred for 48 h and, and the final pH value of each flask solution containing the catalyst material was measured by employing HANNA, edge pH meter (Woonsocket, RI, USA).

3.5. Photocatalytic Test Measurement

Photocatalytic activity performance measurement of the sample material(s) was performed under 365 nm irradiation wavelength cut-off. An in-house fabricated 200-degree internal reflector for optimal efficiency (99.9%), UV-A, and visible blue wavelength range of 300–475 nm spectral power distribution with 5 Philips Mercury (Hg) lamps-TL-K 40 W/10 R ACTINIC BL REFLECTOR, (Germany) was employed as the irradiation light source [14,15,16,17,18]. Light intensity was measured with Lafayette SPM-7, (Italy) at 1.2 mW/cm2 for the UV-A 365 nm cut-off filter irradiation light source.
A 60 mL working powder suspension volume content of 1 g/L Mo (1.5 wt. %)/SynTiO2 catalyst and 5 mg/L initial carbamazepine concentration, under 365 nm irradiation and at initial natural (unmodified) pH condition, was employed.
In a procedure of the evaluation of the photocatalytic test, 60 mL working suspension media containing the relevant catalyst dosage and initial pollutant concentration of the tested CBZ was firstly introduced into a 100 mL volume capacity cylindrically shaped quartz glass sleeve reactor cell and kept under mechanical agitation for 30 min to establish adsorption–desorption media equilibrium state before irradiation. Afterwards, aqueous media content was maintained under continuous mechanical agitation during light irradiation, with a 30 cm distance maintained between sample and light source throughout the irradiation exposure. Sample aliquots were withdrawn at predetermined time intervals of irradiation. At such pre-set time intervals, about 1 mL sample aliquot of the suspension media under the investigated test reaction condition was withdrawn from the reactor cell, cooled, and filtered through a 0.45 µm CA filter. The filtrate was then ready for the high-performance liquid chromatography (HPLC) analysis monitoring of the CBZ photocatalytic degradation process.
With a retention time of 6 min in a 10 min runtime, CBZ photocatalytic degradation was monitored on Inertsil 5 µm EVO C 18, column 4.6 mm × 150 mm (GL Sciences Inc., Tokyo, Japan), 65% acetonitrile (A)/35% phosphoric acid (prepared with milli-Q water, pH~3) (B) for mobile phase composition, 0.8 mL/min flow rate, and 285 nm wavelength quantification.
CBZ photocatalytic degradation process is assumed to have followed pseudo first-order reaction kinetics, with degradation reaction rate estimate performed as a linear regression slope according to Equation (5) [14,15,16,17,18]:
ln C C 0 = K a p p t
where K a p p ,   C 0 , and C are apparent degradation rate constant, initial concentration, and concentration after time t, respectively.

4. Conclusions

Mo doped sol–gel synthesized titania (Mo (1.5 wt%)/SynTiO2) was prepared via separative synthesis route of sol–gel for the base TiO2 and sonochemical anchorage of Mo onto the SynTiO2. Obtained Mo (1.5 wt%)/SynTiO2 was successfully characterized for structural, morphological/textural, and optical properties. Surface defects and associated occupancy of reactive charge species like hydroxyl (OH) ion from loosely bound H2O molecules, oxide ions (O2) from surface adsorbed molecular oxygen (O2), etc., as modification effect due to the surface residency of Mo dopant is envisaged to have claimed the resulted photocatalytic activity performance enhancement of the Mo (1.5 wt%)/SynTiO2 material.
In evaluation of the photocatalytic activity performance of Mo (1.5 wt%)/SynTiO2 material, almost 100% of initial 5 mg/L CBZ was degraded in 240 min of near UV-Vis 365 nm irradiation and under natural (unmodified) pH conditions. The effects of initial pH, catalyst dosage, initial pollutant, chemical scavenger, contaminant ion (cations and anions), hydrogen peroxide (H2O2), and humic acid (HA) over the photocatalytic degradation of CBZ by the photocatalyst were also investigated and evaluated accordingly. By the investigated effect of chemical scavengers coupled with the measured optical energy bandgap and derived related edge potentials, other plausible pathways for charge generation other than the directly linked ones to photogeneration/induction were suggested as responsible for the photocatalytic degradation process mechanism of CBZ.
Finally, the Mo (1.5 wt%)/SynTiO2 photocatalyst material can potentially be seen as a candidate for the abatement of CBZ degradation and other CEC organic pollutant compounds from water sources.
In the perspective of further studies, proper elucidation of the charge transfer mechanism in the composite material is needed with robust measurement protocols like RTPL, EIS, ESR, etc., while building on the already obtained indicative result outcome of the involved reactive species from the radical scavenging test experiments. Investigation into the toxicity profile of the degraded end products from the CBZ photocatalytic degradation process will also be performed. Evaluation of the immobilized photocatalyst on support to bypass the need for further polishing of the treated water and guarantee quick recovery of the photocatalyst material is worth considering.

Author Contributions

Conceptualization, C.B.A., V.N.S., E.B. and P.K.P.; methodology, C.B.A., V.N.S., I.A., E.B., P.K.P., C.A., Z.T. and C.-D.A.; software, C.B.A., E.B., P.K.P., Z.T. and C.-D.A.; validation, C.B.A., E.B., V.N.S., I.A. and P.K.P.; formal analysis, C.B.A., E.B., V.N.S., I.A. and P.K.P.; investigation, C.B.A.; resources, C.B.A., E.B., V.N.S., I.A., P.K.P., C.A., Z.T. and C.-D.A.; data curation, C.B.A., E.B., P.K.P., Z.T. and C.-D.A.; writing—original draft, C.B.A.; writing—review and editing, V.N.S., P.K.P., E.B. and I.A.; visualization, C.B.A., E.B., V.N.S., I.A., P.K.P., Z.T. and C.-D.A.; supervision, E.B., V.N.S. and I.A.; project administration, I.A. and E.B.; funding acquisition, E.B. and I.A. All authors have read and agreed to the published version of the manuscript.

Funding

This research was funded by the EUROPEAN UNION’S HORIZON RESEARCH AND INNOVATION PROGRAMME under the MARIE SKLOWDOWSKA-CURIE Grant No: 765860 (AQUAlity).

Institutional Review Board Statement

Not applicable.

Informed Consent Statement

Not applicable.

Data Availability Statement

The data presented in this study are available in [Molybdenum Modified Sol–Gel Synthesized TiO2 for the Photocatalytic Degradation of Carbamazepine Under UV Irradiation].

Conflicts of Interest

The authors declare no conflict of interest.

References

  1. United Nations Education and Cultural Organization (UNESCO). The United Nations Water Development Report 3: Water in a Changing World; UNESCO: Paris, France; Berghahn Books: New York, NY, USA, 2009. [Google Scholar]
  2. Fabrega, F.; Marques, M.; Ginebrade, A.; Kuzmanovic, M.; Barcelo, D.; Schuhmacher, M. Integrated Risk Index of Chemical Aquatic Pollution (IRICAP): Case Studies in Iberian Rivers. J. Hazard. Mater. 2013, 263, 187–196. [Google Scholar] [CrossRef] [PubMed]
  3. Schwarzenbach, R.P.; Egli, T.; Hofstetter, T.B.; von Guten, U.; Wehrli, B. Global Water Pollution and Health. Annu. Rev. Environ. 2010, 35, 109–136. [Google Scholar] [CrossRef]
  4. Rasheed, T.; Bilal, M.; Nabeel, F.; Adeel, M.; Iqbal, H.M.N. Environmentally related Contaminants of High Concern: Potential Sources and Analytical Modalities for Detection, Quantification, and Treatment. Environ. Int. 2019, 122, 52–66. [Google Scholar] [CrossRef] [PubMed]
  5. Daughton, C.; Ternes, T.A. Pharmaceuticals and Personal Care Products in the Environment: Agents of Subtle Change? Environ. Health Perspect. 1999, 107, 907–938. [Google Scholar] [CrossRef] [PubMed]
  6. Geissen, V.; Mol, H.; Klumpp, E.; Umlauf, G.; Nadal, M.; van der Pelog, M.; van de Zee, S.E.A.T.M.; Ritsema, C.J. Emerging Pollutants in the Environment: A Challenge for Water Resource Management. Int. Soil Water Conserv. Res. 2015, 3, 57–65. [Google Scholar] [CrossRef]
  7. Pal, A.; Gin, A.Y.-C.; Reinhard, M. Impacts of Emerging Organic Contaminants on Freshwater Resources: Review of Recent Occurrences, Fates, and Effects. Sci. Total Environ. 2010, 408, 6062–6069. [Google Scholar] [CrossRef]
  8. Emerging Pollutants. Available online: http://www.norman-network.net (accessed on 21 February 2022).
  9. Souza, J.C.G.; Ribeiro, A.R.; Barbosa, M.O.; Pereira, M.F.R.; Silva, A.M.T. A Review on Environmental Monitoring of Water Organic Pollutants Identified by EU Guidelines. J. Hazard. Mater. 2018, 344, 146–162. [Google Scholar] [CrossRef]
  10. Liu, J.-L.; Wong, M.-H. Pharmaceuticals and Personal Care Products (PPCPs): A Review on Environmental Contamination in China. Environ. Int. 2013, 59, 208–224. [Google Scholar] [CrossRef]
  11. Barbosa, M.O.; Moreira, N.F.F.; Ribeiro, A.R.; Pereira, M.F.R.; Silva, A.M.T. Occurrence and Removal of Organic Micropollutants: An Overview of the Watch List of EU Decision 2015/495. Water Res. 2016, 94, 257–279. [Google Scholar] [CrossRef]
  12. Tiedeken, E.J.; Tahar, A.; McHugh, B.; Rowan, N.J. Monitoring, Sources, Receptors, and Control Measures for Three European Union Watch List Substances of Emerging Concern in Receiving Waters—A 20 Year Systematic Review. Sci. Total Environ. 2017, 574, 1140–11673. [Google Scholar] [CrossRef]
  13. Yan, Y.; Ok, Y.S.; Kim, K.-H.; Kwon, E.E.; Tsang, Y.F. Occurrences and Removal of Pharmaceuticals and Personal Care Products (PPCPs) in Drinking Water and Water/Sewage Treatment Plants: A Review. Sci. Total Environ. 2017, 596, 303–320. [Google Scholar]
  14. Anucha, C.B.; Altin, I.; Biyiklioglu, Z.; Bacaksiz, E.; Polat, I.; Stathopoulos, V.N. Synthesis, Characterization, and Photocatalytic Evaluation of Manganese (III) Phthalocyanine Sensitized ZnWO4 (ZnWO4MnPc) for Bisphenol A Degradation Under UV Irradiation. Nanomaterials 2020, 10, 2139. [Google Scholar] [CrossRef] [PubMed]
  15. Anucha, C.B.; Altin, I.; Fabbri, D.; Degirmencioglu, I.; Calza, P.; Magnacca, G.; Stathopoulos, V.N.; Bacaksiz, E. Synthesis, and Characterization of B/NaF and Silicon Phthalocyanine- Modified TiO2 and an Evaluation of Their Photocatalytic Removal of Carbamazepine. Separations 2020, 7, 71. [Google Scholar] [CrossRef]
  16. Anucha, C.B.; Altin, I.; Bacaksiz, E.; Degirmencioglu, I.; Kucukomeroglu, T.; Yilmaz, S.; Stathopoulos, V.N. Immobilized TiO2/ZnO Sensitized Copper (II) Phthalocyanine Heterostructure for the Degradation of Ibuprofen under UV Irradiation. Separations 2021, 8, 24. [Google Scholar]
  17. Anucha, C.B.; Altin, I.; Bacaksiz, E.; Kucukomeroglu, T.; Belay, M.H.; Stathopoulos, V.N. Enhanced Photocatalytic Activity of CuWO4 Doped TiO2 Photocatalyst towards Carbamazepine under UV Irradiation. Separations 2021, 8, 25. [Google Scholar] [CrossRef]
  18. Anucha, C.B.; Altin, I.; Bacaksiz, E.; Stathopoulos, V.N.; Polat, I.; Yasar, A.; Yuksel, O.F. Silver Doped Zinc Stannate (Ag-ZnSnO3) for the Photocatalytic Degradation of Caffeine under UV Irradiation. Water 2021, 13, 1290. [Google Scholar] [CrossRef]
  19. Jimenez-Holgado, C.; Crimatopoulos, C.; Stathopoulos, V.N.; Sakkas, V. Investigating the Utility of Fabric Phase Sorptive Extraction and HPLC-UV-Vis/DAD to Determine Antidepressant Drugs in Environmental Aqueous Samples. Separations 2020, 7, 39. [Google Scholar] [CrossRef]
  20. Jones, A.O.; Lester, J.N.; Voulvoulis, N. Pharmaceutical: A threat to drinking water? Trends Biotechnol. 2005, 23, 163–167. [Google Scholar] [CrossRef]
  21. Heberer, T.; Mechlinski, A.; Franck, B.; Knappe, A.; Massmann, G.; Pekdeger, A.; Fritz, B. Field Studies on the Fate and Transport of Pharmaceutical of Pharmaceutical Residues in Bank Filtration. Ground Water Monit. Remediat. 2004, 24, 70–77. [Google Scholar] [CrossRef]
  22. Koplin, D.W.; Furlong, E.T.; Meyer, M.T.; Thurman, E.M.; Zaugg, S.D.; Barber, L.B.; Buxton, H.T. Pharmaceuticals, Hormones, and Other Organic Wastewater Contaminants in US Streams, 1999–2000: A National Reconnaissance. Environ. Sci. Technol. 2002, 36, 1202–1211. [Google Scholar]
  23. Anumol, T.; Vijayanandan, A.; Park, M.; Philip, L.; Snyder, S. Occurrence and Fate of Emerging Trace Organic Chemicals in Wastewater Plants in Chennai, India. Environ. Int. 2016, 92, 33–42. [Google Scholar] [CrossRef] [PubMed]
  24. Sun, Q.; Lv, M.; Hu, A.; Yang, X.; Yu, C.-P. Seasonal Variation in The Occurrence of and Removal of Pharmaceuticals and Personal Care Products in Wastewater Plant in Xiamen, China. J. Hazard. Mater. 2014, 277, 69–75. [Google Scholar] [CrossRef] [PubMed]
  25. Bernabeu, A.; Vercher, R.F.; Santos-Juanes, L.; Simon, P.J.; Lardin, C.; Martinez, M.A.; Vicente, J.; González, R.; Llosá, C.; Arques, A.; et al. Solar Photocatalysis as a Tertiary Treatment to Remove Emerging Pollutants from Wastewater Treatment Plant Effluents. Catal. Today 2011, 161, 235–240. [Google Scholar] [CrossRef]
  26. Prieto-Rodriguez, L.; Miralles-Cuevas, S.; Oller, I.; Aguera, A.; Puma, G.L.; Malato, S. Treatment of Emerging Contaminants in Wastewater Treatment Plant (WWTP) Effluents by Solar Photocatalysis Using Low TiO2 Concentrations. J. Hazard. Mater. 2012, 211, 131–137. [Google Scholar] [CrossRef]
  27. Miranda-Garcia, N.; Suarez, S.; Sanchez, B.; Coronado, J.M.; Malato, S.; Maldonado, M.I. Photocatalytic Degradation of Emerging Contaminants in Municipal Wastewater Treatment Plant Effluents Using Immobilized TiO2 in a Solar Pilot Plant. Appl. Catal. B Environ. 2011, 103, 294–301. [Google Scholar] [CrossRef]
  28. Loaiza-Ambuludi, S.; Panizza, M.; Oturan, N.; Oturan, M.A. Removal of the Anti-inflammatory Drug Ibuprofen from Water Using Homogeneous Photocatalysis. Catal. Today 2014, 224, 29–33. [Google Scholar] [CrossRef]
  29. Fujishima, A.; Rao, T.; Tyrk, D. Titanium Dioxide Photocatalysis. J. Photochem. Photobiol. C 2000, 1, 1–21. [Google Scholar] [CrossRef]
  30. Kisch, H. Semiconductor Photocatalysis-Mechanistic and Synthetic Aspects. Angew. Chem. Int. Ed. 2013, 52, 812–847. [Google Scholar] [CrossRef]
  31. Dal Santo, V.; Naldoni, A. Titanium Dioxide Photocatalysis. Catalysts 2018, 8, 591. [Google Scholar] [CrossRef] [Green Version]
  32. Pandis, P.K.; Kalogirou, C.; Kanellou, E.; Vaitsis, C.; Savvidou, M.G.; Sourkouni, G.; Zorpas, A.; Argirusis, C. Key Points of Advanced Oxidation Processes (AOPs) for Wastewater, Organic Pollutants and Pharmaceutical Waste Treatment: A Mini Review. ChemEngineering 2022, 6, 8. [Google Scholar] [CrossRef]
  33. Schneider, J.; Matsuoka, M.; Takeuchi, M.; Zhang, J.; Horiuchi, Y.; Anpo, M.; Bahnemann, D.W. Understanding TiO2 Photocatalysis: Mechanisms and Materials. Chem. Rev. 2014, 114, 9919–9986. [Google Scholar] [CrossRef] [PubMed]
  34. Mills, A.; LeHunte, S. An Overview of Semiconductor Photocatalysis. J. Photochem. Photobiol. A 1997, 108, 1–35. [Google Scholar] [CrossRef]
  35. Tong, H.; Ouyang, S.X.; Bi, Y.P.; Umezawa, N.; Oshikiri, M.; Ye, J.H. Nano-Photocatalytic Materials: Possibilities and Challenges. Adv. Mater. 2012, 24, 229–251. [Google Scholar] [CrossRef] [PubMed]
  36. Pelaez, M.; Nolan, N.T.; Pillai, S.C.; Seery, M.K.; Falaras, P.; Kontos, A.G.; Dunlop, P.S.M.; Hamilton, J.W.J.; Byrne, J.A.; O’Shea, K.; et al. A Review on the Visible Light Active Titanium Dioxide Photocatalyst for Environmental Applications. Appl. Catal. B Environ. 2012, 125, 331–349. [Google Scholar] [CrossRef] [Green Version]
  37. Rigoletto, M.; Calza, P.; Gaggero, E.; Laurenti, E. Hybrid Materials for the Removal of Emerging Pollutants in Water: Classification, Synthesis, and Properties. Chem. Eng. J. Adv. 2022, 10, 100252. [Google Scholar] [CrossRef]
  38. Anucha, C.B.; Altin, I.; Bacaksiz, E.; Stathopoulos, V.N. Titanium (TiO2)-Based Photocatalyst Materials Activity Enhancement for Contaminants of Emerging Concern (CECs) Degradation: In the Light of Modification Strategies. Chem. Eng. J. Adv. 2022, 10, 100262. [Google Scholar] [CrossRef]
  39. Zouraris, D.; Karnaouri, A.; Pandis, P.K.; Argirusis, C.; Topaka, E.; Karantonis, A. On the Integration of Lytic Polysaccharide MonoOxygenases (LPMOs) with Phosphoric Acid Swollen Cellulose (PASC). J. Electroanal. Chem. 2021, 897, 115540. [Google Scholar] [CrossRef]
  40. Vaitsis, C.; Mechili, M.; Argirusis, N.; Kanellou, E.; Pandis, P.K.; Sourkouni, G.; Zorpas, A.; Argirusis, C. Ultra-Assisted Preparation Methods of Nanoparticles for Energy-Related Applications. In Nantotechnology and the Environment, 1st ed.; Sen, M., Ed.; IntechOpen: London, UK, 2020; Volume 1, p. 170. [Google Scholar]
  41. Aviles-Garcia, O.; Espino-Valencia, J.; Romero-Romero, R.; Rico-Cerda, J.L.; Arroyo-Albiter, M.; Solis-Casados, D.A.; Natividad-Rangel, R. Enhanced Photocatalytic Activity of Titania by Co-Doping with Mo and W. Catalysts 2018, 8, 631. [Google Scholar] [CrossRef] [Green Version]
  42. Huang, J.-G.; Guo, X.-T.; Wang, B.; Li, L.-Y.; Zhao, M.-X.; Dong, L.-L.; Liu, X.-J.; Huang, Y.-T. Synthesis and Photocatalytic Activity of Mo-Doped TiO2 Nanoparticles. J. Spectrosc. 2015, 2015, 681850. [Google Scholar]
  43. Zhang, M.; Wu, J.; Hou, J.; Yang, J. Molybdenum and Nitrogen Co-Doped Titanium Dioxide Nanotube Arrays with Enhanced Visible Light Photocatalytic Activity. Sci. Adv. Mater. 2013, 5, 535–6541. [Google Scholar] [CrossRef] [Green Version]
  44. Yang, H.; Li, X.; Wang, A.; Wang, Y.; Chen, Y. Photocatalytic Degradation of Methylene Blue by MoO3 Modified TiO2 under Visible Light. Chin. J. Catal. 2014, 35, 140–147. [Google Scholar]
  45. Ghorai, T.K. Photocatalytic Degradation of 4-Chlorophenol by CuMoO4-Doped TiO2 Nanoparticles Synthesized by Chemical Route. J. Phys. Chem. 2011, 1, 28–36. [Google Scholar]
  46. Surenjan, B.; Sambandam, B.; Pradeep, T.; Philip, L. Synthesis, Characterization and Performance of Visible Light Active C-TiO2 for Pharmaceutical Photodegradation. J. Environ. Chem. Eng. 2017, 5, 757–767. [Google Scholar] [CrossRef]
  47. Sambandam, B.; Surenjan, A.; Philip, L.; Pradeep, T. Rapid Synthesis of C-TiO2: Tuning the Shape from Spherical to Rice Grain Morphology for Visible Light Photocatalytic Application. ACS Sustain. Chem. Eng. 2015, 3, 1321–1329. [Google Scholar] [CrossRef]
  48. Czech, B.; Buda, W. Photocatalytic Treatment of Pharmaceutical Wastewater Using Multiwall-Carbon Nanotubes/TiO2/SiO2 Nanocomposites. Environ. Res. 2015, 137, 176–184. [Google Scholar] [CrossRef]
  49. Poudel, M.B.; Yu, C.; Kim, H.K. Synthesis of Conducting Bifunctional Polyaniline@Mn-TiO2 Nanocomposites for Supercapacitor Electrode and Visible Light Driven Photocatalysis. Catalysts 2020, 10, 546. [Google Scholar] [CrossRef]
  50. Sharotri, N.; Sharma, D.; Sud, D. Experimental and Theoretical Investigations of Mn-N-co-doped TiO2 Photocatalyst for Visible Light Induced Degradation of Organic Pollutants. J. Mater. Res. Technol. 2019, 8, 3995–4009. [Google Scholar] [CrossRef]
  51. Anpo, M.; Takeuchi, M. The Design and Development of Highly Reactive Titanium Oxide Photocatalyst Operating under Visible Light Irradiation. J. Catal. 2003, 216, 505–516. [Google Scholar] [CrossRef]
  52. Vasquez, G.C.; Peche-Herrero, M.A.; Maestra, D.; Cremades, A.; Ramirez-Castellanos, J.; Gonzales-Calbert, J.M.; Piqueras, J. Effects of Transition Metal Doping on the Growth and Properties of Rutile TiO2 Nanoparticles. J. Phys. Chem. C 2013, 117, 1941–1947. [Google Scholar] [CrossRef]
  53. Kale, G.; Arbuj, S.; Chothe, U.; Khore, S.; Nikam, L.; Kale, B. Highly Crystalline Ordered Cu-doped TiO2 Nanostructure by Paper Templated Method: Hydrogen Production and Dye Degradation under Natural Sunlight. J. Comp. Sci. 2020, 4, 48. [Google Scholar] [CrossRef]
  54. Pant, B.; Park, M.; Park, S.-J. MoS2/CdS/TiO2 Ternary Composite Incorporated into Carbon Nanofibres for the Removal of Organic Pollutants from Water. Inorg. Chem. Comm. 2019, 102, 113–119. [Google Scholar] [CrossRef]
  55. Jedsukontorn, T.; Ueno, T.; Saito, N.; Hunsom, M. Narrowing Band Gap Energy of Defective black TiO2 Fabricated by Solution Plasma Process and Its Photocatalytic Activity on Glycerol Transformation. J. Alloys Compd. 2018, 757, 188–199. [Google Scholar] [CrossRef]
  56. Poudel, M.B.; Shin, M.; Kim, H.J. Interface Engineering of MIL-88 Derived MnFe-LDH and MnFe2O3 on Three-Dimensional Carbon Nanofibres for The Efficient Adsorption of Cr (VI), Pb(II), and AS(III) Ions. Sep. Purif. Technol. 2022, 287, 120463. [Google Scholar] [CrossRef]
  57. Poudel, M.B.; Awasthi, G.P.; Kim, H.J. Novel Insight into The Adsorption of Cr (VI) and Pb(II) Ions by MOF Derived Co-Al Layered Double Hydroxide @ Hematite Nanorods on 3D Porous Carbon Nanofibre Network. Chem. Eng. J. 2021, 417, 129312. [Google Scholar] [CrossRef]
  58. Li, B.; Zhao, Z.; Gao, F.; Wang, X.; Qiu, J. Mesoporous Microspheres Composed of Carbon-Coated TiO2 Nanocrystals with Exposed {001} Facets for Improved Visible Light Photocatalytic Activity. Appl. Catal. B Environ. 2014, 147, 958–964. [Google Scholar] [CrossRef]
  59. Husain, S.T.; Siddiqa, A.; Siddiq, M.; Ali, S. Iron-Doped Titanium Dioxide Nanotubes: A Study of Electrical, Optical and Magnetic Properties. J. Nanopart. Res. 2013, 13, 6517–6525. [Google Scholar] [CrossRef]
  60. Zener, B.; Matoh, L.; Carraro, G.; Miljevc, B.; Korsec, R.C. Sulfur-Nitrogen-and Platinum-Doped Titania Thin Films with High Catalytic Effiency under Visible-Light Illumination. Beilstein J. Nanotechnol. 2018, 9, 1629–1640. [Google Scholar] [CrossRef] [Green Version]
  61. Simsek, E.B.; Kilic, B.; Asgin, M.; Akan, A. Graphene Oxide Based Heterojunction TiO2-ZnO Catalysts with Outstanding Photocatalytic Performance for Bisphenol-A, Ibuprofen, and Flurbiprofen. J. Ind. Eng. Chem. 2018, 59, 115–126. [Google Scholar] [CrossRef]
  62. Singh, M.; Duklan, N.; Singh, P.; Sharma, J. Synthesis and Photocatalytic Activity of Anatase TiO2 Nanoparticles for Degradation of Methyl Orange. AIP Conf. Proc. 2018, 1953, 030075. [Google Scholar] [CrossRef]
  63. Kumaravel, V.; Rhatigan, S.; Mathew, S.; Michel, M.C.; Bartlett, J.; Nolan, M.; Hinder, S.J.; Gasco, A.; Ruiz-Palomar, C.; Hermosilla, D.; et al. Mo Doped TiO2: Imapact on Oxygen Vacancies, Anatase Phase Stability, and Photocatalytic Activity. J. Phys. Mater. 2020, 3, 025008. [Google Scholar] [CrossRef]
  64. Luo, S.-Y.; Yan, B.-X.; Shen, J. Enhancement of Photoelectric and Photocatalytic Activities: Mo Doped TiO2 Thin Films Deposited by Sputtering. Thin Solid Films 2012, 522, 361–365. [Google Scholar] [CrossRef]
  65. Li, S.; Jena, P. Origin of the Anatase to Rutile Conversion of Metal-Doped TiO2. Phys. Rev. B 2009, 79, 201–204. [Google Scholar] [CrossRef] [Green Version]
  66. Inturi, S.N.R.; Boningari, T.; Suidan, M.; Smirniotis, P.G. Visible-Light Induced Photodegradation of Gas Phase Acetonitrile Using Aerosol-Made Transition Metal (V, Cr, Fe, Mn, Mo, Ni, Cu, Y, Ce, and Zr) Doped TiO2. Appl. Catal. B Environ. 2014, 144, 333–342. [Google Scholar] [CrossRef]
  67. Chaudri, S.M.; Gawal, P.M.; Sane, P.K.; Sontakke, S.M.; Nemade, P.R. Solar Light-Assisted Photocatalytic Degradation of Methylene Blue with Mo/TiO2: A Comparison with Cr- and Ni-Doped TiO2. Res. Chem. Intermed. 2018, 44, 3115–3134. [Google Scholar] [CrossRef]
  68. Stefa, S.; Lykaki, M.; Fragkoulis, D.; Binas, V.; Pandis, P.K.; Stathopoulos, V.N.; Konsolakis, M. Effect of the Preparation Method on the Physicochemical Properties of the CO Oxidation Performance of Nanostructured CeO2/TiO2. Processes 2020, 8, 847. [Google Scholar] [CrossRef]
  69. Lykaki, M.; Stefa, S.; Carabiniero, S.A.C.; Pandis, K.; Stathopoulos, V.N.; Konsolakis, M. Facet-Dependent Reactivity of Fe2O3/CeO2 Nanocomposites: Effects of Ceria Morphology on CO Oxidation. Catalyst 2019, 9, 371. [Google Scholar] [CrossRef] [Green Version]
  70. Tavallaei, H.; Jafarpour, M.; Feizpour, F.; Rezaeifard, A.; Farrokhi, A.A. Cooperative Effect in a Novel Bimetallic Mo-V Nanocomplex Catalyzed Selective Aerobic C-H Oxidation. ACS Omega 2019, 4, 3601–3610. [Google Scholar] [CrossRef]
  71. Meng, L.; Zang, X.; Tang, Y.; Su, K.; Kong, J. Hierarchically Porous-Silicon Carbon Nitrogen Hybrid Materials towards Highly Efficient and Selective Adsorption of Organic Dyes. Sci. Rep. 2015, 5, 7910. [Google Scholar] [CrossRef] [Green Version]
  72. Salmas, C.E.; Stathopoulos, V.N.; Pomonis, P.J.; Androutsopoulos, G.P. Pore Structure-Chemical Composition Interactions of New High Surface Area Manganese Based Mesoporous Materials. Materials Preparation, Characterization, and Catalytic Activity. Langmuir 2002, 18, 423–432. [Google Scholar] [CrossRef]
  73. Corberan, V.C.; Rives, V.; Stathopoulos, V.N. Recent Applications of Nanometal Oxide Catalyst in Oxidation Reactions. In Advanced Nanomaterials for Catalysis and Energy, Synthesis, Characterizations and Applications; Elsevier: Amsterdam, The Netherlands, 2019; pp. 227–293. [Google Scholar]
  74. Thommes, M.; Kaneko, K.; Neimark, A.V.; Olivier, J.P.; Rodriguez-Reinoso, F.; Rouquerol, J.; Sing, K.S.W. Physisorption of Gases with Special Reference to the Evaluation of Surface Area and Pore Size Distribution (IUPAC Technical Report). Pure Appl. Chem. 2015, 87, 1051–1069. [Google Scholar] [CrossRef] [Green Version]
  75. McFarland, E.W. Catalysis by Doped Oxides. Chem. Rev. 2013, 113, 4391–4427. [Google Scholar] [CrossRef] [PubMed]
  76. Stathopoulos, V.N.; Belessi, V.C.; Costa, C.N.; Neophytides, S.; Falaras, P.; Efstathiou, A.M.; Pomonis, P.J. Catalytic Activity of High Surface Area Mesoporous Mn-Based Mixed Oxides for the Deep Oxidation of Methane and Lean-NOx reduction. Stud. Surf. Sci. Catal. 2000, 130, 1529–1534. [Google Scholar]
  77. Pandis, P.K.; Perros, D.E.; Stathopoulos, V.N. Doped Apatite-type Lanthanum Silicates in CO Oxidation Reaction. Catal. Comm. 2018, 114, 98–103. [Google Scholar] [CrossRef]
  78. Damaskinos, C.M.; Vasiliades, M.A.; Stathopoulos, V.N.; Efstathiou, A.M. The Effect of CeO2 Preparation Method on the Carbon Pathways in Dry Reforming of Methane on Ni/CeO2 Studied by Transient Techniques. Catalysts 2019, 9, 621. [Google Scholar] [CrossRef] [Green Version]
  79. Goula, M.A.; Charisiou, N.D.; Pandis, P.K.; Stathopoulos, V.N. A Ni/Apatite-type Lanthanum Silicate Supported Catalyst in Glycerol Steam Reforming Reaction. RSC Adv. 2016, 6, 78954–78958. [Google Scholar] [CrossRef]
  80. Bespalko, Y.; Kuznetsova, T.; Kriger, T.; Chesalov, Y.; Lapina, O.; Ischenko, A.; Larina, T.; Sadykov, V.; Stathopoulos, V. La2Zr2O7/LaAlO3 Composite Prepared by Mixing Precipitated Precursors: Evolution of its Structure under Sintering. Mater. Chem. Phys. 2020, 251, 123093. [Google Scholar] [CrossRef]
  81. Trens, P.; Sthatopoulos, V.N.; Hudson, M.J.; Pomonis, P. Synthesis and Characterization of Packed Mesoporous Tungstenosilicates: Application to the Catalytic Dehydrogenation of 2-Propanol. Appl. Catal. A 2004, 263, 103–108. [Google Scholar] [CrossRef]
  82. Park, H.; Park, Y.; Kim, W.; Choi, W. Surface Modification of TiO2 Photocatalyst for Environmental Applications. J. Photochem. Photobiol. C Photochem. Rev. 2013, 15, 1–20. [Google Scholar] [CrossRef]
  83. Esposito, S.; Ditaranto, N.; Dell’Aglli, G.; Nasi, R.; Rivolo, P.; Bonelli, B. Effective Inclusion of Sizeable Amounts of Mo within TiO2 Nanoparticles Can Be Obtained by Reverse Micelle Sol-Gel Synthesis. ACS Omega 2021, 6, 5379–5388. [Google Scholar] [CrossRef]
  84. Luster, E.; Avisar, D.; Horovitz, I.; Lozzi, L.; Baker, M.A.; Grilli, R.; Mamane, H. N-Doped TiO2-Coated Ceramic Membrane for Carbamazepine Degradation in Different Water Qualities. Nanomaterials 2017, 7, 206. [Google Scholar] [CrossRef] [Green Version]
  85. Achilleos, A.; Hapeshi, E.; Xekoukoulotakis, N.P.; Mantzavinos, D.; Fatta-Kassinos, D. UV-A and Solar Photodegradation of Ibuprofen and Carbamazepine Catalyzed by TiO2. Sep. Sci. Technol. 2010, 45, 1564–1570. [Google Scholar] [CrossRef]
  86. Sin, J.-C.; Lam, S.-M.; Zheng, H.; Lin, H.; Li, H.; Tham, K.-O.; Mohamed, A.R.; Lim, J.-W.; Qin, Z. Magnetic NiFe2O4 Nanoparticles Decorated on N-Doped BiOBr Nanosheets for Expeditious Visible Light Photocatalytic Phenol Degradation and Hexavalent Chromium Reduction Via a Z-Scheme Heterojunction Mechanism. Appl. Surf. Sci. 2021, 559, 149966. [Google Scholar] [CrossRef]
  87. Lam, S.-M.; Jaffari, Z.H.; Sin, J.-C.; Zheng, H.; Lin, H.; Li, H.; Mohamed, A.R.; Ng, D.-Q. Surface Decorated Coral-Like Magnetic BiFeO3 with Au Nanoparticles for Effective Sunlight Photodegradation of 2,4-D and E-coli Inactivation. J. Mol. Liq. 2021, 326, 115372. [Google Scholar] [CrossRef]
  88. Lam, S.-M.; Sin, J.-C.; Zheng, H.; Lin, H.; Li, H.; Qin, Z.; Lim, J.W.; Mohamed, A.R. Z-Scheme MoO3 Anchored-Hexagonal Rod Like ZnO/Zn Photoanode for Effective Wastewater Treatment, Copper Reduction Accompanied with Electricity Production in Sunlight-Powered Photocatalytic Cell. Sep. Purif. Technol. 2021, 265, 118495. [Google Scholar] [CrossRef]
  89. Kudlek, E.; Dudziak, M.; Bohdziewicz, J. Influence of Inorganic Ions and Organic Substances on the Degradation of Pharmaceutical Compound in Water Matrix. Water 2016, 8, 532. [Google Scholar] [CrossRef] [Green Version]
  90. Haroun, L.; Salaun, M.; Menard, A.; Lagault, C.-Y.; Bellenger, J.-P. Photodegradation of Carbamazepine and Three Derivatives Using TiO2 and ZnO: Effect of pH, Ionic Strength, and Natural Organic Matter. Sci. Total Environ. 2014, 475, 16–22. [Google Scholar] [CrossRef]
Figure 1. (a) XRD measurement for: unmodified SynTiO2 (black line) and Mo/SynTiO2 (red line); TEM measurement for (b) unmodified SynTiO2; and (c) Mo/SynTiO2 sample materials.
Processes 10 01113 g001
Figure 2. FTIR measurement for unmodified SynTiO2 (black line) and modified Mo/SynTiO2 (red line).
Processes 10 01113 g002
Figure 3. XPS measurement: (X) survey spectrum of unmodified SynTiO2 (black line), and modified Mo/SynTiO2 (red line) and deconvoluted elemental spectra of (a) Ti 2p; (b) O 1s; and (c) Mo 3d for modified Mo/SynTiO2 material sample.
Processes 10 01113 g003
Figure 4. SEM measurement images of (a) unmodified SynTiO2, and (c) modified Mo/SynTiO2, and their corresponding EDS maps for (b) unmodified SynTiO2 and (d) modified Mo/SynTiO2.
Processes 10 01113 g004
Figure 5. N2 adsorption–desorption isotherm curve at 77 K for (a) SynTiO2 and (b) Mo/SynTiO2 material samples.
Processes 10 01113 g005
Figure 6. Energy bandgap (Eg) estimates for: (a) unmodified SynTiO2 and (b) modified Mo/SynTiO2 material samples.
Processes 10 01113 g006
Figure 7. (a) Preliminary photocatalytic test performance of SynTiO2 (blue line) and Mo/SynTiO2 (red line); and (b) their corresponding photocatalytic degradation rate constant (k) under test conditions of 1 g/L catalyst dosage, 5 mg/L initial CBZ concentration, initial natural (unmodified) pH 5.84, and 365 nm UV irradiation.
Processes 10 01113 g007
Figure 8. pH point of zero charge (pHpzc) plot of Mo (1.5 wt%)/SynTiO2 material.
Processes 10 01113 g008
Figure 9. (a) Effect of pH on the photocatalytic degradation performance of 1/g/L Mo/SynTiO2 over 5 mg/L initial CBZ concentration under 365 nm irradiation, and (b) their corresponding photocatalytic degradation rate constant (k).
Processes 10 01113 g009
Figure 10. (a) Effect of catalyst dosage on the photocatalytic degradation performance of Mo/SynTiO2 over 5 mg/L initial CBZ concentration under natural (unmodified) pH 5.84, and 365 nm irradiation; and (b) their corresponding photocatalytic degradation rate constant (k).
Processes 10 01113 g010
Figure 11. (a) Effect of initial CBZ concentration on the photocatalytic degradation performance of 1 g/L Mo/SynTiO2 under natural (unmodified) pH 5.84, and 365 nm irradiation, and (b) their corresponding photocatalytic degradation rate constant (k).
Processes 10 01113 g011
Figure 12. Photolysis effect (without catalyst), dark effect with 1 g/L Mo/SynTiO2, heat effect with 1 g/L Mo/SynTiO2, and heat effect without photocatalyst over the degradation of 5 mg/L initial CBZ concentration under natural (unmodified) pH 5.84, and 365 nm UV irradiation.
Processes 10 01113 g012
Figure 13. (a) Chemical scavenger effect on the photocatalytic degradation performance of 1 g/L Mo/SynTiO2 over 5 mg/L initial CBZ concentration under natural (unmodified) pH 5.84, and 365 nm irradiation; and (b) their corresponding photocatalytic degradation rate constant (k).
Processes 10 01113 g013
Figure 14. (a) Cation effect on the photocatalytic degradation performance of 1 g/L Mo/SynTiO2 over 5 mg/L initial CBZ concentration under natural (unmodified) pH 5.84 and 365 nm irradiation, and (b) their corresponding photocatalytic degradation rate constant (k).
Processes 10 01113 g014
Figure 15. (a) Anion effect on the photocatalytic degradation performance of 1 g/L Mo/SynTiO2 over 5 mg/L initial CBZ concentration under natural (unmodified) pH 5.84 and 365 nm irradiation, and (b) their corresponding photocatalytic degradation rate constant (k).
Processes 10 01113 g015
Figure 16. (a) H2O2 effect on the photocatalytic degradation performance of 1 g/L Mo/SynTiO2 over 5 mg/L initial CBZ concentration under natural (unmodified) pH 5.84 and 365 nm irradiation; and (b) their corresponding photocatalytic degradation rate constant (k).
Processes 10 01113 g016
Figure 17. (a) HA effect on the photocatalytic degradation performance of 1 g/L Mo/SynTiO2 over 5 mg/L initial CBZ concentration under natural (unmodified) pH 5.84, and 365 nm irradiation; and (b) their corresponding photocatalytic degradation rate constant (k).
Processes 10 01113 g017
Scheme 1. Mo/SynTiO2 proposed photocatalytic degradation process mechanism of CBZ.
Processes 10 01113 sch001
Table 1. Material properties of unmodified SynTiO2 and modified Mo/SynTiO2 material samples.
Estimated/Measured Characterization Data
Materials* dXRD (nm)# dTEM (nm)SBET (m2/g)Vp (cm3/g)Dp (nm)Eg (eV)
SynTiO214.2416.02133.870.082.323.30
Mo/SynTiO216.1024.5543.300.076.233.05
* dXRD, average crystallite size estimated by XRD, # dTEM average particle size estimated by TEM, SBET, surface area, Vp, total pore volume, Dp, average pore size, Eg, energy band gap.
Table 2. Physico-chemical properties of carbamazepine (CBZ).
Chemical Property/NameCarbamazepine
Chemical structure Processes 10 01113 i001
Molecular formulaC15H12N2O
CAS No.298-46-4
Molecular weight, g/mol236.27
Solubility in ethanol, g/L50
pKa13.9
Table 3. Comparative photocatalytic activity performance summary of the few highlighted Mo containing modified photocatalyst materials and their operating conditions with respect to the present study *.
Catalyst Material and Dopant AmountPollutant and Initial Conc.Catalyst AmountRadiation SourceEfficiency (%)Irradiation. Time (min)Ref
(1 wt% W-1 wt% Mo)-TiO215.56 × 105 mol/L 4CP2 × 104 kg/LUV97% Degradation, 74% Mineralization100[41]
Mo (2%)-TiO220 mg/L MB0.2 gSolar LightAlmost 100% Degradation300[42]
Mo-N (1%)-TiO210 mg/L MB4 cm2 TNA thin film of Mo-N-TiO2VLAlmost 100% Degradation180[43]
0.25 (MoO3/P25)15 mg/L MB0.01 gVL38% Removal150[44]
CuMoO4 (5 mol %)-TiO250 ppm 4CP1 g/LUV-Vis96.9% decolouration180[45]
Mo (1.5 wt%)/TiO25 mg/L CBZ1 g/LUVAlmost 100% Degradation240This Study
* 4CP = 4-Chlorophenol, MB = Methylene Blue, CBZ = Carbamazepine, P25 = Degussa P25 (commercial powder), TNA = TiO2 Nanotube Array, UV = Ultraviolet, VL = Visible Light.
Table 4. Tested photocatalytic parametric indicators effect over photocatalytic degradation of CBZ under 365 nm UV irradiation and their related degradation rate constant k (min¹), correlation coefficient R2, half-life t½ (min), and initial and final pH values.
TestDegradation Rate Constant k (min−1)R2Half-Life (t1/2) (min)pHinitalpHfinal
Preliminary Test for Photocatalyst Material #
SynTiO2 (control)0.00040.91331732.503.333.03
2 wt% Mo/SynTiO20.01950.989835.545.845.20
Tested Parametric Effects Over Photocatalyst Material Performance of Mo (1.5 wt%)/SynTiO2
Effect of pH #
pHnatural 5.840.01950.989835.545.845.16
pH 30.00130.984533.083.323.71
pH 90.01010.961168.619.177.47
pH 110.00680.9915101.9110.8910.46
Effect of Catalyst Dosage #
0.5 g/L0.00390.9923177.695.895.11
0.75 g/L0.00820.996884.516.405.12
1 g/L0.01950.989835.546.375.18
1.25 g/L0.00990.997270.006.505.36
Effect of Initial Pollutant Concentration #
5 mg/L0.01950.989835.545.835.36
10 mg/L0.00640.9976108.286.425.16
15 mg/L0.00620.9991111.776.524.97
20 mg/L0.00540.9937128.336.355.11
Effect of Chemical Scavengers #
No scavenger0.01950.989835.545.855.19
1 mM Isopropyl alcohol (IPA)0.0160.987743.316.355.99
1 mM Benzoquinone (BQ)0.0130.987853.316.406.01
1 mM Ammonium oxalate (AO)0.01590.98543.586.426.52
Effect of Contaminant Ion: cations #
No Cation0.01950.989835.545.845.28
1 mM Fe3+0.00680.9987101.916.434.95
1 mM Mg2+0.010.994469.306.417.79
1 mM Ca2+0.00790.996187.726.525.50
1 mM Al3+0.00940.994173.726.467.88
1 mM NH4+0.01850.993537.465.826.52
Effect of Contaminant Ion: anions #
No Anion0.01950.989835.545.875.24
1 mM HCO30.01450.988147.796.335.89
1 mM CO320.01540.997445.006.427.94
1 mM SO420.01630.976942.526.456.23
1 mM HPO420.0130.989653.316.518.11
1 mM Cl0.01580.987743.865.896.54
Effect of Hydrogen Peroxide (H2O2) #
0 mM H2O20.01950.989835.545.895.13
1 mM H2O20.00910.994576.156.345.77
2 mM H2O20.00870.994179.666.377.75
3 mM H2O20.00860.989880.586.405.33
4 mM H2O20.00670.9897103.436.527.69
5 mM H2O20.00540.9984128.336.326.4
10 mM H2O20.00470.9963147.456.337.75
Effect of Humic Acid (HA) #
0 mg/L HA0.01950.989835.545.855.12
1 mg/L HA0.01350.995151.336.336.74
2 mg/L HA0.01170.993259.236.428.24
3 mg/L HA0.01160.995559.746.476.22
4 mg/L HA0.01130.995461.336.526.22
5 mg/L HA0.00550.9996126.006.517.65
10 mg/L HA0.0050.9996138.606.455.95
# Tests performed under 365 nm near UV-vis irradiation.
Publisher’s Note: MDPI stays neutral with regard to jurisdictional claims in published maps and institutional affiliations.

