Article

Phytosterol, Tocopherol and Carotenoid Retention during Commercial Processing of Brassica napus (Canola) Oil

1
School of Behavioural and Health Sciences, Australian Catholic University, Brisbane, QLD 4014, Australia
2
School of Agricultural, Environmental and Veterinary Sciences, Charles Sturt University, Wagga Wagga, NSW 2650, Australia
3
The Gulbali Institute, Charles Sturt University, Wagga Wagga, NSW 2650, Australia
4
School of Dentistry and Medical Sciences, Charles Sturt University, Wagga Wagga, NSW 2650, Australia
5
NSW Department of Primary Industries, Agricultural Institute, Pine Gully Road, Wagga Wagga, NSW 2650, Australia
*
Author to whom correspondence should be addressed.
Processes 2022, 10(3), 580; https://doi.org/10.3390/pr10030580
Submission received: 16 February 2022 / Revised: 9 March 2022 / Accepted: 10 March 2022 / Published: 16 March 2022

Abstract

:
Brassica napus (canola) seed is a rich source of phytosterols, tocopherols and carotenoids, which all have recognized health benefits, although these are reduced or lost during crude oil refinement. Many studies are now outdated, so new research to monitor bioactive retention through current processing techniques is warranted. In this work, canola seed, in-process seed, and oil samples were collected from the major stages of five commercial canola oil processes. Analysis of phytosterols, tocopherols and carotenoids indicated seed pre-treatment enhanced bioactive concentrations in the crude oil. Although the bleaching step in each process eliminated all carotenoids, high concentrations of phytosterols and tocopherols remained in the refined oil across all processes, with losses notably lower than those found in previous reports. Moreover, crude oil samples from a two-stage cold pressing process showed greatly enriched concentrations of tocopherols (+122%), sterols (+140%) and carotenoids (+217%). The results show that modern Australian canola oil processing retains high phytosterol and tocopherol concentrations and warrants further investigation into bioactive enrichment strategies. Given the growing interest in health-enhanced foods, this study provides opportunities for nutrition and health-enhanced oil products and the potential for adding value in the edible oil industry.

1. Introduction

Since its introduction in the late 1960s, Brassica napus (canola) production has escalated from 10 million tons to over 50 million tons worldwide annually [1]. Currently, worldwide consumption of canola oil is ranked the third highest of the edible oils, behind soybean and palm oil. Canola is an important crop for Australia, as it is the largest locally produced oilseed crop. Approximately 60% of the canola seed produced within Australia is exported [2,3], with the remainder processed at local commercial plants. As with other edible vegetable oils, the world market for canola oil has been driven by yield and extended shelf life by prolonging oxidative stability. More recently, oil quality and composition have emerged as potential market drivers due to increasing consumer preference for more natural and health-beneficial food products [4].
Canola contains a desirable fatty acid composition, in particular, high concentrations of mono- and polyunsaturated fatty acids, low concentrations (6.5–8%) of saturated fatty acids, and a desirable omega-3:omega-6 ratio. Additionally, canola oil contains several bioactive compounds that possess important beneficial health properties, including phytosterols, tocopherols, and carotenoids. Phytosterols, or plant sterols, are known for their low-density lipoprotein (LDL) cholesterol-lowering properties [5]. Canola oil is rich in β-sitosterol, campesterol and brassicasterol, which exist as free and esterified forms [6]. Tocopherols exhibit vitamin E properties, are naturally occurring antioxidants, and play an important role in oil stability [5] and human health. High concentrations of α- and γ-tocopherol exist in refined canola oil with total tocopherol concentrations exceeding those found in olive, sunflower, and palm oils [7]. Carotenoids are chemically related to vitamin A and are crucial for skin and eye health and the prevention of disorders involving oxidative processes, including several types of cancer and cardiovascular diseases [8,9]. β-carotene and lutein are the primary carotenoids present in canola oil. β-carotene exhibits antioxidant properties and vitamin A activity, while lutein aids in preventing macular degeneration and is present in the eye to actively filter harmful light, reducing the amount of light reaching the retina [10].
Conventional seed and oil processing causes considerable physical and chemical changes in the oil and substantial decreases in the concentrations of these bioactives [11,12,13]. Seed preparation, which involves heating or drying the seeds before oil extraction, has varied effects on bioactive concentrations. Previous studies reported increased degradation of tocopherols and phytosterols as seed-drying temperature increased, with 71–77% lost while drying at 40–60 °C, and >95% lost at 120 °C [14,15]. Microwave pre-treatment of the seed greatly enhances bioactives in the oil and yields oils with higher nutritional profiles [16]. Similarly, heating or roasting the seed enhances bioactive concentrations [17,18].
The two main commercial processes used for oil extraction are expeller pressing and solvent extraction. Both methods involve initial seed preparation and pressing to release the oil (expeller press oil) and produce a cake. The cake is further processed by solvent extraction using food-grade hexane to produce solvent-extracted oil. Cold pressing is another technique that has gained popularity during the last decade. Although not achieving the high yields of expeller pressing or solvent extraction, its milder processing conditions are more appealing to consumers than solvent extraction. Previous studies have compared bioactive concentrations in Chinese and Canadian canola/rapeseed oil products relative to the extraction procedure, with contradictory results [19,20].
Canola oil refining typically involves degumming, neutralization, bleaching, and deodorisation [11]. The loss of bioactive compounds through degumming is dependent on whether acid, water or a combination of both (TOP degumming) is used. A previous study reported a 6% increase in total sterol content in crude soybean oil following water degumming, a 1.5% decrease following acid degumming and a 6% loss in total tocopherol levels for both methods [21]. Another study reported an 11% loss in total tocopherols following degumming [22]. Moderate losses of bioactives can occur during neutralization with losses ranging from 3–30% for sterols and 6–48% for tocopherols reported [12,22]. The type of chemical, concentration, temperature, and duration of treatment during neutralization have been identified as important factors affecting bioactive retention [22]. Bleaching removes pigments, including the carotenoids, which give the oil a darker, yellow color. This stage is responsible for most carotenoid loss during edible oil refining [13]. Deodorisation is the last stage in oil refining and is considered the most detrimental to bioactive compounds due to the high temperatures applied (200–260 °C). Employed to rid the oil of all remaining unattractive properties, deodorisation also heavily degrades, or eliminates, all heat-sensitive compounds remaining in the oil [11,12]. Oil deodorisation processes have been substantially improved during the last 25 years to promote bioactive retention and increase the nutritional benefits of oil products [12,20].
Given the advances in oil processing technology during the last two decades, the literature needs to be updated to reflect current practices. To our knowledge, only one study has been published comparing bioactive constituents in oil samples across entire processing chains; however, that study was conducted 20 years ago and involved comparing canola, corn, and soybean oils, rather than the different processing methods used for a single commodity [23]. The current study reports on the phytosterol, tocopherol and carotenoid concentrations in canola seed, press cake, and oil samples from different stages of five separate commercial canola oil processes. This study aims to investigate the various canola oil production processes and discover how they influence the concentrations of several classes of bioactive compounds at different production stages.

2. Materials and Methods

2.1. Chemicals

β-carotene (purity ≥97%), α-tocopherol (purity ≥96%), γ-tocopherol (purity ≥96%), β-sitosterol (purity >85%), brassicasterol (purity ≥98%), cholesterol (purity >99%), and cholesterol oleate (purity >98%) standards were purchased from Sigma-Aldrich (Sydney, Australia). Lutein standard (purity ≥95%) was purchased from Extrasynthese (Genay, France) and campesterol (purity ≈65%) was purchased from Thermo Fisher Scientific (Melbourne, Australia). Solvents used for extraction and analysis included 95% HPLC grade hexane (Scharlau, Adelaide, Australia) and HPLC grade ethyl acetate (Sigma-Aldrich, Sydney, Australia).

2.2. Processing Plant Samples

Seed and oil samples from five separate processes were collected from Australian plants: expeller + solvent extraction with chemical refining (BC), expeller extraction with physical refining (EP), expeller extraction with chemical refining (EC), cold pressing with physical refining (CP) and cold pressing with partial refining (bleaching only—CB). Two batches of seed and oil samples were obtained from each process, the first in March 2016 and the second in April 2016. Seed/oil samples were mixed thoroughly before sample preparation for analyses. Samples from the process CP were obtained in April due to a scheduled plant shut down at the time of the first sampling event.
Samples were taken from the major stages of each process and sampling was scheduled to ensure the oil sampled at each refining stage corresponded to the sampled starting seed (i.e., for a process with a 6-h duration, refined oil was sampled 5 h after the crude oil sample was taken, and 6 h after the starting seed was sampled). After sampling, seed samples were placed in sealed containers with desiccant sachets to control seed moisture. Oil samples were placed in sealed vials directly after sampling, wrapped in foil, and placed in cool storage (4 °C). Samples were then delivered to the laboratory on ice no later than 24 h after sampling, except for the CP set, which was delivered three days after sampling. Sampling was performed in consultation with each processing plant to determine the best suite of accompanying samples. To maintain anonymity, detailed processes for each plant cannot be specifically described. However, a general overview of each process and the sampling points are presented in Figure 1.
More frequent sampling was possible for process BC, resulting in additional seed and cake samples (Figure 1, process BC, samples 1b–1d). Also, process CB involved a two-stage cold pressing method, whereby the first press oil is bleached for human consumption and the second press oil is sold as livestock feed (Figure 1, process CB, samples 2b and 3b). The results for the first press oil are discussed with the other processes, while the second press oil is discussed in Section 3.5 only.

2.3. Sample Preparation and Laboratory Oil Extraction

Oil was extracted from canola seeds in the laboratory, as previously described [24]. In brief, 60 g of canola seed was ground, and oil extracted through glass funnels (pre-washed with hexane and lined with cotton wool) with 100 mL hexane (50 mL initially and then 2 × 25 mL at 5 min intervals). The hexane was removed by rotary evaporation at 40 °C to obtain pure oil.

2.4. Tocopherol, Sterol, and Carotenoid Analysis

Tocopherols, sterols, and carotenoids were quantified using normal phase high performance liquid chromatography—diode array detection with tandem mass spectrometry (HPLC-DAD-MS/MS) as previously described [25]. Before analysis, oil samples were diluted (0.25 g oil in 10 mL hexane), filtered (nylon, 0.45 µm), and placed in amber glass autosampler vials at 4 °C. The main tocopherols in canola, α- and γ-tocopherol, were quantified using DAD and MS. However, an interference that appeared in all bleached oil samples obscured the α-tocopherol peak on the DAD, hence, MS was used to quantify α-tocopherol in those samples. The interference was suspected to be the formation of conjugated trienes, based on the peak shape in the UV spectrum (294 nm) recorded on the DAD. DAD was used to quantify γ-tocopherol as previous work revealed the γ-tocopherol response of the DAD was more precise than that of the MS [26].

2.5. Statistical Analysis

All samples were analyzed in duplicate, and several samples were selected randomly for duplication of the entire laboratory process. Regression analysis was used to construct standard curves to determine bioactive concentrations. All statistical analyses were conducted using R software [27] running in the RStudio integrated development environment software [28]. One way ANOVA and Duncan’s Multiple Range test under the agricolae package [29] were used to investigate significant differences in samples from processes BC and CB.
Since each process in this study comprised different stages, and there were differences in the starting seed material, tests of significance were not computed to compare processes. Instead, the average concentrations for each analyte in the refined oil are reported with percentage loss/gain of analyte concentrations after each sampling point.

3. Results and Discussion

3.1. Bioactive Concentrations in Untreated Seed

Factors including genotype (variety), growing location and climatic conditions, availability of nutrients during development, and post-harvest handling and storage can affect canola seed quality, hence the overall bioactives (tocopherols, phytosterols and carotenoids) concentrations, oxidative stability, and oil quality [4,11]. Wide concentration ranges have been reported for these bioactives in unconditioned canola seeds, hence, exploring initial seed bioactive concentrations is important to ensure their concentrations fall within typical ranges and establish a baseline for each process. Concentrations of tocopherols, phytosterols and carotenoids in the untreated seed varied considerably between batches for all processes (depicted by the error bars in Figure 2). The average tocopherol concentrations in the unconditioned seeds were 68–398 mg/kg oil for α-tocopherol and 263–561 mg/kg oil for γ-tocopherol (Figure 2A). These are consistent with previously reported values for Australian canola genotypes: 76–336 mg/kg oil and 163–924 mg/kg oil for α- and γ-tocopherols, respectively [30]. The variation observed is expected and likely due to natural seed variations, since wide ranges have been observed for bioactive compounds in Brassica napus varieties from Australia [24], and internationally [31]. Concentrations of carotenoids (Figure 2B) and phytosterols (Figure 2C,D) were also within normal ranges [2,21,24,31]. Interestingly, seeds sampled from process CP contained higher carotenoid concentrations, yet lower tocopherol and phytosterol than seeds sampled from the other processes (Figure 2). Phytosterols are segregated into free (Figure 2C) and esterified (Figure 2D) forms. Although normally combined and reported as total phytosterols, results from previous studies suggest that distinguishing between the two forms may provide important information about factors affecting their concentrations [6,7,31]. Assuming 100% as free + esterified sterols, the proportion of free sterols in seeds and crude oil was similar for all processes, with β-sitosterol existing as 47% free, 53% esterified; campesterol 37% free, 63% esterified; and brassicasterol 60% free, 40% esterified (Figure 3). These are consistent with the values for crude rapeseed oil (41% free, 59% esterified) presented by Verleyen et al. [32]. Unlike β-sitosterol and campesterol, brassicasterol was more abundant in free form, which has been observed in previous studies [32,33]. Mean results for esterified and free individual sterols for each process are provided in Supplementary Tables S1 and S2. Interestingly, seeds sampled from process CP contained lower tocopherol and phytosterol, yet higher carotenoid concentrations than seeds sampled from the other processes (Figure 2).

3.2. Effect of Seed Preparation on Bioactive Retention

Canola oil processing can be categorized into three main operations—seed preparation, crude oil extraction and crude oil refining. Each of these operations consists of varying processing stages, depending on the processor. Process BC provided more comprehensive sampling from the seed preparation operation: untreated seed, preconditioned seed, flaked/crushed seeds, and press cake (Figure 1, process BC, samples 1a–d). These were used to investigate the effect of seed preparation on bioactive retention. Concentrations of the three bioactives were highest in the expeller press cake (Table 1), which is consistent with previous reports of bioactive enrichment from the application of heat to the seed before extraction [19,31,34]. This may also be due to the accumulation of bioactives in the press cake from bulk seed sources. For process BC, the concentrations of β-carotene, lutein, total carotenoids, brassicasterol, and total sterols were significantly higher for press cake than the seed and flake samples (p < 0.01). Thus, seed pre-treatment operations—heating, flaking, and pressing—enhance bioactive retention and accumulation in the press cake sample.

3.3. Effect of Crude Oil Extraction on Bioactive Retention

Process BC combines expeller pressing and solvent extraction and provides important insights into these oil extraction methods. The crude press oil was collected after the expeller pressing, while the press cake proceeded to solvent extraction for solvent-extracted crude oil. The crude blended oil was obtained by blending the crude press and solvent-extracted oils in specific ratios to meet refining constraints and needs. Accumulation and retention of bioactive compounds increased steadily, reaching the highest concentrations in the crude blended oil, indicating that the blending of crude canola oils enhances bioactive enrichment (Table 2). Comparing cold-pressed, expeller-pressed, and solvent-extracted oils, previous studies on Chinese and Canadian canola varieties reported the highest bioactive concentration in expeller press and solvent-extracted crude oils [19,20], respectively. The contradictory results may be attributed to geographical variations in canola seeds, production priorities, bioactive accumulation, and some process-driven effects. In agreement with the current study, however, both studies reported lower concentrations of bioactives in cold-pressed canola oil compared to expeller-pressed and solvent-extracted canola oils [19,20].

3.4. Effect of Refining on Bioactive Retention
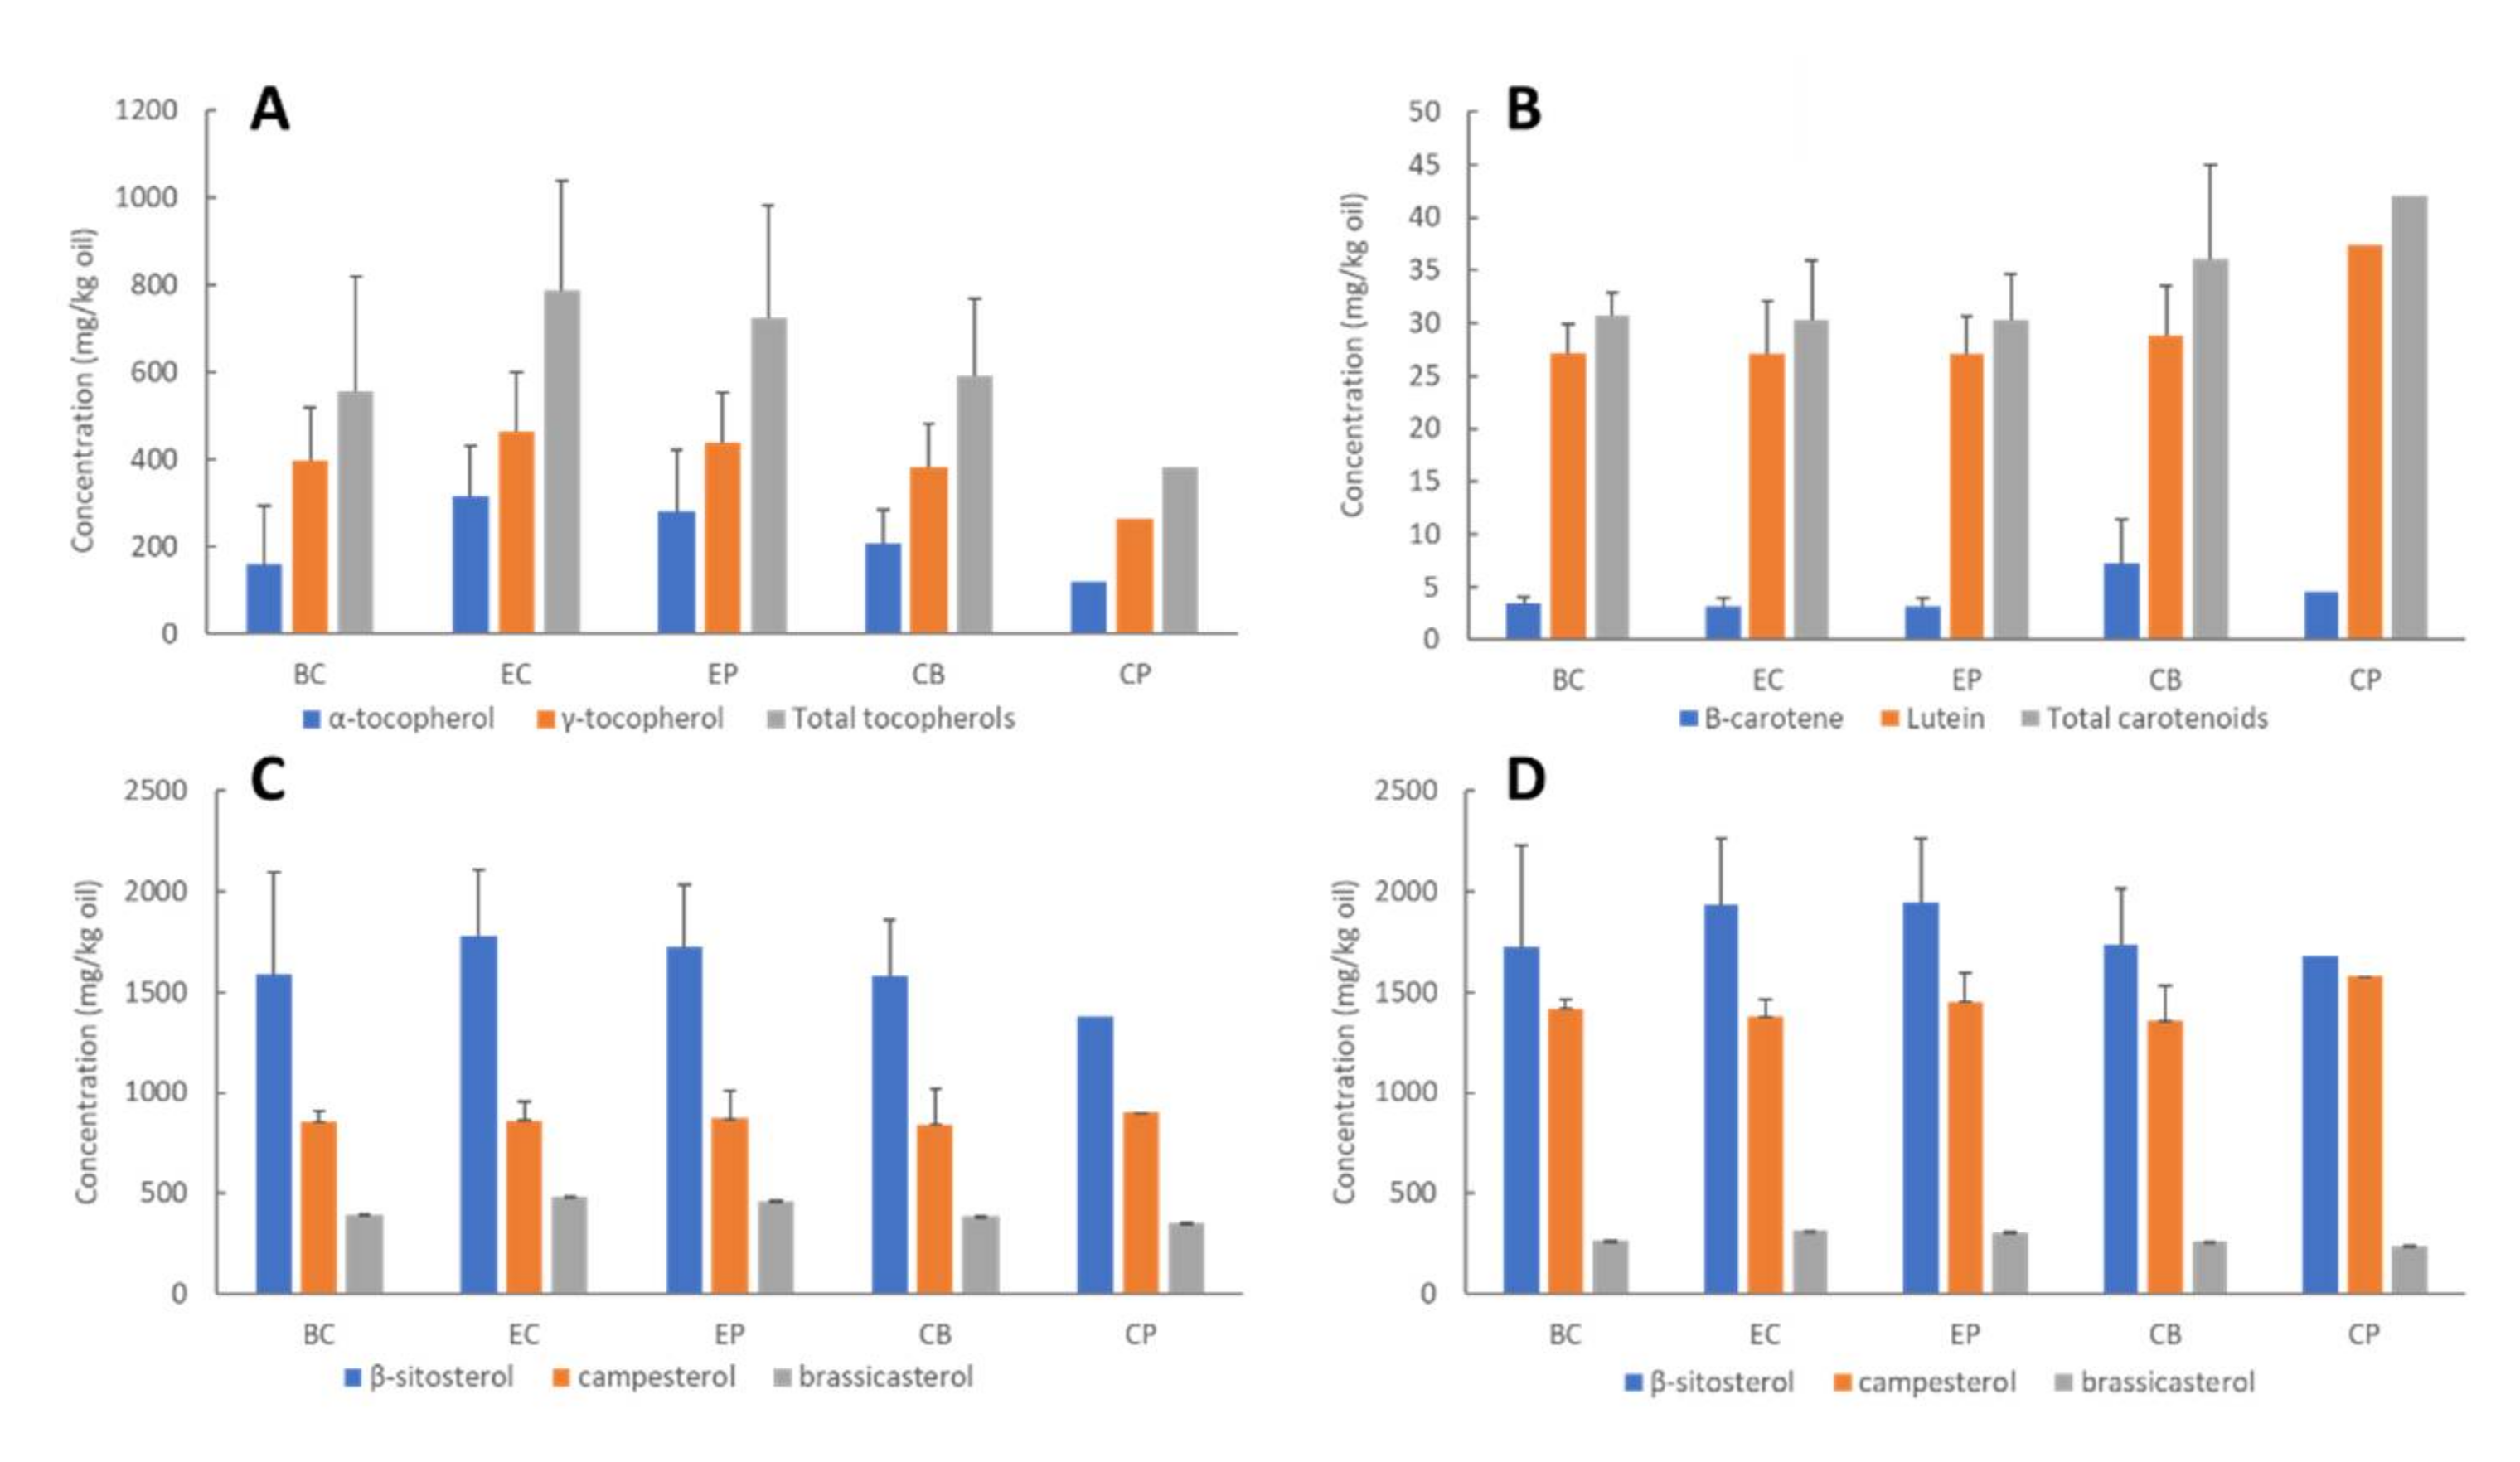
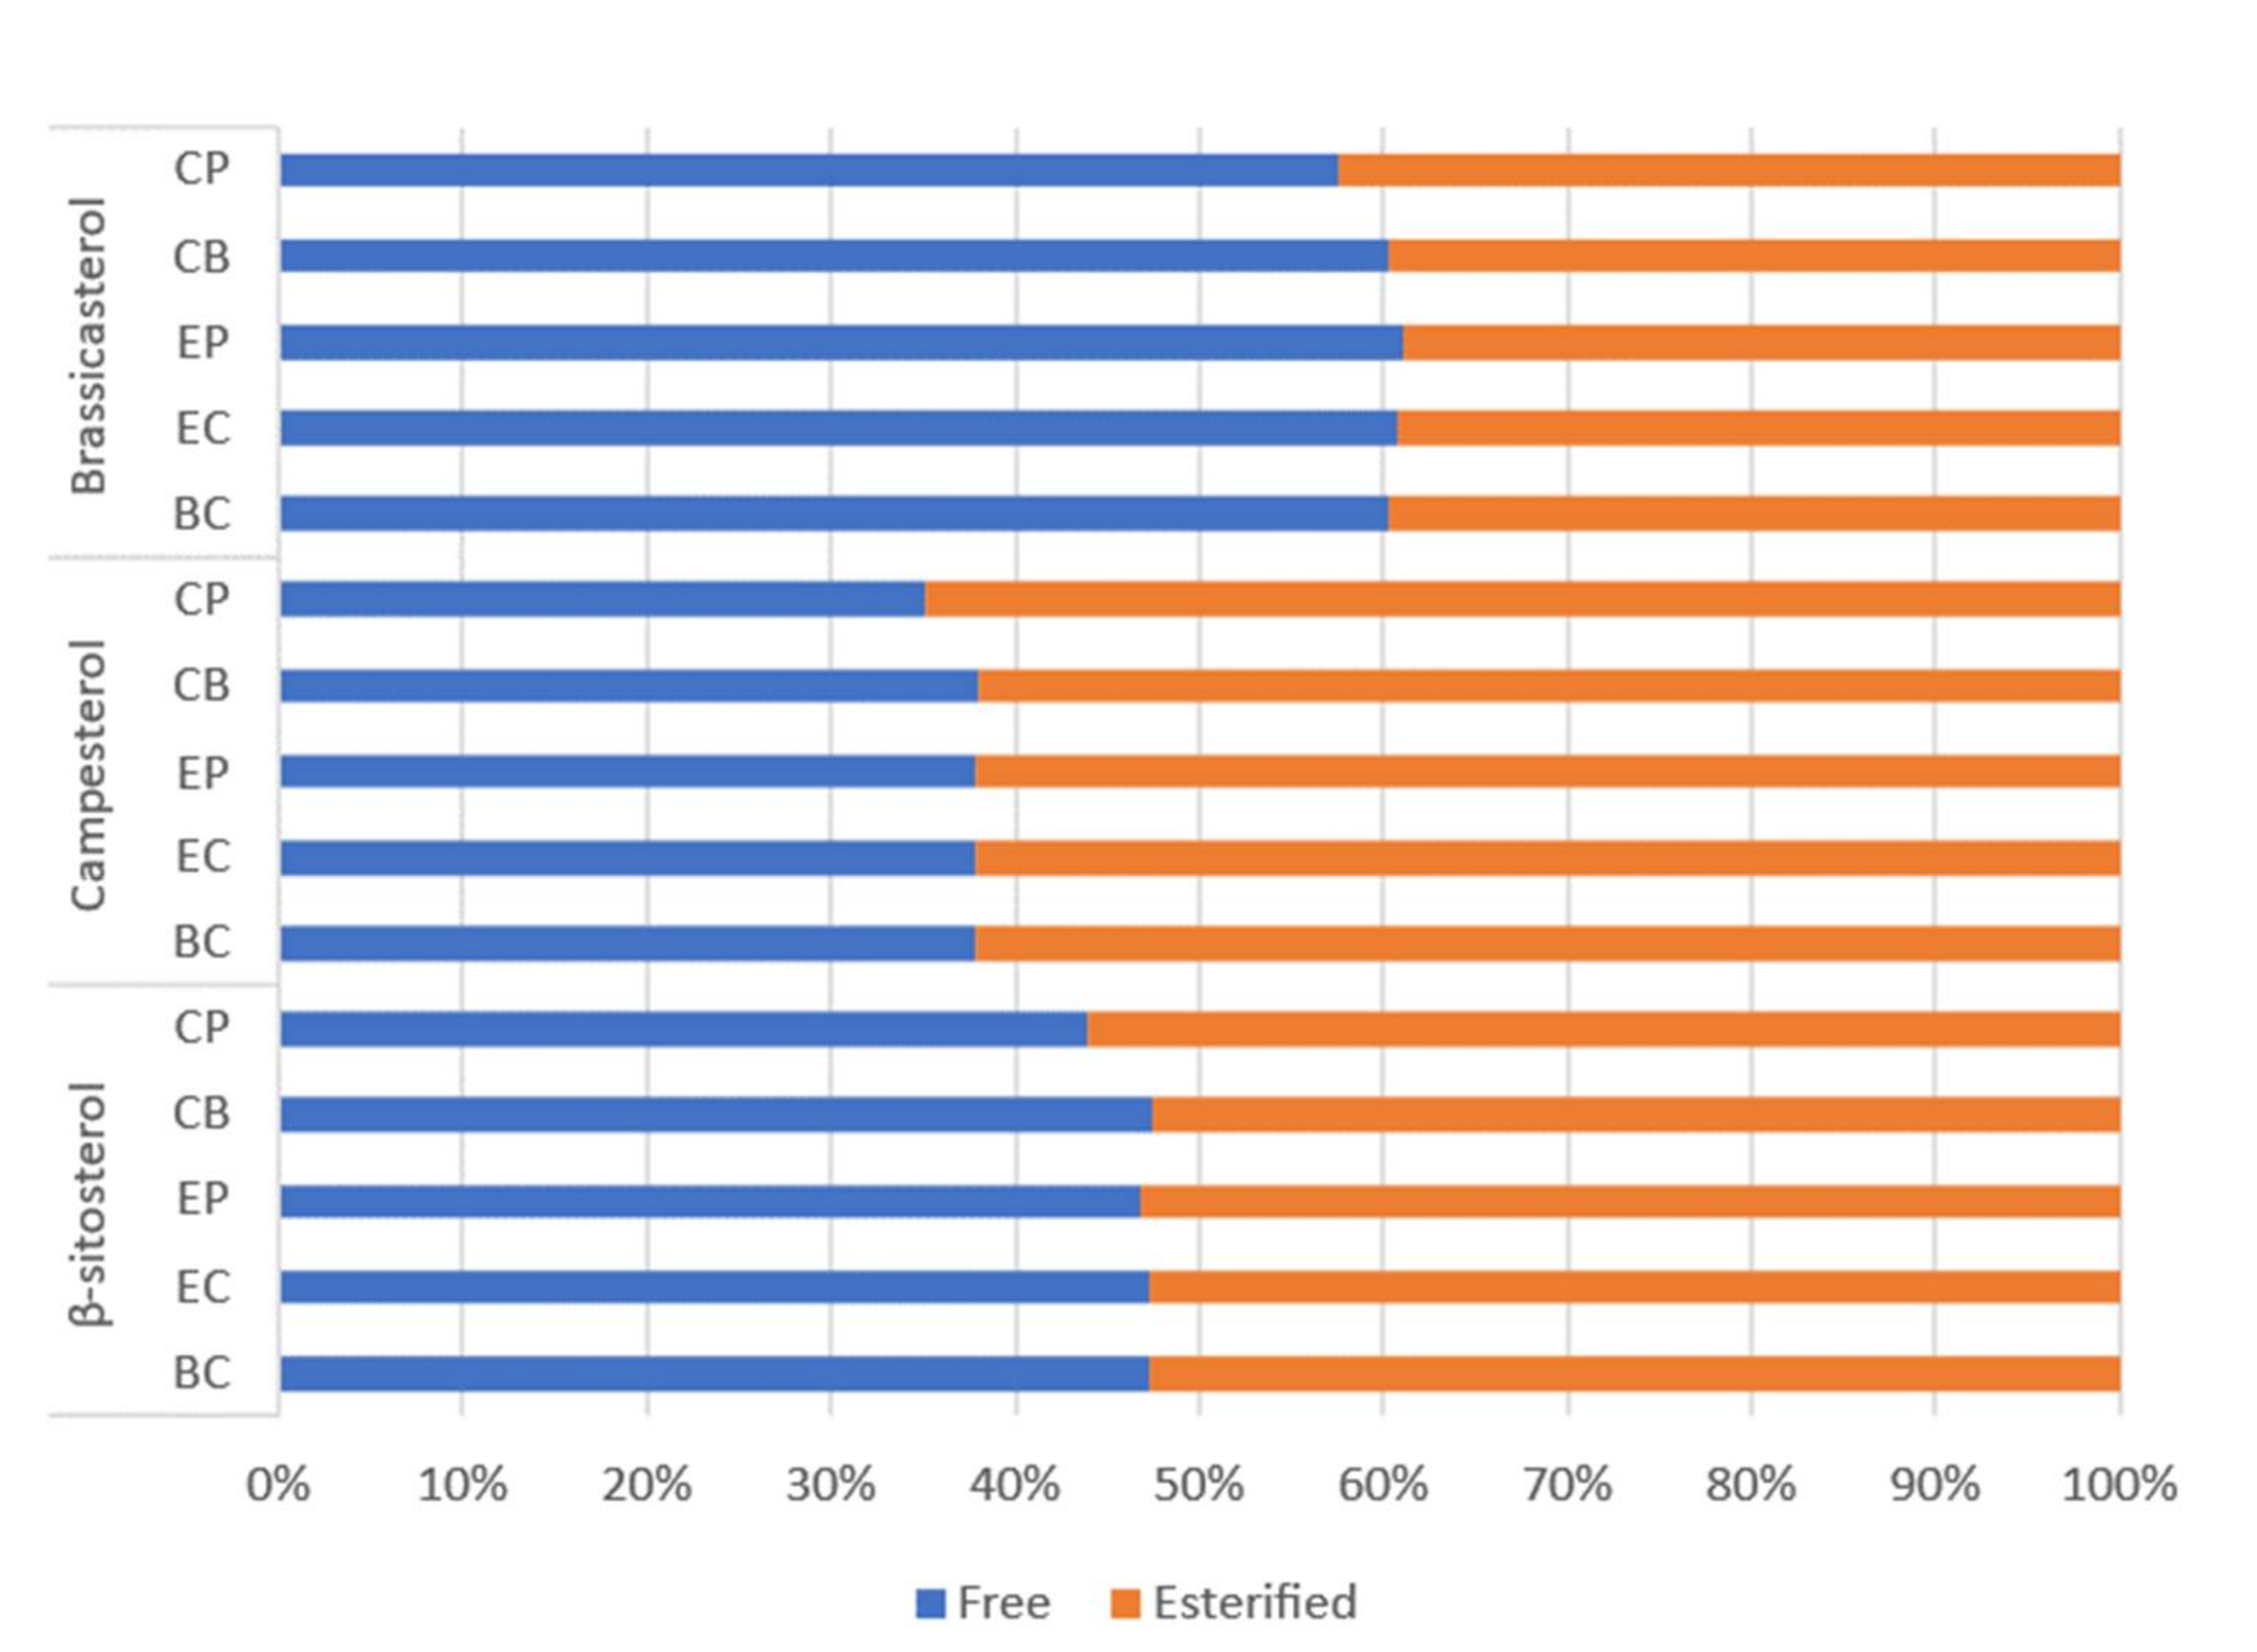
3.4.1. Phytosterols

Phytosterols were quantified as free and esterified sterols. Free, esterified, and total sterol concentrations determined in this study were in accordance with previous reports and concentrations typically found in canola oil [5,6,11]. Furthermore, vegetable oil refining processes cause varied effects on free and esterified sterols concentration [21], which was observed in the current study. Higher losses were observed for free sterols than the sterol ester equivalents (Supplementary Materials Tables S1 and S2). Slight decreases in free sterols were observed following the degumming/neutralization in both process BC and EC; however, concentrations increased slightly through degumming for processes EP and CP (Table S1). Both process BC and EC involve neutralisation with caustic soda to remove free fatty acids and neutralise free acids following acid degummimg, while process EP and CP lack a neutralization step—free fatty acids are removed during deodorisation. During neutralization, some phytosterols are lost into the soapstock [21], which may explain the slight reductions observed for process BC and EC, compared to process EP and CP. A similar trend was observed in soybean oil, with slight losses to free sterol content following chemical refining involving the neutralization step, yet slight increases following physical refining, with no neutralization [21]. In addition, little change was observed in sterol esters concentrations for both neutralized and non-neutralized oils (Table S2), which is consistent with previous reports [21]. In this study, and before the bleaching step, it appears that phytosterols were retained to a higher degree in physical refining processes than in chemical refining processes.
For most processes, the largest overall losses to phytosterols were observed during the deodorisation step, which is consistent with previous studies [11,21]. The bleaching step in process CP and EC was the largest contributor to sterol loss for those processes (Table 3). Total sterol varied considerably relative to the process—process CP observed approximately 13.6% total loss compared to 1.8% for process EC. Overall, phytosterol loss was minimal across all processes, and considerably lower than losses previously reported [11,13]. This is due to process optimizations and improvements during the past decade and demonstrates the capacity of modern Australian canola oil processing technologies to enrich nutritionally beneficial phytosterols in refined canola oil.

3.4.2. Tocopherols

The average α-tocopherol, γ-tocopherol and total tocopherol concentrations, and the percentage loss/gain for each, relative to the crude oil, are shown in Table 4. Only minor variations in total tocopherol concentrations were observed during refining, with accumulated (total) loss/gains throughout each process reported as: −1.8, 0.0, −4.5, −8.9, and −15.5% for process BC, EC, EP, CB, and CP, respectively. For individual tocopherols, greater accumulation and/or retention were observed for γ-tocopherol than α-tocopherol. Retention of tocopherol homologues has been reported for palm oil refining and was suggested to be due to the regeneration of esterified tocopherol forms due to the action of the bleaching clay [35], although it is impossible to attribute the changes observed to regeneration alone. More likely, variations in crude oil quality are also a factor. Deodorisation caused the largest losses to tocopherols in refined canola oils, which is consistent with previous studies [22,23]. However, the total losses across all processes in this study were considerably smaller than previously reported values (6–48%) [12,22], and in some cases, tocopherols were slightly enriched in the deodorised oil. According to De Greyt et al., tocopherol retention during deodorisation was a factor in the sparging steam, pressure, and process temperature [36]. Generally, the loss of tocopherols was only significant at high deodorisation temperatures (>260 °C) [35], not the lower temperatures (210–240 °C) commonly found in Australia. The smaller losses observed in this study may be due to optimized deodorisation operations regarding temperatures, pressure and sparging steam. Primarily, retention was improved at the degumming, neutralization, and bleaching stages; however, losses between the processes were very small, and likely due to natural variations in the crude oil.

3.4.3. Carotenoids

Crude canola oil contains carotenoids at concentrations sufficient to provide potential health and nutritional benefits to consumers [24], and investigations into the fate of carotenoids during canola oil processing are warranted. However, carotenoids are removed with the chlorophyll compounds by adsorbent clays during the bleaching step and high deodorisation temperatures. As shown in Table 5, most of the canola processes retained/enriched β-carotene and lost lutein during degumming/neutralization, except for process CP, in which opposite trends were observed. Since only one time point was sampled for process CP, further monitoring is required before any conclusions could be drawn. Carotenoids were undetectable at the end of the bleaching step; however, carotenoids were enriched particularly in the crude oils. Thus, opportunities exist for the valorization of carotenoids by extracting, enriching, and re-introducing them into the refined oil product or purifying them for use as high value nutraceuticals. As indicated in Section 3.1–3.3, seed preparation and crude oil extraction can greatly enrich carotenoids in canola oil. Studies have also discovered a correlation between β-carotene and lutein levels in Brassica napus varieties [24,30], with the potential to breed new varieties high in both carotenoids by elevating only one trait. These findings may be applied to enhance carotenoid concentrations in seeds, while processors may benefit from adopting optimized procedures for seed preparation, crude oil extraction and refining protocols.
Overall, a high retention of tocopherols and phytosterols was observed for all processes. Earlier industry targets varied between countries, with the US and UK targeting phytosterol and tocopherol enrichment, respectively [13]. The current results indicate that Australian processes retain high concentrations of both bioactives. Furthermore, carotenoid concentrations from all oil extraction processes are sufficient to yield associated health benefits, and certain seed preparation and pressing techniques resulted in considerable carotenoid enrichment. Although current bleaching practices eliminate carotenoids from the oil, alternative processes for their retention should be considered by the industry. Potentially, consumers may accept darker oil products if they provide greater health and nutritional benefits.

3.5. Examination of Second Press Oil from Process CB

The results for process CB presented above are for the first press oil only since the primary goal of this study was to compare bioactives across a range of Australian processors that produce edible oil for human consumption. Process CB produces a second press oil for livestock feed. Table 6 compares the first and second press oil samples for process CB, averaged across the March and April batches. The considerable difference in concentrations between the first and second press oils illustrates favorable conditions for bioactive retention during the second pressing or the combination of both. Significant differences (p < 0.01) were observed for lutein, total carotenoids, β-sitosterol, and total sterols between the first and second press operations. The concentrations observed for the second press oil were higher than all samples analyzed in this study or previously reported in the literature [11,13,18]. Increases of 122% and 140% were observed for total tocopherols and sterols, respectively, between stored first and second press oil. Notable was the enrichment of carotenoids, with a 217% increase in total carotenoid concentration observed between the stored first and second press oil. These results demonstrate the capability of Australian cold pressing processes for bioactive enrichment, producing canola oil with enhanced nutritional and health benefits [18]. The second press oil was much darker in color indicating the increased extraction of various compounds, including free fatty acids, phosphatides, and chlorophyll, which can present refining challenges. However, future research should investigate further the driving factors for the observed increases and potential for bioactive enrichment.

4. Conclusions

All the Australian processes studied retained high concentrations of tocopherols and phytosterols. These findings suggest that as commercial oil processing methods have improved, so too have their capability for bioactive compound retention. Large concentration ranges of bioactives in the starting seed, and those in the second press oil from process CB, indicate factors such as seed origin and variety, the seed preparation and oil extraction conditions (e.g., temperature, time, flow/feed rate, etc.) may affect bioactive retention, warranting further studies. This study has also shown the potential for carotenoid retention and enrichment in canola oils, as demonstrated in the second press oil from process CB. This could be achieved through selective breeding of varieties high in carotenoids, as evidenced by the ranges of carotenoids found in starting seeds and in the high degree of genetic diversity found in a previous study [24]. The study results demonstrate the potential of producing canola oils that are enriched with tocopherols, phytosterols, and carotenoids, compared to the levels typically found in most commercial oils. With current trends in consumer preference for foods with added health benefits, canola oil may be considered a candidate for this market. However, further research is required to investigate how these bioactive enriched oils may perform in food applications.

Supplementary Materials

The following supporting information can be downloaded at: https://www.mdpi.com/article/10.3390/pr10030580/s1, Table S1: Average concentration of free sterols in canola seed and oil samples (mg/kg oil ± standard deviation); Table S2: Concentration of esterified sterols in canola seed and oil samples (mg/kg oil ± standard deviation).

Author Contributions

Conceptualization and methodology were carried out by all authors. Formal analysis, data curation, and original draft preparation were conducted by C.L.F. Supervision was carried out by G.D., J.A.H., D.J.L. and P.D.P. Visualization was carried out by R.A., P.D.P. and C.L.F. Manuscript review and editing were carried out by all authors. All authors have read and agreed to the published version of the manuscript.

Funding

This work was partly funded by the Grains Research & Development Corporation through projects DAN00108 and DAN00158, and through a post-graduate scholarship (GRS10664) to the principal author. We also wish to thank the Graham Centre (now part of the Gulbali Institute) for its funding contribution to this research (post-graduate scholarship to principal author). The Gulbali Institute was formed in 2022 through the merger of the Graham Centre for Agricultural Innovations, the Institute for Land and Water Society (ILWS) and the National Wine and Grape Industry Centre (NWGIC) at Charles Sturt University.

Institutional Review Board Statement

Not applicable.

Informed Consent Statement

Not applicable.

Data Availability Statement

The data presented in this study are available in this article and Supplementary Materials.

Acknowledgments

The authors would like to acknowledge the Australian Oilseeds Federation, particularly Nick Goddard, and Jamie Ayton (NSW Department of Primary Industries) for their helpful advice. Additionally, the authors wish to thank each representative from the participating commercial processing plants for their assistance and participation in this study. Lastly, we wish to acknowledge the substantial contribution made by Julia A. Howitt, who sadly passed away before this paper was published. She is greatly missed by her colleagues, who considered her family.

Conflicts of Interest

The authors declare no conflict of interest. The funders had no role in the design of the study, in the collection, analyses, or interpretation of data, in the writing of the manuscript, or in the decision to publish the results.

References

  1. Daun, J.K.; Eskin, N.A.M.; Hickling, D. Canola: Chemistry, Production, Processing, and Utilisation; Elsevier Science: Urbana, IL, USA, 2015. [Google Scholar]
  2. Australian Oilseeds Federation. Crop Report: Canola September 2016; Australian Oilseeds Federation: Sydney, Australia, 2016; p. 1. [Google Scholar]
  3. Australian Oilseeds Federation Industry Facts and Figures. Available online: http://www.australianoilseeds.com/oilseeds_industry/industry_facts_and_figures (accessed on 1 December 2016).
  4. Matthäus, B.; Brühl, L. Why is it so difficult to produce high-quality virgin rapeseed oil for human consumption? Eur. J. Lipid Sci. Technol. 2008, 110, 611–617. [Google Scholar] [CrossRef]
  5. Alander, J.; Andersson, A.; Bagge, C.; Bringsarve, K.; Hjorth, M.; Johansson, M.; Granroth, B.; Norberg, S.; Pedersen, M.; Persson, M.; et al. Raw materials. In Handbook of Vegetable Oils and Fats, 2nd ed.; Lidefelt, J., Ed.; Alfaprint: Sundbyberg, Sweden, 2007. [Google Scholar]
  6. Gül, M.K.; Amar, S. Sterols and the phytosterol content in oilseed rape (Brassica napus L.). J. Mol. Cell Biol. 2006, 5, 71–79. [Google Scholar]
  7. Li, C.; Yao, Y.; Zhao, G.; Cheng, W.; Liu, H.; Liu, C.; Shi, Z.; Chen, Y.; Wang, S. Comparison and analysis of fatty acids, sterols, and tocopherols in eight vegetable oils. J. Agric. Food Chem. 2011, 59, 12493–12498. [Google Scholar] [CrossRef] [PubMed]
  8. Fernández-García, E.; Carvajal-Lérida, I.; Jarén-Galán, M.; Garrido-Fernández, J.; Pérez-Gálvez, A.; Hornero-Méndez, D. Carotenoids bioavailability from foods: From plant pigments to efficient biological activities. Food Res. Int. 2012, 46, 438–450. [Google Scholar] [CrossRef]
  9. Delgado-Vargas, F.; Jiménez, A.R.; Paredes-López, O. Natural pigments: Carotenoids, anthocyanins, and betalains—Characteristics, biosynthesis, processing, and stability. Crit. Rev. Food Sci. 2000, 40, 173–289. [Google Scholar] [CrossRef]
  10. Granado, F.; Olmedilla, B.; Blanco, I. Nutritional and clinical relevance of lutein in human health. Brit. J. Nutr. 2003, 90, 487–502. [Google Scholar] [CrossRef] [Green Version]
  11. Fine, F.; Brochet, C.; Gaud, M.; Carre, P.; Simon, N.; Ramli, F.; Joffre, F. Micronutrients in vegetable oils: The impact of crushing and refining processes on vitamins and antioxidants in sunflower, rapeseed, and soybean oils. Eur. J. Lipid Sci. Technol. 2015, 118, 680–697. [Google Scholar] [CrossRef]
  12. Ghazani, S.; Marangoni, A. Minor components in canola oil and effects of refining on these constituents: A review. J. Am. Oil Chem. Soc. 2013, 90, 923–932. [Google Scholar] [CrossRef]
  13. Dunford, N.T.; Dunford, H.B. Nutritionally Enhanced Edible Oil and Oilseed Processing; AOCS Press: Urbana, IL, USA, 2004. [Google Scholar]
  14. Gawrysiak-Witulska, M.; Siger, A.; Nogala-Kalucka, M. Degradation of tocopherols during near-ambient rapeseed drying. J. Food Lipids 2009, 16, 524–539. [Google Scholar] [CrossRef]
  15. Gawrysiak-Witulska, M.; Rudzińska, M.; Siger, A.; Bartkowiak-Broda, I. A high drying temperature causes degradation of sterols and tocopherols in yellow-seeded Brassica napus oils. Eur. J. Lipid Sci. Technol. 2015, 117, 483–490. [Google Scholar] [CrossRef]
  16. Azadmard-Damirchi, S.; Alirezalu, K.; Achachlouei, B.F. Microwave pretreatment of seeds to extract high quality vegetable oil. World Acad. Sci. Eng. Technol. 2011, 57, 72–75. [Google Scholar]
  17. Rękas, A.; Wroniak, M.; Rusinek, R. Influence of roasting pretreatment on high-oleic rapeseed oil quality evaluated by analytical and sensory approaches. Int. J. Food Sci. Technol. 2015, 50, 2208–2214. [Google Scholar] [CrossRef]
  18. Kraljic, K.; Skevin, D.; Pospisil, M.; Obranovic, M.; Neeral, S.; Bosolt, T. Quality of rapeseed oil produced by conditioning seeds at modest temperatures. J. Am. Oil Chem. Soc. 2013, 90, 589–599. [Google Scholar] [CrossRef]
  19. Liu, C.S.; Yang, M.; Huang, F.H. Influence of extraction processing on rheological properties of rapeseed oils. J. Am. Oil Chem. Soc. 2012, 89, 73–78. [Google Scholar] [CrossRef]
  20. Ghazani, S.M.; García-Llatas, G.; Marangoni, A.G. Micronutrient content of cold-pressed, hot-pressed, solvent extracted and RBD canola oil: Implications for nutrition and quality. Eur. J. Lipid Sci. Technol. 2014, 116, 380–387. [Google Scholar] [CrossRef]
  21. Verleyen, T.; Sosinska, U.; Ioannidou, S.; Verhe, R.; Dewettinck, K.; Huyghebaert, A.; De Greyt, W. Influence of the vegetable oil refining process on free and esterified sterols. J. Am. Oil Chem. Soc. 2002, 79, 947–953. [Google Scholar] [CrossRef]
  22. Ghazani, S.M.; García-Llatas, G.; Marangoni, A.G. Minor constituents in canola oil processed by traditional and minimal refining methods. J. Am. Oil Chem. Soc. 2013, 90, 743–756. [Google Scholar] [CrossRef]
  23. Ferrari, R.A.; Schulte, E.; Esteves, W.; Brühl, L.; Mukherjee, K.D. Minor constituents of vegetable oils during industrial processing. J. Am. Oil Chem. Soc. 1996, 73, 587–592. [Google Scholar] [CrossRef]
  24. Flakelar, C.L.; Luckett, D.J.; Howitt, J.A.; Doran, G.; Prenzler, P.D. Canola (Brassica napus) oil from Australian cultivars shows promising levels of tocopherols and carotenoids, along with good oxidative stability. J. Food Compost. Anal. 2015, 42, 179–186. [Google Scholar] [CrossRef]
  25. Flakelar, C.L.; Prenzler, P.D.; Luckett, D.J.; Howitt, J.A.; Doran, G. A rapid method for the simultaneous quantification of the major tocopherols, carotenoids, free and esterified sterols in canola (Brassica napus) oil using normal phase liquid chromatography. Food Chem. 2017, 214, 147–155. [Google Scholar] [CrossRef]
  26. Flakelar, C.L.; Howitt, J.A.; Prenzler, P.D.; Doran, G.; Coombes, N.; Luckett, D.J. A multiphase experiment for the analysis of bioactive compounds in canola oil: Sources of error from field and laboratory. Chemom. Intell. Lab. 2017, 162, 55–64. [Google Scholar] [CrossRef]
  27. R Core Team. R: A Language and Environment for Statistical Computing, Version 3.3.1; R Foundation for Statistical Computing: Vienna, Austria, 2016; Available online: https://www.R-project.org/ (accessed on 9 July 2017).
  28. Rstudio: Integrated Development Environment for R; Version 1; R Studio, PBC: Boston, MA, USA, 2012; Available online: https://www.rstudio.com/ (accessed on 9 July 2017).
  29. De Mendiburu, F. Agricolae: Statistical Procedures for Agricultural Research; Version 1.2-7; National Engineering University: Lima, Peru, 2016. [Google Scholar]
  30. Richards, A.; Wijesundera, C.; Salisbury, P. Genotype and growing environment effects on the tocopherols and fatty acids of Brassica napus and B. juncea. J. Am. Oil Chem. Soc. 2008, 85, 159–168. [Google Scholar] [CrossRef]
  31. Yang, M.; Zheng, C.; Zhou, Q.; Huang, F.; Liu, C.; Wang, H. Minor components and oxidative stability of cold-pressed oil from rapeseed cultivars in China. J. Food Compost. Anal. 2013, 29, 1–9. [Google Scholar] [CrossRef]
  32. Verleyen, T.; Forcades, M.; Verhe, R.; Dewettinck, K.; Huyghebaert, A.; Greyt, W. Analysis of free and esterified sterols in vegetable oils. J. Am. Oil Chem. Soc. 2002, 79, 117–122. [Google Scholar] [CrossRef]
  33. Phillips, K.M.; Ruggio, D.M.; Toivo, J.I.; Swank, M.A.; Simpkins, A.H. Free and esterified sterol composition of edible oils and fats. J. Food Compost. Anal. 2002, 15, 123–142. [Google Scholar] [CrossRef]
  34. Prior, E.; Vadke, V.; Sosulski, F. Effect of heat treatments on canola press oils. I. Non- triglyceride components. J. Am. Oil Chem. Soc. 1991, 68, 401–406. [Google Scholar] [CrossRef]
  35. Rossi, M.; Gianazza, M.; Alamprese, C.; Stanga, F. The effect of bleaching and physical refining on color and minor components of palm oil. J. Am. Oil Chem. Soc. 2001, 78, 1051–1055. [Google Scholar] [CrossRef]
  36. De Greyt, W.F.; Kellens, M.J.; Huyghebaert, A.D. Effect of physical refining on selected minor components in vegetable oils. Lipid/Fett 1999, 101, 428–432. [Google Scholar] [CrossRef]
Figure 1. Process flow diagram and description of stages sampled within each process. Sampling points are indicated by numbers in bold typeface. 1 = seed, 2 = crude oil, 3 = degummed and neutralized oil, 4 = bleached oil, 5 = deodorised oil. Letters (i.e., 2a, 2b) differentiate multiple seed/oil samples taken at a sampling stage. 3a, and 3b* are samples obtained from a second press oil for process CB and this process is discussed independently in Section 3.5.
Processes 10 00580 g001
Figure 2. Concentrations of tocopherols: (A) carotenoids; (B) free sterols; (C) esterified sterols; (D) in canola seeds from each process. Each bar represents the average of batches one and two (Total n = 4), error bars represent standard deviation between the batches. Note: Only a single batch was acquired (i.e., n = 2) for process CP; Free + esterified = total phytosterol.
Processes 10 00580 g002
Figure 3. Average proportions of free (blue) and esterified (orange) phytosterols in canola seeds and crude oil from each process. Each bar represents the percentage (%); derived by the average of seed and crude oil concentrations across batches one and two and divided by total phytosterol concentration for the respective phytosterol homologue (esterified + free).
Processes 10 00580 g003
Table 1. Bioactive concentrations in seed, flake, and press cake from process BC.
Process Samplemg/kg Oil ± Standard Deviation
β-CaroteneLuteinTotal Carotenoidsα-Tocopherolγ-TocopherolTotal Tocopherolsβ-SitosterolCampesterolBrassicasterolTotal Phytosterol
Seed3.48 b ± 0.4927.2 b ± 3.2130.7 b ± 2.94161 a ± 133397 a ± 123558 a ± 2613310 a ± 9182270 a ± 221655 b ± 72.46240 b ± 769
Preconditioned seed3.70 b ± 0.6528.2 b ± 3.6731.9 b ± 3.24210 a ± 104401 a ± 140611 a ± 2483130 a ± 9812190 a ± 136632 b ± 1115950 b ± 956
Flakes3.60 b ± 0.4032.2 b ± 3.7835.8 b ± 3.58198 a ± 127409 a ± 146606 a ± 2783310 a ± 7582350 a ± 376644 b ± 56.06310 b ± 438
Expeller press cake5.80 a ± 0.5134.4 b ± 4.1240.2 a ± 3.62291 a ± 156441 a ± 145737 a ± 3084410 a ± 8012860 a ± 497842 a ± 82.18110 a ± 386
Note: Averages and standard deviation were calculated using the average concentration across the two batches, accounting for analysis variation and month variation. Different superscript letters in each column refer to significant differences between samples (p < 0.01). β-sitosterol, campesterol and brassicasterol concentrations are esterified + free phytosterols.
Table 2. Average bioactive concentrations in crude oil samples obtained from process BC.
Process Samplemg/kg Oil ± Standard Deviation
β-CaroteneLuteinTotal Carotenoidsα-Tocopherolγ-TocopherolTotal Tocopherolsβ-SitosterolCampesterolBrassicasterolTotal Phytosterols
Crude press oil3.90 b ± 0.5044.6 a ± 6.1248.5 a ± 6.60246 a ± 156466 a ± 149712 a ± 3093750 a ± 6172610 a ± 414721 b ± 65.27080 b ± 268
Crude blended oil4.93 a ± 0.4646.1 a ± 11.151.0 a ± 11.5268 a ± 173481 a ± 178749 a ± 3564130 a ± 7262730 a ± 375784 a ± 69.07640 a ± 420
Note: Averages and standard deviation were calculated using the average concentration across the two batches, accounting for analysis variation and month variation. Different superscript letters in each column refer to significant differences between samples (p < 0.01). β-sitosterol, campesterol and brassicasterol concentrations consist of esterified + free phytosterols.
Table 3. Concentration of total (free + esterified) phytosterol (mg/kg oil ± standard deviation). Cumulative percentage gain/loss relative to the previous process is represented in brackets under concentrations for refining methods. Total loss/gain is reported in the bottom row and represents the total loss or gain of bioactive compound from crude oil to the deodorisation step.
Oil Samplemg/kg Oil ± Standard Deviation
β-SitosterolCampesterolBrassicasterolTotal Sterols
BCECEPCBCPBCECEPCBCPBCECEPCBCPBCECEPCBCP
Crude413042404310355033002730260026002510277078484685068068076407690776067406750
±725±405±1030±242N/A±375±587±322±725N/A±68.6±18.6±115±59.1N/A±419±163±819±424N/A
Degummed/
Neutralised
3940 (−4.6)4350 (+2.6)4400 (+2.1)3274 (−0.8)2610 (−4.4)2630 (+1.2)2620 (+0.8)2644 (−4.5)739 (−5.7)829 (−2.0)850 (0.0)718 (+5.6)7280 (−4.7)7810 (+1.6)7870 (+1.4)6640 (−1.6)
±812±751±896 N/A±269±410±383 N/A±90.2±86.3±95.0 N/A±634±427±608 N/A
Bleached3930 (−0.3)4260 (−2.1)4170 (−5.2)3400 (−4.2)2980 (−9.0)2630 (+0.8)2560 (−2.7)2630 (+0.4)2370 (−5.4)2450 (−7.3)721 (−2.4)815 (−1.7)850 (0.0)690 (+1.0)626 (−12.8)7280 (0.0)7640 (−2.2)7910 (+0.5)6460 (+8.6)6050 (−8.9)
±788±773±1090±672N/A±338±336±244±343N/A±76.9±74.0±120±116N/A±527±511±1020±445N/A
Deodorised3870 (−1.5)4200 (−1.4)4210 (+1.0)2860 (−4.0)2610 (−0.8)2560 (0.0)2470 (−6.1)2380 (−2.9)715 (−0.8)789 (−3.2)790 (−7.1)590 (−5.8)7200 (−1.1)7550 (−1.2)7440 (−6.0)5830 (−3.6)
±788±1050±1020 N/A±313±195±194 N/A±85.1±144±142 N/A±561±1000±1040 N/A
Total loss/gain (%)−6.3−0.9−2.3−4.2−13.3−4.4−1.5−5.0−5.4−14.1−8.8−6.7−7.1+1.0−13.2−5.8−1.8−4.1−9.6−13.6
Note: Only those steps common to all processes are reported here. Full results are supplied in the Supplementary Materials. BC = Blended—chemical refining, EC = Expeller extracted—chemical refining, EP = Expeller extracted—physical refining, CB = Cold-pressed—bleaching only, CP = Cold pressed—physical refining. (–) = not part of this process. N/A = “not available”.
Table 4. Concentration of individual and total tocopherols (mg/kg oil ± standard deviation). Cumulative percentage gain/loss relative to the previous process is represented in brackets under concentrations for refining methods. Total loss/gain is reported in the bottom row and represents the total loss or gain of bioactive compound from crude oil to the deodorisation step.
Oil Samplemg/kg Oil ± Standard Deviation
α-Tocopherolγ-TocopherolTotal Tocopherols
BCECEPCBCPBCECEPCBCPBCECEPCBCP
Crude268365353245130481467531417282749840893663412
±173±88.0±180±93.0N/A±178±117±187±119N/A±356±205±367±211N/A
Degummed/
Neutralised
252 (−6.0)386 (+5.8)367 (+4.0)80 (−38.5)474 (−1.5)521 (+11.6)534 (+0.6)276 (−2.1)726 (−3.1)919 (+9.4)910 (+1.9)356 (−13.6)
±193±156±152 N/A±170±185±198 N/A±368±341±351 N/A
Bleached261 (+ 3.6)367 (−4.9)406 (+10.6)197 (−19.6)123 (+53.8)496 (+4.6)530 (+1.7)533 (−0.2)406 (−2.6)293 (+6.2)757 (+4.3)909 (−1.1)950 (+4.4)604 (−8.9)416 (+16.9)
±184±138±210±98.3N/A±164±191±183±134N/A±358±328±393±233N/A
Deodorised246 (−5.7)311 (−15.3)357 (−12.1)85 (−30.9)490 (−1.2)521 (−1.7)492 (−7.7)263 (−10.2)736 (−2.8)840 (−7.6)853 (−10.2)348 (−16.4)
±182±143±187 N/A±158±189±172 N/A±345±332±360 N/A
Total loss/gain (%)−8.1−14.8+1.1−19.6−34.6+1.9+11.6−7.3−2.6−6.7−1.80.0−4.5−8.9−15.5
Note: Only those steps common to all processes are reported here. Full results are supplied in the Supplementary Materials. BC = Blended—chemical refining, EC = Expeller extracted—chemical refining, EP = Expeller extracted—physical refining, CB = Cold-pressed—bleaching only, CP = Cold pressed—physical refining. (–) = not part of this process. N/A = “not available”.
Table 5. Concentration of β-carotene, lutein, and total carotenoids (mg/kg oil ± standard deviation). Percentage gain/loss relative to previous process is represented in brackets under concentrations for refining methods.
Oil Samplemg/kg Oil ± Standard Deviation
β-CaroteneLuteinTotal Carotenoids
BCECEPCBCPBCECEPCBCPBCECEPCBCP
Crude 4.935.255.038.364.6246.148.950.740.033.451.054.155.748.338.0
±0.55±2.69±0.66±4.05N/A±13.2±24.6±15.913.3N/A13.827.316.59.23N/A
Degummed/
Neutralised
5.11 (+3.7)6.2 (+18.1)5.14 (+2.2)4.41 (−4.5)29.6 (−35.8)34.0 (−30.5)39.8 (−21.5)36.0 (+7.8)34.7 (−32.0)40.2 (−25.7)44.9 (−19.4)40.4 (+6.3)
±0.53±1.74±0.57 N/A±4.37±5.71±13.4 N/A±4.91±7.46±13.9 N/A
Bleached<DL<DL<DL<DL<DL<DL<DL<DL<DL<DL<DL<DL<DL<DL<DL
Deodorised<DL<DL<DL<DL<DL<DL<DL<DL<DL<DL<DL<DL
Note: Only those steps common to all processes are reported here. Full results are supplied in the Supplementary Materials. BC = Blended—chemical refining, EC = Expeller extracted—chemical refining, EP = Expeller extracted—physical refining, CB = Cold-pressed—bleaching only, CP = Cold pressed—physical refining. <DL = below detection limit. (–) = not part of this process. N/A = “not available”.
Table 6. Average concentrations of bioactives for crude and bleached oil in process CB.
Oil Samplemg/kg Oil ± Standard Deviation
β-CaroteneLuteinTotal Carotenoidsα-Tocopherolγ-TocopherolTotal Tocopherolsβ-SitosterolCampesterolBrassicasterolTotal Phytosterols
First press crude oil8.40 b ± 4.0539.9 c ± 13.348.3 c ± 9.23244 a ± 93.0417 a ± 119662 a ± 2113550 b ± 2422510 a ± 725683 a ± 59.16740 b ± 424
Second press crude oil14.5 a ± 7.9484.5 a ± 2.9699.0 a ± 10.9311 a ± 119447 a ± 151758 a ± 2704760 a ± 5713050 a ± 765843 a ± 1238660 a ± 71.3
Storage tank—first press8.70 b ± 4.9438.8 c ± 0.6147.5 c ± 4.33230 a ± 107402 a ± 135632 a ± 2423420 b ± 7272400 a ± 396683 a ± 1396500 b ± 469
Storage tank—second press15.2 a ± 6.6787.9 a ± 4.46103 a ± 11.1316 a ± 120453 a ± 123770 a ± 2435010 a ± 7333190 a ± 765897 a ± 1269100 a ± 93.5
Premium bleached oil from first press<DL<DL<DL197 a ± 120406 a ± 134603 a ± 2333400 b ± 6722370 a ± 343688 a ± 1176460 b ± 445
Note: Averages and standard deviation were calculated using the average concentration between the two batches, accounting for analysis and month variations. Different superscript letters in each column refer to significant differences between samples (p < 0.01). <DL = “less than detection limit”.
Publisher’s Note: MDPI stays neutral with regard to jurisdictional claims in published maps and institutional affiliations.

