Article

Decrease in Ca2+ Concentration in Quail Cardiomyocytes Is Faster than That in Rat Cardiomyocytes

1
Department of Electrical and Mechanical Engineering, Nagoya Institute of Technology, Nagoya 466-8555, Japan
2
Center of Biomedical Physics and Information Technology, Nagoya Institute of Technology, Nagoya 466-8555, Japan
*
Author to whom correspondence should be addressed.
Processes 2022, 10(3), 508; https://doi.org/10.3390/pr10030508
Submission received: 11 January 2022 / Revised: 28 February 2022 / Accepted: 1 March 2022 / Published: 3 March 2022
(This article belongs to the Section Manufacturing Processes and Systems)

Abstract

:
Mammals and birds have quicker heart rates compared to other species. Mammalian cardiomyocytes have T-tubule membranes that facilitate rapid changes in Ca2+ concentrations. In contrast, bird cardiomyocytes do not possess T-tubule membranes, which raises the question of how birds achieve fast heartbeats. In this study, we compared the changes in Ca2+ concentration in cardiomyocytes isolated from adult quails and rats to elucidate the mechanism resulting in rapid heart rates in birds. Cardiomyocytes isolated from quails were significantly narrower than those isolated from rats. When Ca2+ concentration changes in the entire cardiomyocytes were measured using Fura-2 acetoxymethyl ester (AM), the time to peak was statistically longer in quails than in rats. In contrast, the decay time was markedly shorter in quails than in rats. As a result, the total time of Ca2+ concentration change was shorter in quails than in rats. A spatiotemporal analysis of Ca2+ concentration changes in quail cardiomyocytes showed that the decrease in Ca2+ concentration was faster in the center of the cell than near the cell membrane. These results suggest that avian cardiomyocytes achieve rapid changes in Ca2+ concentration by increasing the Ca2+ removal capacity in the central part of the cell compared to mammalian cardiomyocytes.

1. Introduction

The vertebrate heartbeat is generated by the rhythmic contraction and relaxation of cardiomyocytes. The process of contraction induced by changes in the membrane potential of cardiomyocytes is called excitation–contraction coupling, in which intracellular Ca2+ concentration plays an important role [1]. The change in membrane potential induces a small influx of Ca2+ from outside the cell. This influx causes the release of large amounts of Ca2+ from the sarcoplasmic reticulum (SR), an intracellular Ca2+ storehouse, thereby increasing the cytoplasmic Ca2+ concentration. Elevated Ca2+ levels induce contraction of the sarcomere, a contractile apparatus. Ca2+ is then either restored in the SR by the Ca2+ uptake pump (SR Ca2+ ATPase; SERCA) or extruded from the cell by the Na+–Ca2+ exchanger (NCX) [1,2]. The cell gets relaxed with a decrease in cytoplasmic Ca2+ concentration. Rapid and precise control of Ca2+ concentration is therefore critical for achieving a high heart rate.
Mammalian cardiomyocytes are equipped with T-tubules, which are invaginations of the cell membrane perpendicular to the direction of contraction [3]. As T-tubule membranes are close to the SRs located in the center of the cell [4], the electrical membrane action potential is immediately transmitted to the SRs via transduction into an intracellular chemical signal. This facilitates a rapid and uniform increase in the intracellular Ca2+ concentration during the excitation–contraction coupling in mammalian cardiomyocytes [5,6].
Nonmammalian cardiomyocytes do not have T-tubule membranes [6,7]. Cardiomyocytes without the T-tubule membrane rely on the propagative diffusion of Ca2+ released by the SRs from the membrane to the deep inside of the cell to transmit the membrane action potential [8]. Consequently, fish, amphibians, and reptiles show slower changes in the Ca2+ concentration in cardiomyocytes, and correspondingly, lower heart rates [7,9].
Despite the absence of T-tubule membranes, birds exhibit a high heart rate comparable to that of mammals [10]. This suggests that avian cardiomyocytes have developed a unique mechanism to achieve rapid Ca2+ concentration changes without the T-tubule membrane. Recently, using electron microscopy and computer simulations, Sheard et al. [11] predicted that the organization of Ca2+ release units within the SR could help rapid Ca2+ concentration changes in avian cardiomyocytes. Filatova et al. [12] showed that quail ventricular cardiomyocytes have a higher SR Ca2+ content and higher extracellular Ca2+ influx than mammalian cardiomyocytes. While these two studies suggest that avian cardiomyocytes can promote a rapid increase in intracellular Ca2+ concentration without the T-tubule membrane due to the developed SRs, it has not been confirmed that such cardiomyocytes can perform Ca2+ concentration changes as rapidly as mammalian cardiomyocytes. The characteristics of the removal of the released Ca2+ in avian cardiomyocytes are also unknown, although quick relaxation is necessary for fast heartbeat. Moreover, the mechanism of achieving a uniform increase in Ca2+ concentration in avian cardiomyocytes without the T-tubule membranes remains to be elucidated, since a nonuniform increase in Ca2+ concentration results in the unsynchronized contraction of sarcomeres and thus weak cardiomyocyte contraction.
In this study, to elucidate the mechanism of the fast heart rate in birds, we compared Ca2+ dynamics in cardiomyocytes isolated from avian quail (300 bpm [13]) and mammalian rats (350 bpm [14]) with relatively similar heart rates. The excitation–contraction coupling was induced by electrical stimulation, and the contraction–relaxation behavior of the cells and changes in the Ca2+ concentration in the cytoplasm were measured. In addition, we clarified the spatial distribution of cytoplasmic Ca2+ concentration changes to unravel the mechanism of the rapid Ca2+ changes in avian cardiomyocytes.

2. Materials and Methods

2.1. Animals

Adult male WE quails (110–120 g) and adult male Slc:SD rats (310–330 g) were used as avian and mammalian models, respectively. The quails were purchased from Nagoya University through the National Bio-Resource Project of the Ministry of Education, Culture, Sports, Science and Technology (MEXT), Japan; the rats were purchased from Japan SLC. All animal experiments were conducted in accordance with the guidelines specified by the Guide for Animal Experimentation, Nagoya Institute of Technology.

2.2. Isolation of Cardiomyocytes

Ventricular cardiomyocytes were isolated from quails using a modified version of the Langendorff perfusion protocol used in mice [15,16]. Briefly, the quails were euthanized using sevoflurane (Maruishi Pharmaceutical, Osaka, Japan), and their hearts were removed. An 18 G hypodermic needle (NN-1838S, Terumo, Tokyo, Japan) with a rounded tip was cannulated into the vessel located in the middle of the trigeminal aorta, and the two remaining vessels were ligated. Cell isolation buffer (CIB; 130 mM NaCl, 5.4 mM KCl, 0.50 mM MgCl2, 0.33 mM NaH2PO4, 22 mM glucose, and 25 mM HEPES) with 0.4 mM ethylenediaminetetraacetic acid was perfused through the aorta to flush out the blood. The left ventricle was perfused again with enzyme solution (ES; CIB containing 1 mg/mL collagenase, 0.06 mg/mL trypsin, 0.06 mg/mL protease) containing 0.3 mM CaCl2, and then cut into cubes (5 mm × 5 mm × 5 mm). The heart pieces were then gently agitated in the ES at 37 °C containing 0.7 mM CaCl2 and 2 mg/mL bovine serum albumin (BSA; Sigma-Aldrich, St. Louis, MO, USA). The cells were collected by centrifugation, resuspended in CIB containing 1.2 mM CaCl2 and 2 mg/mL BSA, and incubated at 37 °C for 10 min. The cells were resuspended in Tyrode’s solution (140 mM NaCl, 5.4 mM KCl, 1.8 mM CaCl2, 0.5 mM MgCl2, 0.33 mM NaH2PO4, 11 mM glucose, and 5 mM HEPES, pH = 7.4), seeded onto glass bottom dishes (D11530H, Matsunami Glass Ind., Osaka, Japan), and incubated at 37 °C for 10 min. The rat cardiomyocytes were isolated using the same procedure.

2.3. Experimental Setup

The experimental setup consisted of an inverted microscope (IX-73, Olympus, Tokyo, Japan), a 20× objective lens (UCplanFLN, Olympus), an sCMOS camera (ORCA Flash 4.0, Hamamatsu Photonics, Hamamatsu, Japan), a white LED illuminator (pE-100, CoolLED, Andover, United Kingdom), an LED illuminator for Fura-2 (pE-340fura, CoolLED), and an electrical stimulator [17,18]. The electrical stimulator used to evoke the excitation–contraction coupling of isolated cardiomyocytes consists of a two platinum electrode insert (Custom made, Inter Medical, Nagoya, Japan) connected to an isolator (SS-104J, Nihon Kohden, Tokyo, Japan) and a bipolar stimulator (SEN-3401, Nihon Kohden).

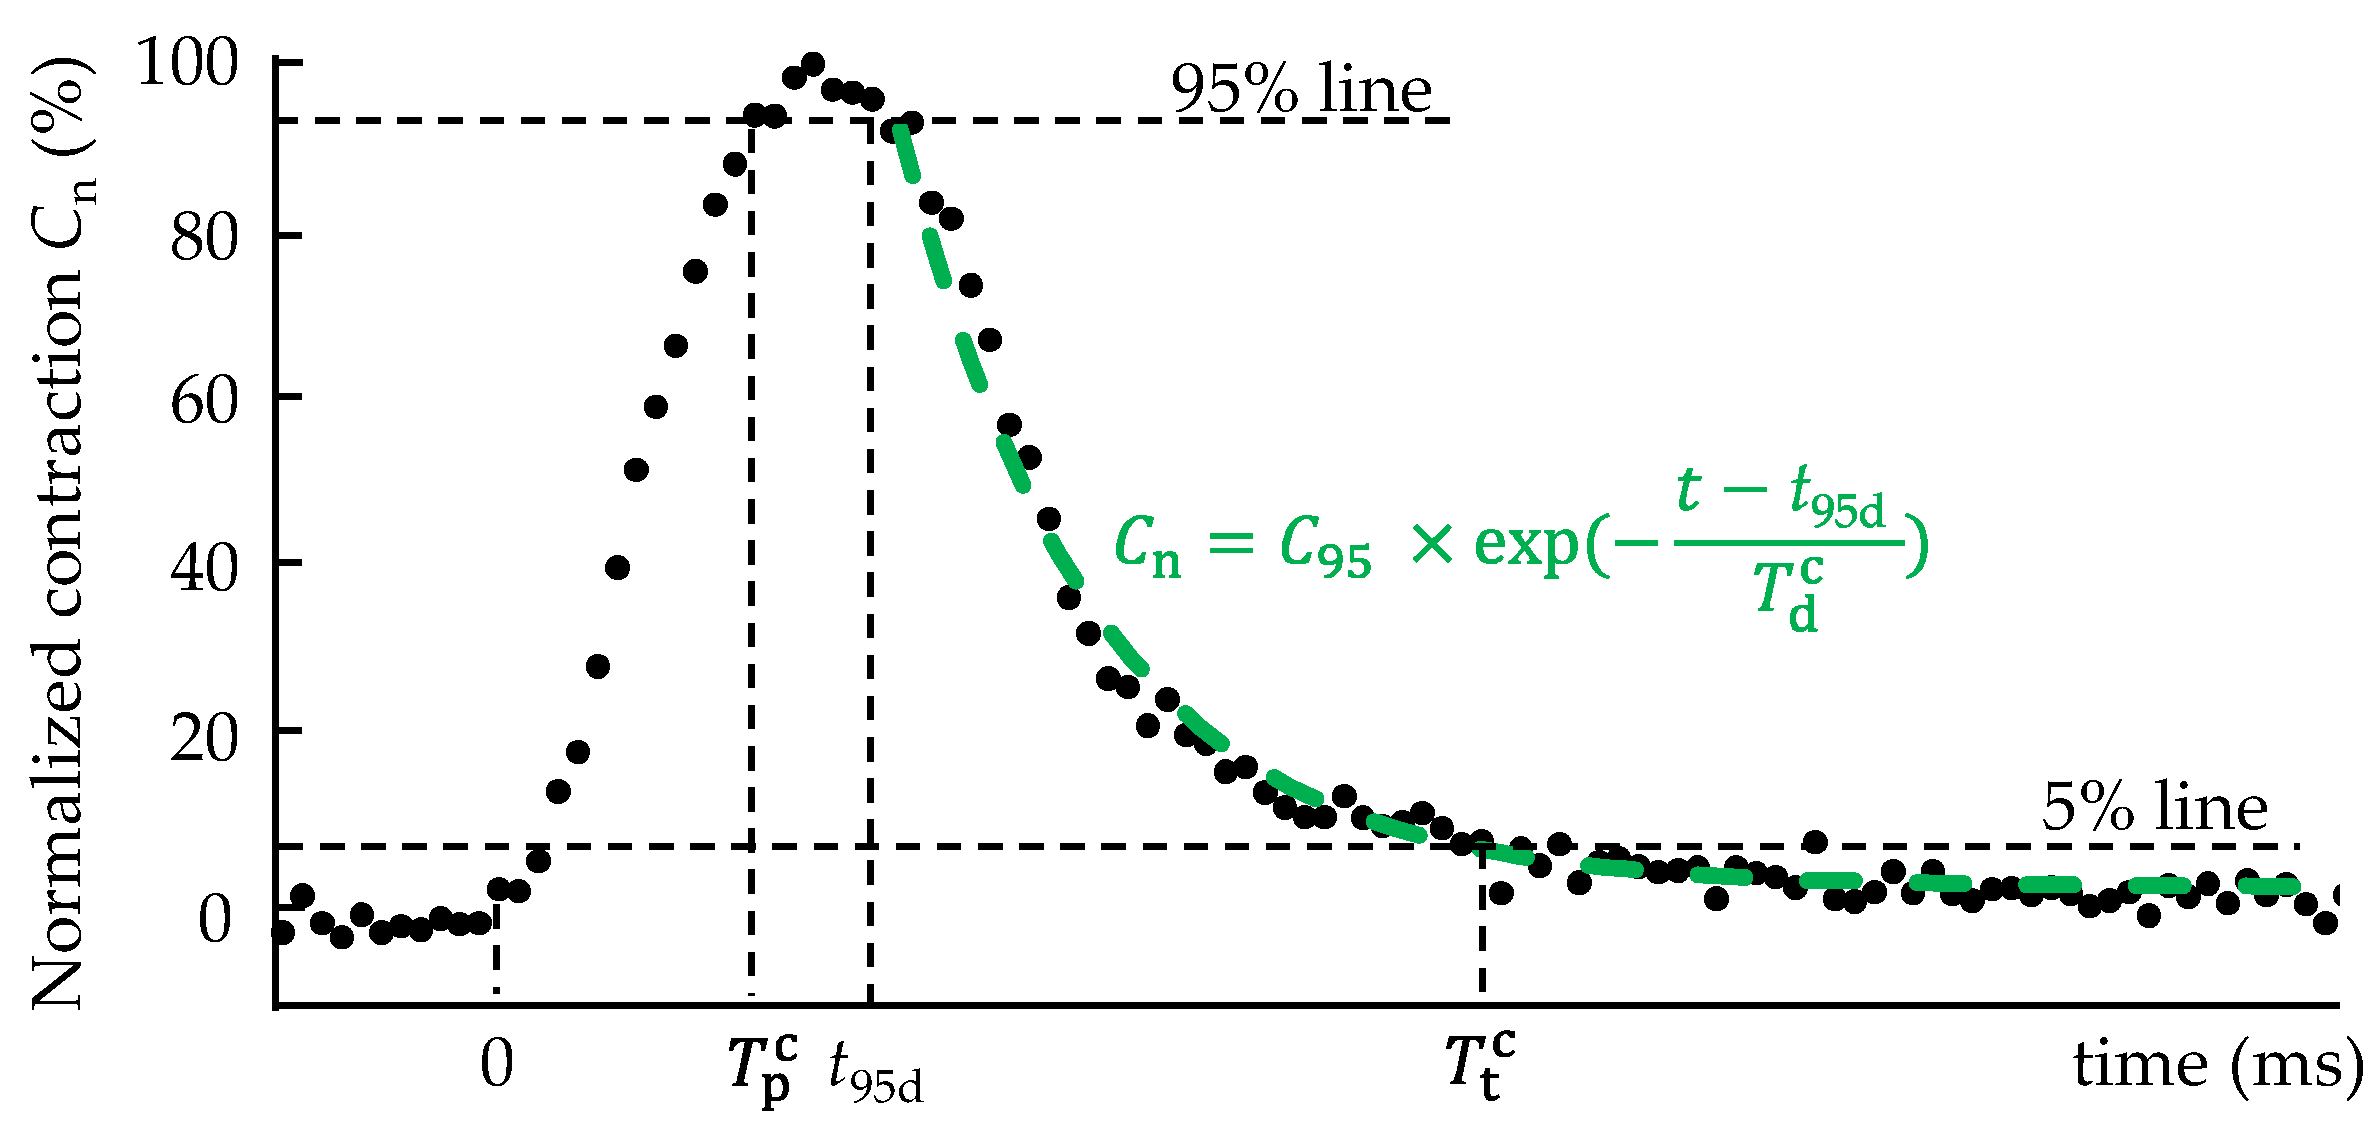
2.4. Analysis of Cell Morphology and Contraction–Relaxation Behavior

Isolated cardiomyocytes were stimulated electrically at 0.25 Hz using the electrical stimulator. Contraction C was calculated as follows:
C = L r L L r
where Lr is the cell length in the fully relaxed state and L is the cell length. The normalized contraction Cn (%) was calculated as follows:
C n = 100 × C C max
where Cmax is the maximum contraction. As shown Figure 1, the time from the onset of contraction to Cn = 95% was determined as the time to peak T p c . The normalized contraction—time relationship in the range of Cn = 95% and 0% in the relaxation phase was fitted with
C = C 95 × exp ( t t 95 d T d c )
to determine the time constant T d c [19]. Here, t is the time from the onset of contraction, t95d is the time from the onset of contraction to Cn = 95% in the relaxation phase, and C95 is a constant. The time from the start of contraction to the last Cn = 5% in the relaxation phase was evaluated as the total time T t c . Cell morphology and contraction–relaxation behaviors were analyzed using ImageJ c1.53a software (National Institutes of Health, Bethesda, MD, USA) and MetaMorph software (version 7.8.0.0; Molecular Devices, San Jose, CA, USA).

2.5. Analysis of Ca2+ Concentration Changes at the Whole-Cell Level

To measure the changes in cytoplasmic Ca2+ concentration, cells were seeded on glass bottom dishes coated with 10 µM laminin (L2020, Sigma-Aldrich). Cells that adhered to the bottom of the dish and did not move during the electrical stimulation period were used for the analysis. Fura-2 AM, a ratiometric Ca2+ indicator, was used to measure changes in the cytoplasmic Ca2+ concentration [20,21]. Isolated cardiomyocytes were incubated in Tyrode’s solution containing 10 μM Fura-2 AM and 0.2% Pluronic F-127 for 30 min. Fura-2-loaded cells were alternately excited at 340 and 380 nm using an LED illuminator for Fura-2, and the fluorescence emission intensities (F340 and F380) were recorded with the sCMOS camera. A time series of Fura-2 fluorescence intensity ratio images at 22 ms intervals was obtained using the MetaMorph software. The Ca2+ concentration of each pixel was evaluated as the fluorescence intensity ratio of each pixel Rx, y by dividing F340x, y by F380x, y, and the normalized intensity ratio R n ¯ (%) in the region of interest (ROI) was calculated by
R n ¯ = 100 × ( R ¯ R 0 ¯ R max R 0 ¯ )
where Rmax and R 0 ¯ and are the maximum ratio in the ROI and the averaged ratio in the ROI just before the electric stimulation, respectively. The time to peak T p r , time constant T d r , and total time T t r were calculated for the change in R n ¯ in the same way as for the analysis of contraction–relaxation behavior.
To compare the Ca2+ uptake ability by SERCA in quails and rats, we examined the change in Ca2+ concentration when the SERCA inhibitor, Thapsigargin (TG, 5 μM), was applied. The time constant in the presence of TG was calculated as T d r TG . The ratio of the time constant T d r TG / T d r was obtained to quantify the effect of SERCA inhibition on the Ca2+ concentration decrease.

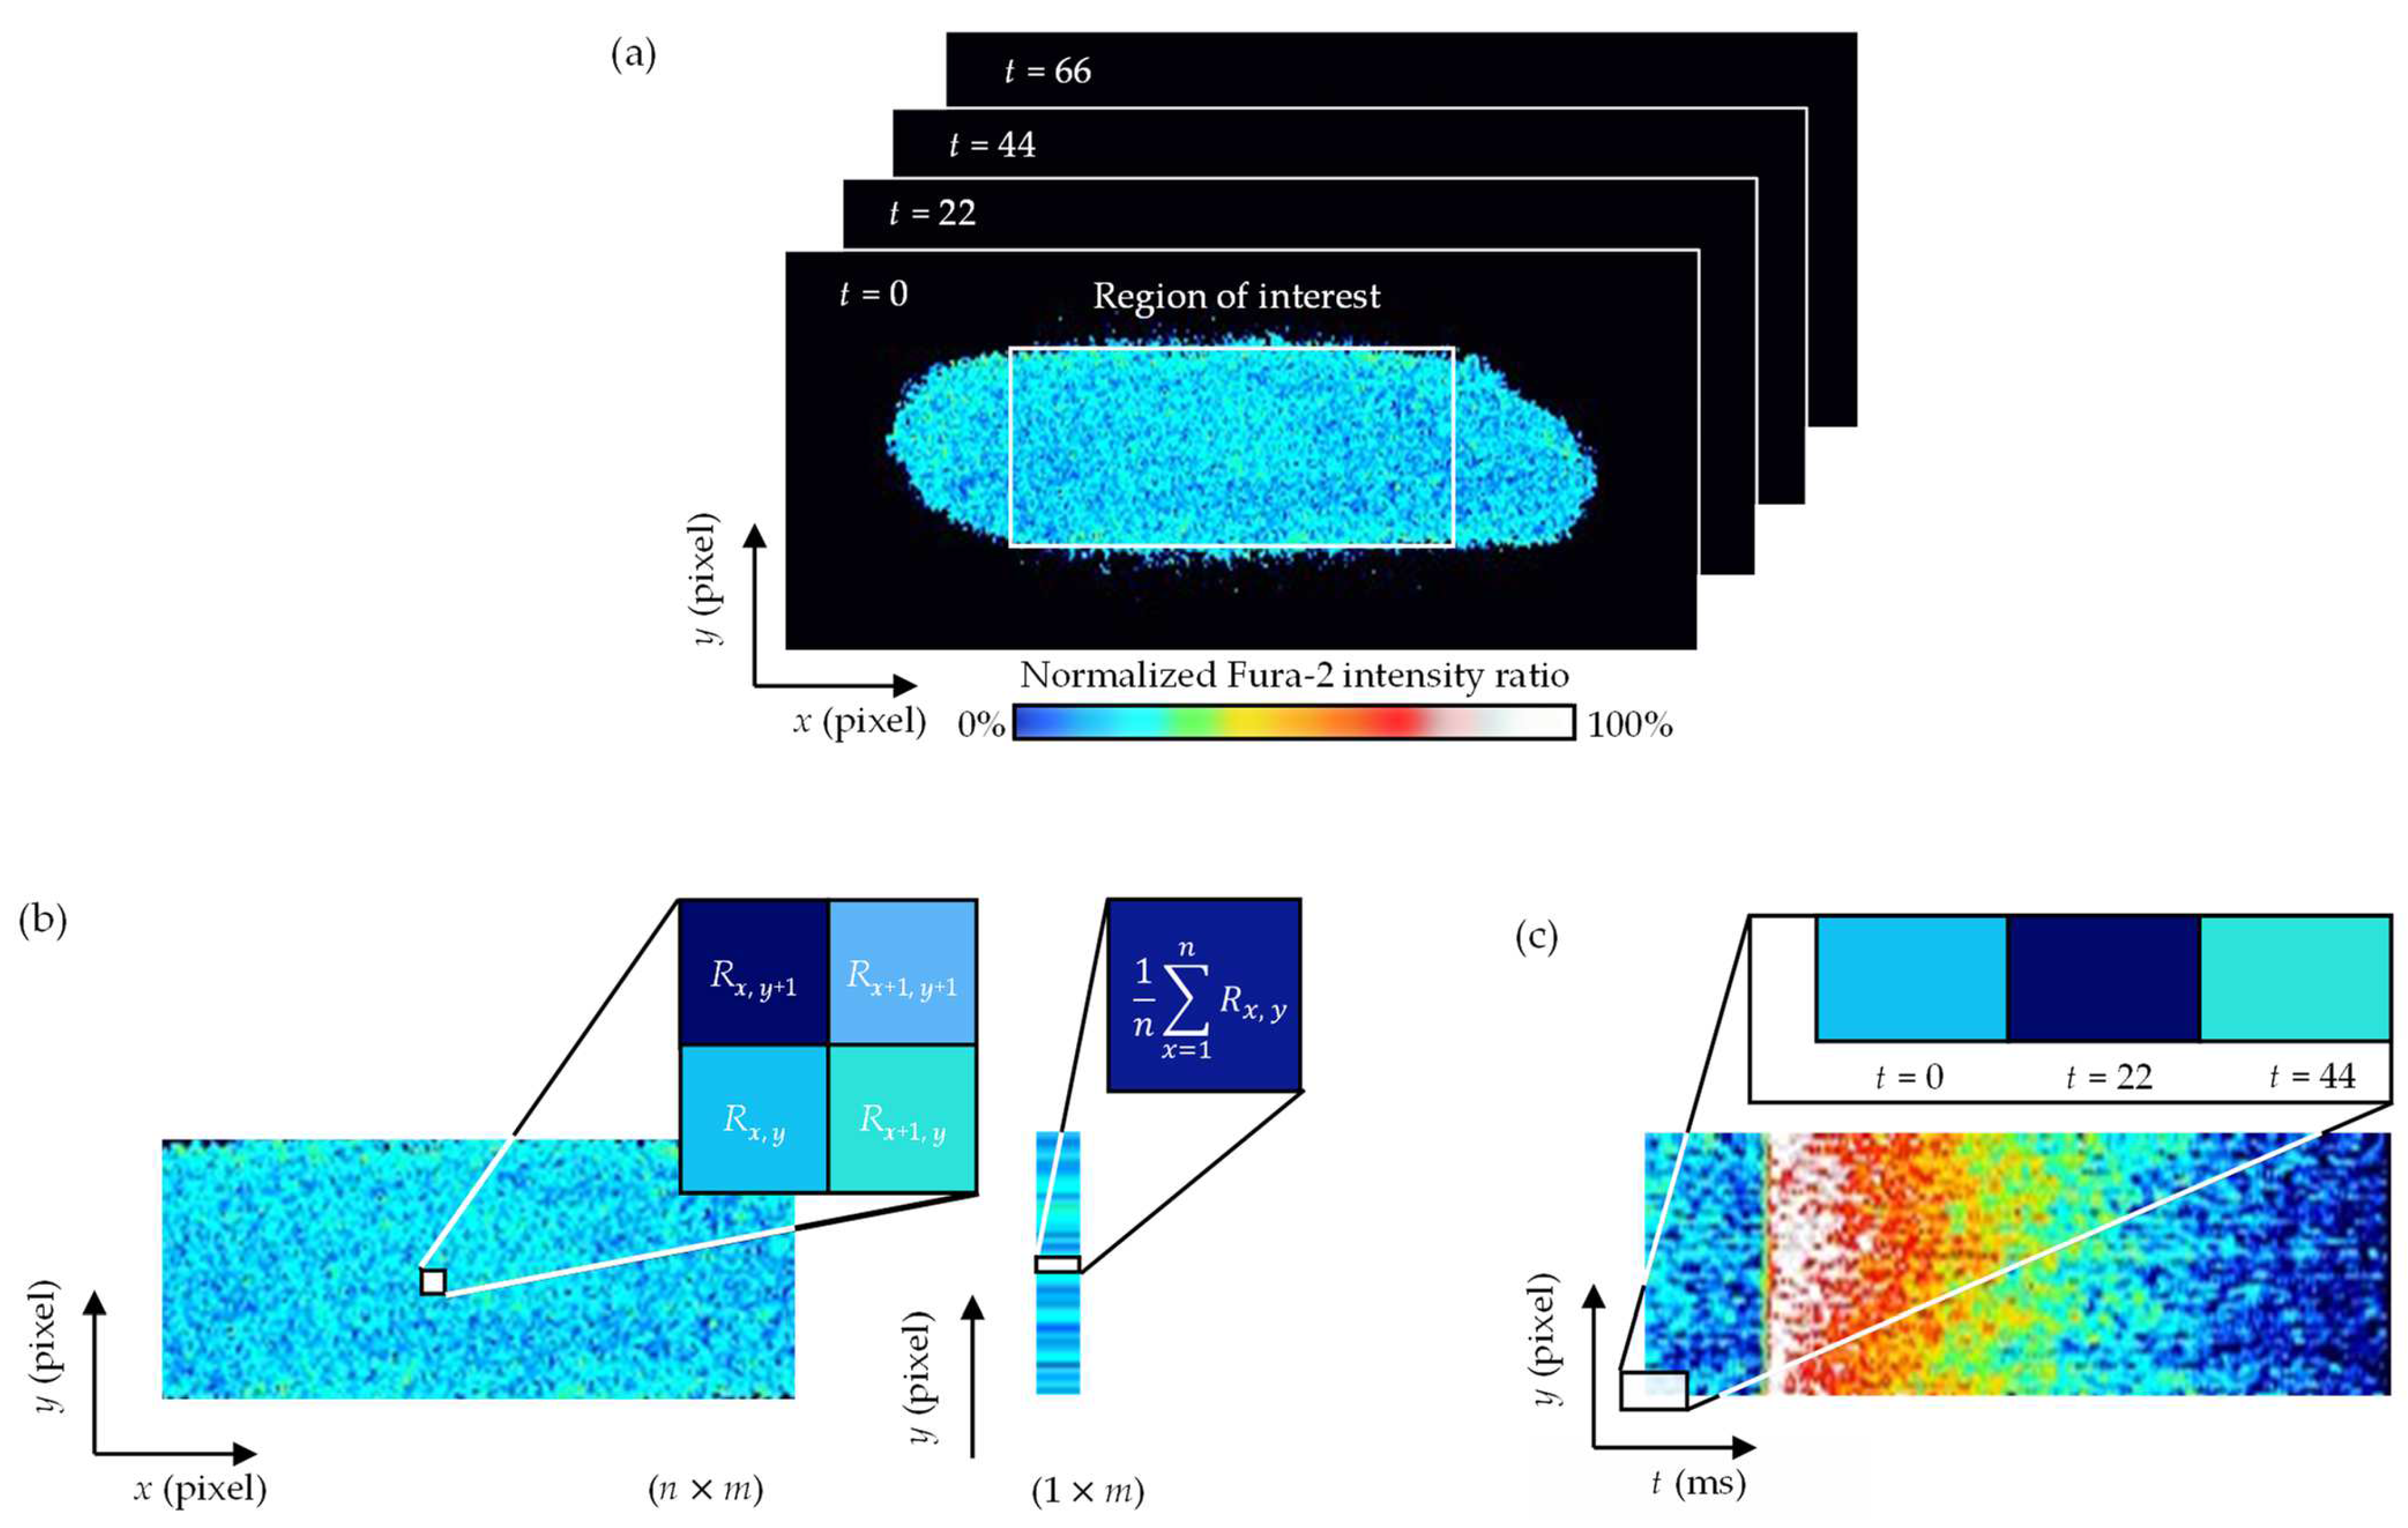
2.6. Analysis of the Spatial Distributions of Changes in Ca2+ Concentration

Upon obtaining a time series of Fura-2 fluorescence intensity ratio images of whole cells, we created a spatiotemporal map of the intensity ratio, called a kymograph (Figure 2). First, the ROI was defined for the cell such that it covered the cell body, except for the edges of the cell (Figure 2a). Then, the intensity ratio was averaged over the cell’s long axis at each short-axis position to obtain a strip map of the intensity ratio along the short axis (Figure 2b). This was performed for all the images of the series. Finally, the maps were plotted along the horizontal axis in chronological order to obtain a kymograph (Figure 2c).
To evaluate the spatial differences in Ca2+ changes, we focused on the near cell membrane (CM) and the central regions of quail cardiomyocytes (CCq region) and rat cardiomyocytes (CCr region). We obtained the time constants in CM ( T CM d r ), CCq ( T CCq d r ), and CCr ( T CCr d r ). The ratio of the time constants T CCq d r / T CM d r of quail cardiomyocytes was compared with T CCq d r / T CM d r and T CCr d r / T CM d r of rat cardiomyocytes. Image processing was performed using MATLAB and Simulink R2020b (MathWorks, Natick, MA, USA).

2.7. Statistical Method

Data are expressed as the mean ± standard deviation (SD). For comparison of the time constant near the cell membrane and in the cell center, a paired t-test was used. For other comparisons between the two groups, an unpaired t-test was used. For multiple comparisons, analysis of variance with Tukey–Kramer tests was performed. Differences were considered statistically significant at p < 0.05.

3. Results

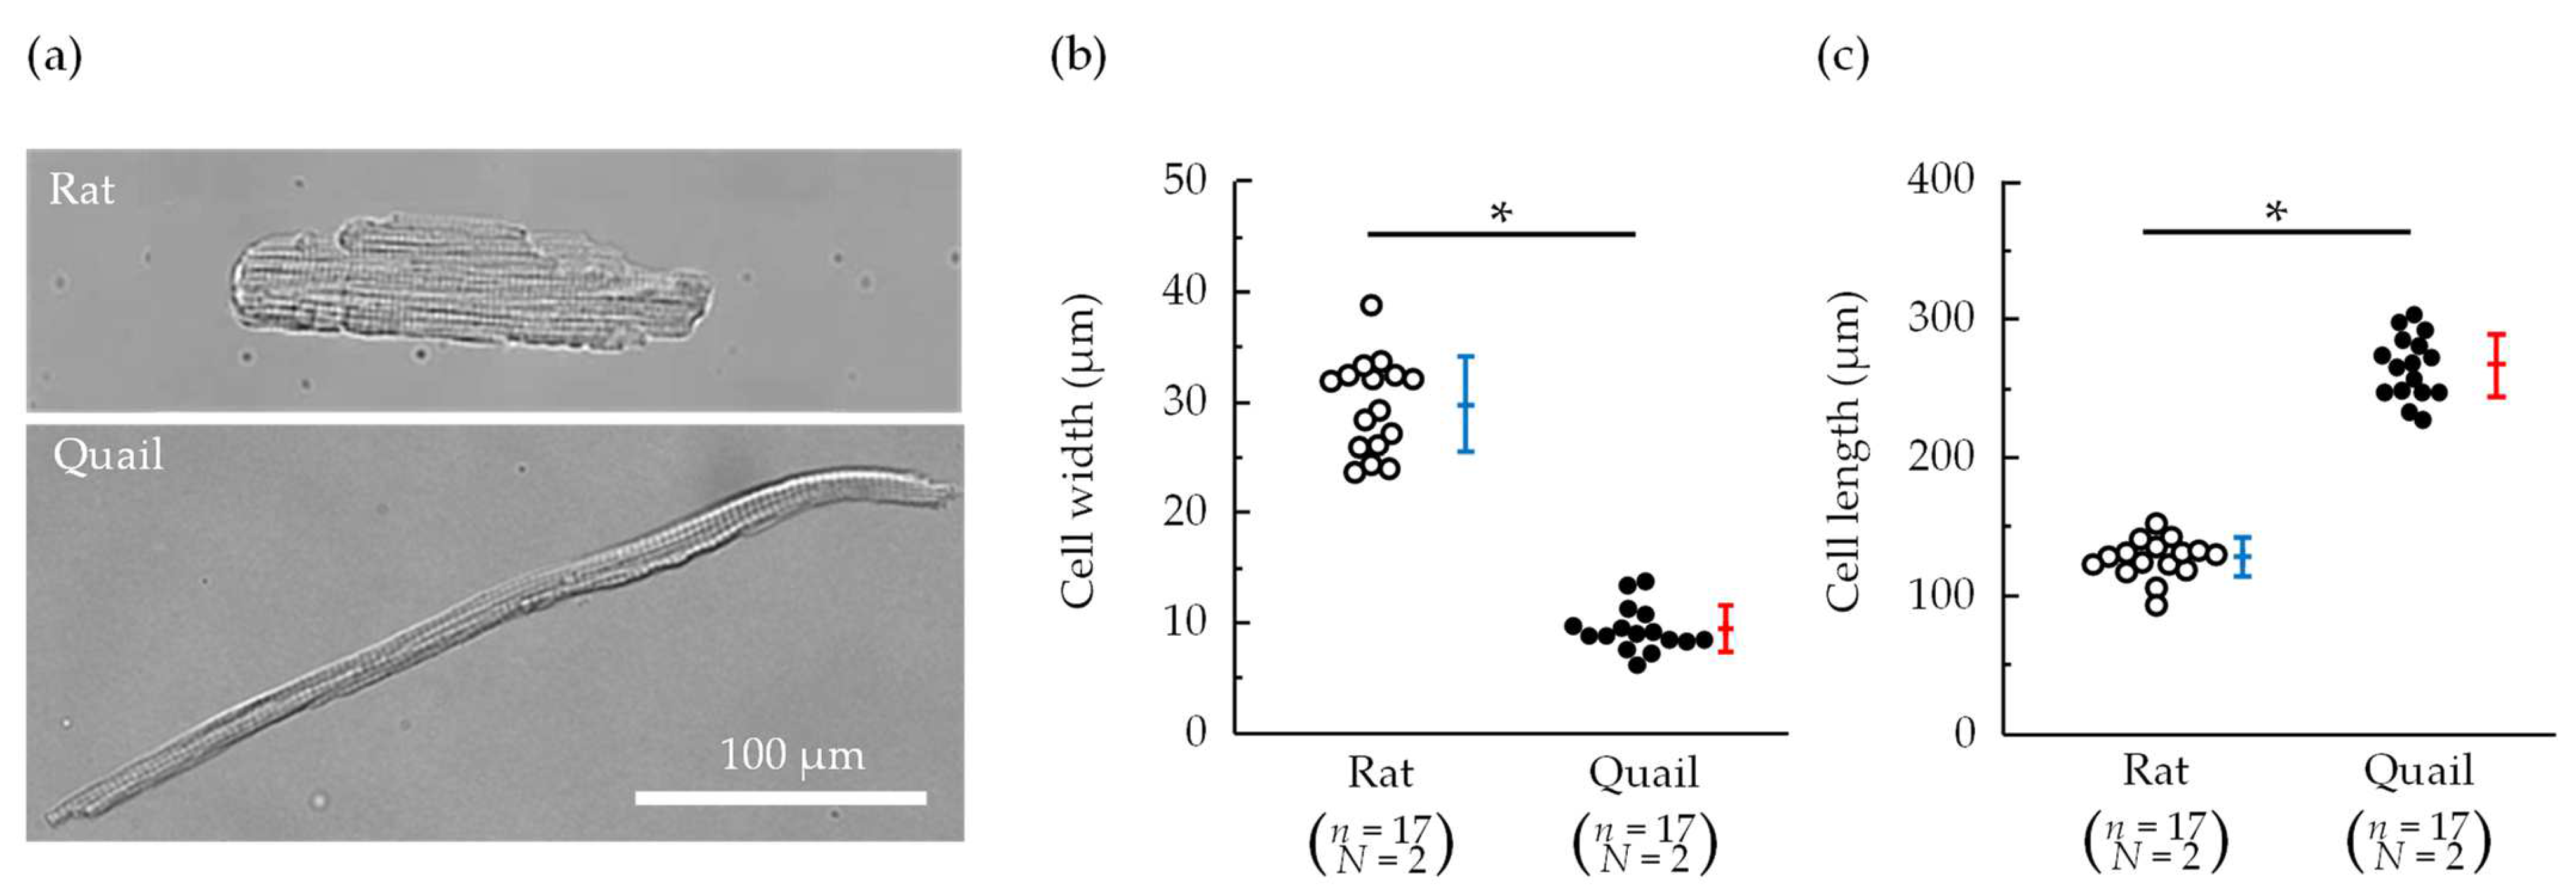
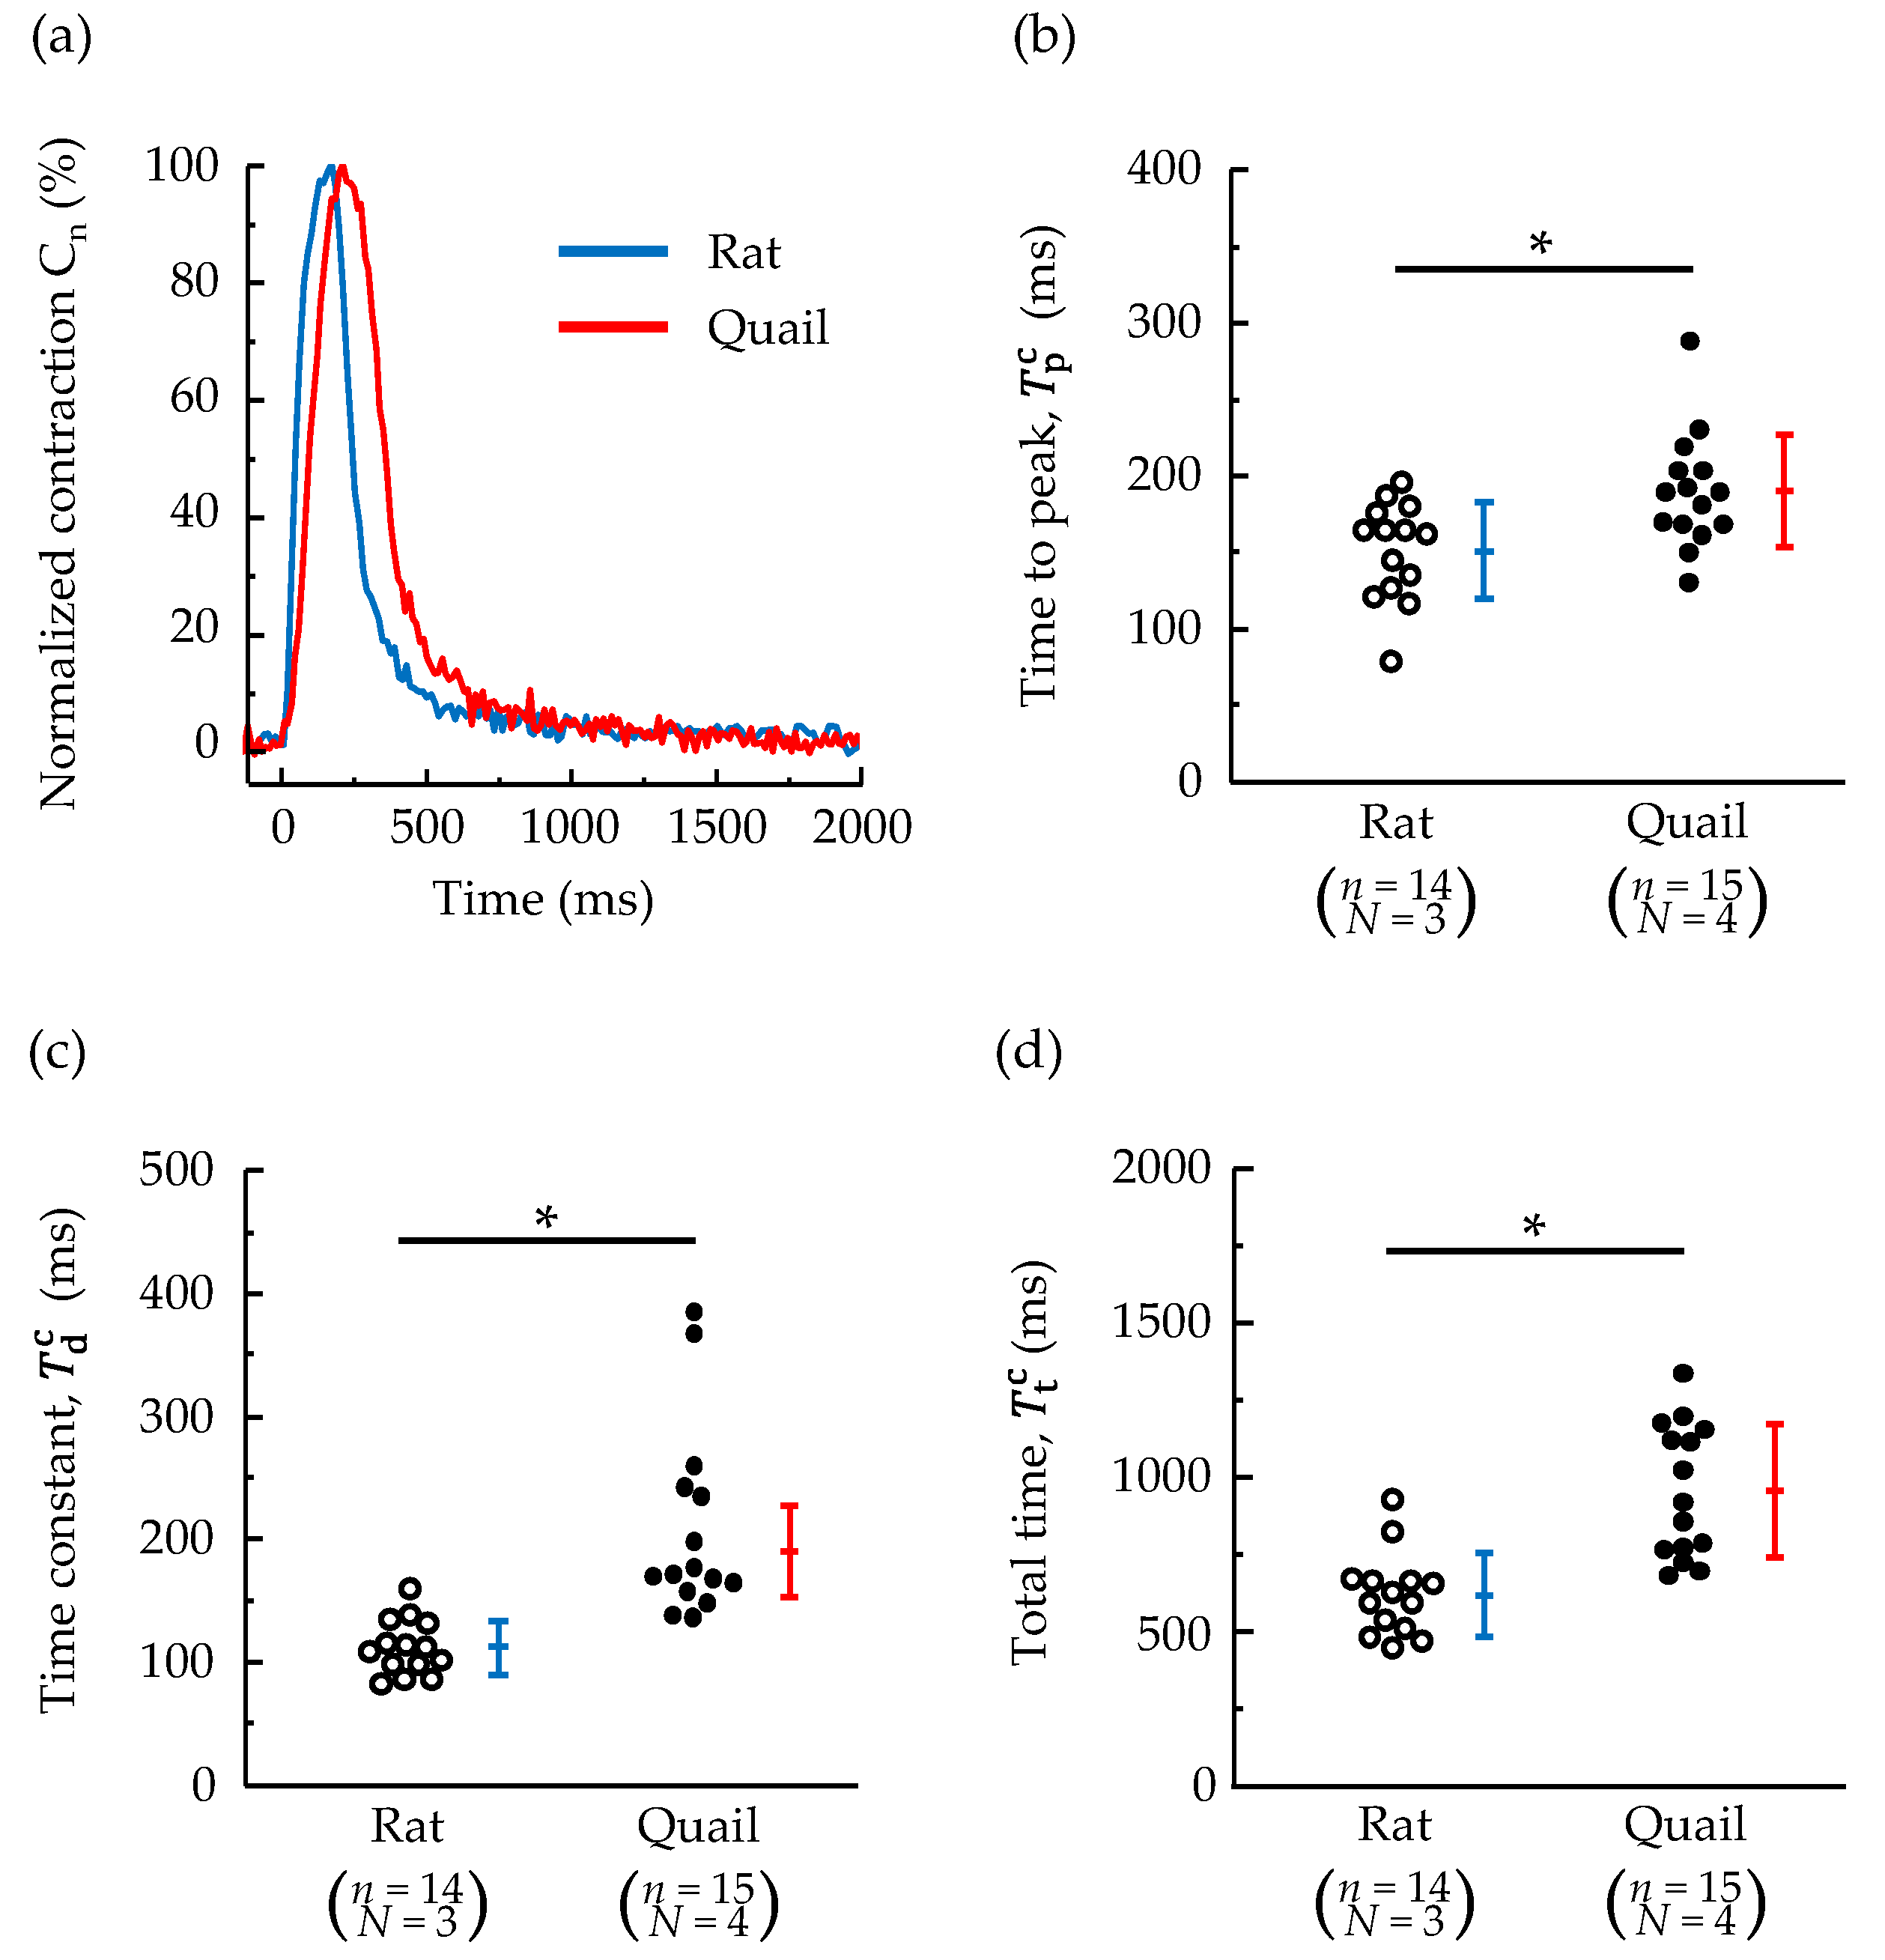
3.1. Morphology and Contraction—Relaxation Behavior of Isolated Cardiomyocytes

Typical isolated cardiomyocytes are shown in Figure 3a. Cardiomyocytes isolated from quails were spindle-shaped and significantly narrower and longer than those isolated from rats (Figure 3a–c). Regardless of the species, the cardiomyocytes with sarcomere stripes were found.
Figure 4a shows representative traces of normalized contraction of cardiomyocytes isolated from quails and rats after electrical stimulation. The contraction rate at the time of maximum contraction was 100%, and at the fully relaxed state was 0%. The trace of normalized contraction in quails is qualitatively similar to that in rats, but quantitatively different in the time taken to peak, time constant, and total time, as shown in Figure 4b–d. Quails had approximately 1.3 times longer time to peak and approximately double the time constant compared to rats. Both indices were significantly larger in quails than in rats. As a result, quails took 1.5 times longer in terms of total time than rats.

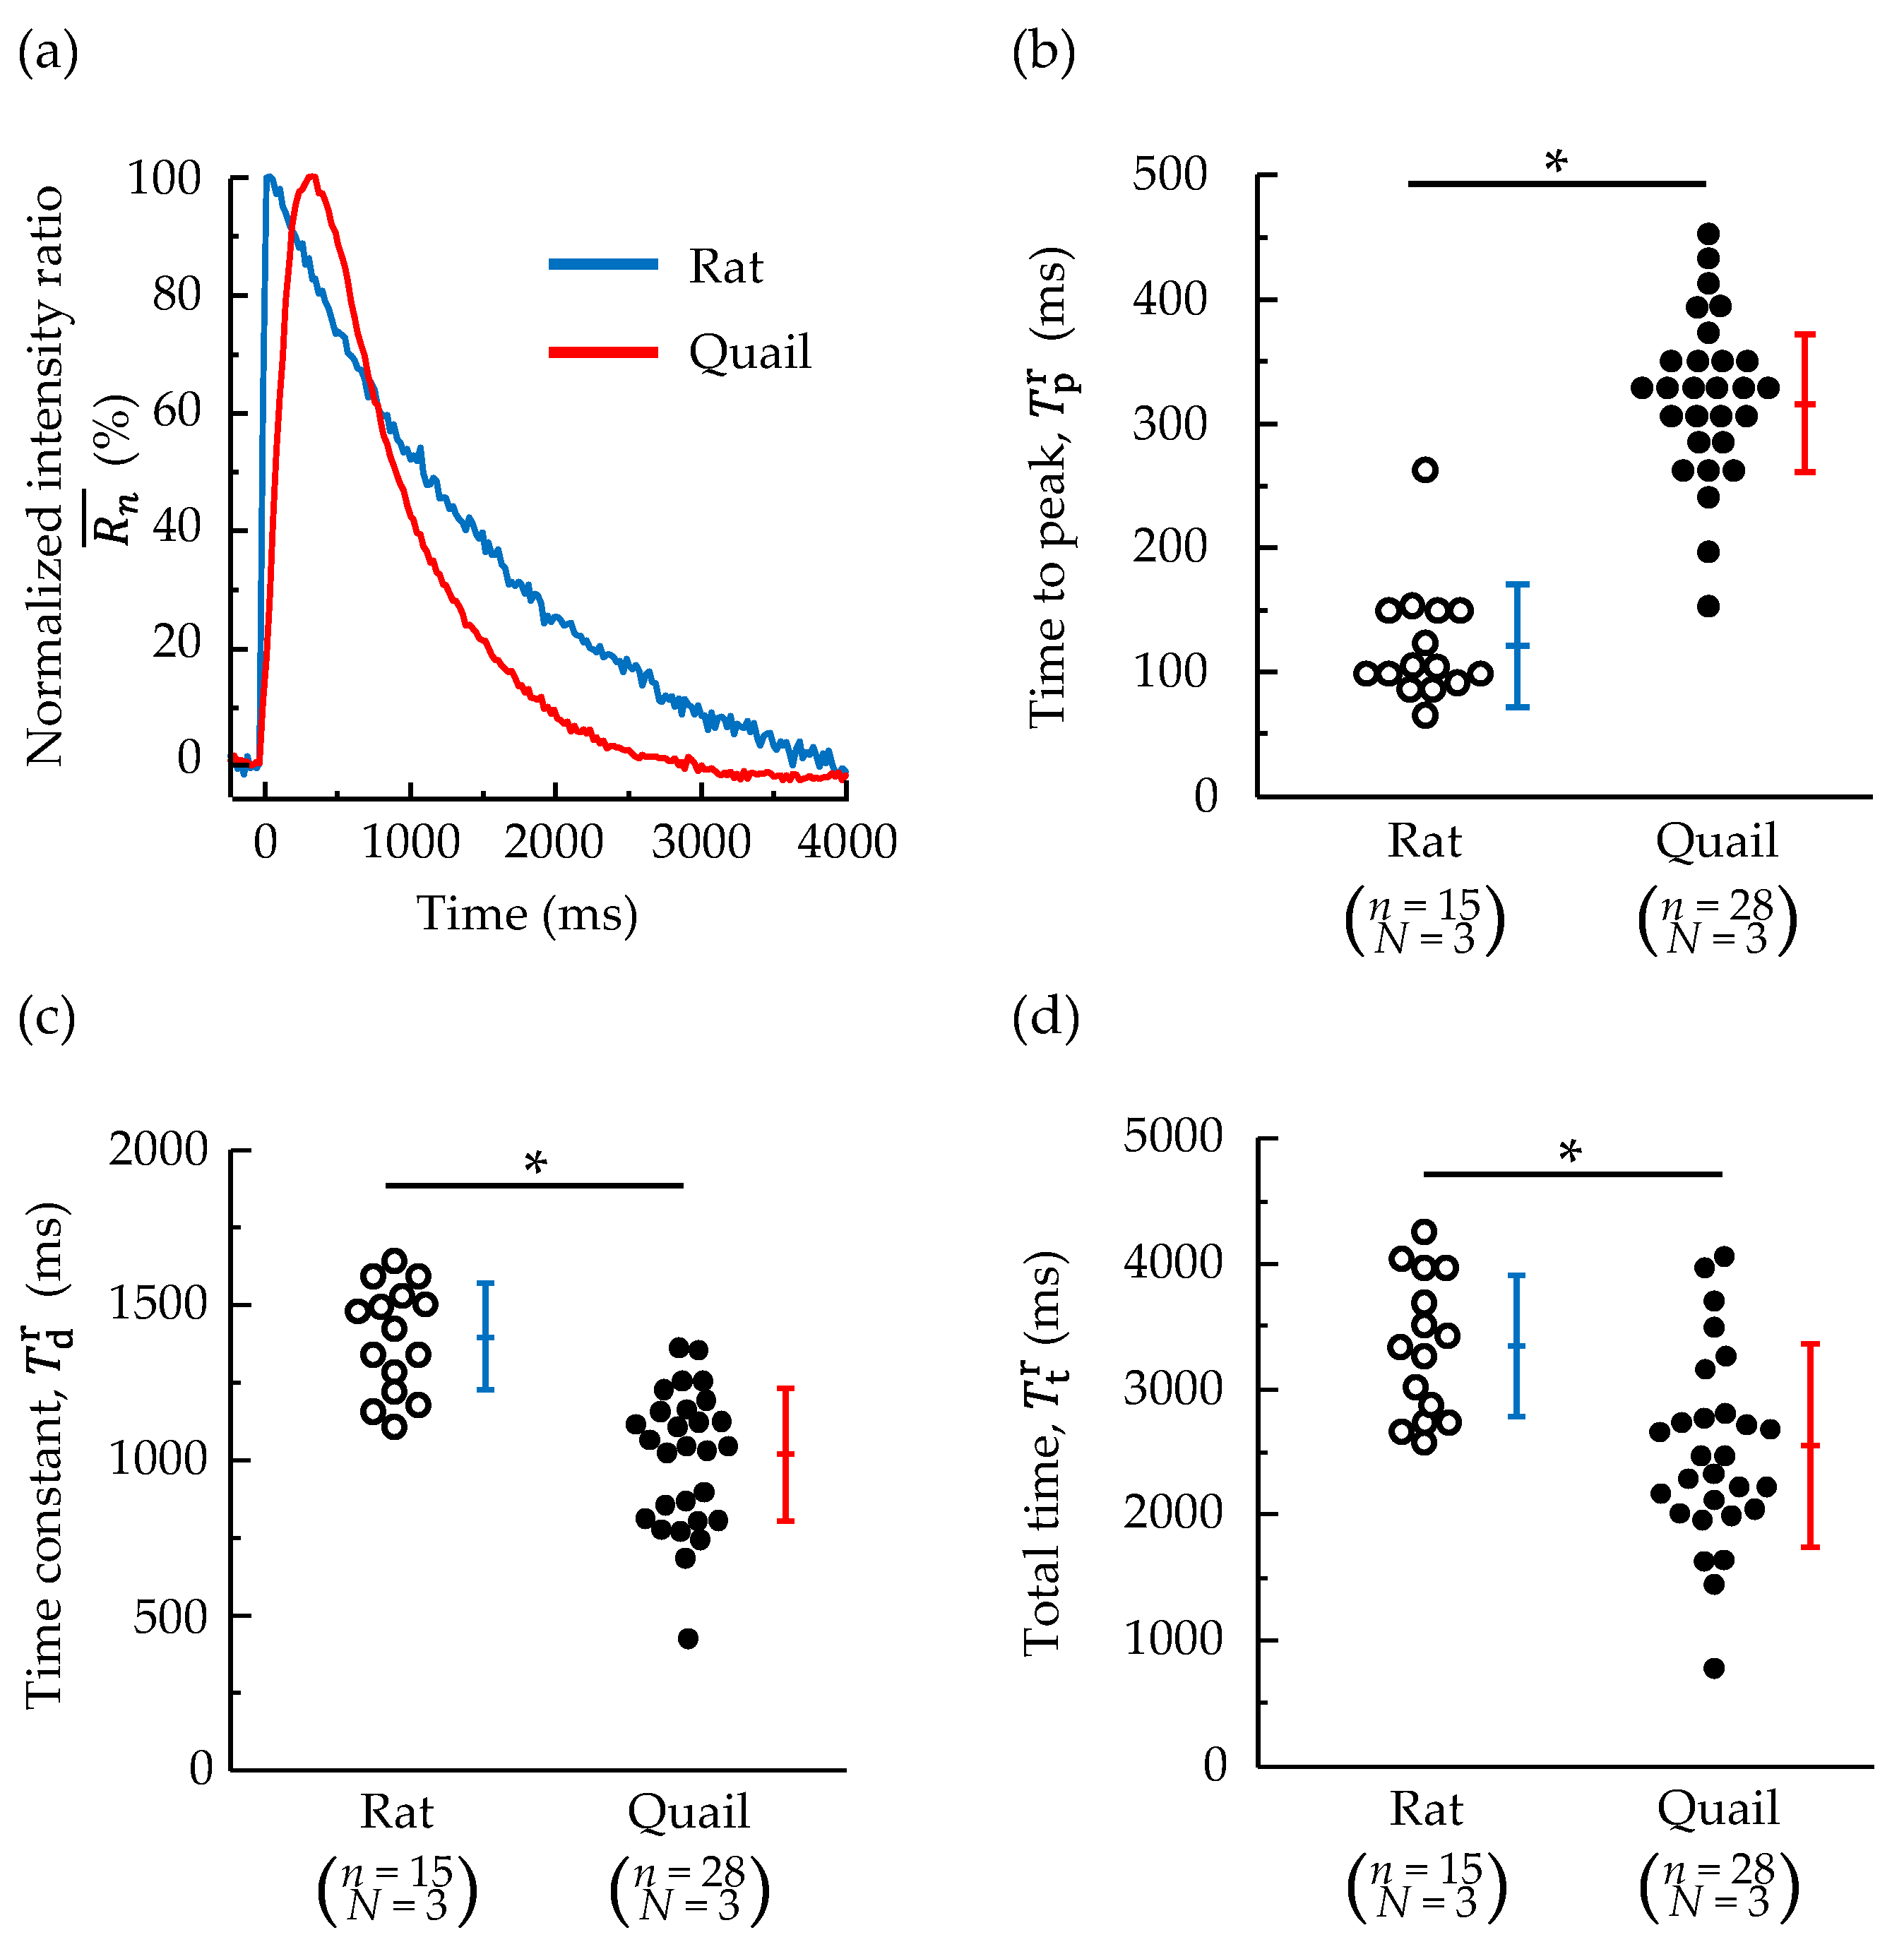
3.2. Changes in Whole-Cell Ca2+ Concentration

Typical examples of the temporal changes observed using the normalized Fura-2 fluorescence intensity ratio R n ¯ of cardiomyocytes are shown in Figure 5a. The intensity ratio of rat cardiomyocytes increased rapidly, reached a peak, and immediately began to decrease. The intensity ratio of quail cardiomyocytes showed a similar trend but plateaued around the peak. Once the intensity ratio began to decrease, the intensity ratio quickly returned to the base value.
The time taken to peak, time constant, and total time of the changes in the intensity ratio of the whole cells are shown in Figure 5b–d. The time taken to peak in quails was significantly longer than that in rats (approximately three times). On the other hand, the quail time constant was significantly smaller than the rat time constant (approximately 0.7 times). The total time taken quails was significantly shorter than that in rats (approximately 0.8 times), demonstrating that quail cardiomyocytes completed the Ca2+ concentration change more rapidly than rats.

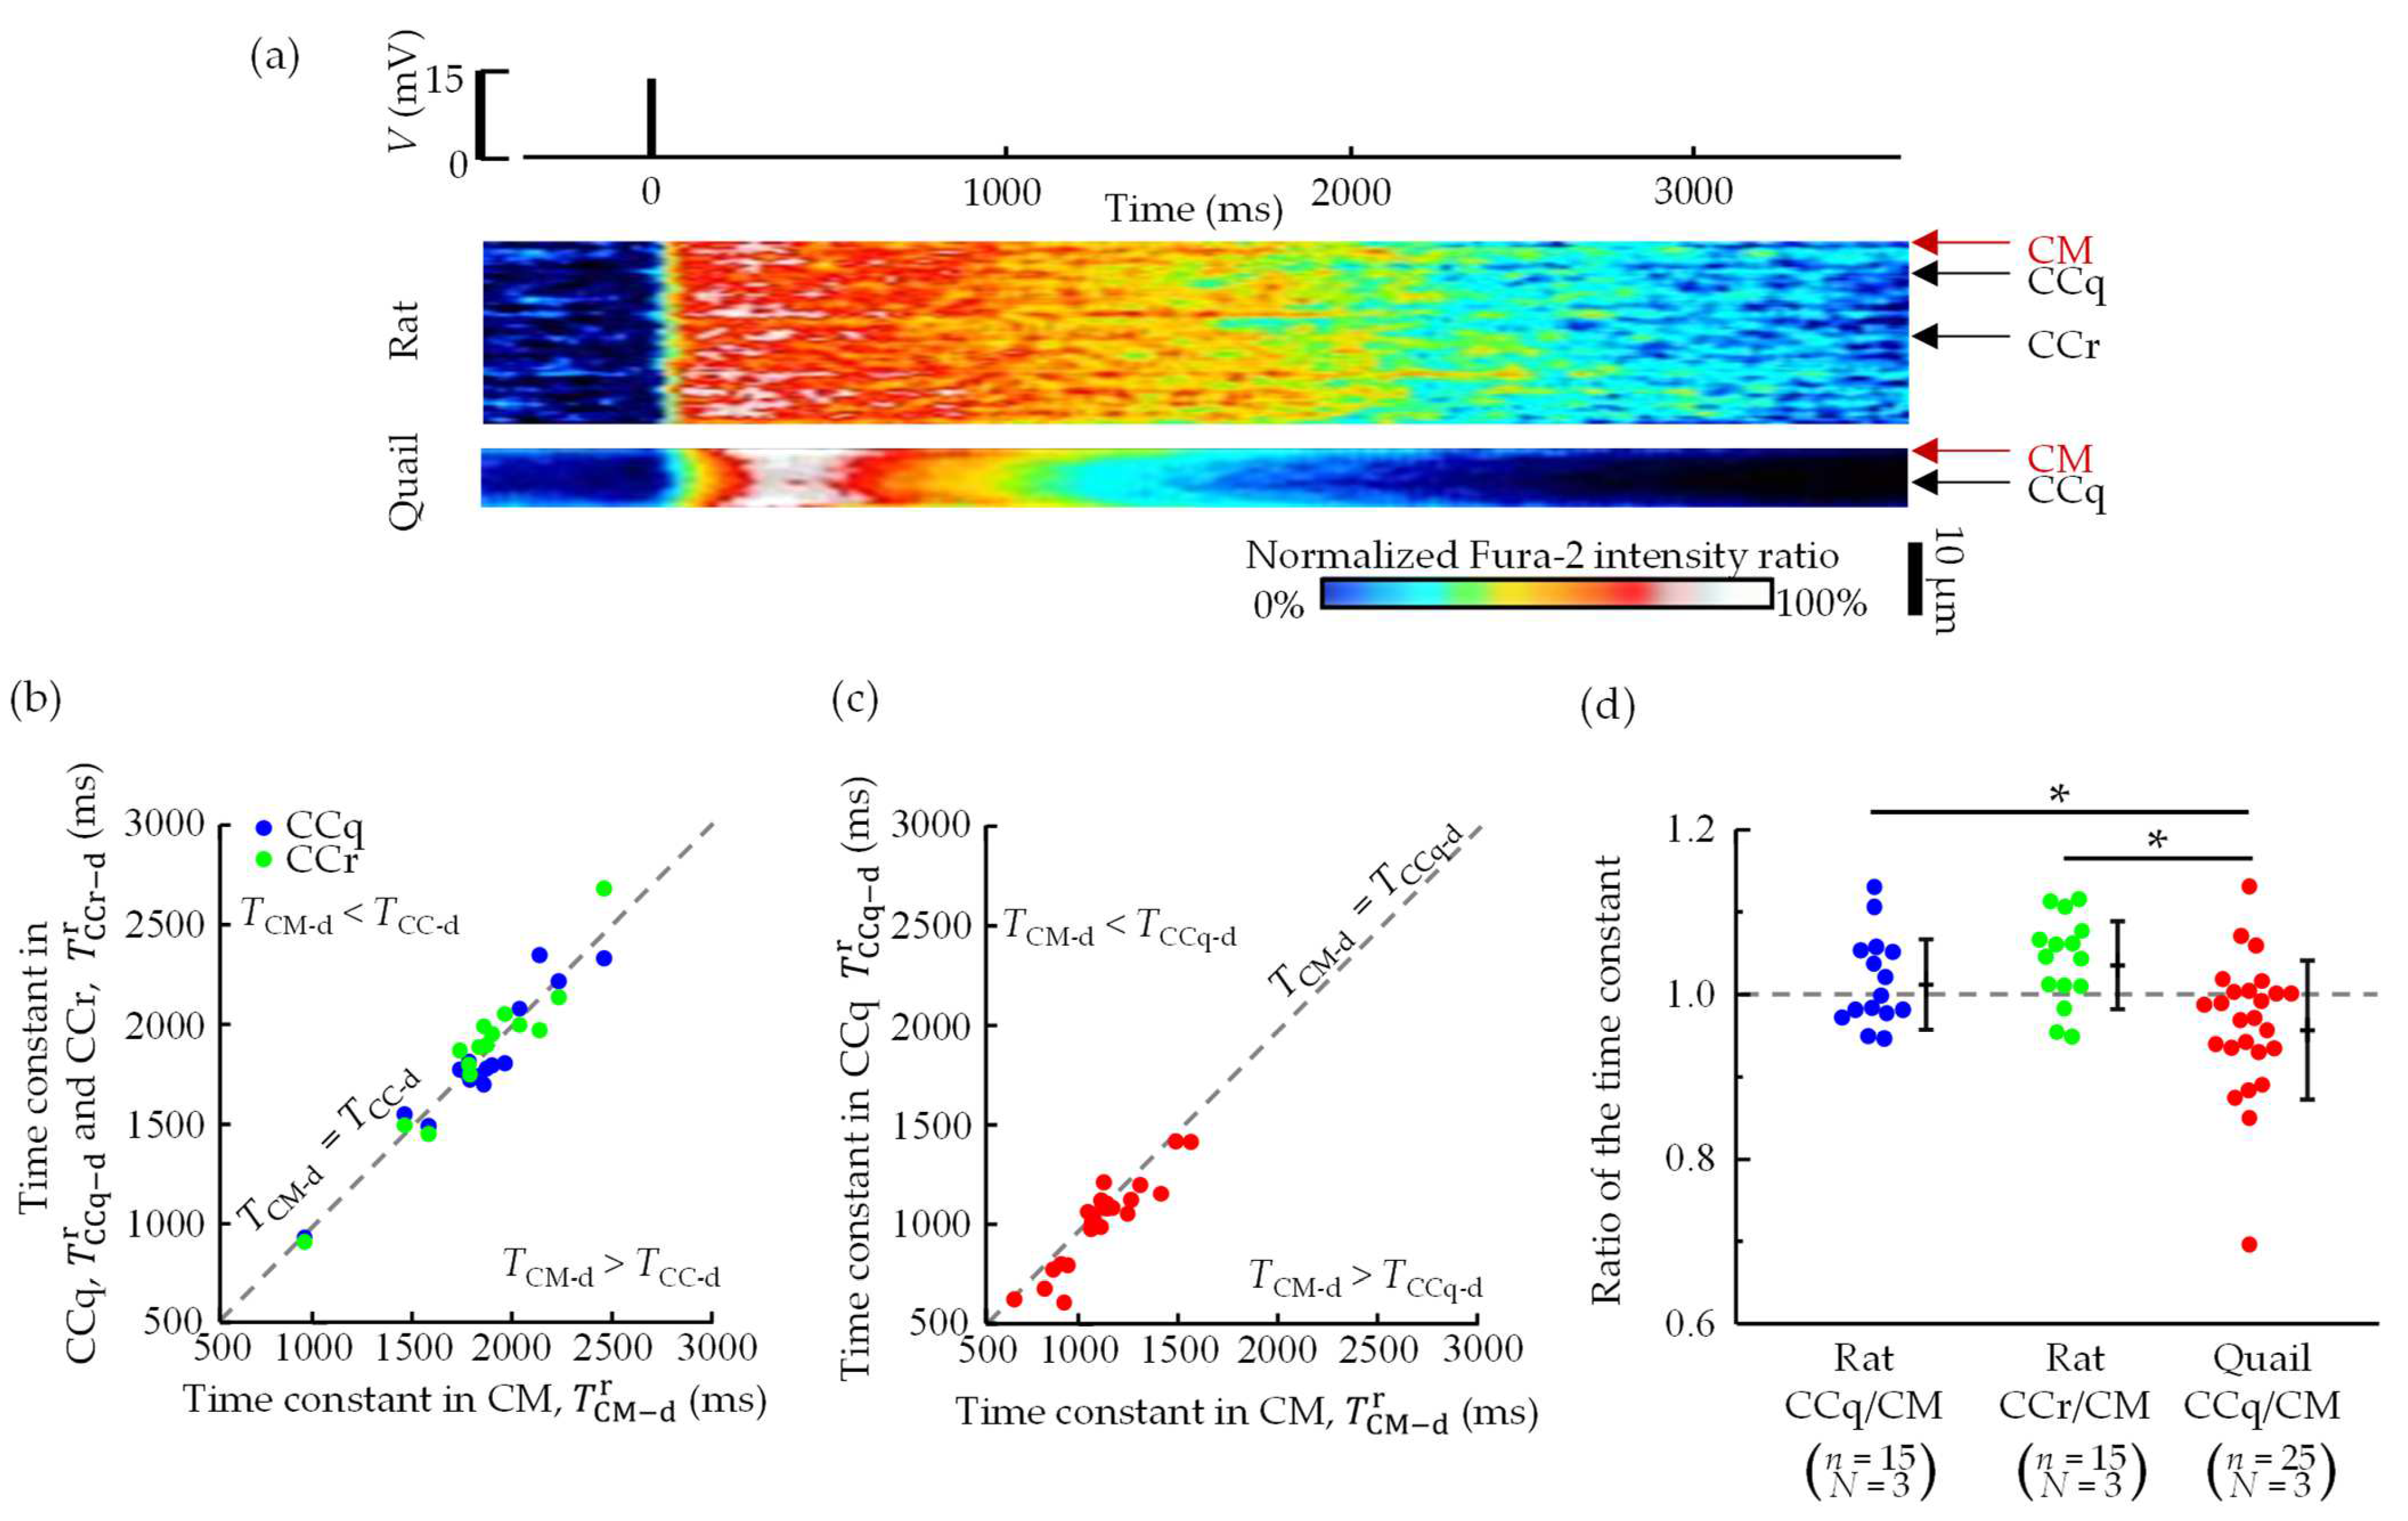
3.3. Spatial Distributions of Ca2+ Concentration

Figure 6a presents typical kymographs of the Fura-2 fluorescence intensity ratio. The position of the cell along the short axis is shown on the vertical axis, and the time is shown on the horizontal axis. The intensity ratio of the rats changed almost uniformly in space, whereas that of the quails changed nonuniformly over the short axis in the transverse direction. In particular, the increase in intensity ratio was slower at the center of the cell and the decrease was faster compared to that in the vicinity of the cell membrane.
To quantify the spatiotemporal difference in the decrease in Ca2+ concentration, we plotted the relationships between the time constants near the cell membrane (CM, T CM d r ) and in the cell center (CCq, T CCq d r ; CCr T CCr d r ) (Figure 6b,c). In rat cardiomyocytes, the plots were on a straight line ( T CCq d r = T CM d r and T CCr d r = T CM d r ). On the other hand, in quail cardiomyocytes, the plots were mostly below the straight line, demonstrating that the time constant in CCq was smaller than that in CM (p < 0.05, paired t-test). Regardless of the position, quail cardiomyocytes had a smaller time constant than rat cardiomyocytes. The ratio of the time constant T CCq d r / T CM d r of quails was less than T CCq d r / T CM d r and T CCr d r / T CM d r in rats.

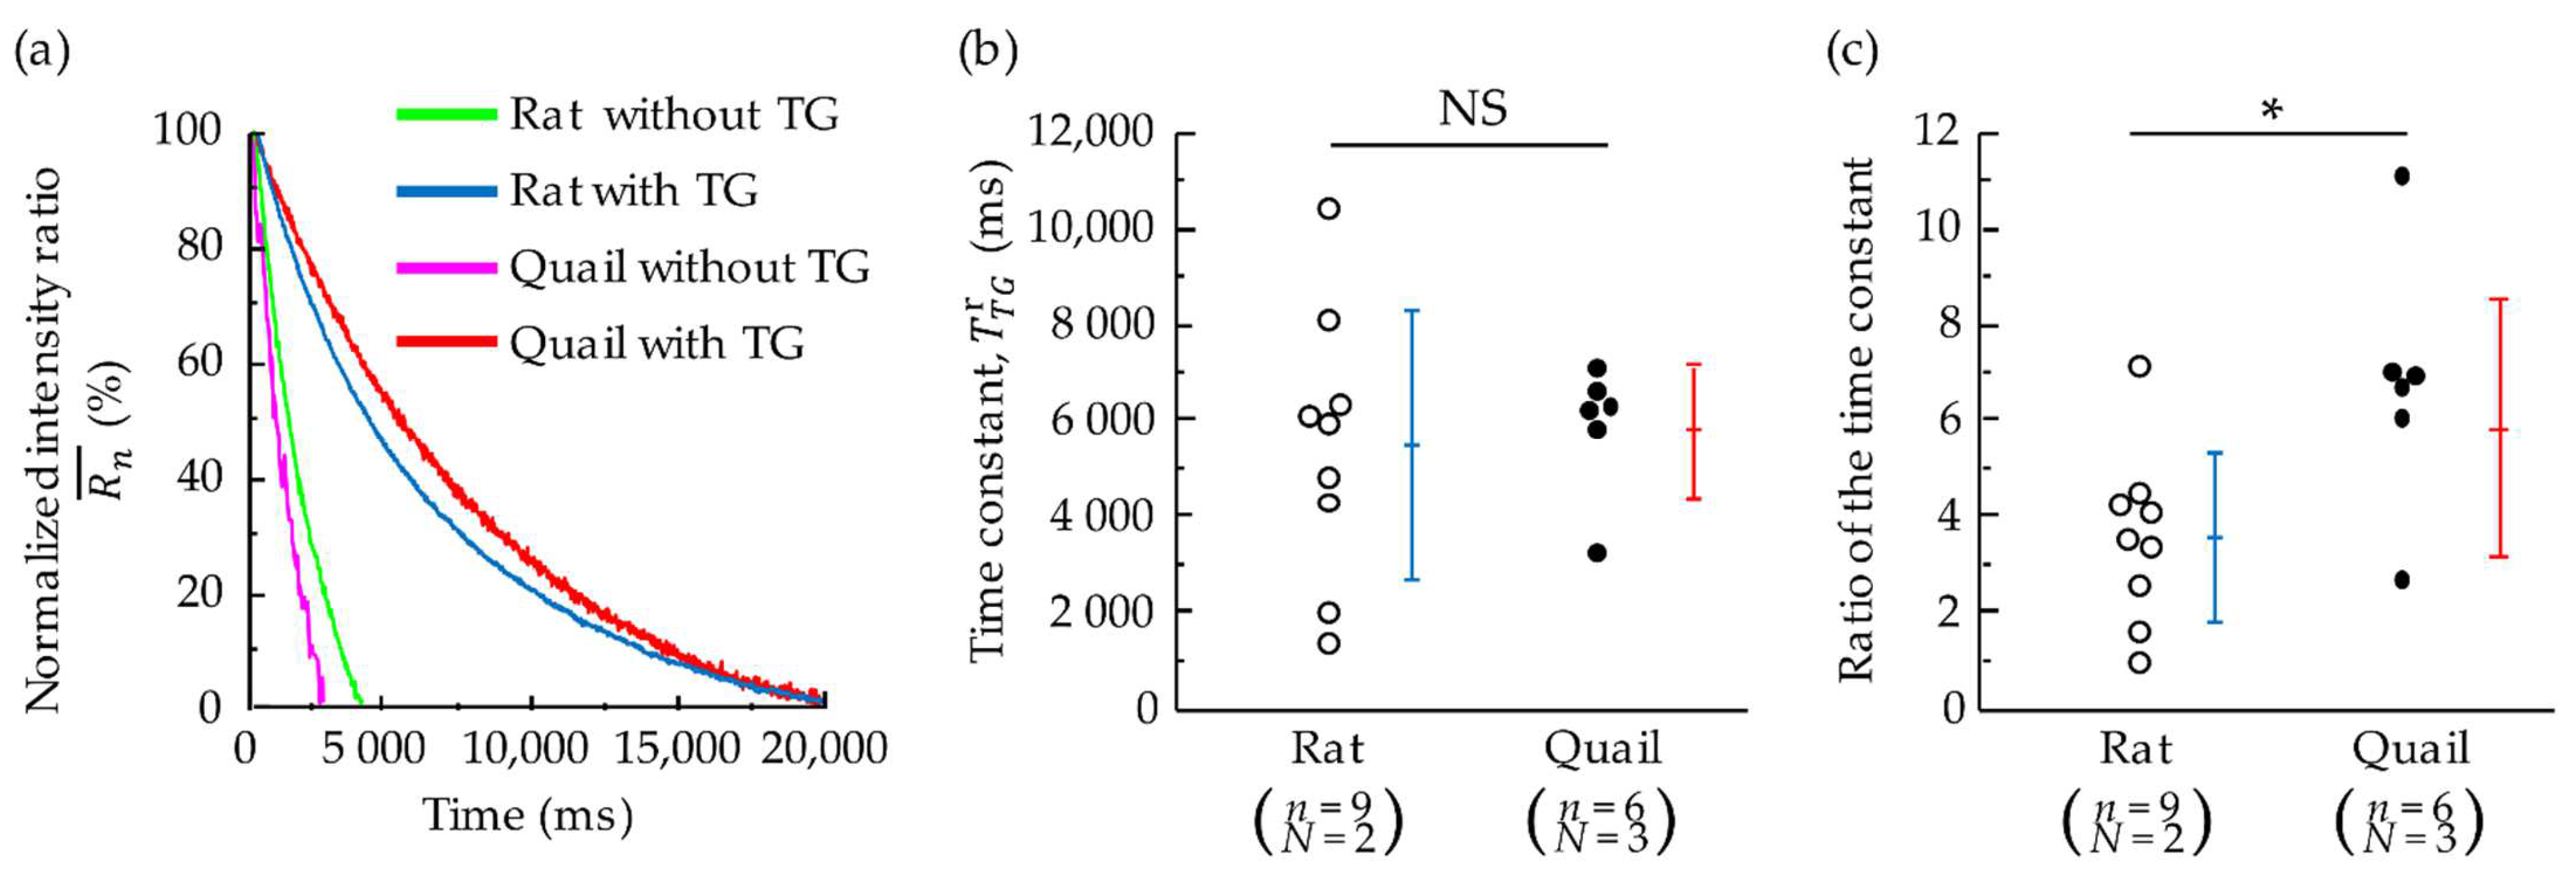
3.4. Effects of SERCA Inhibition on the Decay Speed after Peak of Whole-Cell Ca2+ Concentration

Typical examples of the normalized Fura-2 fluorescence intensity ratio R n ¯ of cardiomyocytes after the peak are shown in Figure 7a. In both rat and quail cardiomyocytes, the decrease of the intensity ratio with TG was much slower than that without TG. Without TG, the time constant of quails was much smaller than that of rats (Figure 5c). In contrast, the time constant of quails was almost the same as that of rats when TG was applied (Figure 7b). The ratio of the time constant T d r TG / T d r in quails was significantly larger than that in rats.

4. Discussion

In this study, we analyzed the changes in Ca2+ concentration in cardiomyocytes isolated from avians (quails) and mammals (rats). The results showed that the increase in whole-cell Ca2+ concentration in quail cardiomyocytes was significantly slower than that in rat cardiomyocytes, but the decrease was significantly faster. As a result, the total time taken for the Ca2+ concentration change was shorter in quail cardiomyocytes than in rat cardiomyocytes. These results indicate that quail cardiomyocytes have an enhanced Ca2+ removal mechanism to induce rapid changes in the Ca2+ concentration. More generally, avian cardiomyocytes may have acquired the ability to rapidly change the Ca2+ concentration in a different manner from mammals, who achieved rapid Ca2+ concentration changes by developing T-tubule membranes.
In quail cardiomyocytes, the time constant of the Fura-2 intensity ratio was smaller in the cell center than near the cell membrane (Figure 6c). This suggests that quail cardiomyocytes have a higher Ca2+ removal capacity at the cell center than near the cell membrane. The cytoplasmic concentration of Ca2+ is decreased either by reuptake into the SR by SERCA on the SR membrane or by removal from the cell via NCX on the cell membrane [1,2]. In mammalian cardiomyocytes, the presence of the T-tubule membrane allows Ca2+ removal using NCX [21,22,23], even in the central part of the cell. In contrast, avian cardiomyocytes do not have T-tubule membranes [7], so we assume that Ca2+ removal by NCX is low in the central part of the cell. In addition, the SR Ca2+ content in quail cardiomyocytes was reported to be higher than that in mouse cardiomyocytes [12]. Because the SR Ca2+ content is considered to reflect the uptake ability by SERCA, the uptake ability of SERCA in quail cardiomyocytes may be superior to that in mammalian cardiomyocytes. To test the hypothesis that quail SERCA has a higher capacity of Ca2+ uptake into SR than rats, we compared the change in Ca2+ concentration when the SERCA inhibitor, TG, was applied. Without TG, the time constant of quails was significantly smaller than that of rats (Figure 5c). In contrast, the time constant of quails was almost the same as that of rats when TG was applied (Figure 7a,b). The ratio of time constant with TG to that without TG in quails was significantly larger than that in rats (Figure 7c), suggesting that the activity of SERCA is higher in quails than in rats. Taken together, the enhanced Ca2+ removal ability of quail cardiomyocytes may be attributed to the enhanced ability of SERCA.
This is the first study to show the spatial variation in changes in cytoplasmic Ca2+ concentration in quail cardiomyocytes. The results showed that the Ca2+ increase in quail cardiomyocytes was slower in the center of the cell compared to the increase near the cell membranes; moreover, the increase in Ca2+ concentration was nonuniform compared to that in rat cardiomyocytes. When the T-tubule membrane of mammalian cardiomyocytes is disrupted, the increase in Ca2+ concentration becomes nonuniform [21,24,25]. This suggests that the nonuniform increase in Ca2+ concentration observed in quails is due to the absence of the T-tubule membrane.
Quail cardiomyocytes are markedly narrower than rat cardiomyocytes (Figure 3). This observation is consistent with that of a previous study [12]. This morphological feature may suppress the delay in the increase of Ca2+ concentration in the cell center, thus contributing to a spatially uniform and rapid increase in the cytoplasmic Ca2+ concentration. The increase in Ca2+ concentration in quail cardiomyocytes was slower in the center of the cell than near the cell membrane, probably because the Ca2+ released from SRs near the cell membrane takes time to be transmitted to SRs at the center of the cell. The narrower the cell width, the shorter the propagation distance, and therefore, the faster the increase in Ca2+ concentration in the center of the cell, resulting in a faster increase in the Ca2+ concentration in the entire cell. The narrow cell morphology in quails is similar to that of reptilian turtles [9,26], amphibian frogs [27,28], and other birds (chicken [29]; turkey [30]). This is a common feature of cardiomyocytes that do not possess a T-tubule membrane [12,24].
The time taken to peak for the Ca2+ concentration change in turtle cardiomyocytes was 12 times longer than required by rat cardiomyocytes [9]. Compared to the present results, we found that the cardiomyocytes of the avian quails increased Ca2+ more rapidly than those of reptilian turtles, although the cell morphology of these species is very similar. This suggests that quails have a unique method other than cell morphology that rapidly increases cytoplasmic Ca2+ concentration.
The changes in Ca2+ concentration measured in this study was slower than the ones inferred from the contraction-relaxation behavior. This is probably due to the delay in the changes in fluorescent intensity of the Ca2+ indicator in response to the changes in Ca2+ concentration. The delay increases as the dissociation rate constant koff of the Ca2+ indicator decreases [31]. Because the value of koff of Fura-2 used in this study is relatively low, the delay was large [31]. Furthermore, the value of koff decreases when indicator binds to intracellular proteins [32]. Although the binding state of Fura-2 to the protein in this study is unknown, the delay between the changes in intensity of Fura-2 and the actual changes in Ca2+ concentration would not be negligibly small.
This study has some limitations. This study examined only one type of avian and mammalian animal. Because quails are relatively active birds, the present results may not be generalizable to birds. The present study also did not fully simulate the physiological heartbeat. The heart rate of a quail is approximately 300 bpm [13], whereas in this study, we applied an electrical stimulus of 0.25 Hz (because of the low time resolution of the measurement with Fura-2). Ca2+ indicators with excellent temporal resolution, such as Indo-1 and Fluo-8, can be used to study Ca2+ concentration dynamics in avian cardiomyocytes under more physiologically accurate conditions. Use of Ca2+ indicators with high temporal resolution will open the door to examining the rate dependence of the dynamics of Ca2+ concentration and cardiac contractions, as rats behave differently from humans in this respect.

5. Conclusions

In this study, we examined Ca2+ concentration changes in quail cardiomyocytes without T-tubule membranes and rat cardiomyocytes with T-tubule membranes. Quail cardiomyocytes showed a slower increase in Ca2+ concentration than rat cardiomyocytes, but also showed a faster decrease. Quail cardiomyocytes exhibited a shorter total time of Ca2+ concentration changes. A spatiotemporal analysis of the Ca2+ concentration in quail cardiomyocytes revealed that the decrease in the Ca2+ concentration was faster at the center of the cell. These results reveal that quail cardiomyocytes have an enhanced Ca2+ removal capacity in the central part of the cell, and shed light on the mechanism by which birds achieve fast heart beating without possessing T-tubule membranes.
The present study is of some relevance to evolutionary and clinical studies. Avian cardiomyocytes have evolved differently from mammalian cardiomyocytes. Clarifying the differences between avian and mammalian cardiomyocytes will deepen our understanding of the evolutionary strategy of the vertebrate heart. Disruption of T-tubule membranes is often found in severely failed mammalian hearts. The disruption of the T-tubule membrane makes Ca2+ transport inefficient and thus worsens cardiac contraction. As avian cardiomyocytes do not naturally possess the T-tubule membranes, elucidation of the mechanism of Ca2+ regulation without the T-tubule membrane in avian cardiomyocytes will lead to the development of innovative heart failure therapies.

Author Contributions

Conceptualization, Y.U.; methodology, Y.U., H.I. and Y.O.; formal analysis, Y.O.; resources, Y.U.; investigation, Y.O., H.I., S.S., M.N. and Y.U.; writing—original draft preparation, Y.O. and Y.U.; writing—review and editing, S.S., M.N. and Y.U.; supervision, Y.U.; project administration, Y.U.; funding acquisition, Y.U. All authors have read and agreed to the published version of the manuscript.

Funding

This study was supported by the Japan Society for the Promotion of Science (JSPS) KAKENHI (Grant Numbers JP19K22962 and JP21H03794) from the Ministry of Education, Culture, Sports, Science and Technology (MEXT), Japan, and the Nitto Foundation.

Institutional Review Board Statement

The animal study protocol was approved by the institutional review board for animal care at the Nagoya Institute of Technology and under the Guide for Animal Experimentation, the Nagoya Institute of Technology.

Informed Consent Statement

Not applicable.

Data Availability Statement

Not applicable.

Acknowledgments

This study was supported by Nagoya University through the National Bio-Resource Project of MEXT, Japan.

Conflicts of Interest

The authors declare no conflict of interest.

References

  1. Bers, D.M. Cardiac excitation-contraction coupling. Nature 2002, 415, 198–205. [Google Scholar] [CrossRef] [PubMed]
  2. Bassani, J.W.; Bassani, R.A.; Bers, D.M. Relaxation in rabbit and rat cardiac cells: Species-dependent differences in cellular mechanisms. J. Physiol. 1994, 476, 279–293. [Google Scholar] [CrossRef]
  3. Johnson, E.A.; Sommer, J.R. A strand of cardiac muscle. Its ultrastructure and the electrophysiological implications of its geometry. J. Cell Biol. 1967, 33, 103–129. [Google Scholar] [CrossRef] [PubMed] [Green Version]
  4. Takeshima, H.; Komazaki, S.; Nishi, M.; Iino, M.; Kangawa, K. Junctophilins: A novel family of junctional membrane complex proteins. Mol. Cell 2000, 6, 11–22. [Google Scholar] [CrossRef] [PubMed]
  5. Louch, W.E.; Hake, J.; Jølle, G.F.; Mørk, H.K.; Sjaastad, I.; Lines, G.T.; Sejersted, O.M. Control of Ca2+ release by action potential configuration in normal and failing murine cardiomyocytes. Biophys. J. 2010, 99, 1377–1386. [Google Scholar] [CrossRef] [Green Version]
  6. Dibb, K.M.; Louch, W.E.; Trafford, A.W. Cardiac Transverse Tubules in Physiology and Heart Failure. Annu. Rev. Physiol. 2021, 84, 229–255. [Google Scholar] [CrossRef]
  7. Shiels, H.A.; Galli, G.L. The sarcoplasmic reticulum and the evolution of the vertebrate heart. Physiology 2014, 29, 456–469. [Google Scholar] [CrossRef] [Green Version]
  8. Franzini-Armstrong, C.; Protasi, F.; Tijskens, P. The assembly of calcium release units in cardiac muscle. Ann. N. Y. Acad. Sci. 2005, 1047, 76–85. [Google Scholar] [CrossRef]
  9. Honda, T.; Ujihara, Y.; Hanashima, A.; Hashimoto, K.; Tanemoto, K.; Mohri, S. Turtle spongious ventricles exhibit more compliant diastolic property and possess larger elastic regions of connectin in comparison to rat compact left ventricles. Kawasaki Med. J. 2018, 44, 1–17. [Google Scholar] [CrossRef]
  10. Grubb, B.R. Allometric relations of cardiovascular function in birds. Am. J. Physiol. 1983, 245, H567–H572. [Google Scholar] [CrossRef]
  11. Sheard, T.M.D.; Kharche, S.R.; Pinali, C.; Shiels, H.A. 3D ultrastructural organisation of calcium release units in the avian sarcoplasmic reticulum. J. Exp. Biol. 2019, 222, jeb197640. [Google Scholar] [CrossRef] [PubMed] [Green Version]
  12. Filatova, T.S.; Abramochkin, D.V.; Shiels, H.A. Warmer, faster, stronger: Ca2+ cycling in avian myocardium. J. Exp. Biol. 2020, 223, jeb228205. [Google Scholar] [CrossRef] [PubMed]
  13. Valance, D.; Desprès, G.; Boissy, A.; Mignon-Grasteau, S.; Constantin, P.; Leterrier, C. Genetic selection on a behavioural fear trait is associated with changes in heart rate variability in quail. Genes Brain Behav. 2007, 6, 339–346. [Google Scholar] [CrossRef] [PubMed]
  14. Möller, C.; van Dijk, R.M.; Wolf, F.; Keck, M.; Schönhoff, K.; Bierling, V.; Potschka, H. Impact of repeated kindled seizures on heart rate rhythms, heart rate variability, and locomotor activity in rats. Epilepsy Behav. 2019, 92, 36–44. [Google Scholar] [CrossRef] [Green Version]
  15. Shioya, T. A simple technique for isolating healthy heart cells from mouse models. J. Physiol. Sci. 2007, 57, 327–335. [Google Scholar] [CrossRef] [PubMed] [Green Version]
  16. Ujihara, Y.; Kanagawa, M.; Mohri, S.; Takatsu, S.; Kobayashi, K.; Toda, T.; Naruse, K.; Katanosaka, Y. Elimination of fukutin reveals cellular and molecular pathomechanisms in muscular dystrophy-associated heart failure. Nat. Commun. 2019, 10, 5754. [Google Scholar] [CrossRef]
  17. Sato, M.; Miyata, K.; Tian, Z.; Kadomatsu, T.; Ujihara, Y.; Morinaga, J.; Horiguchi, H.; Endo, M.; Zhao, J.; Zhu, S.; et al. Loss of Endogenous HMGB2 Promotes Cardiac Dysfunction and Pressure Overload-Induced Heart Failure in Mice. Circ. J. 2019, 83, 368–378. [Google Scholar] [CrossRef] [PubMed] [Green Version]
  18. Hashimoto, K.; Kodama, A.; Ohira, M.; Kimoto, M.; Nakagawa, M.; Usui, Y.; Ujihara, Y.; Hanashima, A.; Mohri, S. Transient induction of cell cycle promoter Fam64a improves cardiac function through regulating Klf15-dependent cardiomyocyte differentiation in mice. BioRxiv 2021. [Google Scholar] [CrossRef]
  19. Illaste, A.; Wullschleger, M.; Fernandez-Tenorio, M.; Niggli, E.; Egger, M. Automatic Detection and Classification of Ca2+ Release Events in Line- and Frame-Scan Images. Biophys. J. 2019, 116, 383–394. [Google Scholar] [CrossRef] [Green Version]
  20. Katanosaka, Y.; Iwasaki, K.; Ujihara, Y.; Takatsu, S.; Nishitsuji, K.; Kanagawa, M.; Sudo, A.; Toda, T.; Katanosaka, K.; Mohri, S.; et al. TRPV2 is critical for the maintenance of cardiac structure and function in mice. Nat. Commun. 2014, 5, 3932. [Google Scholar] [CrossRef] [Green Version]
  21. Ujihara, Y.; Iwasaki, K.; Takatsu, S.; Hashimoto, K.; Naruse, K.; Mohri, S.; Katanosaka, Y. Induced NCX1 overexpression attenuates pressure overload-induced pathological cardiac remodelling. Cardiovasc. Res. 2016, 111, 348–361. [Google Scholar] [CrossRef] [PubMed] [Green Version]
  22. Scriven, D.R.; Moore, E.D. Ca²⁺ channel and Na⁺/Ca²⁺ exchange localization in cardiac myocytes. J. Mol. Cell. Cardiol. 2013, 58, 22–31. [Google Scholar] [CrossRef] [PubMed]
  23. Ujihara, Y.; Mohri, S.; Katanosaka, Y. Effects of induced Na+/Ca2+ exchanger overexpression on the spatial distribution of L-type Ca2+ channels and junctophilin-2 in pressure-overloaded hearts. Biochem. Biophys. Res. Commun. 2016, 480, 564–569. [Google Scholar] [CrossRef] [PubMed] [Green Version]
  24. Louch, W.E.; Mørk, H.K.; Sexton, J.; Strømme, T.A.; Laake, P.; Sjaastad, I.; Sejersted, O.M. T-tubule disorganization and reduced synchrony of Ca2+ release in murine cardiomyocytes following myocardial infarction. J. Physiol. 2006, 574 Pt 2, 519–533. [Google Scholar] [CrossRef]
  25. Øyehaug, L.; Loose, K.Ø.; Jølle, G.F.; Røe, Å.T.; Sjaastad, I.; Christensen, G.; Sejersted, O.M.; Louch, W.E. Synchrony of cardiomyocyte Ca2+ release is controlled by T-tubule organization, SR Ca2+ content, and ryanodine receptor Ca2+ sensitivity. Biophys. J. 2013, 104, 1685–1697. [Google Scholar] [CrossRef] [Green Version]
  26. Galli, G.L.; Taylor, E.W.; Shiels, H.A. Calcium flux in turtle ventricular myocytes. Am. J. Physiol. Regul. Integr. Comp. Physiol. 2006, 291, R1781–R1789. [Google Scholar] [CrossRef] [Green Version]
  27. Ito, M.; Ujihara, Y.; Sugita, S.; Nakamura, M. Comparison of the histology and stiffness of ventricles in Anura of different habitats. J. Biol. Phys. 2021, 47, 287–300. [Google Scholar] [CrossRef]
  28. Ito, M.; Sugita, S.; Nakamura, M.; Ujihara, Y. Differences in Pressure Resistance and Tissue Structure of Ventricles between Aquatic, Semiaquatic, and Terrestrial Anura. Trans. Jpn. Soc. Med. Biol. Eng. 2021, 59, 162–168. [Google Scholar]
  29. Akester, A.R. Intercalated discs, nexuses, sarcoplasmic reticulum and transitional cells in the heart of the adult domestic fowl (Gallus gallus domesticus). J. Anat. 1981, 133 Pt 2, 161–179. [Google Scholar]
  30. Kim, C.S.; Davidoff, A.J.; Maki, T.M.; Doye, A.A.; Gwathmey, J.K. Intracellular calcium and the relationship to contractility in an avian model of heart failure. J. Comp. Physiol. B 2000, 170, 295–306. [Google Scholar] [CrossRef] [Green Version]
  31. Baylor, S.M.; Hollingworth, S. Calcium indicators and calcium signalling in skeletal muscle fibres during excitation-contraction coupling. Prog. Biophys. Mol. Biol. 2011, 105, 162–179. [Google Scholar] [CrossRef] [PubMed] [Green Version]
  32. Baylor, S.M.; Hollingworth, S. Fura-2 calcium transients in frog skeletal muscle fibres. J. Physiol. 1988, 403, 151–192. [Google Scholar] [CrossRef] [PubMed]
Figure 1. Analysis of contraction–relaxation behavior. Time to peak T p c is the time from the onset of the contraction to Cn = 95% in the contraction phase, t95d is the time from the onset of the contraction to Cn = 95% in the relaxation phase, and T t c   is the time from the onset of the contraction to Cn = 5% in the relaxation phase. The time constant T d c was determined by fitting an exponential curve to the normalized contraction–time relationship in the range of Cn = 95% and 0% in the relaxation phase.
Processes 10 00508 g001
Figure 2. Procedure for making a kymograph of the Fura-2 intensity ratio along the short axis of a cell. (a) A time series of Fura-2 fluorescence intensity ratio images. The region of interest was defined for the cell such that it covered the cell body, except for the edges of the cell. (b) A strip map of the intensity ratio averaged over the cell’s long axis along the short axis. The strip maps were obtained for all the images of the series. (c) A kymograph obtained by plotting the strip maps along the horizontal axis in chronological order.
Processes 10 00508 g002
Figure 3. (a) Representative images of cardiomyocytes isolated from a rat and quail. (b) Cell width. (c) Cell length. n = number of cells, N = number of animals. * p < 0.05 based on the unpaired t-test.
Processes 10 00508 g003
Figure 4. (a) Representative traces of normalized contraction of cardiomyocytes isolated from a quail and rat after electrical stimulation. (b) The time taken to reach 95% of the maximum contraction. (c) Relaxation time constant. (d) The total time from the beginning of contraction to the end of relaxation. n = number of cells, N = number of animals. * p < 0.05 based on unpaired t-test.
Processes 10 00508 g004
Figure 5. (a) Representative traces of the normalized Fura-2 fluorescence intensity ratio of whole cardiomyocytes isolated from a quail and rat after electrical stimulation. (b) Time to 95% of peak amplitude. (c) Decay time constant. (d) Total time from the beginning of the Ca2+ increase to the return to the base Ca2+ concentration. n = number of cells, N = number of animals. * p < 0.05 based on unpaired t-test.
Processes 10 00508 g005
Figure 6. (a) Typical kymographs of Fura-2 fluorescence intensity ratio changes. The vertical axis shows the position of the cell along the short axis, and the horizontal axis shows the time. CM, CCq, and CCr denote regions near the cell membrane, in the center of the quail cardiomyocytes, and in the center of rat cardiomyocytes. (b) The relationships of T CM d r   to T CCq d r and T CCr d r in rat cardiomyocytes. (c) The relationships between T CM d r   and T CCq d r in quail cardiomyocytes. Dashed lines are T CM d r = T CCq d r (= T CCr d r ) . (d) The ratio of the time constant T CCq d r / T CM d r and T CCr d r / T CM d r . n = number of cells, N = number of animals. * p < 0.05 based on Tukey–Kramer tests.
Processes 10 00508 g006
Figure 7. (a) Representative traces of the normalized Fura-2 fluorescence intensity ratio of whole cardiomyocytes isolated from a quail and rat after electrical stimulation. The time of the onset of decrease is shown as 0 ms to show differences in relaxation times. (b) Decay time constant in the presence of TG. (c) The ratio of the time constant T d r TG / T d r . n = number of cells, N = number of animals. * p < 0.05 based on unpaired t-test. NS, not significant (p > 0.05).
Processes 10 00508 g007
Publisher’s Note: MDPI stays neutral with regard to jurisdictional claims in published maps and institutional affiliations.

