Article

Analysis of Fe(II)-Ni(II) Electrochemical Reduction Process and Electrodeposition of FeNi Films

1
Department of Applied Chemistry, School of Chemical Engineering and Technology, Tianjin University, Tianjin 300072, China
2
Key Laboratory of Metal Fuel Cell of Sichuan Province, Deyang 618000, China
*
Author to whom correspondence should be addressed.
Processes 2022, 10(2), 198; https://doi.org/10.3390/pr10020198
Submission received: 22 December 2021 / Revised: 5 January 2022 / Accepted: 8 January 2022 / Published: 20 January 2022

Abstract

:
The effects of boric acid and ammonium sulfate on the electrochemical reduction process of Fe(II) Ni(II) were studied. A series of FeNi thin films were prepared by electrodeposition with different current density and Fe(II) concentration in solution. Linear sweep voltammetry (LSV) results show that the reduction current of Fe(II) is higher than that of Ni(II) at the same concentration of Fe(II) and Ni(II) as well as the same electrodeposition parameters. Adding H3BO3 to Fe(II) Ni(II) solution is beneficial to obtain brighter and compact coating, and adding (NH4)2SO4 is beneficial to obtain higher reduction current density. Energy dispersive X-Ray spectroscopy (EDS) results show that the current density has a significant and nonlinear effect on the Fe content in FeNi thin films. The highest Fe content is obtained at a current density of 25 A∙cm−2. SEM results show that the surface morphology of FeNi films is controlled by the content of Ni and Fe in the films. With increasing Fe content in the film, the morphology of the film changes from smooth and compact to spherical bulge and eventually to smooth again. X-ray diffraction (XRD) results show that the structure of FeNi films is controlled by the content of Ni and Fe in the film. With increasing of Fe content in the film, the structure of the film changes from FCC (111) phase dominant to BCC (110) phase dominant. The average grain size of FeNi films does not change with solution composition and current density. The results of magnetic properties show that the saturation magnetization Ms is proportional to the Fe content in the films, and the maximum value of Ms appears at the highest Fe content. The coercivity Hc is almost independent of Fe content in the films and does not change with solution composition and current density.

1. Introduction

FeNi alloy is a kind of soft magnetic material with low coercivity and high permeability, which has been applied to electromagnetic shielding of static magnetic field and low frequency magnetic fields [1,2,3]. Soft magnetic materials are widely used in the manufacture of stators and rotors of generators and motors, iron cores of transformers and inductors, magnetic recording heads, magnetic shields, etc. Their application areas include power supplies, switching power supplies, instrumentation, automotive electronics and solar energy, and they play a key role in energy conversion around the world [4,5,6]. Nicke liron alloys also have a wide range of applications in the field of electrocatalysis. Solmazy studied NiFe alloys with different compositions for hydrogen evolution reactions. The NiFe alloy with a molar concentration ratio of Ni2+: Fe2+ of 4:6 was found to be the best suitable cathode material for the HER in an alkaline medium [7]. Ullal and co-worker studied the hydrogen evolution reaction and oxygen evolution reaction of NiFe alloys prepared under different current densities in alkaline solutions. They found that Ni–Fe coating deposited at 6.0 Ad∙m−2 was found to be the most corrosion resistant [8,9].
In particular, the magnetic properties of NiFe alloy can be adjusted by changing the composition and heat treatment process [10,11].
In this paper, the effects of boric acid and ammonium sulfate on the electrochemical reduction process of Fe(II) Ni(II) were studied. By changing the deposition current density and the concentration ratio of Fe(II)/Ni(II) in solution, a series of FeNi thin films with different Fe content were prepared using the electrochemical method. The magnetic properties of different NiFe alloy films are also discussed.

2. Materials and Methods

2.1. Solutions

All the reagents involved in the experiment were analytical pure. All the solutions were prepared with secondary distilled water, and the pH was adjusted to 3 by H2SO4 or NaOH. The composition of the electrodeposited FeNi solutions is shown in Table 1.

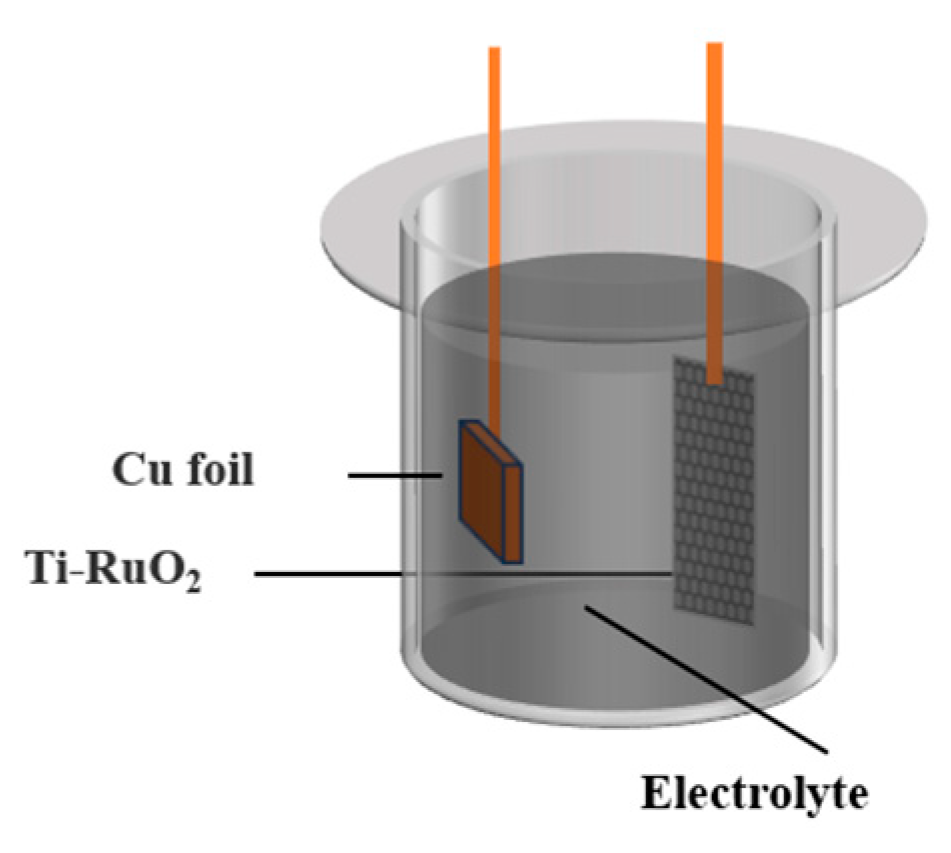
2.2. Electrochemical Measurements

All electrochemical tests were carried out by using CHI660E electrochemical workstation (manufactured by Shanghai Chenhua Instruments Co., Ltd., Shanghai, China). The standard three-electrode system was used. A platinum sheet (1 × 1 cm2) was used as working electrode, a platinum titanium mesh as auxiliary electrode, and saturated calomel electrode (SCE) as reference electrode. The working electrode was treated by mechanical polishing, electrochemical degreasing and acid erosion before use. Linear sweep voltammetry (LSV) was used for electrochemical measurement at 25 ± 1 ℃. The sweep rate was 100 mV/s, and no stirring during the test.

2.3. Electrochemical Deposition

XJ17232L traceable dual-channel DC regulated power supply (manufactured by Shanghai Xinjian) was used for electrodeposition (see Figure 1). Copper (2 × 1 cm2) was used as cathode and platinum titanium mesh as anode. The copper was treated by mechanical polishing, electrochemical degreasing and acid erosion before use. Electrodeposition of FeNi thin films was carried out at 30 ± 1 °C, the current densities were 15 mA∙cm−2, 20 mA∙cm−2, 25 mA∙cm−2, 35 mA∙cm−2 and 50 mA∙cm−2, respectively. The electrodeposition capacity was 30 C∙cm−2 and the electromagnetic stirring was used in the electrodeposition process.

2.4. SEM and EDS Analyses

The surface topography of the deposited film was obtained with a scanning electron microscope (SEM) (FEI Nova NanoSEM 430), and the element composition of the deposited film was obtained with an electron dispersive spectroscopy (EDS) that attached to the SEM.

2.5. XRD Analyses

The X-ray diffraction (XRD) pattern of the deposited film was obtained with an X-ray diffractometer (BRUKER D8 FOCUS) using Cu Kα radiation (scan rate 4°/min).

2.6. Magnetic Properties Analyses

The hystersis loop of the deposited film was obtained with a magnetic property measurement system (MPMS) (SQUID-VSM).

3. Results

3.1. Analysis of Electrochemical Fe(II) and Ni(II) Co-Deposition Process

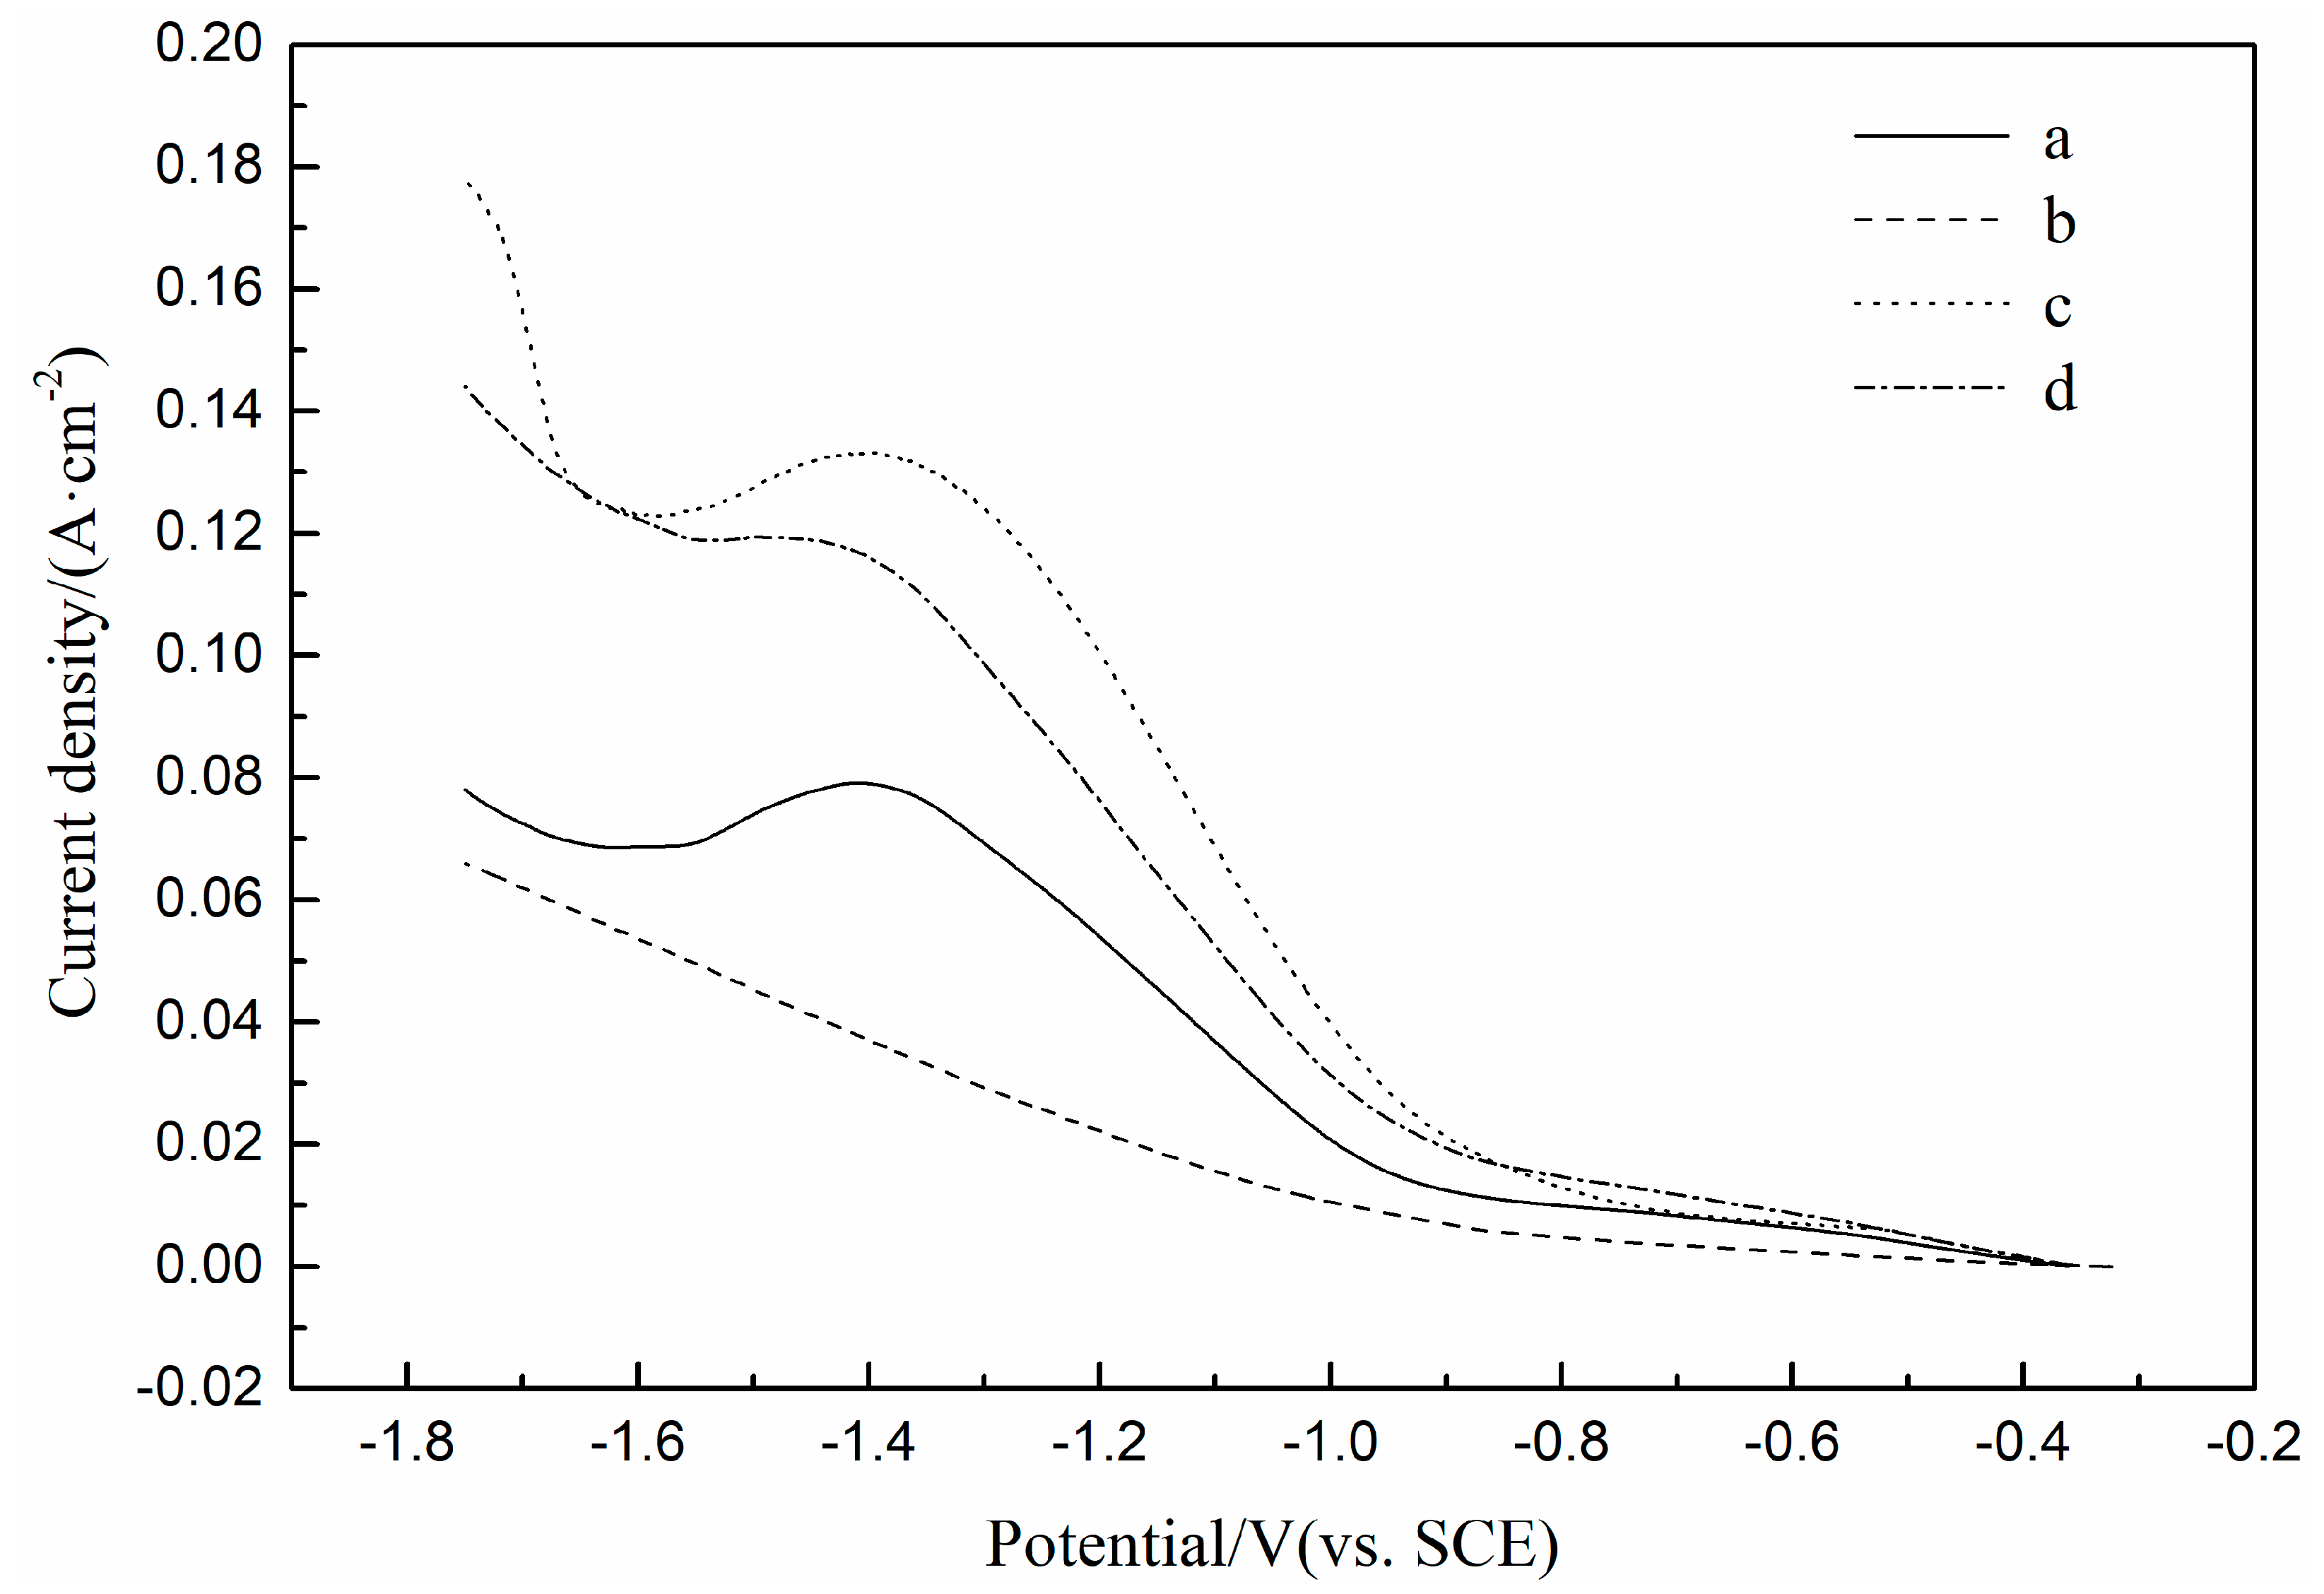
3.1.1. Electrochemical Co-Deposition of Fe(II) and Ni(II)

The LSV curves of the Pt electrode in Fe(II) unitary solution, Ni(II) unitary solution and Fe(II)-Ni(II) binary solution are shown in Figure 2. It can be seen from the figure that the LSV curve measured in the Fe(II) unitary solution has an obvious reduction peak during the cathodic scanning process. Initial potential of the reduction peak is about −0.8 V, and peak potential about −1.4 V, which correspond to the two-electron reduction reaction of adsorption intermediate Fe(OH)+ [12,13]. The LSV curve measured in the Ni(II) unitary solution shows no obvious reduction peak during cathodic scanning. It is shown that the electrochemical polarization dominates the reaction at a sweep rate of 100 mV/s, and corresponds to the two-electron reduction reaction of adsorption intermediate Ni(OH)+ [13,14]. According to the LSV curves measured in Fe(II) and Ni(II) unitary solutions, Fe(II) and Ni(II) have the same reduction potential, indicating that Fe(II) and Ni(II) have the conditions of electrochemical co-deposition, and the curves show that the reduction current of Fe(II) is higher than that of Ni(II) in the whole reduction potential range under the same electrochemical reaction parameters and the same concentration of Fe(II) and Ni(II) unitary solution. It shows that in the design of the composition of Fe(II) and Ni(II) co-deposition solution, if the FeNi alloy coating with the same atomic ratio is expected, the concentration of Fe(II) in the co-deposition solution is less than that of Ni(II). The LSV curve measured in the Fe(II) Ni(II) binary solution shows two obvious reduction peaks during cathodic scanning. The first reduction peak has an initial potential of −0.8 V and a peak potential of −1.4 V, which indicates that the reduction is dominated by the reduction of Fe(II). The second reduction peak has an initial potential of −1.6 V, corresponding to the hydrogen evolution reaction of water. The LSV curves measured in Fe(II) and Ni(II) unitary solutions were added arithmetically. Then the results were compared with the LSV curve measured in the Fe(II) Ni(II) binary solution. It was found that within the reduction potential range of −0.8 V to −1.6 V, the actual measured reduction current of the Fe(II) and Ni(II) binary solution was higher than the reduction current of the arithmetic addition of the Fe(II) and Ni(II) unitary solution, indicating that Fe(II) and Ni(II) do cause electrochemical co-deposition, and that Fe(II) and Ni(II) can promote each other’s electrochemical reduction reaction or unidirectional electrochemical reduction reaction.

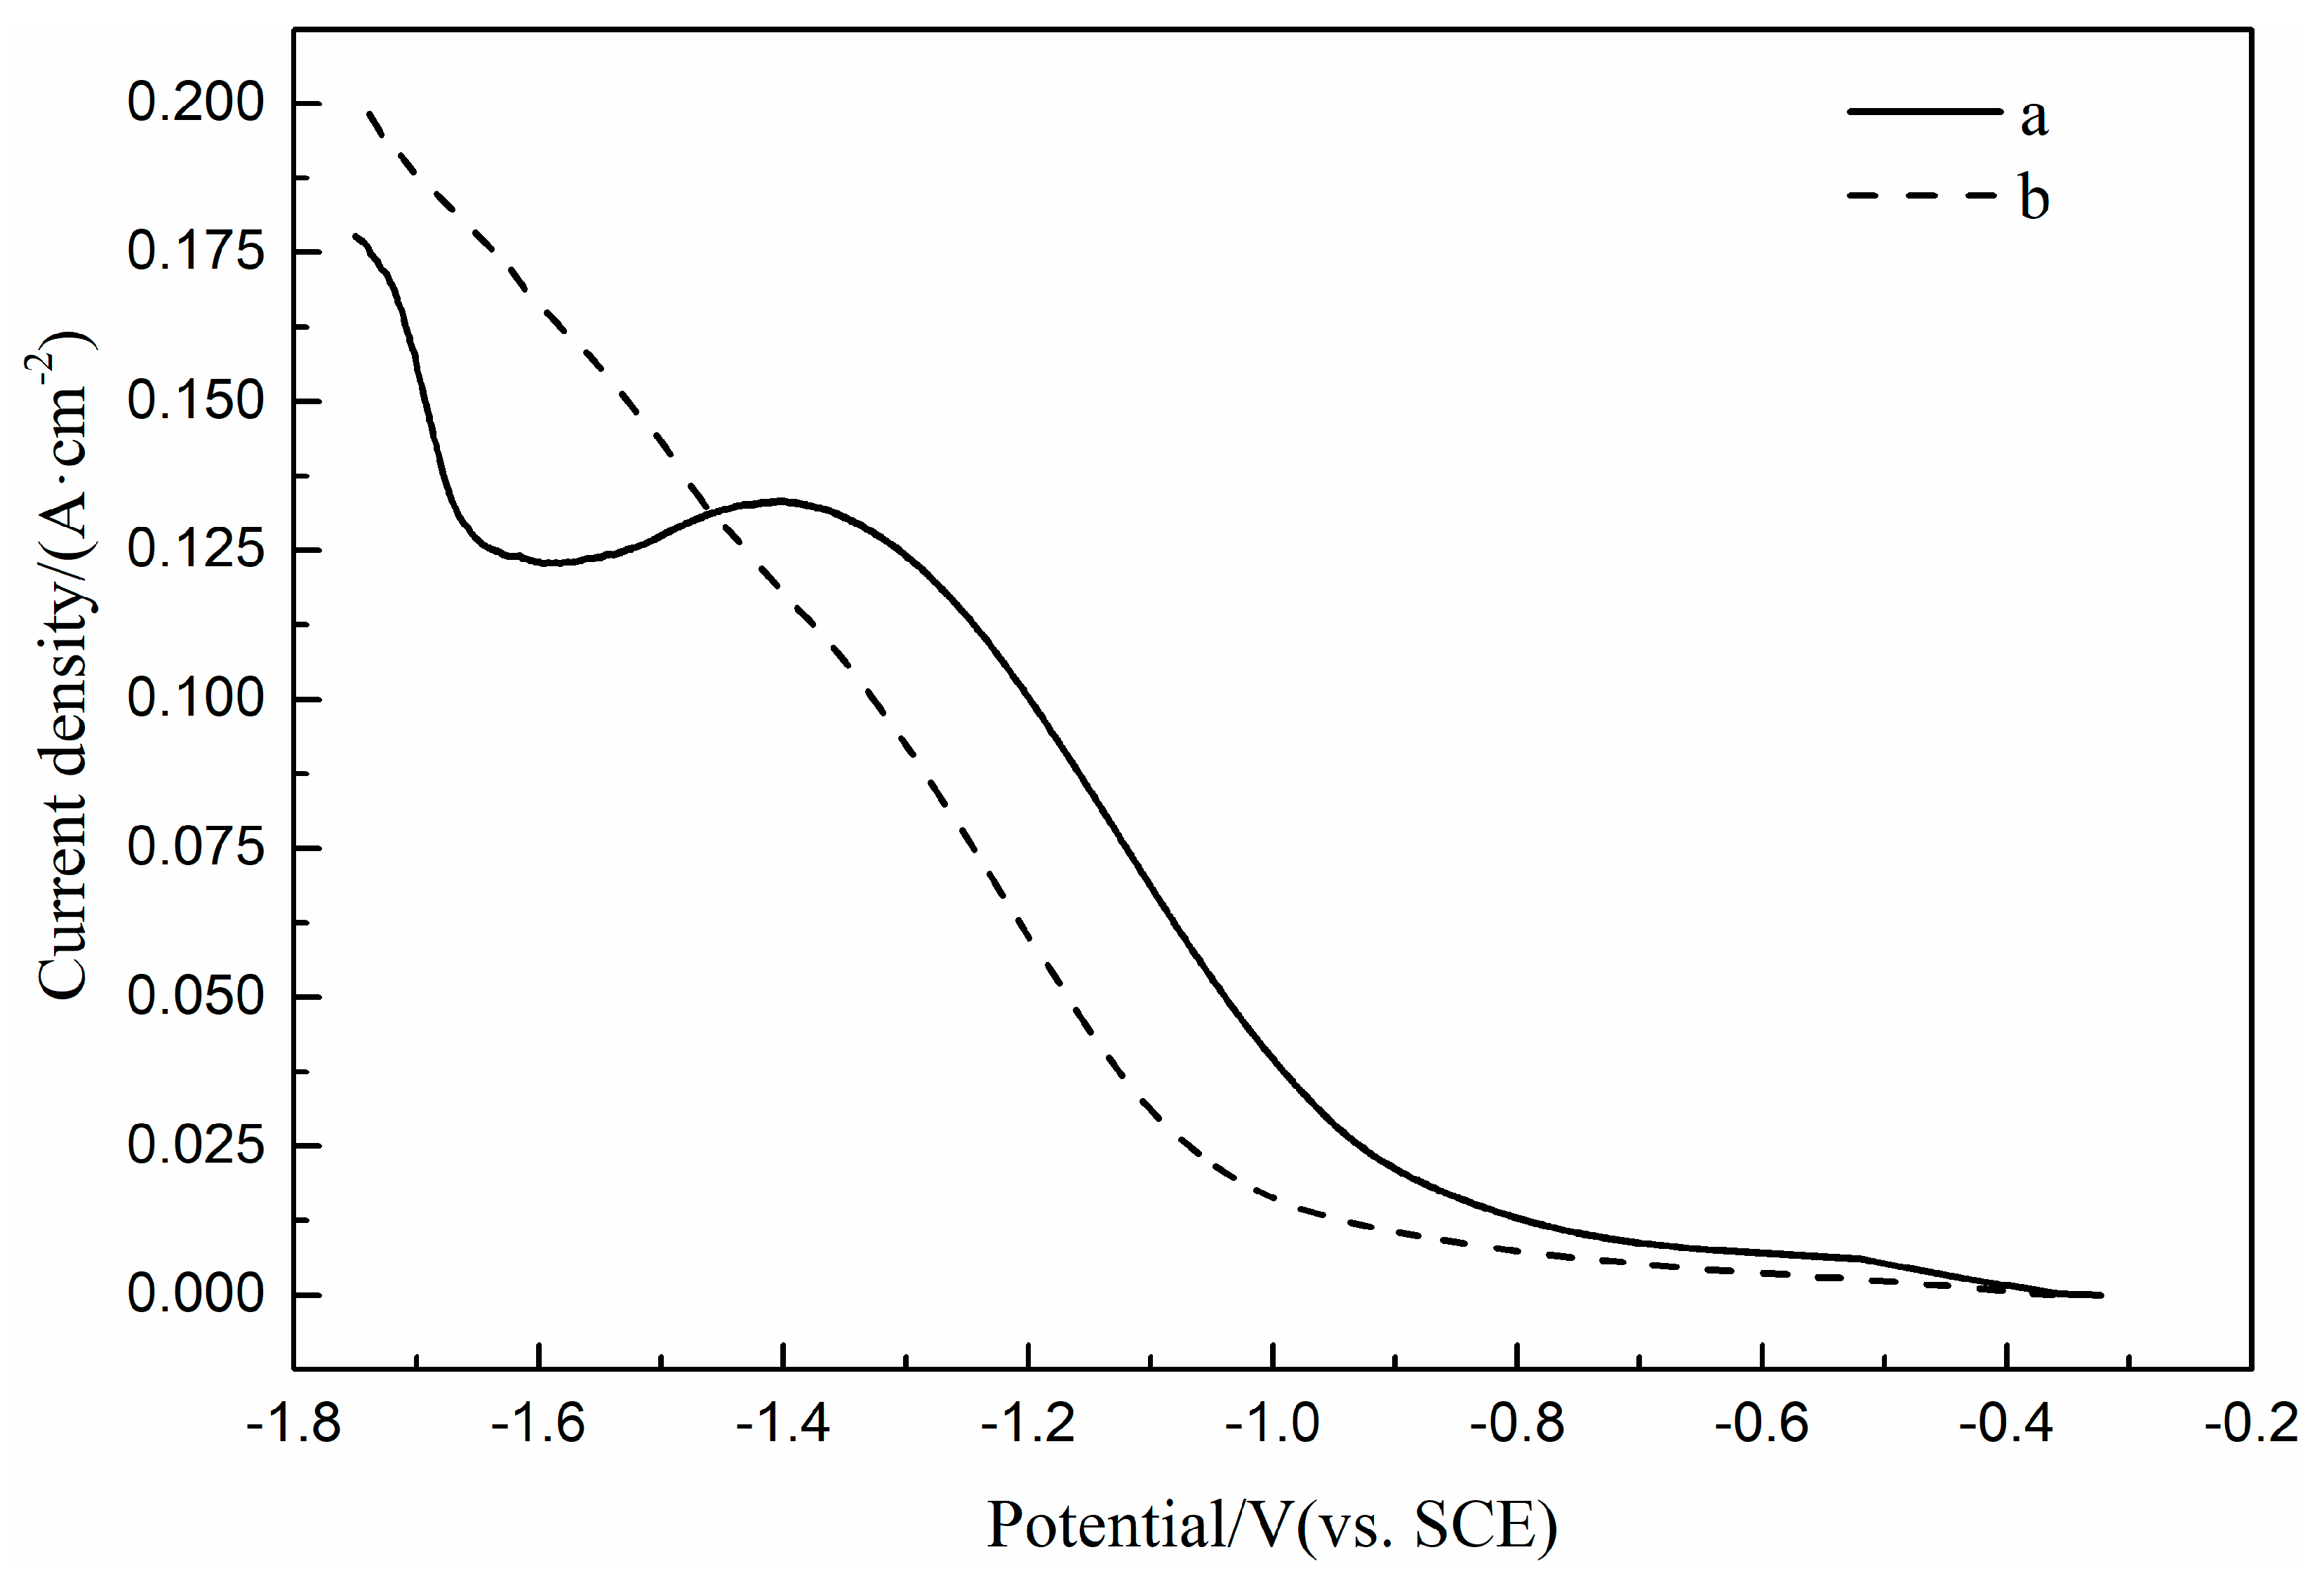
3.1.2. Effect of H3BO3 on the Electrochemical Co-Deposition Process of Fe(II) and Ni(II)

The LSV curves of Pt electrode in Fe(II) Ni(II) solutions with and without H3BO3 are shown in Figure 3. It can be seen from the figure that the LSV curve measured in the solution of Fe(II) Ni(II) with H3BO3 added does not show obvious reduction peaks during the cathodic scanning, which indicates that the electrochemical polarization dominates the reaction at a sweep rate of 100 mV/s, and which leads to the addition of H3BO3 to obtain a bright and compact coating. The reduction potential of current sharply increases in of Fe(II) Ni(II) binary solution added with H3BO3 is −1.0 V, which has a 0.2 V negative shift than that of Fe(II) Ni(II) binary solution without H3BO3. This indicates that the reduction overpotential of Fe(II) Ni(II) binary solution increased by adding H3BO3, which may be due to the formation of complexes Fe[B(OH)4]+ and Ni[B(OH)4]+ with H3BO3, respectively [14]. The reduction current curve of Fe(II) Ni(II) binary solution with H3BO3 added in the range of −1.4 V~−1.1 V potential is almost parallel to that of Fe(II)-Ni(II) binary solution without H3BO3 added in the range of −1.3 V~−1.0 V potential, it shows that adding H3BO3 does not change the mass transfer process of the reduction reaction of Fe(II)-Ni(II) binary solution.

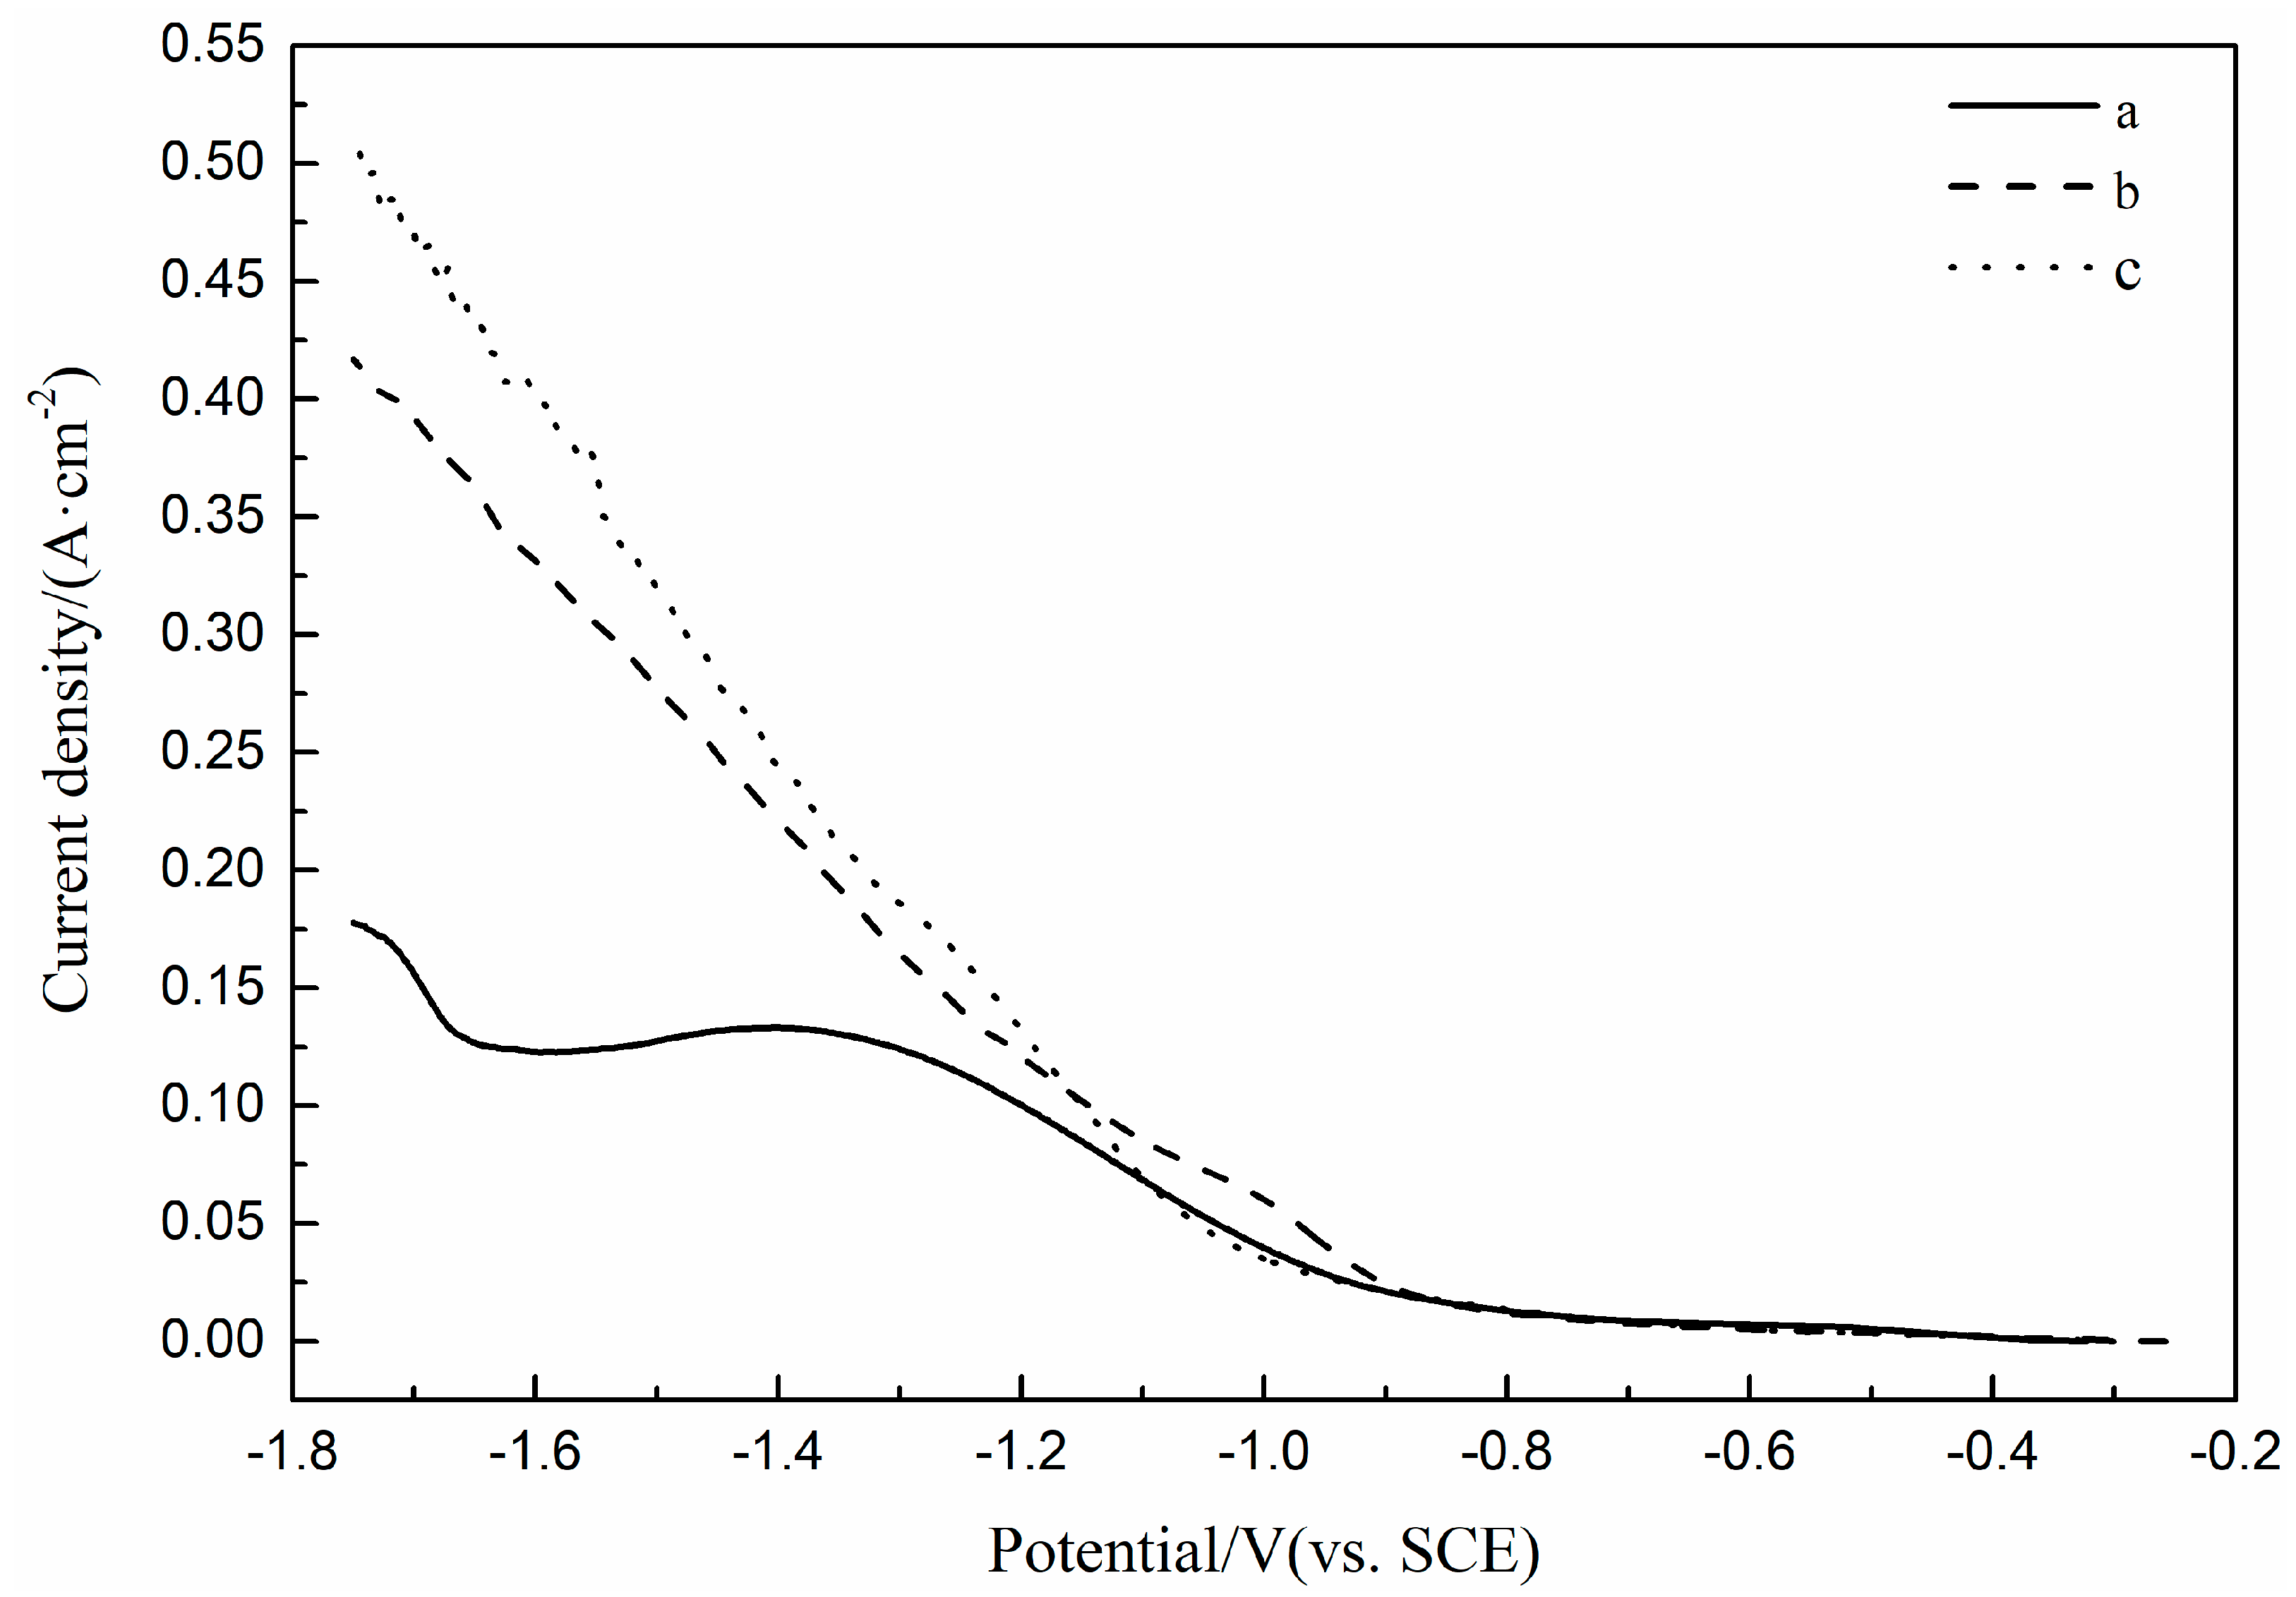
3.1.3. Effect of (NH4)2SO4 on the Electrochemical Co-Deposition Process of Fe(II) and Ni(II)

The LSV curves of the Pt electrode in Fe(II) Ni(II) binary solutions with and without (NH4)2SO4 and in Fe(II) Ni(II) solution with H3BO3 and (NH4)2SO4 are shown in Figure 4. It can be seen from the figure that the LSV curve measured in the Fe(II) Ni(II) binary solution containing (NH4)2SO4 only shows a small reduction peak during the cathodic scanning, which indicates that the electrochemical polarization dominates the reaction at a sweep rate of 100 mV/s, and thus leads to the addition of (NH4)2SO4 to obtain a bright and compact coating. The reduction current of Fe(II) Ni(II) binary solution with (NH4)2SO4 is higher than that of Fe(II) Ni(II) binary solution without (NH4)2SO4 from −0.9 V. It is concluded that the addition of (NH4)2SO4 accelerates the mass transfer process of Fe(II) Ni(II) binary solution. This may be due to the formation of a series of more positive charged complexes with NH4+ by Fe2+ and Ni2+ respectively, and these complexes diffuse faster than Fe2+ and Ni2+ alone under the action of the electric field. The LSV curve of the Fe(II) Ni(II) solution with H3BO3 and (NH4)2SO4 added shows no obvious reduction peaks during cathodic scanning, indicating that the electrochemical polarization dominates the reaction at a sweep rate of 100 mV/s. At the same time, the reduction current of Fe(II) Ni(II) solution with H3BO3 and (NH4)2SO4 is higher than that of Fe(II) Ni(II) solution without H3BO3 and (NH4)2SO4 from −1.1 V, indicating that the mass transfer process of Fe(II) Ni(II) solution is accelerated by adding (NH4)2SO4. The addition of H3BO3 and (NH4)2SO4 not only facilitates the formation of bright and compact coatings, but also leads to higher reduction current density.

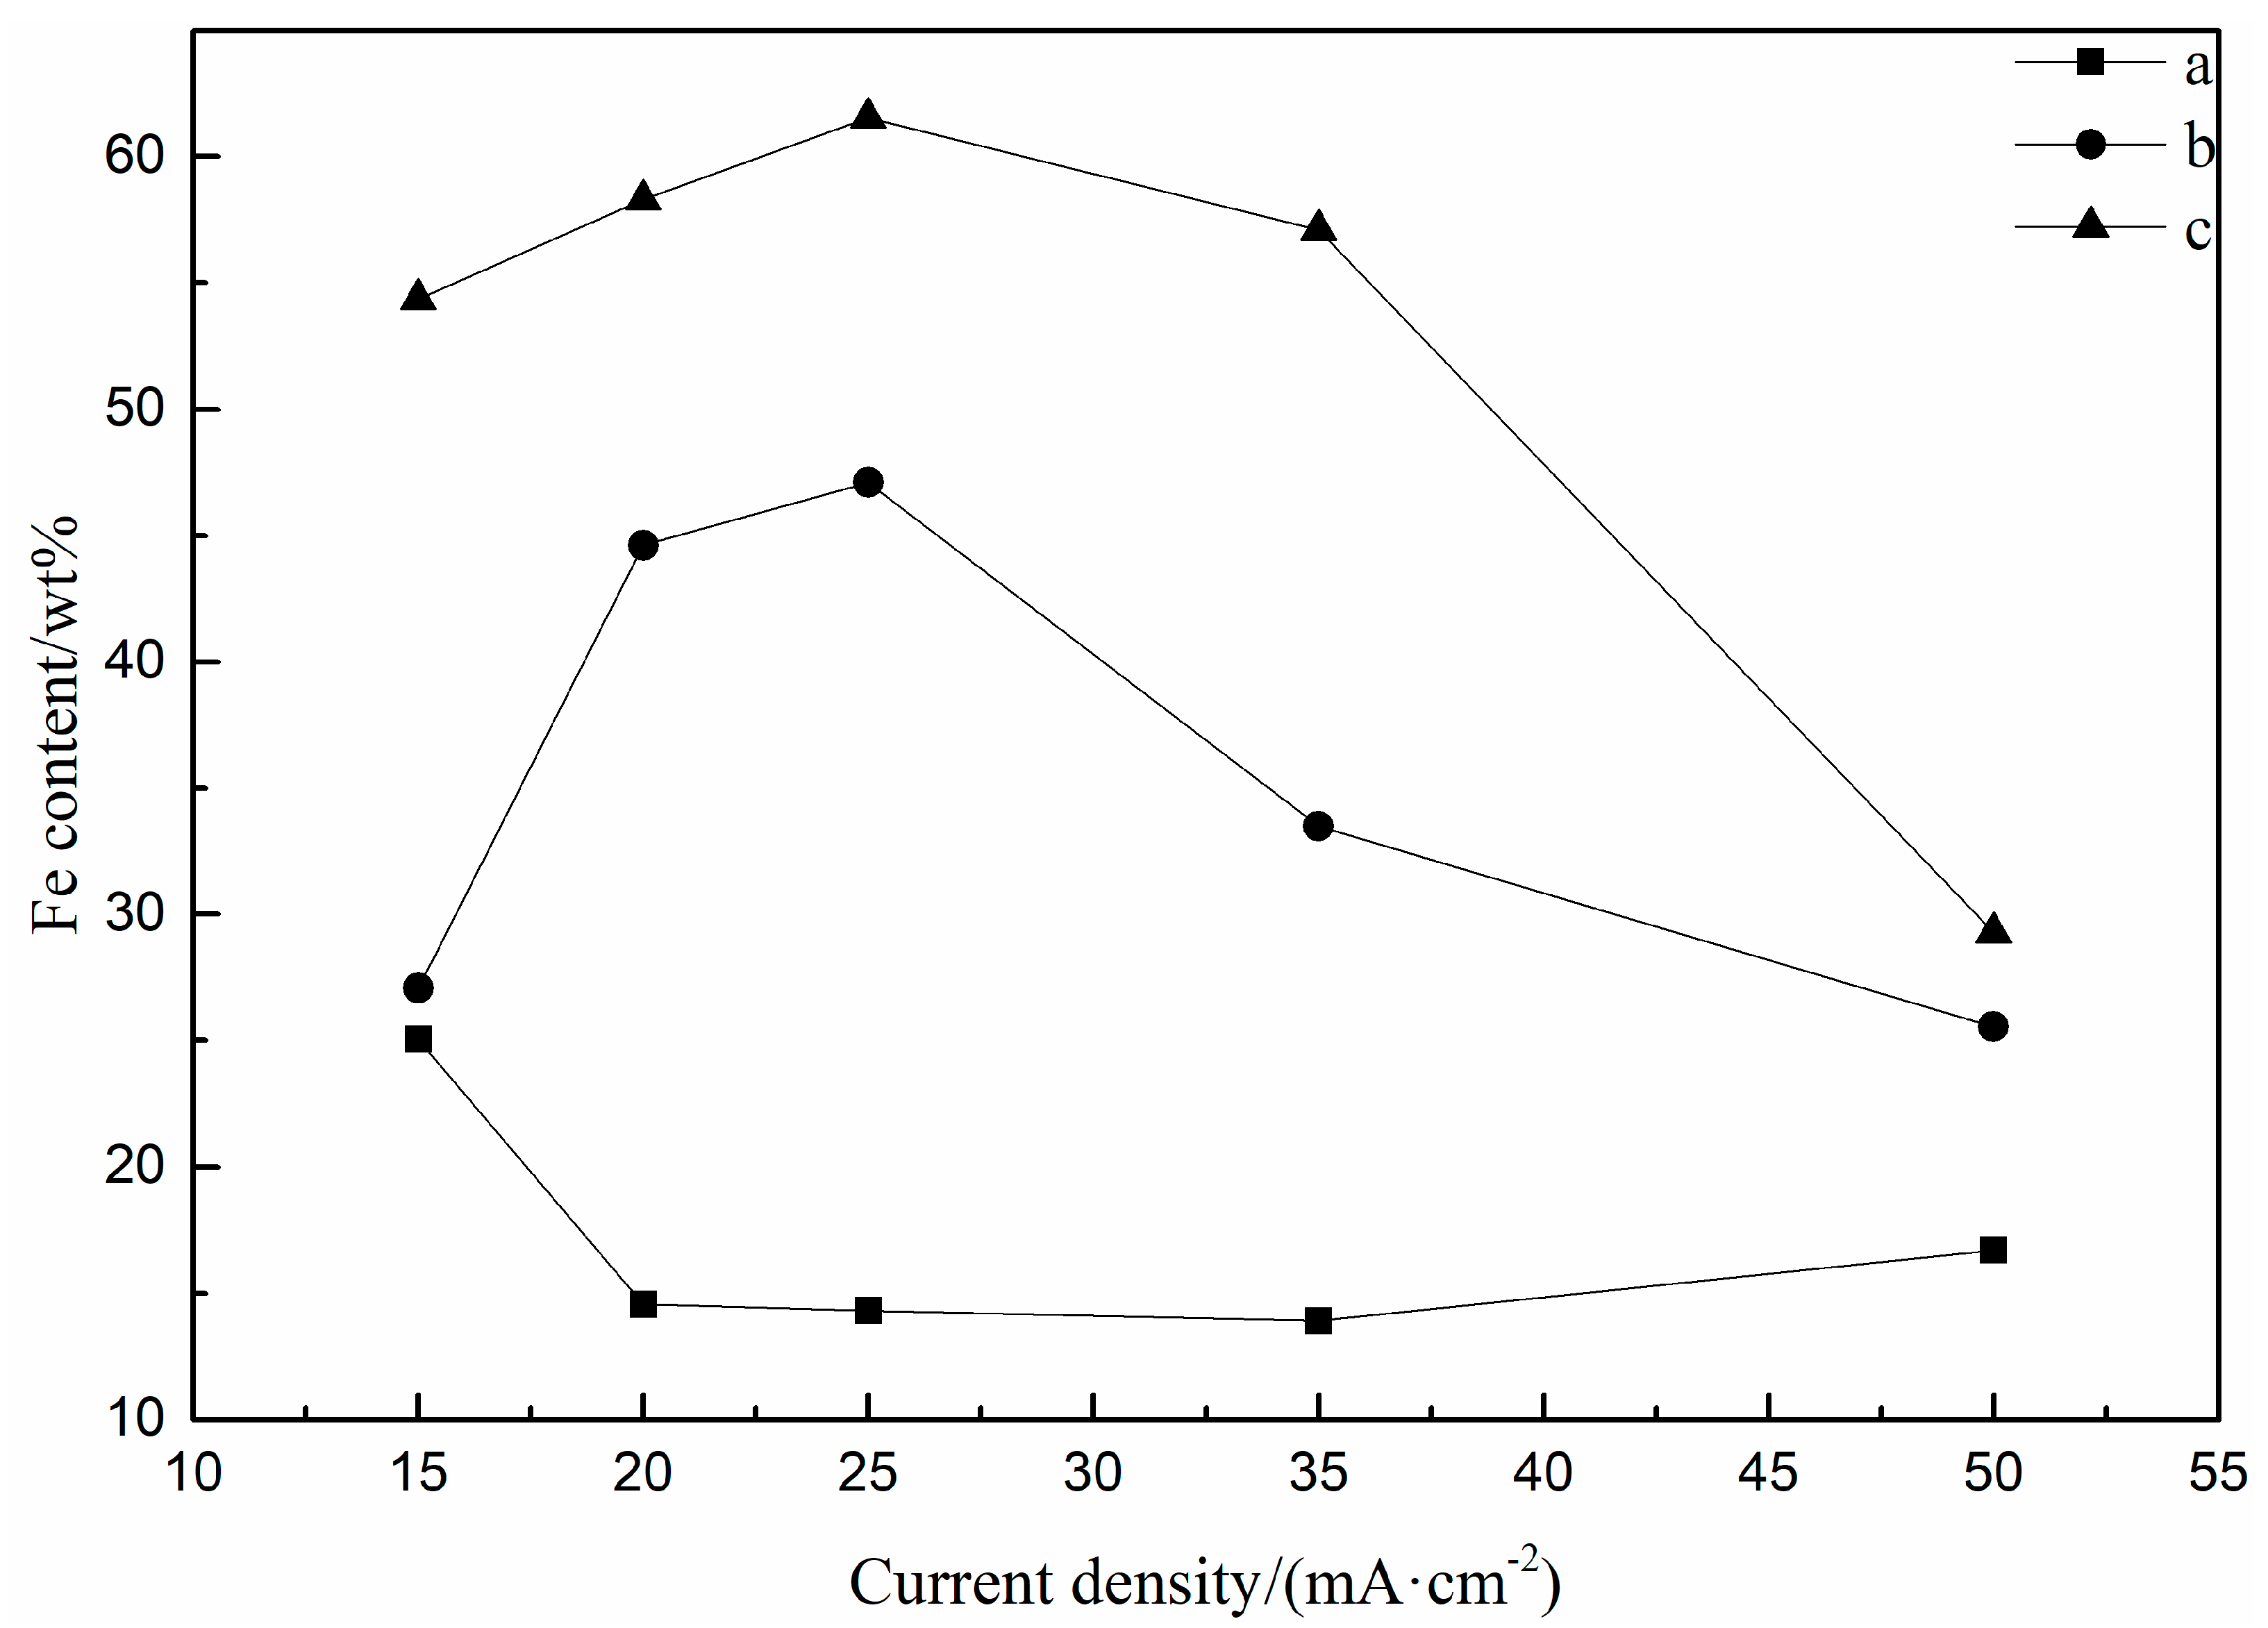
3.2. Component Analysis of Electrodeposited Thin Films

FeNi thin films were prepared by solutions in Section 2.1 and electrochemical deposition conditions in Section 2.3. The composition of the films was characterized by EDS. The results show that the films contained three elements: Fe, Ni and S. The content of S is less than or equal to 2.82 wt% in all thin films.
The relationship between Fe content and current density in FeNi films is plotted in Figure 5. It can be seen from the figure that when Fe(II) concentration is 0.03 M and 0.05 M, the Fe content in thin films increases first and then decreases with the increase of the current density. The highest value of Fe content in the FeNi films is 61.53 wt% at a current density of 25 mA∙cm−2. When the concentration of Fe(II) is 0.015 M, the Fe content in the films ranges from 14.57 wt% to 25.04 wt%, and the change trend of the content is not significant.
The relationship between the atomic ratio of Fe/Ni in the electrodeposited films and the concentration ratio of Fe(II)/Ni(II) in the deposited solution is plotted in Figure 6. It can be seen from the figure that the atomic ratio of Fe/Ni in films increases with the increase in the concentration ratio of Fe(II)/Ni(II) in deposited solutions at the same deposition current density, which shows that the composition of solution has a significant influence on the content of Fe and Ni in films. The slope of Fe/Ni atom ratio in films changing with Fe(II)/Ni(II) concentration ratio in solutions is different under different deposition current densities. The order of slope is as follows: (c) 25 mA∙cm−2> (b) 20 mA∙cm−2> (d) 35 mA∙cm−2> (a) 15 mA∙cm−2> (e) 50 mA∙cm−2. It shows that the current density also has significant influence on the composition of Fe and Ni in the films. Under all electrodeposition conditions, the atomic ratio of Fe/Ni in the films is significantly higher than that of Fe(II)/Ni(II) in the deposition solutions.

3.3. Morphology Analysis of Electrodeposited Thin Films

The FeNi electrodeposited films were characterized by SEM, and the images are shown in Figure 7. It can be seen from the figures that the surface of the deposited films are smooth and compact when the concentration of Fe(II) in deposited solutions is 0.015 M; the surface of the deposited films are uneven and densely spherical when the concentration of Fe(II) in deposited solutions is 0.03 M; and the surface of the deposited films are slightly flat when the concentration of Fe(II) in deposited solutions is 0.05 M. The images show that the effect of current density on the surface morphology of the films is irregular in the same deposition solution. Based on the results of Section 3.2, it was found that the surface morphology of the films is related to the composition of the film. The order of Fe content in different electrodeposited films is: b < c < a < f < d < I < g < h, corresponding to the change of surface morphology: flat and compact-sporadic small spherical protrusions-small spherical protrusions-uniform spherical protrusions-rough concave protrusions-uniform spherical protrusions-slightly flat and spherical protrusions-slightly flat and sand grains and spherical protrusions-sporadic small spherical protrusions. The results show that the morphology of FeNi films changes from Ni morphology control to FeNi morphology control and then to Fe morphology control with the changes of Fe content.

3.4. Structure Analysis of Electrodeposited Thin Films

The FeNi electrodeposited films were characterized by XRD, and the results are shown in Figure 8. It can be seen from the figure that when the concentration of Fe(II) in deposited solutions is 0.015 M, the structure of deposited films is mainly FCC(111) phase and FCC(200) phase, in which FCC(111) phase dominates; when the concentration of Fe(II) in deposited solutions is 0.03 M, the structure of deposited films is mainly FCC(111) phase and FCC(200) phase, and the BCC(110) phase begins to appear. When the concentration of Fe(II) in deposited solutions is 0.05 M, the structure of deposited films is mainly FCC(111) phase and BCC(110) phase, when the current density is 15 mA∙cm−2, 20 mA∙cm−2 and 25 mA∙cm−2, the FCC (200) phase disappears, and when the current density is 25 mA∙cm−2, the BCC (110) phase dominates. It is analyzed that the FCC (111) and FCC (200) phase are from Ni and BCC (110) phase is from Fe. According to the results of Section 3.2, the order of Fe content in different films is d < c < b < a < j < f < o < I < g < h < k < n < l < m. The corresponding change of the films structure is that FCC(111) phase and FCC(200) phase dominate in which the FCC(200) phase disappears, FCC(111) phase decreases and BCC(110) phase dominates. This indicates that in the process of the Fe content change, the structure of the films changes from Ni structure control to FeNi structure control and then to Fe structure control.
The XRD results of electrodeposited FeNi films were calculated and the average grain sizes were obtained, as shown in Table 2. It can be seen from the table that the average grain sizes of FeNi films prepared under different solution composition and current density range from 9.2 to 12.8 nm, and essentially do not change with the solution composition and current density.

4. Discussion

The magnetic properties of electrodeposited FeNi films were characterized in Figure 9. The coercivity Hc is almost independent of Fe content and current density, and the measured values range from 37 Oe~47 Oe. The relationship between saturation magnetization (Ms) and Fe content in FeNi films is plotted in Figure 8. It can be seen from the figure that the saturation magnetization Ms is essentially proportional to the Fe content in the films, which is consistent with the saturation magnetic moment of Fe (217.5 emu/g), which is much higher than that of Ni (54.4 emu/g). The maximum value of Ms appears at the highest Fe content, and is 1.748 T.

5. Conclusions

In this paper, the electrochemical reduction processes of Fe(II) and Ni(II) were studied, and the effects of boric acid and ammonium sulfate on the electrochemical reduction process of Fe(II)-Ni(II) were studied. The electrochemical reduction processes show that Fe(II) and Ni(II) have the same reduction potential, and that Fe(II) and Ni(II) can promote each other’s electrochemical reduction reaction or unidirectionally promote the electrochemical reduction reaction; the reduction current of Fe(II) is higher than that of Ni(II) at the same concentration of Fe(II) and Ni(II) as well as the same electrodeposition parameters. The addition of H3BO3 increases the reduction overpotential of Fe(II)-Ni(II) binary solution without changing the mass transfer process; addition of (NH4)2SO4 accelerates the mass transfer process of Fe(II) Ni(II) solution; addition of H3BO3 and (NH4)2SO4 not only facilitates the formation of bright and compact coatings, but also results in higher reduction current density.
FeNi thin films prepared by electrodeposition contain three elements, Fe, Ni and S, in which the S content is less than or equal to 2.82 wt%. The current density also has a significant effect on the Fe content in electrodeposited FeNi films. With the increase of current density at an Fe(II) concentration of 0.03 M and 0.05 M, the Fe content in the films increases firstly and then decreases. The maximum Fe content in FeNi films is 61.53 wt% at 25 mA∙cm−2 current density. The higher the concentration ratio of Fe(II)/Ni(II) in solution, the more the Fe content in FeNi films are electrodeposited, and the Fe/Ni atomic ratio in the films is significantly higher than the Fe(II)/Ni(II) concentration ratio in the deposition solution.
The morphology of electrodeposited FeNi films is controlled by the content of Ni and Fe in the film. With the increase in the Fe content in the films, the morphology of the films changes from smooth and compact to spherical bulge and eventually back to smooth.
The structure of electrodeposited FeNi films is controlled by the content of Ni and Fe in the film. With the increase in the Fe content in the films, the structure of the films changes from FCC (111) phase dominant to FCC (200) phase disappearance and BCC (110) phase dominant. The average grain sizes of electrodeposited FeNi films range from 9.2 to 12.8 nm, and essentially does not change with the solution composition and current density.
The coercivity Hc is almost independent of Fe content and current density, the measured values are 37 Oe~47 Oe. The saturation magnetization Ms is proportional to the Fe content in the films. The maximum value of Ms appears at the highest Fe content, which is 1.748 T.

Author Contributions

Conceptualization, Y.Q.; writing—original draft preparation, C.H. and R.Z.; W.W. writing—review and editing. All authors have read and agreed to the published version of the manuscript.

Funding

This research received no external funding.

Institutional Review Board Statement

Not applicable.

Data Availability Statement

The data that support the plots within this paper and other findings of this study are available from the corresponding author upon reasonable request.

Acknowledgments

The authors acknowledge the financial support of KEY LABORATORY OFMETAL FUEL CELL OF SICHUAN PROVINCE.

Conflicts of Interest

The authors declare no conflict of interest.

References

  1. Grimes, C.A. EMI Shielding Characteristics of Permalloy Multilayer Thin Films. In Proceedings of the 1994 IEEE Aerospace Applications Conference Proceedings, Vail, CO, USA, 5–12 February 1994; pp. 211–221. [Google Scholar]
  2. Bhattacharya, S. Transforming the transformer. IEEE Spectr. 2017, 54, 38–43. [Google Scholar] [CrossRef]
  3. Krishnamurthy, S. Simplified loss analysis for high speed SiC MOSFET inverter. In Proceedings of the 2012 Twenty-Seventh Annual IEEE Applied Power Electronics Conference and Exposition (APEC), Orlando, FL, USA, 5–9 February 2012. [Google Scholar]
  4. Kroposki, B. Benefits of Power Electronic Interfaces for Distributed Energy Systems. IEEE Trans. Energy Convers. 2010, 25, 901–908. [Google Scholar] [CrossRef] [Green Version]
  5. Bose, B.K. Global Warming: Energy, Environmental Pollution, and the Impact of Power Electronics. IEEE Ind. Electron. Mag. 2010, 4, 6–17. [Google Scholar] [CrossRef]
  6. Waide, P.; Brunner, C.U. Energy-Efficiency Policy Opportunities for Electric Motor-Driven Systems; International Energy Agency (IEA): Paris, France, 2011. [Google Scholar]
  7. Solmaz, R.; Karda, G. Electrochemical deposition and characterization of NiFe coatings as electrocatalytic materials for alkaline water electrolysis. Electrochim. Acta 2009, 54, 3726–3734. [Google Scholar] [CrossRef]
  8. Ullal, Y.; Hegde, A.C. Electrodeposition and electro-catalytic study of nanocrystalline Ni–Fe alloy. Int. J. Hydrogen Energy 2014, 39, 10485–10492. [Google Scholar] [CrossRef]
  9. Zhou, Q.; He, F. Insight into the Mechanism of the Fe-Ni Alloys Co-Deposition from Poly-Nuclear Complexes. J. Electrochem. Soc. 2018, 165, D681–D686. [Google Scholar]
  10. Ahn, S.H.; Choi, I.; Park, H.-Y.; Hwang, S.J.; Yoo, S.J.; Cho, E.; Kim, H.-J.; Henkensmeier, D.; Nam, S.W.; Kim, S.-K. Effect of morphology of electrodeposited Ni catalysts on the behavior of bubbles generated during the oxygen evolution reaction in alkaline water electrolysis. Chem. Commun. 2013, 49, 9323–9325. [Google Scholar] [CrossRef] [PubMed]
  11. Lu, X.; Zhao, C. Electrodeposition of hierarchically structured threedimensional nickeleiron electrodes for efficient oxygen evolution at high current densities. Nat. Commun. 2015, 6, 6616. [Google Scholar] [CrossRef] [PubMed] [Green Version]
  12. Bockris, J.O.; Drazic, D.; Despic, A.R. The electrode kinetics of the deposition and dissolution of iron. Electrochem. Acta 1961, 4, 325–361. [Google Scholar] [CrossRef]
  13. Hessami, S.; Tobias, C.W. In-situ measurement of interfacial pH using a rotating ring-disk electrode. AIChE J. 1993, 39, 149–162. [Google Scholar] [CrossRef]
  14. Gadad, S.; Harris, T.M. Oxygen Incorporation during the Electrodeposition of Ni, Fe, and Ni-Fe Alloys. J. Electrochem. Soc. 1998, 145, 3699–3703. [Google Scholar] [CrossRef]
Figure 1. Schematic diagram of electrodeposition device.
Processes 10 00198 g001
Figure 2. LSV curves of Pt electrode in H2SO4 solution (pH = 3): (a) 0.1 M FeSO4, (b) 0.1 M NiSO4, (c) 0.1 M FeSO4 and 0.1 M NiSO4, (d) arithmetic summation of curves a and b.
Processes 10 00198 g002
Figure 3. LSV curves of Pt electrode in H2SO4 solution (pH = 3): (a) 0.1 M FeSO4 and 0.1 M NiSO4, (b) 0.1 M FeSO4, 0.1 M NiSO4 and 0.4 M H3BO3.
Processes 10 00198 g003
Figure 4. LSV curves of Pt electrode in H2SO4 solution (pH = 3): (a) 0.1 M FeSO4 and 0.1 M NiSO4, (b) 0.1 M FeSO4, 0.1 M NiSO4 and 0.15 M (NH4)2SO4, (c) 0.1 M FeSO4, 0.1 M NiSO4, 0.4 M H3BO3 and 0.15 M (NH4)2SO4.
Processes 10 00198 g004
Figure 5. The relationship between Fe content in FeNi electrodeposited films and current density: (a) 0.015 M FeSO4, (b) 0.03 M FeSO4, (c) 0.05 M FeSO4.
Processes 10 00198 g005
Figure 6. The relationship between the atomic ratio of Fe/Ni in the electrodeposited films and the concentration ratio of Fe(II)/Ni(II) in the deposited solution: (a) 15 mA∙cm−2, (b) 20 mA∙cm−2, (c) 25 mA∙cm−2, (d) 35 mA∙cm−2, (e) 50 mA∙cm−2.
Processes 10 00198 g006
Figure 7. SEM images of FeNi electrodeposited films: (ac) 0.015 M FeSO4, (df) 0.03 M FeSO4, (gi) 0.05 M FeSO4. At each FeSO4 concentration, the deposition current densities are 15 mA∙cm−2, 25 mA∙cm−2 and 50 mA∙cm−2, respectively.
Processes 10 00198 g007
Figure 8. XRD spectra of FeNi electrodeposited thin films: (a–e) 0.015 M FeSO4, (f–j) 0.03 M FeSO4, (k–o) 0.05 M FeSO4. At each FeSO4 concentration, the deposition current densities are 15 mA∙cm−2, 20 mA∙cm−2, 25 mA∙cm−2, 35 mA∙cm−2 and 50 mA∙cm−2, respectively.
Processes 10 00198 g008
Figure 9. The relationship between saturation magnetization (Ms) and Fe content in FeNi electrodeposited films.
Processes 10 00198 g009
Table 1. Solution composition of electrodeposited FeNi films.
ReagentConcentration/M
NiSO4∙6H2O0.2
FeSO4∙7H2O0.015, 0.03, 0.05
H3BO30.4
(NH4)2SO40.15
NaCl0.7
Thiourea0.00079
Table 2. Average grain sizes of FeNi electrodeposited films.
Concentration of Fe(II)/MCurrent Density/mA∙cm−2Average Grain Size/nm
0.0151510.1
2011.4
2510.2
3510.1
509.2
0.03159.2
2010.1
2510.8
3511.1
5010.4
0.05159.9
2010.9
2512.8
3510.2
5010.6
Publisher’s Note: MDPI stays neutral with regard to jurisdictional claims in published maps and institutional affiliations.

