Article

Growth Enhancement of Camellia sinensis with Biochar

1
Department of Agronomy, National Chung Hsing University, Taichung 402202, Taiwan
2
Department of Forestry, National Chung Hsing University, Taichung 402202, Taiwan
*
Author to whom correspondence should be addressed.
Processes 2022, 10(2), 199; https://doi.org/10.3390/pr10020199
Submission received: 26 December 2021 / Revised: 13 January 2022 / Accepted: 17 January 2022 / Published: 21 January 2022
(This article belongs to the Special Issue The Role of Biochar in Soil Remediation Processes)

Abstract

:
Biochar application in the agriculture sector is a practical approach to minimize waste and maintain sustainable farming. However, the information regarding biochar application in tea cultivation is limited and especially rare in field research. In this study, a two-year biochar experiment was conducted in a tea yard subject to tea yield and soil characteristics. According to tea growth, the tea yard for the experiment was divided into weak and normal sectors. Biochar was made from tea processing waste, mainly the twigs. The results showed that biochar application increased tea production by 2.3- and 1.3-fold in the weak and normal sectors, respectively, suggesting that converting tea waste to biochar for soil amendment is beneficial to increasing tea production, particularly in the weak sector. The regression analysis on tea production and soil characteristics revealed that only soil electric conductivity (R2 = 0.6597), soil organic matter (R2 = 0.7024), and soil extractable phosphate (R2 = 0.6547) were positively correlated with tea yield. Therefore, the field experiment of this study improves the understanding of biochar’s agronomic and environmental benefits on plant productivity and soil health.

1. Introduction

Biochar is a pyrolysis product of biomass and is recommended for soil amendment for improving soil health and increasing crop yield [1,2]. The biomass types and pyrolysis conditions were determined by biochar’s structure, nutrient content, pH, and other properties [3,4,5]. The application of biochar in soil remarkably influenced soil properties, such as enhanced soil water retention, soil aggregation, and nutrient turnover [6,7,8,9,10]. In addition, it was proposed as an efficient process to increase soil organic matters (OM) [2,7,11,12]. Moreover, many reports notified that biochar application affected numerous elements’ cycling in the soil, including carbon (C), phosphorus (P), and nitrogen (N) [13,14,15]. The soil N and P were preserved due to the addition of biochar [16,17]. Biochar application enhanced the mineralization of preserved soil P and provided a certain proportion for plant uptake [18].
Tea is a worldwide beverage with a yearly yield of 6.5 MT [19], mainly planted in Asia and Africa. The requirements for tea planting were temperatures ranging from 10 to 30 °C, precipitation higher than 1250 mm annually, acidic soils preferably, and 0.5–10° slopes. Tea production is susceptible to growing seasons and is threatened by extreme climate change. Biochar from the waste of tea drinking has been produced and studied in many reports [20,21,22]. However, using tea twigs for making biochar has never been studied. Tea twigs are one of the waste materials during tea processing in tea factories, which is around 10% of raw materials. This study recycled the tea processing waste by converting it to biochar and used its benefits as a soil amendment in a tea yard to approach sustainable tea cultivation. The limiting factors of sustainable tea cultivation are soil acidification [23], poor soil fertility [24], and low nutrient efficiency [25]. Soil acidity is one of the most significant barriers restraining sustainable tea cultivation [26], even though tea is an acid-soil-tolerant plant. Typically, the soil pH suitable for tea growth is 4.5–5.5 [24]. High soil acidity can decrease tea growth and quality if the tea soil pH is below 4.5 [27]. Liming has been suggested to overcome the problem of soil acidity [28,29]. However, some reports are against liming regarding the increase in greenhouse gas emissions [30] and the decrease in soil P availability [31]. As tea is a calciphobous plant [32], tea growth and quality declines were expected under high soil calcium that usually resulted from inappropriate liming [33].
Therefore, a new appropriate agricultural practice is necessary to remediate soil acidification in tea yards. Poor soil fertility is another limiting factor closely linked to soil acidification. A high-yield tea plantation requires a soil OM above 2.0% and higher available N and P content in the soil [24]. Most tea yards are located in tropical and subtropical areas with highly weathered tropical soils categorized by low nutrient availability [27]. Heavy rainfall is also frequent in these areas, which results in massive losses of soil nutrients by a runoff for leaching [34,35]. Fertilizer applications are commonly used to increase yield or improve quality. Most N and P are lost to the environment via N2O emissions [36,37], and soil N and P leaching [38], which eventually increases costs of production and the risks of pollution [27]. Biochar application to the agricultural sector is a promising strategy to improve soil fertility [8,27,39,40,41]. The positive effects of biochar on crop production have been proven in tropical environments, especially in acid soils with poor nutrients [42], which might be attributed to biochar’s high basic cations and alkalinity [43,44]. In addition, the leaching of nutrients decreased with biochar application [45,46,47]; hence, the levels and availability of nutrients increased [48,49,50,51].
Tea is a perennial crop that can be harvested for more than thirty years. However, some weakened trees will appear after long-term cultivation due to spatial changes in the soil, the lack of nutrients for slope location, or rainfall. Then, it may expand to a weak growth sector in the tea yard if no remediation process is imposed. This study hypothesized that biochar amendment could serve as a remediation process that improves tea growth by increasing nutrient availability, particularly in the weak growth sector. In this study, a field experiment was conducted to assess the effects of twigs biochar applications on tea growth and soil properties between weak and normal tea sectors. This study will be beneficial for guiding sustainable agricultural management in tea yards.

2. Materials and Methods

2.1. Field Experimental Site

Tea plants for this experiment were Camellia sinensis var. Shi-Ji-Chun. The tea plants were planted for more than fifteen years. The tea yard is located in central Taiwan with a latitude of 23°51′3.60″ N and a longitude of 120°40′39.00″ E, where the elevation is 400 m above sea level, the average temperature is 22–25 °C, the soil is sandy loam, and the annual precipitation is 1500–2000 mm. The experiment was conducted from June 2019 to October 2021. The study field occupied approximately 4000 m2. According to tea yield, the experimental site was divided into two sectors (Figure 1): weak growth (Weak) and normal growth (CK) of tea. Each sector contained six plots, three for biochar application (B) and three without biochar (N). The abbreviations for the four treatments were W-B (weak growth with biochar), W-N (weak growth without biochar), CK-B (normal growth with biochar), and CK-N (normal growth without biochar). The first-time biochar application added 20 g m−2 biochar (around 0.03% (w w−1 soil)) on the soil surface in November 2019. Then, the amount of biochar was increased to 80 g m−2 (around 0.12% (w w−1 soil)) for the second-time biochar application in June 2020. The biochar application area for each plot was 1 m long and 0.3 m wide on two sides of the tea tree under the tea canopy. The fertilizer (N:P:K:S:OM = 19:5:9:5:61) applied in the tea yard was three times (February, August, and November) in a year with 0.66 kg m−2 in each time. In general, the pesticides were sprayed 20 days before harvest.

2.2. Biochar Production and Characteristics

Biochar is made from tea processing waste, mainly the tea twigs from a tea processing factory. The tea twigs were pyrolyzed with a temperature of 450 °C or 600 °C for one hour in the quartz tuber (2.8 L with a diameter of 10 cm and length of 36 cm) equipped with an electrical wire for multiple heating processions and nitrogen gas passing for oxygen depletion. The properties of all biochars used in this study are shown in Table 1. Properties of biochar were determined by an Element Analyzer (EL CHNOS Rapid F002, ElmenterVario, Langenselbold, Germany) and Thermogravimetric Analyzer (Perkin-Elmer STA 6000, Waltham, MA, USA). The characteristic of biochar (Table 1) was measured by the minerals contained in biochar powder (40–60 mesh). The measurements were expressed as the C (wt. %), H (wt. %), N (wt. %), O (wt. %), S (wt. %), water content (wt. %), volatile compound (wt. %), fixed carbon (wt. %), and ash (wt. %). Biochar pH and EC were measured by a meter (Microcomputer pH/Conductivity/Temperature Meter 6307, JENCO, Instruments Inc., San Diego, CA, USA) with a ratio of 1:30 and 1:20 to water, respectively. The surface area (m2 g−1) was measured with the specific area/pore size distribution using the volumetric gas adsorption technique (Belsorp mini X, BEL Japan, Inc., Osaka, Japan).

2.3. Soil Properties Analysis

Soil properties (0–15 cm) were analyzed before and after biochar application in November 2019 with three replicates for each treatment, then continued to March 2021 on each tea harvest. After air-drying and sieving with a 2 mm sieve, soils were mixed with water at a ratio of 1:2 for soil pH and EC determination [52], which were analyzed with a Microcomputer of pH/Conductivity/Temperature (Meter 6307, JENCO, Instruments Inc., USA). Soil WHC (water holding capacity) was determined using a method adapted from Nguyen and Lehmann (2009) [53]. The determination of soil OM (soil organic matter) was conducted according to Ball (1964) [54]. Available nitrogen was extracted from 2 g of a soil sample by adding 10 mL of 2 M of KCl. The sample solution was incubated with salicylate and bleach in the microplate wells. After 15 min, a microplate reader (SpectraMax M2, Molecular Devices, San Jose, CA, USA) read the optical density value with 650 nm of wavelength absorbance [55]. Available phosphorus was extracted from 2 g of a soil sample to 20 mL of Mehlich 3 solution (M3 solution consisted of 0.2 N acetic acid, 0.25 N NH4NO3, 0.015 N NH4F, 0.013 N HNO3, and 0.001 M EDTA). The sample solution was incubated with AMP (ammonium para-molybdate) solution (53 mL of H2SO4 and 8.775 g of ammonium para-molybdate in 500 mL of ddH2O) in the microplate wells. After 10 min, a microplate reader (SpectraMax M2) read the optical density value with 630 nm of wavelength absorbance [56].

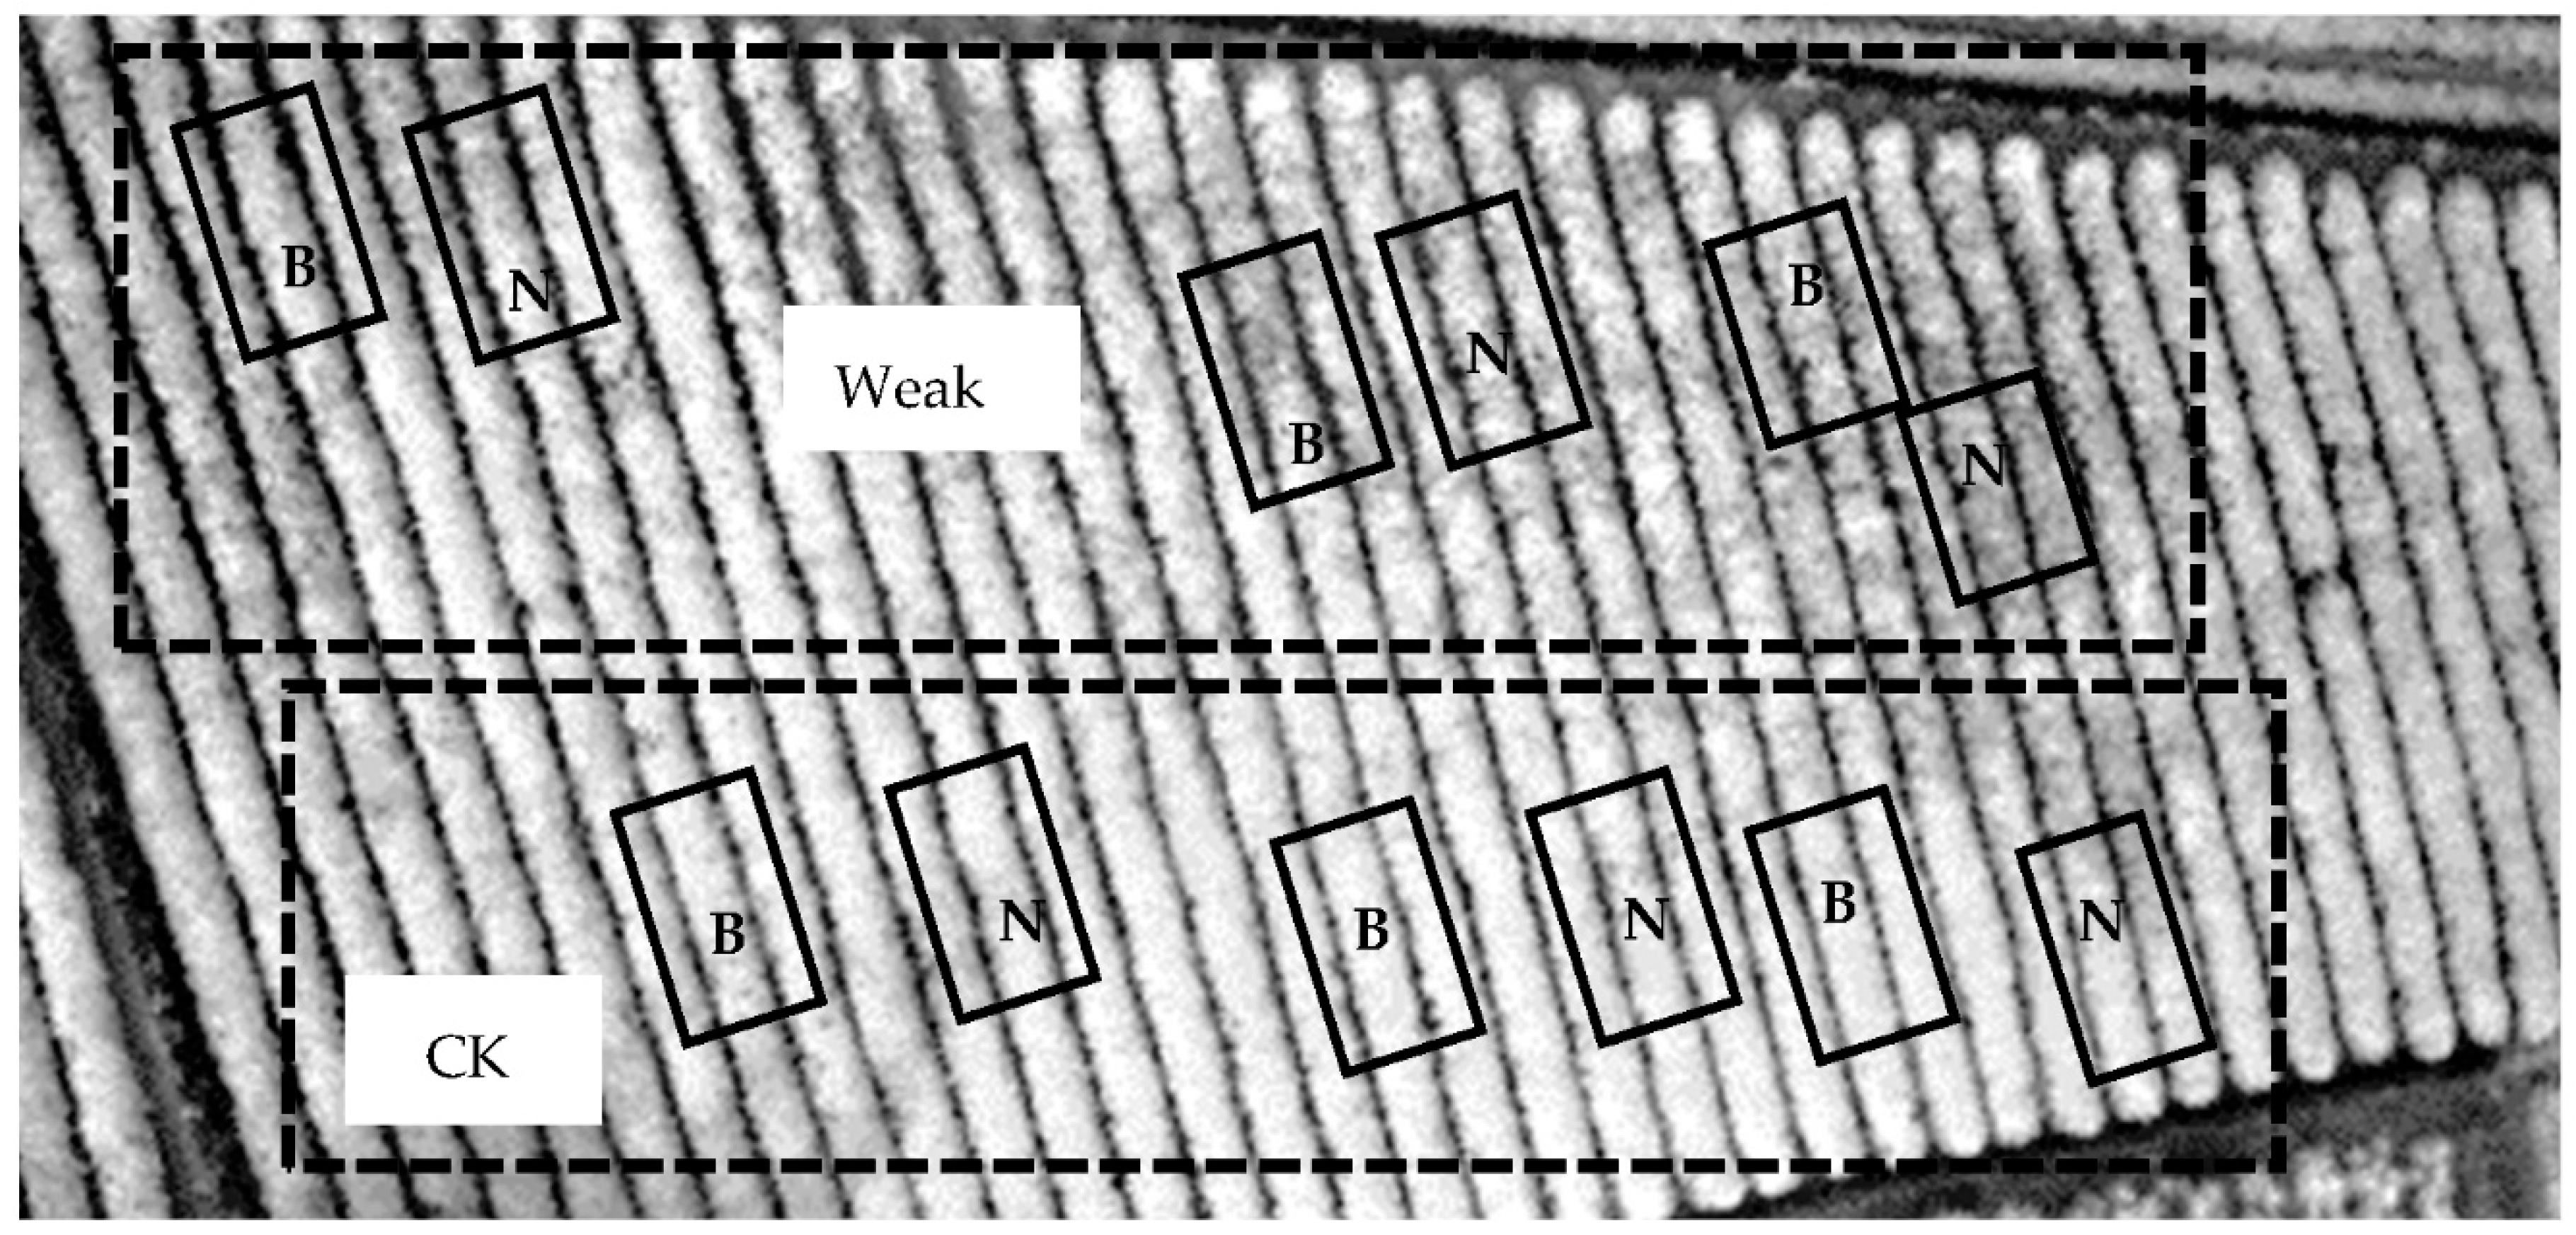
2.4. Tea Yield Analysis

Tea yield was measured before and after biochar application. Yield data were collected on November 2019, June 2020, August 2020, November 2020, March 2021, and October 2021. The number of tea shoots in a square of 0.16 m2 was counted for one replication. The average of three replications at each plot was converted to the new shoot number per m2 to indicate the tea yield of one plot.

2.5. Statistical Analysis of Data

Yield and soil properties data from each treatment expressed the standard error of the mean with bars. The differences between treatments were tested with Student’s t-test or Fisher’s Least Significant Difference (LSD) test. Regression was then performed to determine the relationship between yield and other variables. Statistical analyses were conducted using SPSS Statistics 22.0.

3. Results

3.1. Biochar Characteristics

The characteristics of tea biochar in Table 1 show that the elevation in the pyrolysis temperature from 450 °C to 600 °C increased the biochar pH from 9.1 to 10.3, the water content from 5.6 to 7.0%, the fixed carbon content from 56.5 to 62.1%, the ash content from 10.2 to 11.1%, and the carbon (C) content from 71.4 to 73.8%. On the other hand, the elevated temperature decreased the surface area from 12.1 to 8.9 m2 g−1, the content of the volatile compound from 27.7 to 19.8%, the hydrogen (H) content from 3.2 to 1.8%, the nitrogen (N) content from 2.7 to 2.5%, and the oxygen (O) content from 12.4 to 11.1%. Only the sulfur (S) showed a stable content of 0.1%. However, the effect of both biochars on plant growth was no different in rice seedlings (data not shown). Thus, the biochar application in this study was mixed with both temperatures of biochars with a ratio of around 1:1 as both temperatures were recommended as the optimal temperature for biochar processing.

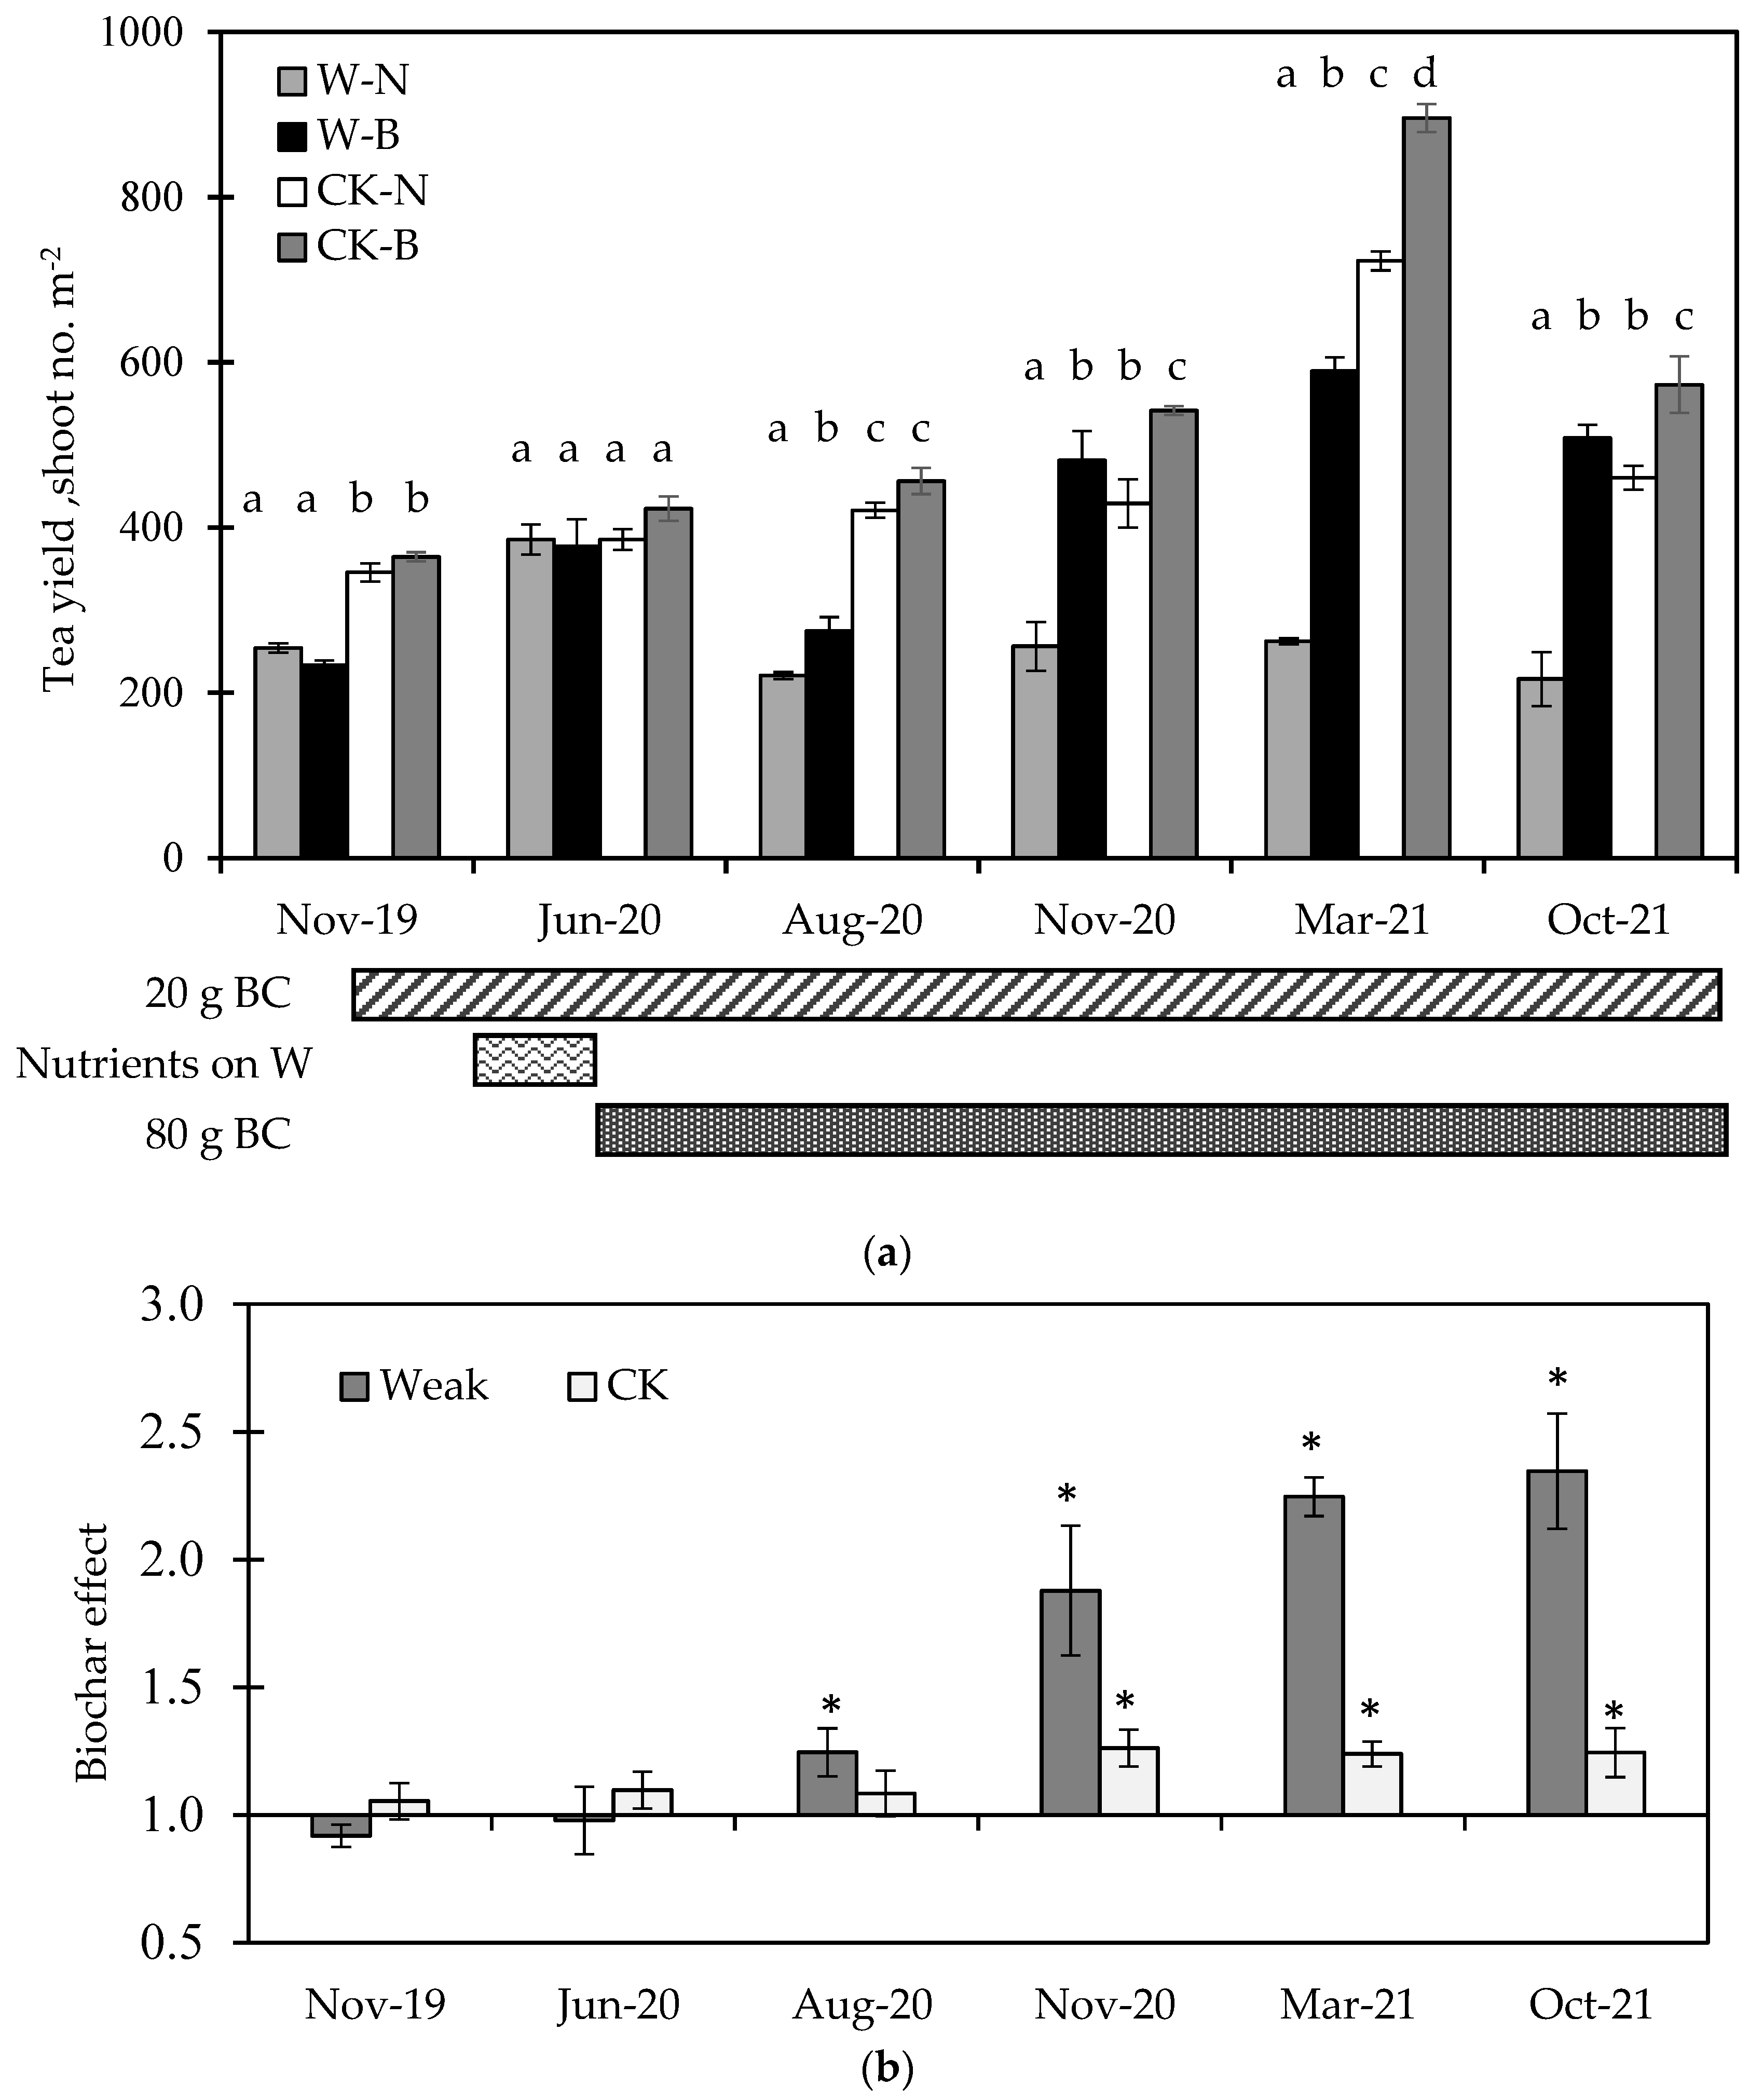
3.2. The Responses of Tea Yield

The infrared picture of the tea yard in Figure 1 shows that the tea grown on the lower part was better than that on the upper part, as the brighter the color, the more vigorous the tea sprouts. Thus, the biochar experiment was conducted in two sectors, weak and normal (CK) growth (Figure 1). Each sector contained six plots, and three were set up for biochar application (B); the others were without Biochar (N). The differences between the weak and CK sectors are shown in Figure 2. The tea yield, soil EC, extractable N, and water holding capacity were significantly lower in the weak sector, but not the soil organic matter or extractable P. The soil pH showed a higher variance in the weak sector (Figure 2b). Biochar was applied twice in the tea yard, one in November 2019 with 20 g m−2 and the other in June 2020 with 80 g m−2 (Figure 3a). From November 2019 to June 2020, tea yields neither increased nor decreased under biochar application in the weak and CK sectors (Figure 3a), suggesting 20 g m−2 biochar application might not be enough to affect tea growth.
One month before the harvest of June 2020, a nutrient was sprayed on the weak sector only. The nutrient treatment (with N, P, K, Cu, Zn, Fe, and Mn of 140, 18, 100, 18, 1, 6, and 7 ppm, respectively) increased the weak sector’s tea yield and enabled it to reach the level of the CK sector, indicating that tea trees in the weak sector could have the problem of nutrient deficiency. Thus, biochar was applied again with 80 g m−2 (Figure 3a). After that, biochar application resulted in a significant increase in tea yield in the sectors of weak and CK. The magnitude of the biochar effect in the tea yield of the weak sector was higher than that in the CK sector (Figure 3b). However, the tea yield that increased in the weak sector with biochar treatment did not always reach the CK sector’s level (Figure 3a), such as the results in August 2020 and March 2021. In October 2021, the tea yield decreased in all treatments (Figure 3a) due to an extremely long dry season from March 2021 to August 2021. Nevertheless, the biochar effect was still apparent (Figure 3b); the biochar effect remained at 1.24 in the CK sector but increased from 2.25 to 2.35 in the weak sector.

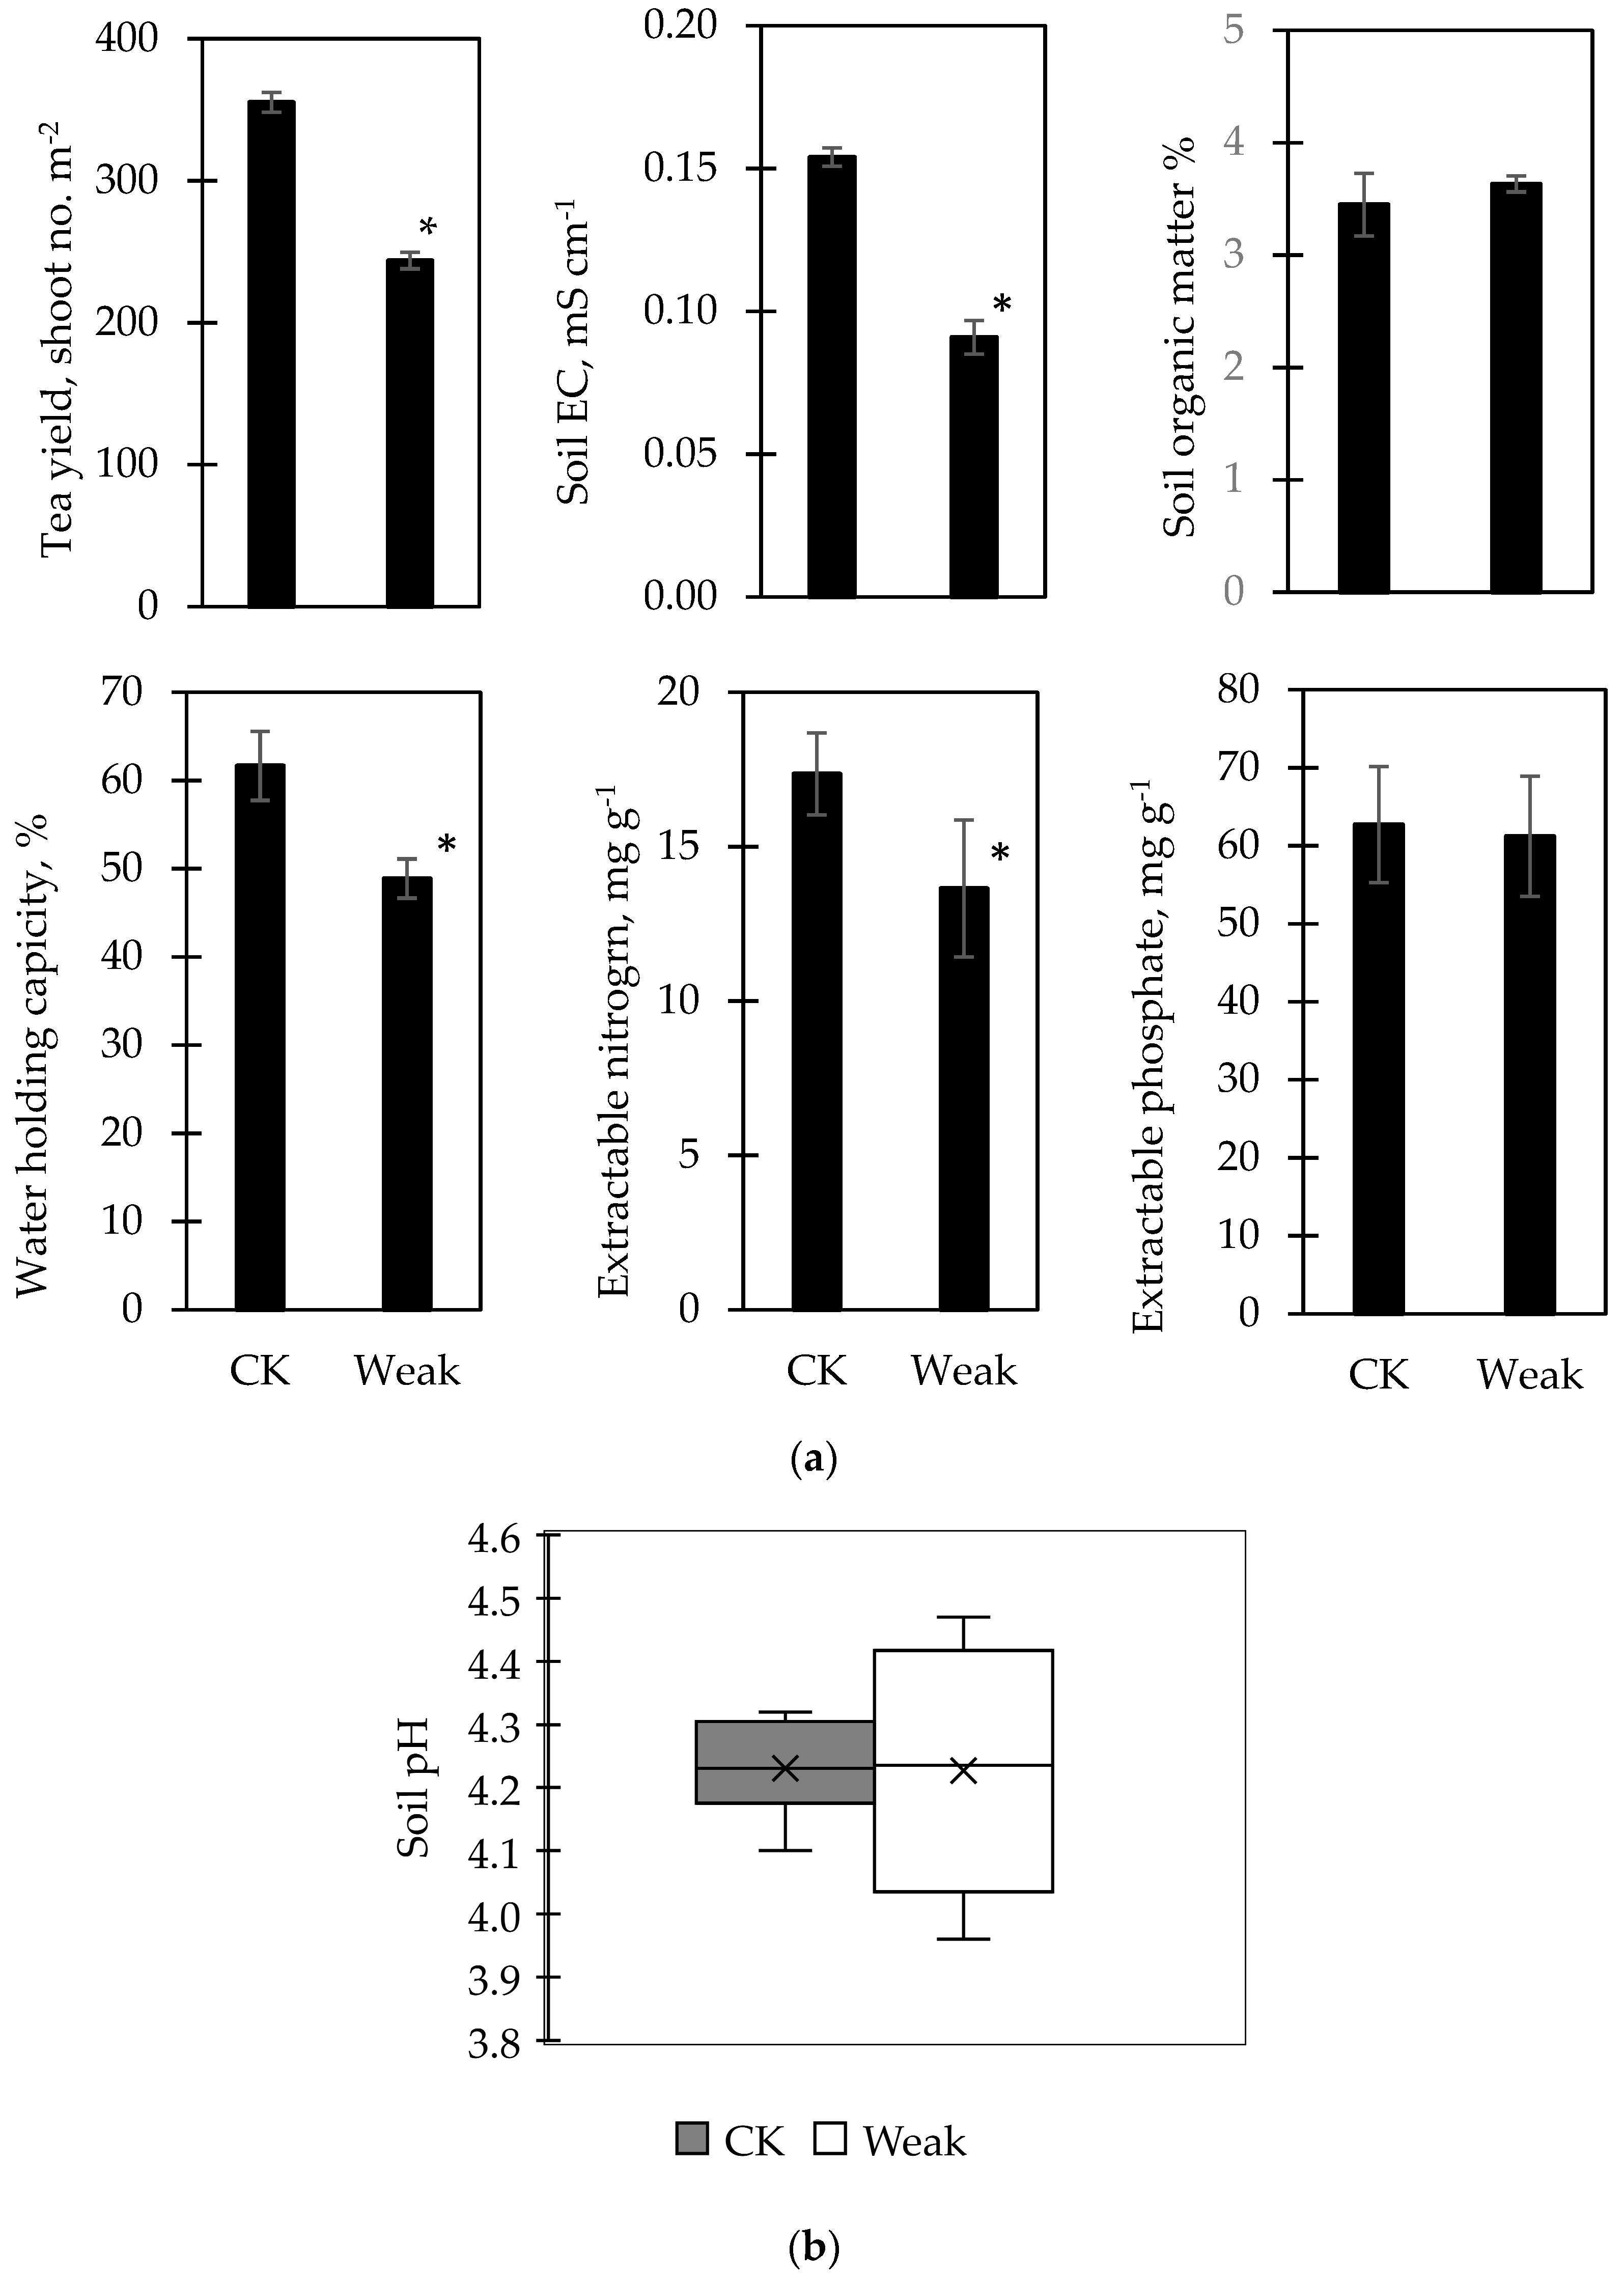
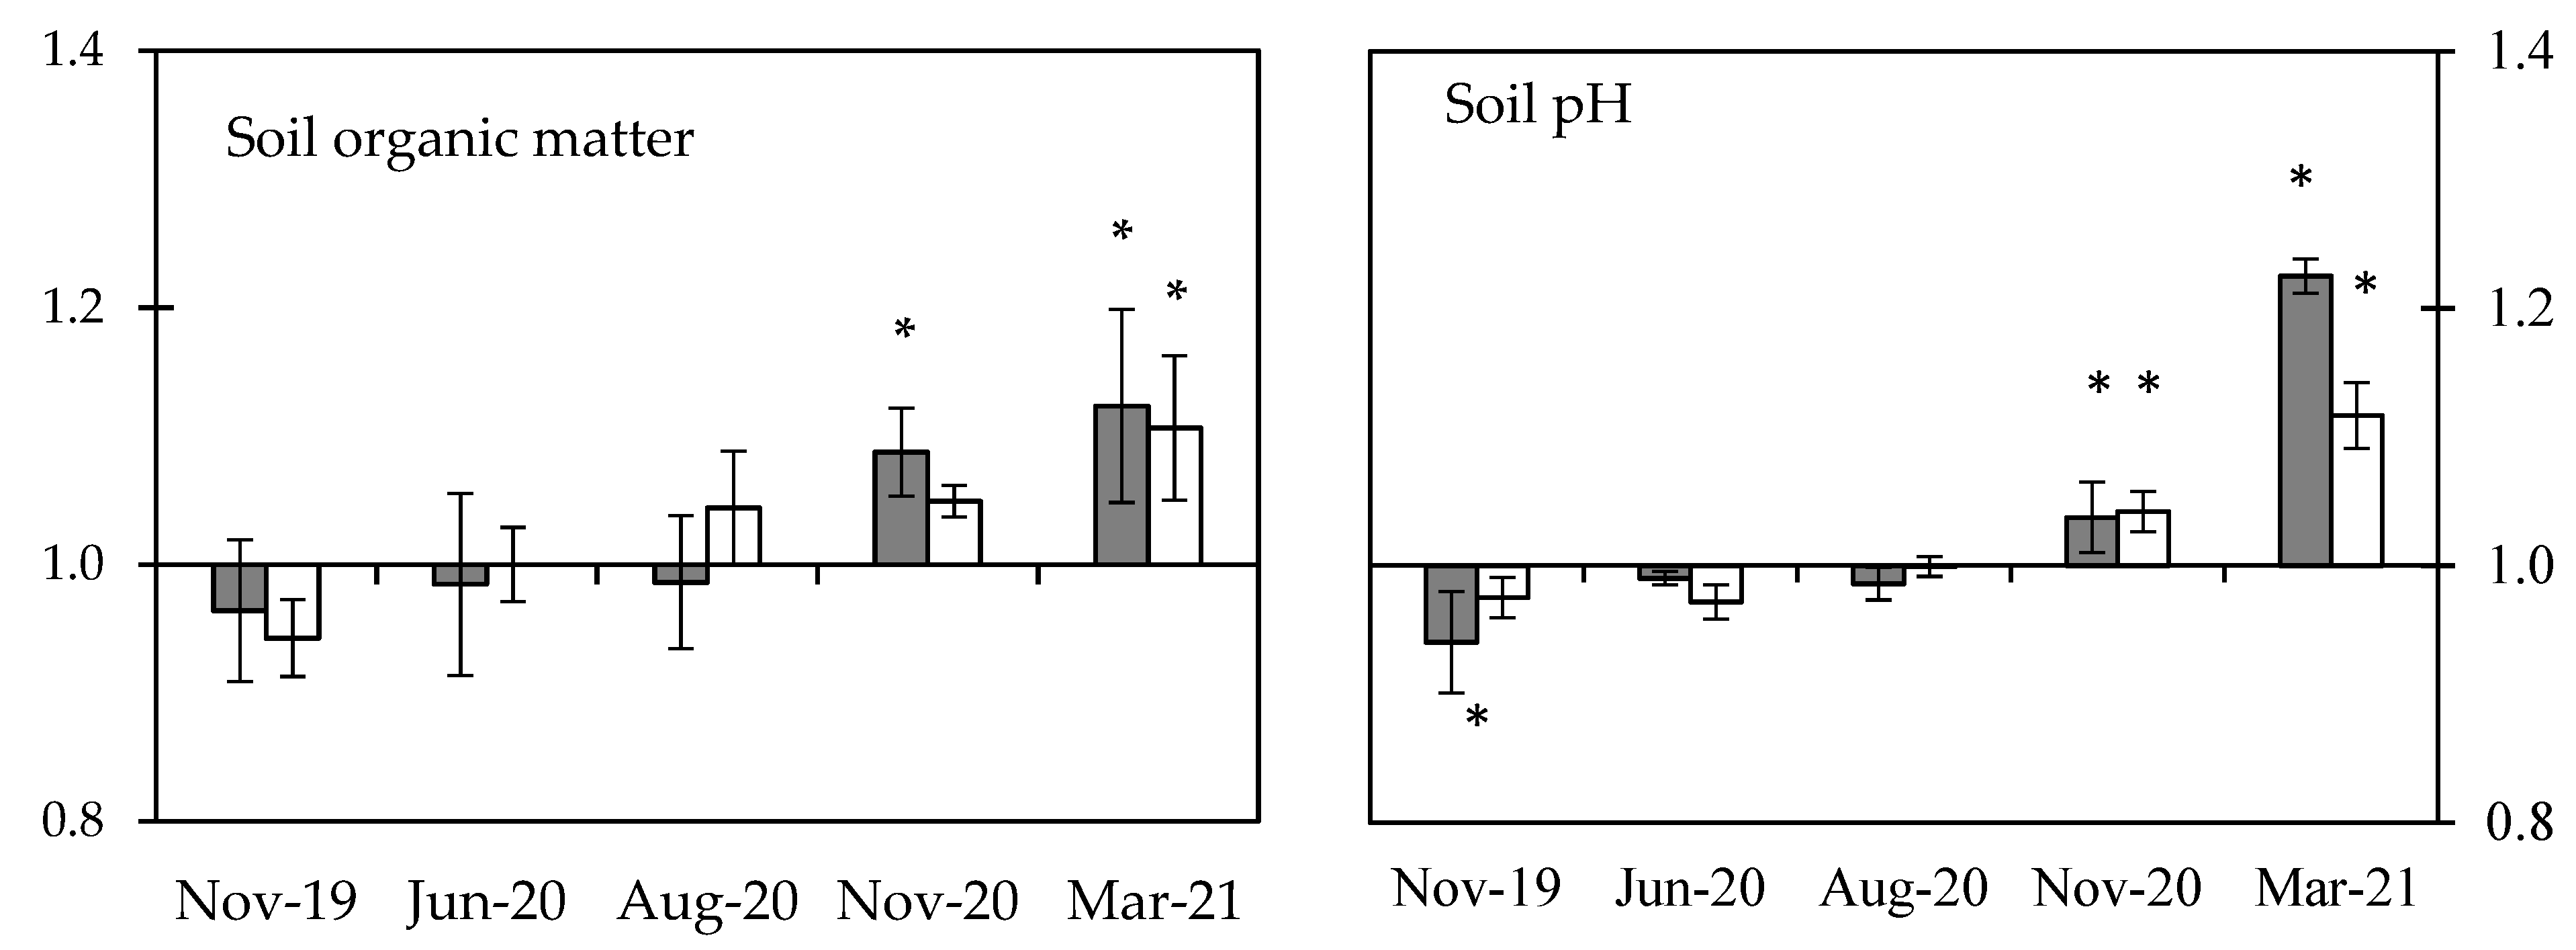
3.3. Biochar Effects on Soil Characteristic

Soil characteristics (Figure 4) with biochar application on the tea yard showed diverse responses under long-term monitoring. As the soil pH (Figure 2b) showed a higher variance in the weak sector, the plots with lower soil pH were set-up for biochar application. It thus caused the biochar effect below 1.0 on the soil pH (Nov-19 of Figure 4). Meanwhile and unintentionally, the selected plots also showed the biochar effect below 1.0 on the soil EC, extractable P, and N. In the CK sector, the biochar was applied without selection but still showed the biochar effect below 1.0 in soil extractable P and water holding capacity due to soil variation (Nov-19 of Figure 4). The chronicle biochar effects of soil EC (Figure 4) showed that the biochar application initially increased the soil EC of both sectors. The biochar effect in the weak sector increased from 0.78 to 1.13, and that in the CK sector increased from 1.02 to 1.24 and then dropped to 1.10 later (Figure 4). The biochar effect on soil water holding capacity increased gradually in both CK and weak sectors but more promptly in the weak sector. The biochar effect on soil OM increased gradually in both CK and weak sectors, but it needed one year’s biochar application. Soil P and N showed different responses to biochar application, and the difference was evident after one year’s biochar application. The biochar effect on soil P increased gradually in both CK and weak sectors, but the extent increased more in the weak sector, where the biochar effect increased from 0.77 to 1.70 in the weak sector and from 0.72 to around 1.20 in the CK sector. In contrast, the biochar effect on soil N increased gradually in the CK sector. Still, the extent increased more in the CK sector, where the biochar effect increased from 0.73 to 1.20, then dropped to 0.99 later in the weak sector and from 0.84 to 1.67 in the CK sector. The biochar effect on soil pH increased gradually in both CK and weak sectors, but one year’s biochar application was needed to achieve the significant difference.

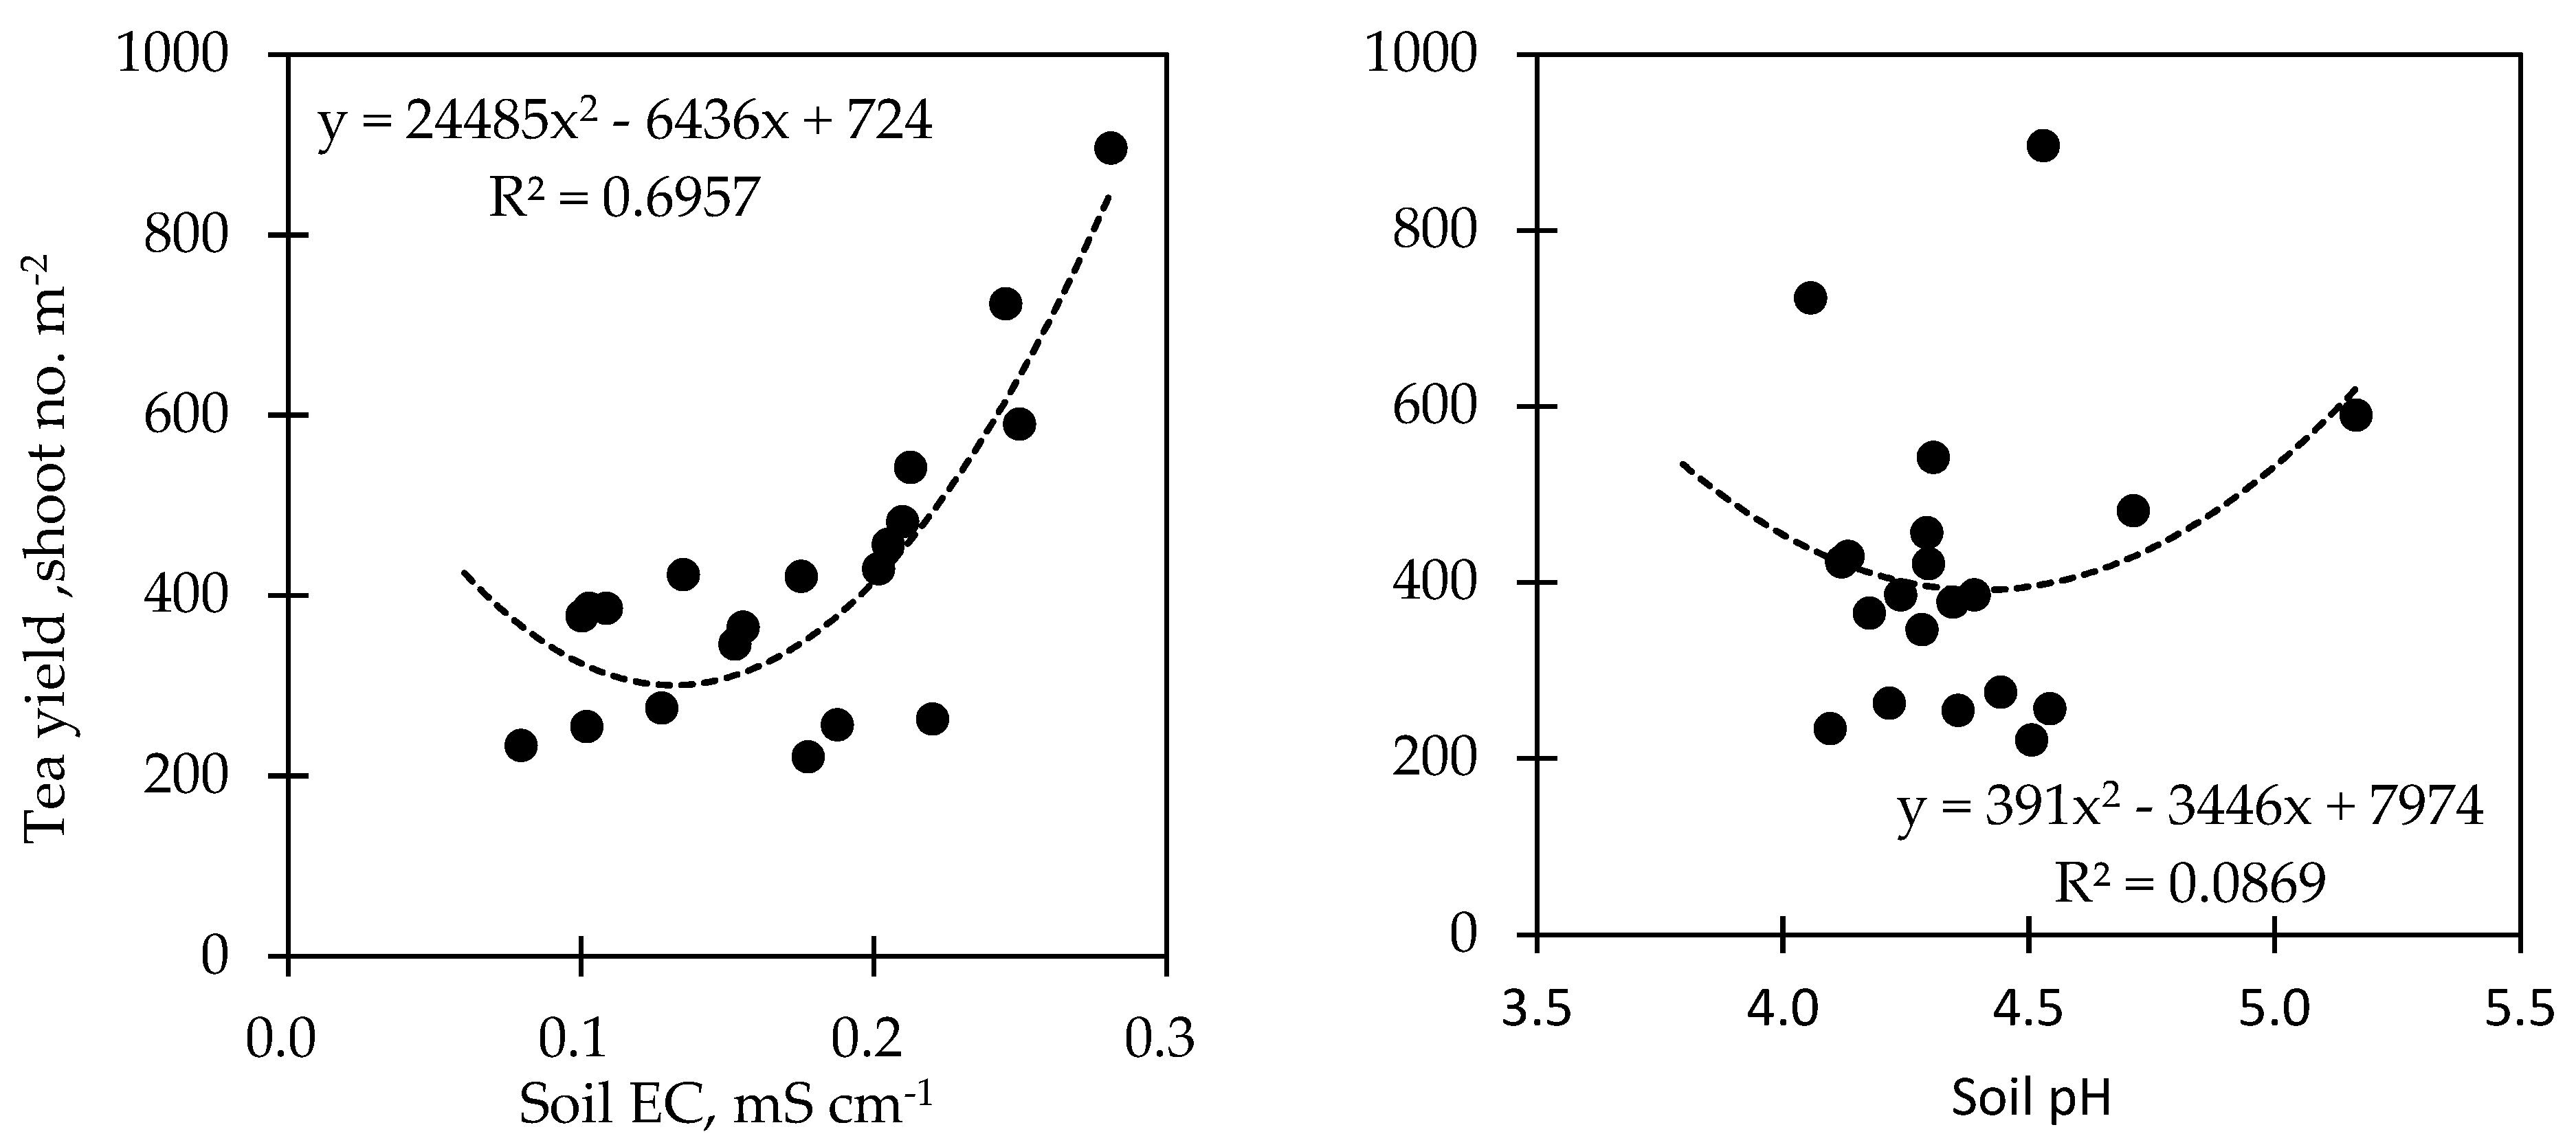
3.4. Relationship between Tea Yield and Soil Status

The relationship between the tea yield and the soil status that responded to biochar application showed varied correlations (Figure 5). The analysis of regression revealed that the soil EC (R2 = 0.6957; p < 0.05), the soil P (R2 = 0.6547, p < 0.05), and the soil OM (R2 = 0.7024; p < 0.05) were positively correlated with the tea yield, while the soil pH (R2 = 0.0869; p < 0.05), soil WHC (R2 = 0.0152; p < 0.05), and the soil N (R2 = 0.0265; p < 0.05) showed a very weak correlation with the tea yield.

4. Discussion

The alkaline characteristic of biochar is the primary concern in tea cultivation as tea is an acid-growth crop. The pH of biochar used in this study was around 9.1–10.3 (Table 1). At the beginning of this study, the purpose of biochar application with 20 g m−2 was to test the worrying negative effect of biochar’s alkaline characteristics. The tea yield of June 2020 revealed that 20 g m−2 biochar application neither increased nor decreased tea yield in the CK sector and weak sector (Figure 3a), suggesting 20 g m−2 biochar application might not be enough to assess the biochar effect. Another reason could be the biochar being applied on the soil surface. Thus, a higher amount of biochar, 80 g m−2, was applied in the following. However, the subsequent effect of the 20 g m−2 biochar application cannot be excluded.
The biochar application did not increase the soil pH until one year later (Figure 4). After one year of biochar application, the soil pH increased from 4.1 to 5.2 in the weak sector and from 4.2 to 4.5 in the CK sector. The soil pH in both sectors was still within the optimal pH for tea growth. In addition, the regression analysis revealed no correlation between soil pH and tea yield in this study (Figure 5). Instead of worrying about the negative effect of biochar, the biochar application increased the tea yield of the weak sector in August 2020 (Figure 3b), just two months after biochar application. After November 2020, the tea yield increased continuously in the weak and the CK sectors. Thus, the biochar applied in the tea yard seemed to have no harm on tea growth under the amount applied with this study, which was 80 g m−2. Furthermore, the tea yield increased with biochar application, particularly in the weak sector.
The tea yield increasing with biochar application was higher in the weak sector than in the CK sector (Figure 3b), implying biochar could provide the nutrient in the weak sector as it has the nutrient deficiency problem (Figure 2). Carbon is a knowingly essential nutrient that determines plant growth and productivity. The biochar contains abundant labile C because it was obtained by high-temperature pyrolysis [57]. This study found that tea biochar had a characteristic of high C content (Table 1). The result of biochar application in the tea field showed the tea yield enhanced in both weak and CK sectors by 2.3-fold and 1.3-fold (Figure 2). This finding is consistent with findings that biochar improves tea growth [27]. In addition, the soil analysis in Figure 4 showed that soil EC increased with biochar application. In the meantime, the soil P and N increased with biochar application, indicating that biochar could provide the nutrient for tea growth. As increased pH could increase nutrient availability in the soil, suggesting that the soil pH increase with biochar application after 2019 also helped increase soil nutrients. Biochar application significantly increased the soil-available P concentrations, and it was reported that biochar application improves soil pH and nutrient availability [44,58]. In addition, biochar was reported to be a source of plant macro, micro, and secondary nutrient elements [1].
Phosphate is a critical element in cell division and displays a reduction in leaf expansion and the number of leaves in P-deficient plants [59,60]. The results in Figure 3b revealed that the magnitude of the biochar effect in the tea yield of the weak sector was higher than that in the CK sector, while the soil P increased more in the weak sector (Figure 4). In contrast, the biochar effect on soil N increased more in the CK sector. According to the regression analysis in Figure 5, the soil P (R2 = 0.6547, p < 0.05) was positively correlated with the tea yield, while the soil N (R2 = 0.0265; p < 0.05) showed a weak correlation with the tea yield. Thus, the remarkable increase in tea yield in the weak sector could be due to the complement of soil P from biochar application. The availability of soil nutrients such as P for plants is pH-dependent.
Biochar increases soil pH, enhancing primary and secondary nutrients such as P [61,62,63,64]. In addition, numerous reports have shown that biochar application had a liming effect due to biochar’s alkaline nature and have suggested that it was more suitable for acidic soils than alkaline soils [65,66,67,68]. However, the regression analysis in Figure 5 showed a very weak correlation between the tea yield and soil pH (R2 = 0.0869; p < 0.05). It is speculated that the detection of soil pH on bulk soil may not reflect the pH near the root zone, the rhizosphere. In addition, the biochar effect on microbial mineralization cannot be excluded, as biochar application was reported to increase phosphate uptake with a 360% increase in mycorrhizal colonization [69]. All of this contributes to its positive effect on improving soil nutrient availability. Therefore, the biochar application in the tea field concurs with Biederman and Harpole (2013) [70] and Lehman et al. (2015) [71], expressing that biochar provides the source of several nutrients with the complex reaction with soil and makes nutrients available for plant uptake over time. Biochar has been reported to enhance soil C sequestration and reduce CO2 emissions. Thus, the result in Figure 4 shows that the biochar effect on soil OM increased gradually in both CK and weak sectors, but it needed one year’s biochar application. However, soil OM could be the source of many soil nutrients with microbial mineralization and needs further investigation. In addition, the soil OM was positively correlated with tea yield (R2 = 0.7024; p < 0.05) (Figure 5). These findings emphasize the beneficial role of fertilization on the effectiveness of biochar in nutrient availability [72].

5. Conclusions

Overall, the alkaline biochar effectively ameliorated soil acidity and increased soil OM and nutrient availability, such as soil available N and P. Thus, tea waste biochar application at the tea yard significantly increased the tea growth of weak and normal sectors. This study proved the benefits of biochar to tea’s soil health and tea plant productivity. Moreover, it will be the source for farmers to implement sustainable farming. Therefore, the on-farm experiment of this study improves the understanding of biochar’s agronomic and environmental benefits on soil health and plant productivity.

Author Contributions

Conceptualization and methodology, C.-T.C. and K.-T.W.; sample analysis, H.N.S. and D.-Y.L.; writing—original draft preparation, C.-T.C. and H.N.S. All authors have read and agreed to the published version of the manuscript.

Funding

This research was funded by The Council of Agriculture (Taiwan ROC) with the project of “Establishing and Disseminating a Demonstration Platform for the Mass Production Equipment of Biochar” (110AS-17.1.2-ST-a4).

Institutional Review Board Statement

Not applicable.

Informed Consent Statement

Not applicable.

Data Availability Statement

We would like to exclude this statement.

Acknowledgments

The authors are grateful to Pei-Shih Kao for helping the process of biochar pyrolysis.

Conflicts of Interest

The authors declare no conflict of interest.

Appendix A

Table A1. The soil characteristics under biochar application from 2019 to 2021. W-B means weak tea growth (W) with biochar applied (B); CK-N means normal tea growth (CK) without biochar (N).
W-NW-BCK-NCK-BDate
Soil EC, mS cm−10.100.080.150.16November 2019
0.100.100.110.14June 2020
0.180.130.180.20August 2020
0.190.210.200.21November 2020
0.220.250.250.28March 2021
Soil WHC, %50.047.870.053.3November 2019
45.754.964.748.2June 2020
42.151.054.150.3August 2020
37.853.737.053.3November 2020
42.356.134.957.2March 2021
Soil OM, %3.703.574.072.83November 2019
4.334.274.204.20June 2020
4.804.734.534.73August 2020
5.335.804.405.67November 2020
5.406.076.276.93March 2021
Extractable P,
mg g−1
69537353April 2019
134112123112June 2020
113125111125August 2020
107132103132November 2020
167284256284March 2021
Extractable N,
mg g−1
15.811.518.915.8April 2019
14.99.315.511.7June 2020
9.410.08.65.6August 2020
7.48.87.59.6November 2020
11.211.07.612.7March 2021
Soil pH4.44.14.34.2November 2019
4.44.34.24.1June 2020
4.54.44.34.3August 2020
4.54.74.14.3November 2020
4.25.24.14.5March 2021

References

  1. Lehmann, J.; Joseph, S. Biochar for Environmental Management: Science and Technology; Earthscan: London, UK, 2009. [Google Scholar]
  2. Kimetu, J.M.; Lehmann, J. Stability and stabilization of biochar and green manure in soil with different organic carbon contents. Aust. J. Soil Res. 2010, 48, 577–585. [Google Scholar] [CrossRef]
  3. Bruun, E.W.; Hauggaardd-Nielsen, H.; Ibradhim, N.; Egsgaard, H.; Ambus, P.; Jensen, A.P.; Dam-Johansen, K. Influence of fast pyrolysis temperature on biochar labile fraction and short-term carbon loss in a loamy soil. Biomass Bioenergy 2011, 35, 1182–1189. [Google Scholar] [CrossRef]
  4. De la Rosa, J.M.; Paneque, M.; Miller, A.Z.; Knicker, H. Relating physical and chemical properties of four different biochars and their application rate of biomass production of Lolium perenne on a Calcic Cambisol during a pot experiment of 79 days. Sci. Total Environ. 2014, 499, 175–189. [Google Scholar] [CrossRef] [Green Version]
  5. Novak, J.M.; Busscher, W.J.; Laird, D.L.; Ahmedna, M.; Watts, D.W.; Niandou, M.A.S. Impact of biochar amendment on fertility of a South-eastern coastal plain soil. Soil Sci. 2009, 174, 105–112. [Google Scholar] [CrossRef] [Green Version]
  6. Woolf, D.; Amonette, J.E.; Street-Perrott, F.A.; Lehmann, J.; Joseph, S. Sustainable biochar to mitigate global climate change. Nat. Commun. 2010, 1, 56. [Google Scholar] [CrossRef] [PubMed] [Green Version]
  7. Du, Z.L.; Zhao, J.K.; Wang, Y.D.; Zhang, Q.Z. Biochar addition drives soil aggregation and carbon sequestration in aggregate fractions from an intensive agricultural system. J. Soils Sediments 2017, 17, 581–589. [Google Scholar] [CrossRef]
  8. Zhang, Y.L.; Chen, H.; Bai, S.H.; Menke, C.; Zhang, M.Y.; Xu, Z.H. Interactive effects of biochar addition and elevated carbon dioxide concentration on soil carbon and nitrogen pools in mine spoil. J. Soils Sediments 2017, 17, 2400–2409. [Google Scholar] [CrossRef]
  9. Zhang, J.; Sun, C.; Liu, G.; Xue, S. Effects of long-term fertilization on aggregates and dynamics of soil organic carbon in a semi-arid agro-ecosystem in China. PeerJ 2018, 6, e4758. [Google Scholar] [CrossRef] [PubMed]
  10. Pokharel, P.; Kwak, J.-H.; Ok, Y.S.; Chang, S.X. Pine sawdust biochar reduces GHG emission by decreasing microbial and enzyme activities in forest and grassland soils in a laboratory experiment. Sci. Total Environ. 2018, 625, 1247–1256. [Google Scholar] [CrossRef]
  11. Gunina, A.; Kuzyakov, Y. Pathways of litter C by formation of aggregates and SOM density fractions: Implications from 13C natural abundance. Soil Biol. Biochem. 2014, 71, 95–104. [Google Scholar] [CrossRef]
  12. El-Naggar, A.; Awad, Y.M.; Tang, X.Y.; Liu, C.; Niazi, N.K.; Jien, S.H.; Tsang, D.C.W.; Song, H.C.; Ok, Y.S.; Lee, S.S. Biochar influences soil carbon pools and facilitates interactions with soil: A field investigation. Land Dev. Degrad. 2018, 29, 2162–2171. [Google Scholar] [CrossRef]
  13. Prendergast-Miller, M.T.; Michael, D.; Saran, P.S. Localisation of nitrate in the rhizosphere of biochar-amended soils. Soil Biol. Biochem. 2011, 43, 2243–2246. [Google Scholar] [CrossRef]
  14. Zhang, H.; Chen, C.; Gray, E.M.; Boyd, S.E. Roles of biochar in improving phosphorus availability in soils: A phosphate adsorbent and a source of available phosphorus. Geoderma 2016, 276, 1–6. [Google Scholar] [CrossRef]
  15. Tan, Z.; Ye, Z.; Zhang, L.; Huang, Q. Application of the 15N tracer method to study the effect of pyrolysis temperature and atmosphere on the distribution of biochar nitrogen in the biomass–biochar-plant system. Sci. Total Environ. 2018, 622, 79–87. [Google Scholar] [CrossRef]
  16. Xie, Z.; Xu, Y.; Liu, G.; Zhu, Z.; Tu, C.; Amonette, J.E.; Cadisch, G.; Yong, J.W.H.; Hu, S. Impact of biochar application on nitrogen nutrition of rice, greenhouse-gas emissions and soil organic carbon dynamics in two paddy soils of China. Plant Soil 2013, 370, 527–540. [Google Scholar] [CrossRef]
  17. Zhu, S.; Huang, X.; Ma, F.; Wang, L.; Duan, X.; Wang, S. Catalytic removal of aqueous contaminants on N-doped graphitic biochars: Inherent roles of adsorption and nonradical mechanisms. Environ. Sci. Technol. 2018, 52, 8649–8658. [Google Scholar] [CrossRef] [PubMed]
  18. Dari, B.; Nair, V.D.; Harris, W.G.; Nair, P.K.R.; Sollenberger, R.; Mylavarapu, R. Relative influence of soil- vs. biochar properties on soil phosphorus retention. Geoderma 2016, 280, 82–87. [Google Scholar]
  19. FAOSTAT. Food and Agriculture Organization of the United Nations. Production: Crops. 2019. Available online: http://faostat.fao.org (accessed on 25 December 2021).
  20. Pal, D.; Maiti, S.K. Abatement of cadmium (Cd) contamination in sediment using tea waste biochar through meso-microcosm study. J. Clean. Prod. 2019, 212, 986–996. [Google Scholar] [CrossRef]
  21. Vithange, M.; Mayakaduwa, S.S.; Herath, I.; Ok, Y.S.; Mohan, D. Kinetics, thermodynamics and mechanistic studies of carbofuran removal using biochars from tea waste and rice husks. Chemosphere 2016, 150, 781–789. [Google Scholar] [CrossRef] [PubMed]
  22. Rajapaksha, A.U.; Vithanage, M.; Zhang, M.; Ahmad, M.D.; Chang, S.X.; Ok, Y.S. Pyrolysis condition affected sulfamethazine sorption by tea waste biochars. J. Bioresour. Technol. 2014, 166, 303–308. [Google Scholar] [CrossRef] [PubMed]
  23. Yan, P.; Wu, L.; Wang, D.; Fu, J.; Shen, C.; Li, X.; Zhang, L.; Zhang, L.P.; Fan, L.C.; Han, W.Y. Soil acidification in Chinese tea plantations. Sci. Total Environ. 2020, 715, 136963. [Google Scholar] [CrossRef]
  24. Han, W.; Ruan, J.; Lin, Z. The major nutrient limiting factors in tea soils and development of series tea specialty fertilizers. J. Tea Sci. Res. 2002, 22, 70–74. [Google Scholar]
  25. Ni, K.; Liao, W.; Yin, X.; Niu, S.; Ma, L.; Shi, Y.; Zhang, Q.; Liu, M.; Ruan, J. Fertilization status and reduction potential in tea gardens of China. J. Plant Nutr. Fertil. 2019, 25, 421–432. [Google Scholar]
  26. Su, H.G. The improvement measures of soil acidification in tea garden in Anxi. Guangdong Tea Ind. 2012, 1, 31–32. [Google Scholar]
  27. Yan, P.; Chen, S.; Zhenhao, Z.; Jianyu, F.; Xin, L.; Liping, Z.; Lan, Z.; Wenyan, H.; Lichao, F. Biochar stimulates tea growth by improving nutrients in acidic soil. Sci. Hortic. 2021, 283, 110078. [Google Scholar] [CrossRef]
  28. Fageria, N.K.; Nascente, A.S. Chapter six–management of soil acidity of South American soils for sustainable crop production. Adv. Agron. 2014, 128, 221–275. [Google Scholar]
  29. Holland, J.E.; Bennett, A.E.; Newton, A.C.; White, P.J.; Mckenzie, B.M. Liming impacts on soils, crops and biodiversity in the UK: A review. Sci. Total Environ. 2017, 610, 316–332. [Google Scholar] [CrossRef] [PubMed]
  30. Kunhikrishnan, A.; Thangarajan, R.; Bolan, N.; Xu, Y.; Mandal, S.; Gleeson, D.; Seshadri, B.; Zaman, M.; Barton, L.; Tang, C. Functional relationships of soil acidification, liming, and greenhouse gas flux. Adv. Agron. 2016, 139, 1–71. [Google Scholar]
  31. Barrow, N.J. The effects of pH on phosphate uptake from the soil. Plant Soil 2017, 410, 401–410. [Google Scholar] [CrossRef]
  32. Yao, Y.T.; Song, L.B.; Tian, L.L. Advances in research on calcium nutrition of tea. Deciduous Fruits 2011, 2, 37–39. [Google Scholar]
  33. Shen, J.Z.; Hu, J.H. Variation of biochemical components in different tea varieties under excessive calcium treatment. Shandong Agric. Sci. 2014, 46, 74–76. [Google Scholar]
  34. Watanabe, I.; Tokuda, S.; Nonaka, K. Nutrients leaching losses from lysimeter grown tea plants fertilized at two rates of nitrogen. Chagyo Kenkyu Hokoku 2009, 94, 1–6. [Google Scholar] [CrossRef] [Green Version]
  35. Chen, C.F.; Lin, J.Y. Estimating the gross budget of applied nitrogen and phosphorus in tea plantations. Sustain. Environ. Res. 2016, 26, 124–130. [Google Scholar] [CrossRef] [Green Version]
  36. Chen, D.; Li, Y.; Wang, C. Measurement and modeling of nitrous and nitric oxide emissions from a tea field in subtropical central China. Nutr. Cycl. Agroecosyst. 2017, 107, 157–173. [Google Scholar] [CrossRef]
  37. Li, Y.; Fu, X.; Liu, X. Spatial variability and distribution of N2O emissions from a tea field during the dry season in subtropical central China. Geoderma 2013, 193, 1–12. [Google Scholar] [CrossRef]
  38. Yan, P.; Shen, C.; Fan, L.C.; Li, X.; Zhang, L.; Zhang, L.P.; Han, W.Y. Tea planting affects soil acidification and nitrogen and phosphorus distribution in soil. Agric. Ecosyst. Environ. 2018, 254, 20–25. [Google Scholar] [CrossRef]
  39. Jeffery, S.; Verheijen, F.G.A.; van der Velde, M.; Bastos, A.C. A quantitative review of the effects of biochar application to soils on crop productivity using meta-analysis. Agric. Ecosyst. Environ. 2011, 144, 175–187. [Google Scholar] [CrossRef]
  40. Gul, S.; Whalen, J.K. Biochemical cycling of nitrogen and phosphorus in biochar amended soils. Soil Biol. Biochem. 2016, 103, 1–15. [Google Scholar] [CrossRef]
  41. Purakayastha, T.J.; Bera, T.; Bhaduri, D. A review on biochar modulated soil condition improvements and nutrient dynamics concerning crop yields: Pathways to climate change mitigation and global food security. Chemosphere 2019, 227, 345–365. [Google Scholar] [CrossRef] [PubMed]
  42. Raboin, L.M.; Razafmahafaly, A.H.D.; Rabenjarisoa, M.B. Improving the fertility of tropical acid soils: Liming versus biochar application? A long-term comparison in the highlands of Madagascar. Field Crops Res. 2016, 199, 99–108. [Google Scholar]
  43. Yuan, J.H.; Xu, R.K.; Qian, W.; Wang, R.H. Comparison of the ameliorating effects on an acidic ultisol between four crop straws and their biochars. J. Soils Sediments 2011, 11, 741–750. [Google Scholar] [CrossRef]
  44. Ding, Y.; Liu, Y.; Liu, S.; Li, Z.; Tan, X.; Huang, X.; Zeng, G.; Zhou, L.; Zheng, B. Biochar to improve soil fertility. Rev. Agron. Sustain. Dev. 2016, 36, 36. [Google Scholar] [CrossRef] [Green Version]
  45. Kanthle, A.K.; Lenka, N.K.; Lenka, S. Biochar impact on nitrate leaching as influenced by native soil organic carbon in an Inceptisol of central India. Soil Tillage Res. 2016, 157, 65–72. [Google Scholar] [CrossRef]
  46. Xu, N.; Tan, G.; Wang, H. Effect of biochar additions to soil on nitrogen leaching, microbial biomass and bacterial community structure. Eur. J. Soil Biol. 2016, 74, 1–8. [Google Scholar] [CrossRef]
  47. Haider, G.; Steffens, D.; Moser, G. Biochar reduced nitrate leaching and improved soil moisture content without yield improvements in a four-year field study. Agric. Ecosyst. Environ. 2017, 237, 80–94. [Google Scholar] [CrossRef]
  48. Marks, A.; Mattana, S.; AlcaIz, J.M.; P’erez-Herrero, M.; Domene, X. Gasifier biochar effects on nutrient availability, organic matter mineralization, and soil fauna activity in a multi-year Mediterranean trial. Agric. Ecosyst. Environ. 2016, 215, 30–39. [Google Scholar] [CrossRef]
  49. Olmo, M.; Villar, R.; Salazar, P.; Alburquerque, J.A. Changes in soil nutrient availability explain biochar’s impact on wheat root development. Plant Soil 2016, 399, 333–343. [Google Scholar] [CrossRef]
  50. Gao, S.; DeLuca, T.H.; Cleveland, C.C. Biochar additions alter phosphorus and nitrogen availability in agricultural ecosystems: A meta-analysis. Sci. Total Environ. 2019, 654, 463–472. [Google Scholar] [CrossRef] [PubMed]
  51. Sarfraz, R.; Yang, W.; Wang, S.; Zhou, B.; Xing, S. Short term effects of biochar with different particle sizes on phosphorous availability and microbial communities. Chemosphere 2020, 256, 126862. [Google Scholar] [CrossRef]
  52. Mclean, E.O. Soil pH and lime requirement. Methods Soil Anal. Part 2 Chem. Microbiol. Prop. 1982, 9, 199–224. [Google Scholar]
  53. Nguyen, B.; Lehmann, J. Black carbon decomposition under varying water regime. Org. Geochem. 2009, 40, 846–853. [Google Scholar] [CrossRef]
  54. Ball, D.F. Loss on Ignition as an estimate of organic matter and organic carbon in non-calcareous soil. J. Soil Sci. 1964, 15, 84–92. [Google Scholar] [CrossRef]
  55. Weatherburn, M.W. Phenol-hypochlorite reaction for determination of ammonia. Anal. Chem. 1967, 39, 971–974. [Google Scholar] [CrossRef]
  56. Lajtha, K.; Schlesinger, W.H. The biogeochemistry of phosphorus cycling and phosphorus availability along a desert soil chronosequence. Ecology 1988, 69, 24–39. [Google Scholar] [CrossRef]
  57. Jing, Y.; Zhang, Y.; Han, I.; Wang, P.; Mei, Q.; Huang, Y. Effects of different straw biochars on soil organic carbon, nitrogen, available phosphorus, and enzyme activity in paddy soil. Sci. Rep. 2020, 10, 8837. [Google Scholar] [CrossRef] [PubMed]
  58. Xiu, L.; Zhang, W.; Sun, Y. Effects of biochar and straw returning on the key cultivation limitations of Albic soil and soybean growth over 2 years. Catena 2019, 173, 481–493. [Google Scholar] [CrossRef]
  59. Fredeen, A.L.; Rao, I.M.; Terry, N. Influence of phosphorus nutrition on growth and carbon partitioning in Glycine max. Plant Physiol. 1989, 89, 225–230. [Google Scholar] [CrossRef] [Green Version]
  60. Assuero, S.G.; Mollier, A.; Pellerin, S. The decrease in growth of phosphorus-deficient maize leaves is related to a lower cell production. Plant Cell Environ. 2004, 27, 887–895. [Google Scholar] [CrossRef]
  61. Glaser, B.; Lehmann, J.; Zech, W. Ameliorating physical and chemical properties of highly weathered soils in the tropics with charcoal—A review. Biol. Fertil. Soils 2002, 35, 219–230. [Google Scholar] [CrossRef]
  62. Asai, H.; Samson, B.K.; Haefele, S.M.; Songyikhangs, K.; Homma, K.; Kiyono, Y.; Inoue, Y.; Shiraiwa, T.; Horie, T. Biochar amendment techniques for upland rice production in Northern Laos. 1. Soil physical properties, leaf SPAD and grain yield. Field Crops Res. 2009, 111, 81–84. [Google Scholar] [CrossRef]
  63. Major, J.; Rondon, M.; Molina, D.; Riha, S.J.; Lehmann, J. Maize yield and nutrition during 4 years after biochar application to a Colombian savanna oxisol. Plant Soil 2010, 333, 117–128. [Google Scholar] [CrossRef]
  64. Li, F.; Liang, X.; Niyungeko, C. Effects of biochar amendments on soil phosphorus transformation in agricultural soils. Adv. Agron. 2019, 158, 131–172. [Google Scholar]
  65. Ding, Y.; Liu, Y.X.; Wu, W.X.; Shi, D.Z.; Yang, M.; Zhong, Z.K. Evaluation of biochar effects on nitrogen retention and leaching in multi-layered soil columns. Water Air Soil Pollut. 2010, 213, 47–55. [Google Scholar] [CrossRef]
  66. Taghizadeh-Toosi, A.; Clough, T.J.; Sherlock, R.R.; Condron, L.M. Biochar adsorbed ammonia is bioavailable. Plant Soil 2011, 350, 57–69. [Google Scholar] [CrossRef]
  67. Liu, X.H.; Zhang, X.C. Effect of biochar on pH of alkaline soils in the loess plateau: Results from incubation experiments. Int. J. Agric. Biol. 2012, 14, 745–750. [Google Scholar]
  68. Alazzaz, A.; Usman, A.R.A.; Ahmad, M.; Elfaki, J.; Sallam, A.S.; Ibrahim, H.; Akanji, M.A.; Al-Wabel, M.I. Potential short-term negative versus positive effects of olive mill-derived biochar on nutrient availability in a calcareous loamy sand soil. PLoS ONE 2020, 15, e0232811. [Google Scholar] [CrossRef]
  69. Güereña, D.T.; Lehmann, J.; Thies, J.E.; Enders, A.; Karanja, N.; Neufeldt, H. Partitioning the contributions of biochar properties to enhanced biological nitrogen fixation in common bean (Phaseolus vulgaris). Biol. Fertil. Soils 2015, 51, 479–491. [Google Scholar] [CrossRef]
  70. Biederman, L.A.; Harpole, W.S. Biochar and its effects on plant productivity and nutrient cycling: A meta-analysis. GCB Bioenergy 2013, 5, 202–214. [Google Scholar] [CrossRef]
  71. Lehmann, J.; Kuzyakov, Y.; Pan, G.; Ok, Y.S. Biochar and the plant-soil interface. Plant Soil 2015, 395, 1–5. [Google Scholar] [CrossRef]
  72. Bista, P.; Rajan, G.; Stephen, M.; Larry, P. Biochar effects on soil properties and wheat biomass vary with fertility management. Agronomy 2019, 9, 623. [Google Scholar] [CrossRef] [Green Version]
Figure 1. The infrared picture of the tea yard indicates experimental sites for biochar application. The field was divided into weak and normal (CK) sectors according to its tea yield. Six plots were set up in each sector, three with biochar application (B) and three without biochar (N).
Processes 10 00199 g001
Figure 2. The differences between blocks of weak tea growth and normal (CK) in soil characteristics and tea yield are shown in (a). Bars represent the standard error of the mean (n = 6), where the signs of * indicate a significant difference between blocks of weak and CK with the Student’s t-test. The variation in soil pH in blocks of weak and CK is shown in (b).
Processes 10 00199 g002
Figure 3. The responses of tea yield to biochar application from 2019 to 2021 are shown in (a). The treatment of W-B means the sector of weak tea growth (W) with biochar applied (B); CK-N means the sector of normal tea growth (CK) without biochar (N). The biochar effect in (b) is the ratio of the tea yield between biochar applied (B) and without biochar (N), which is calculated by B/N. Bars represent the standard error of the mean (n = 3), where different letters indicate a significant difference between sectors of weak and CK by the multiple comparisons of the LSD test. The * symbols indicate a significant difference between the value of the biochar effect and 1.0 with the multiple comparisons of the LSD test.
Processes 10 00199 g003
Figure 4. The effects of biochar on the soil characteristics are displayed on the y-axis; the values represent the ratio of biochar applied and without biochar. The original data of soil characteristics are listed in Table A1. Bars represent the standard error of the mean (n = 3), where the * symbols indicate a significant difference between the value of the biochar effect and 1.0 with the multiple comparisons of the LSD test.
Processes 10 00199 g004aProcesses 10 00199 g004b
Figure 5. The regression analysis on the relationship between tea yield and soil status.
Processes 10 00199 g005aProcesses 10 00199 g005b
Table 1. Biochar characteristics.
Pyrolysis Temperature450 °C600 °C
pH9.110.3
Surface area (m2 g−1)12.18.9
Water content (wt. %)5.67.0
Volatile compound (wt. %)27.719.8
Fixed carbon (wt. %)56.562.1
Ash (wt. %)10.211.1
C (wt. %)71.473.8
H (wt. %)3.21.8
N (wt. %)2.72.5
S (wt. %)0.10.1
O (wt. %)12.411.1
Publisher’s Note: MDPI stays neutral with regard to jurisdictional claims in published maps and institutional affiliations.

