Article

Analysis of Ultrasound Signal on Reflection from a Sharp Corner Surface: Study of Selected Characteristics Deriving from Regression by Transfer Function

by
Vladimír Madola
*,
Vladimír Cviklovič
and
Stanislav Paulovič
Institute of Electrical Engineering, Automation, Informatics and Physics, Faculty of Engineering, Slovak University of Agriculture in Nitra, Tr. A. Hlinku 2, SK-949 76 Nitra, Slovakia
*
Author to whom correspondence should be addressed.
Processes 2022, 10(12), 2644; https://doi.org/10.3390/pr10122644
Submission received: 5 November 2022 / Revised: 4 December 2022 / Accepted: 7 December 2022 / Published: 8 December 2022

Abstract

:
This article deals with the regression analysis of the ultrasonic signal amplitude when the character of the reflection surface has been changed from a planar case to a sharp corner case. The experiment was performed at a measurement distance within the interval from 100 mm to 215 mm. A nonlinear correlation between the amplitude of the ultrasound signal and the measured distance was demonstrated. By analyzing the frequency spectra, a poor nonlinear correlation between the maximum frequency component and the distance vector was found for the sharp corner case versus the planar case, which proved similar nonlinear characteristics as the signal amplitude marker. The strong linear correlation in the distance difference vectors in the amplitude analysis of the ultrasound signal confirmed the hypothesis of a direct relationship between the reflection surface geometric characteristic and the polarity of the difference. The ultrasound signal was identified as a 3rd-order dynamic system. The nonlinear correlation of the steady-state values of the modelled transfer functions versus distance likewise shows the characteristic of the polarity difference or character derivative as a quantification marker of the characteristics of the reflection surface from the geometric point of view.

1. Introduction

Ultrasonic waves are commonly used for object distance measurement, distance measurement in robots, navigation of robots, and industrial applications [1]. A typical system for distance measurement using ultrasound includes ultrasonic transducers for generating and sensing ultrasonic pulses, a microcontroller for controlling the measurement system, temperature compensation for the accuracy of the measured distance, and a unit for processing the measured data [2]. The basic distance measurement method is the impulse method. In measurement systems using correlation for distance measurement, the generated ultrasonic signal is compared with the reflected ultrasonic signal from the object. The maximum of the correlation function over time gives a more accurate time indication for distance measurements relative to the impulse method. Compared to the impulse method, the correlation method requires a higher number of iterations of cross-correlations by convolution [3]. The authors report the application of ultrasonic water flow measurement [4]. They note that the use of the correlation method improves the accuracy of flow measurement in turbulent flow media. The authors subjected ultrasonic reflections from steel rods to correlation at specific times to which they were exposed to external heat [5]. The method is used in monitoring temperature characteristics in food production. The measurement of the position of an object can also be obtained by integrating two ultrasonic sensors and identifying the position vector by triangulation. In applying the triangulation method can be used the standard deviation to quantify the deviations between the actual and the measured position vector [6]. The authors used a nonlinear regression method to estimate the shape of the reflection surface between the planar case and the sharp edge [7]. The aim of this study is the frequency analysis of an ultrasonic signal reflected from a sharp corner, representing a simulated edge in space. A patented measurement system was used for performing the experiment. The measurement system used was originally developed for animal position identification as part of the Agriculture 4.0 platform. For the aim of our experiment, the measurement system was used for the acquisition of ultrasound reflections from a metal surface to quantify the characteristics of the reflecting surface. The results are compared with the reflection of the ultrasonic signal from a planar surface with unchanged geometric characteristics of the experiment. Modelling the ultrasound signal in a complex variable is also a partial focus of the article.

2. Materials and Methods

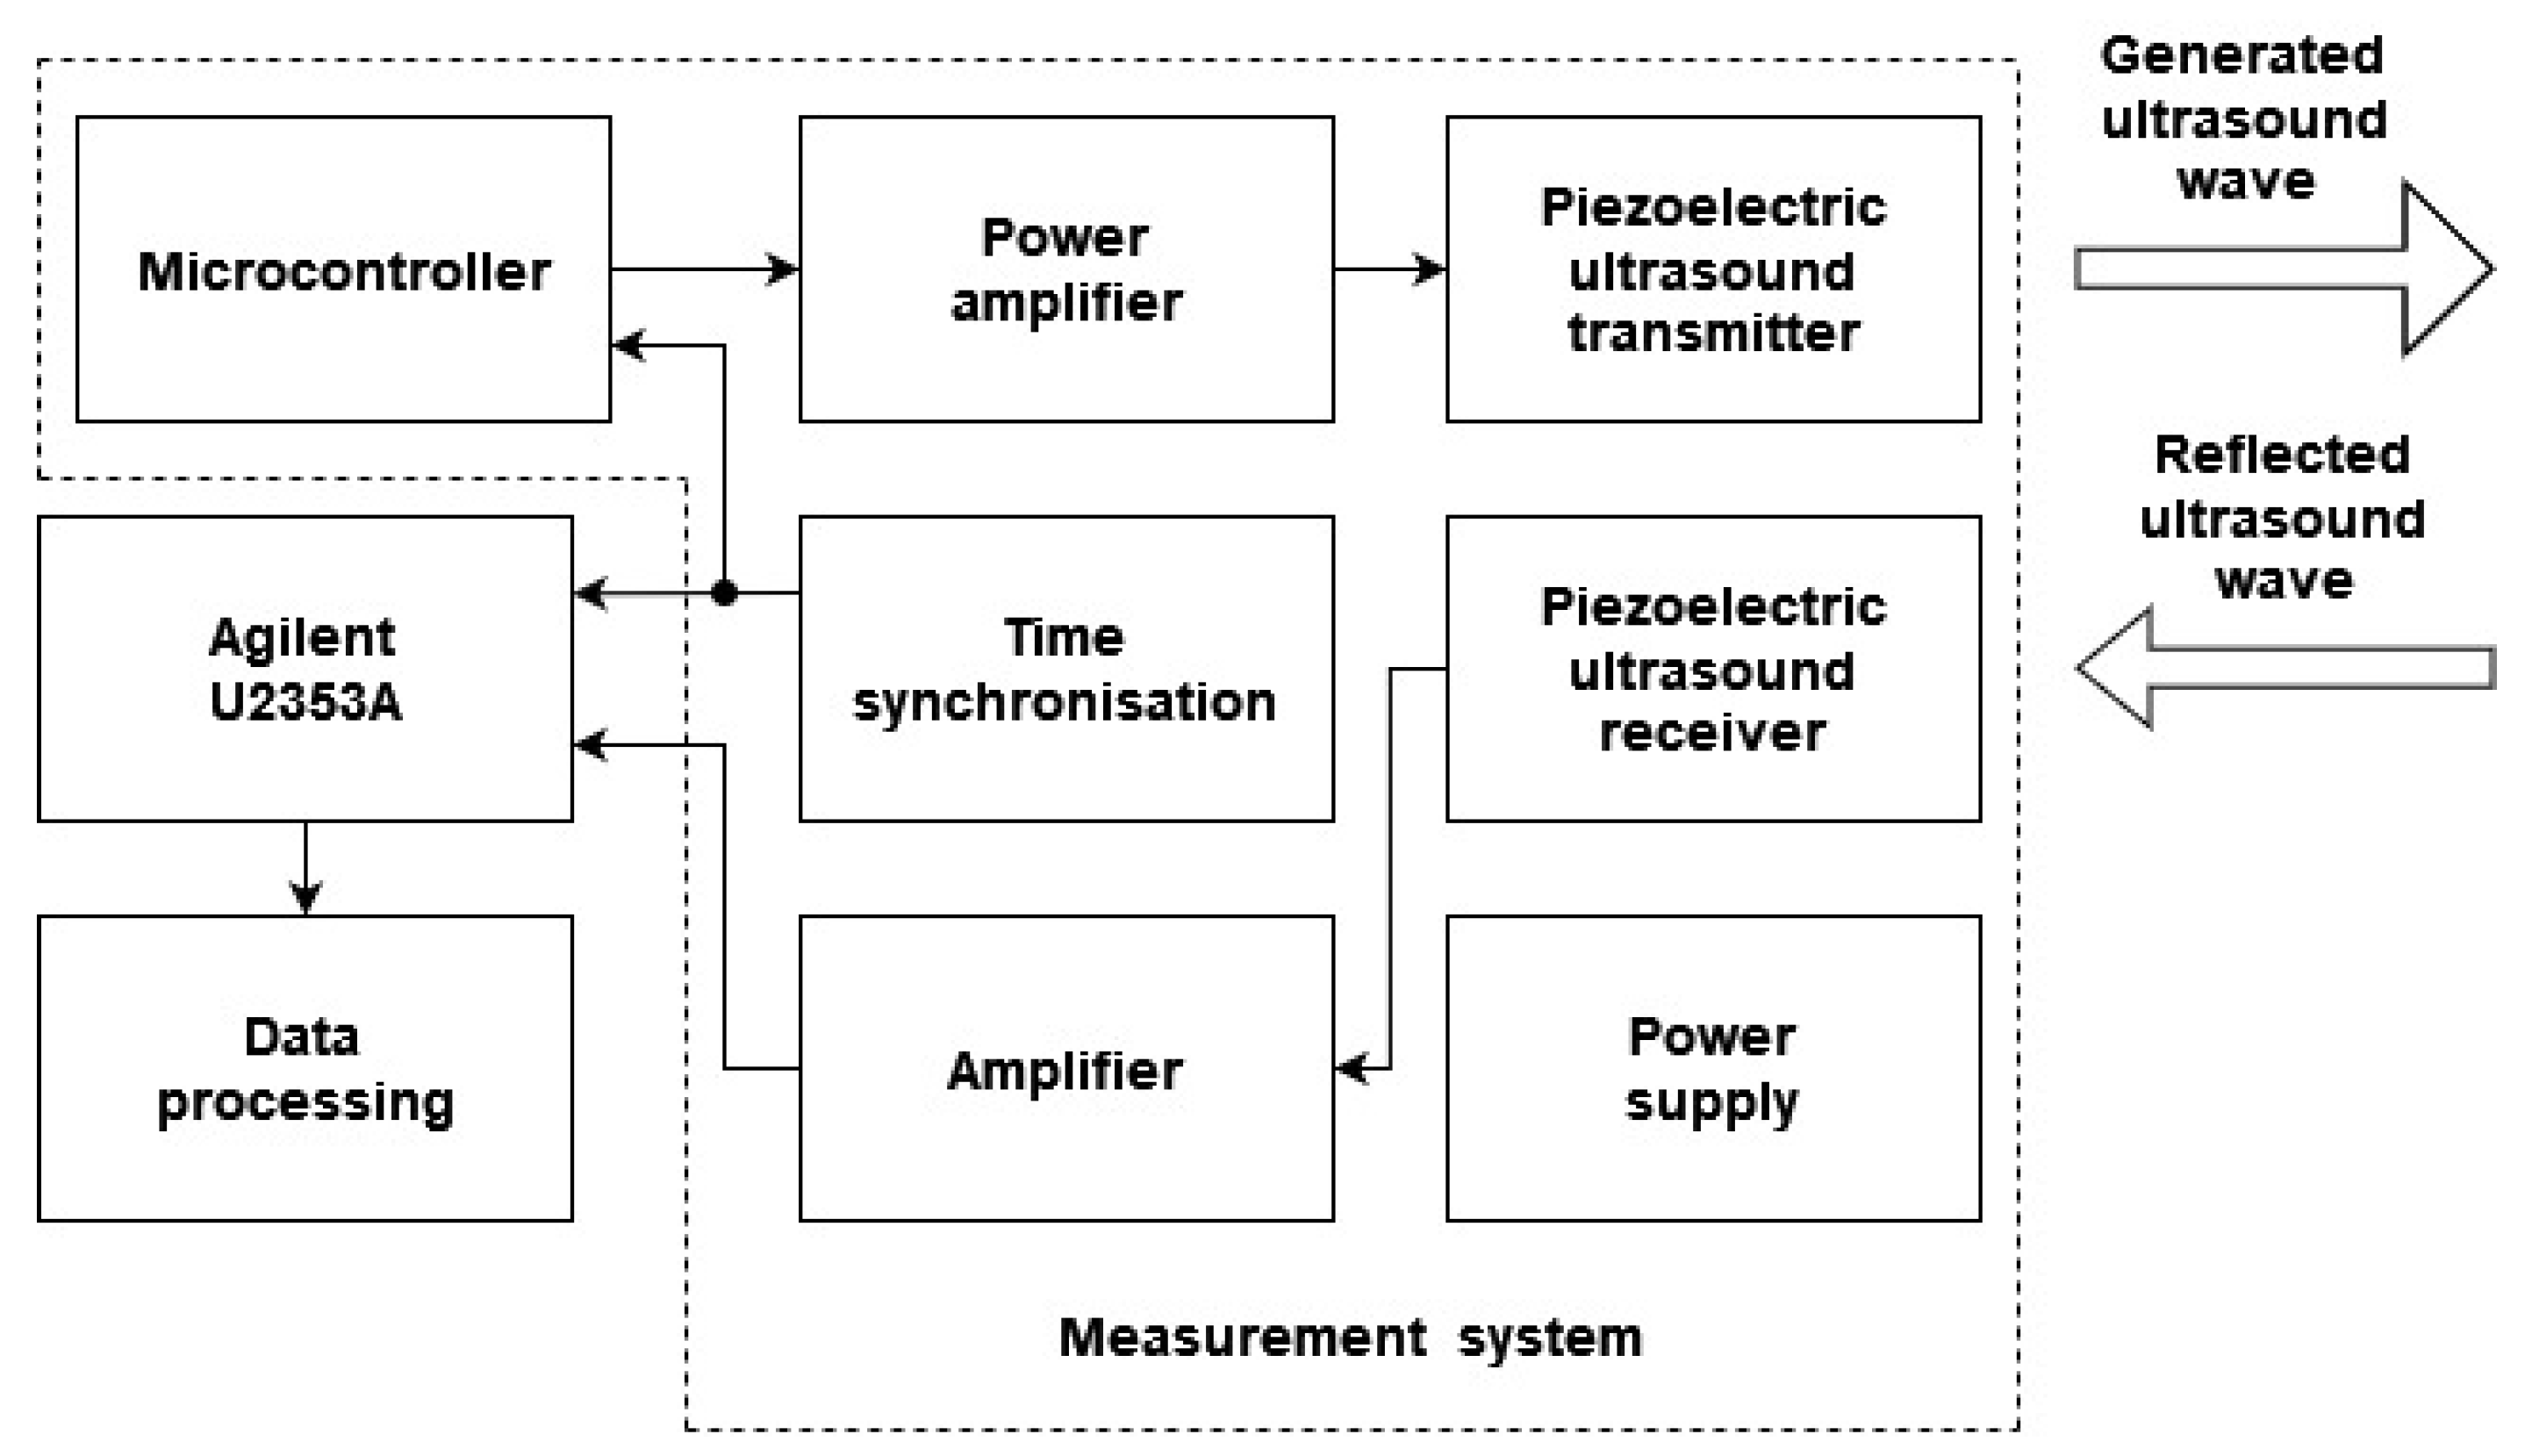
2.1. Measurement System

A patent–protect position identification system was used as the measurement system [8]. The block diagram of the measurement system is shown in Figure 1. A 400ST160 piezoelectric transmitter was used as the source of the ultrasonic impulses. The transmitter had a resonant frequency of 40 kHz ± 1 kHz according to the literature [9]. A 400SR160 piezoelectric sensor was used for ultrasonic reflection sensing. The sensing angle of the used ultrasonic transducer was 27.5° with consideration of Huygens postulate [9]. The input impedance for the ultrasound sensor was set a value of 1 kΩ. The signal has been amplified with gain value of 25.334 dB. One ultrasound transmitter and one ultrasound sensor were used.
For experimental reasons, the electrical signal from the ultrasound sensor was acquired by the Agilent U2353A data logger in a differential mode of the analog inputs [10]. The sampling frequency was set to 200 kHz. Agilent Measurement Manager software ver. 1.2 was used to acquire the measured signals. The ultrasound waves were generated at 1 s intervals. The acquisition of the ultrasound signal was synchronized by a microcontroller with a delay of 1 microsecond. The firmware of the microcontroller unit was developed on Keil ver. 5 licensed Integrated Development Environment [11].

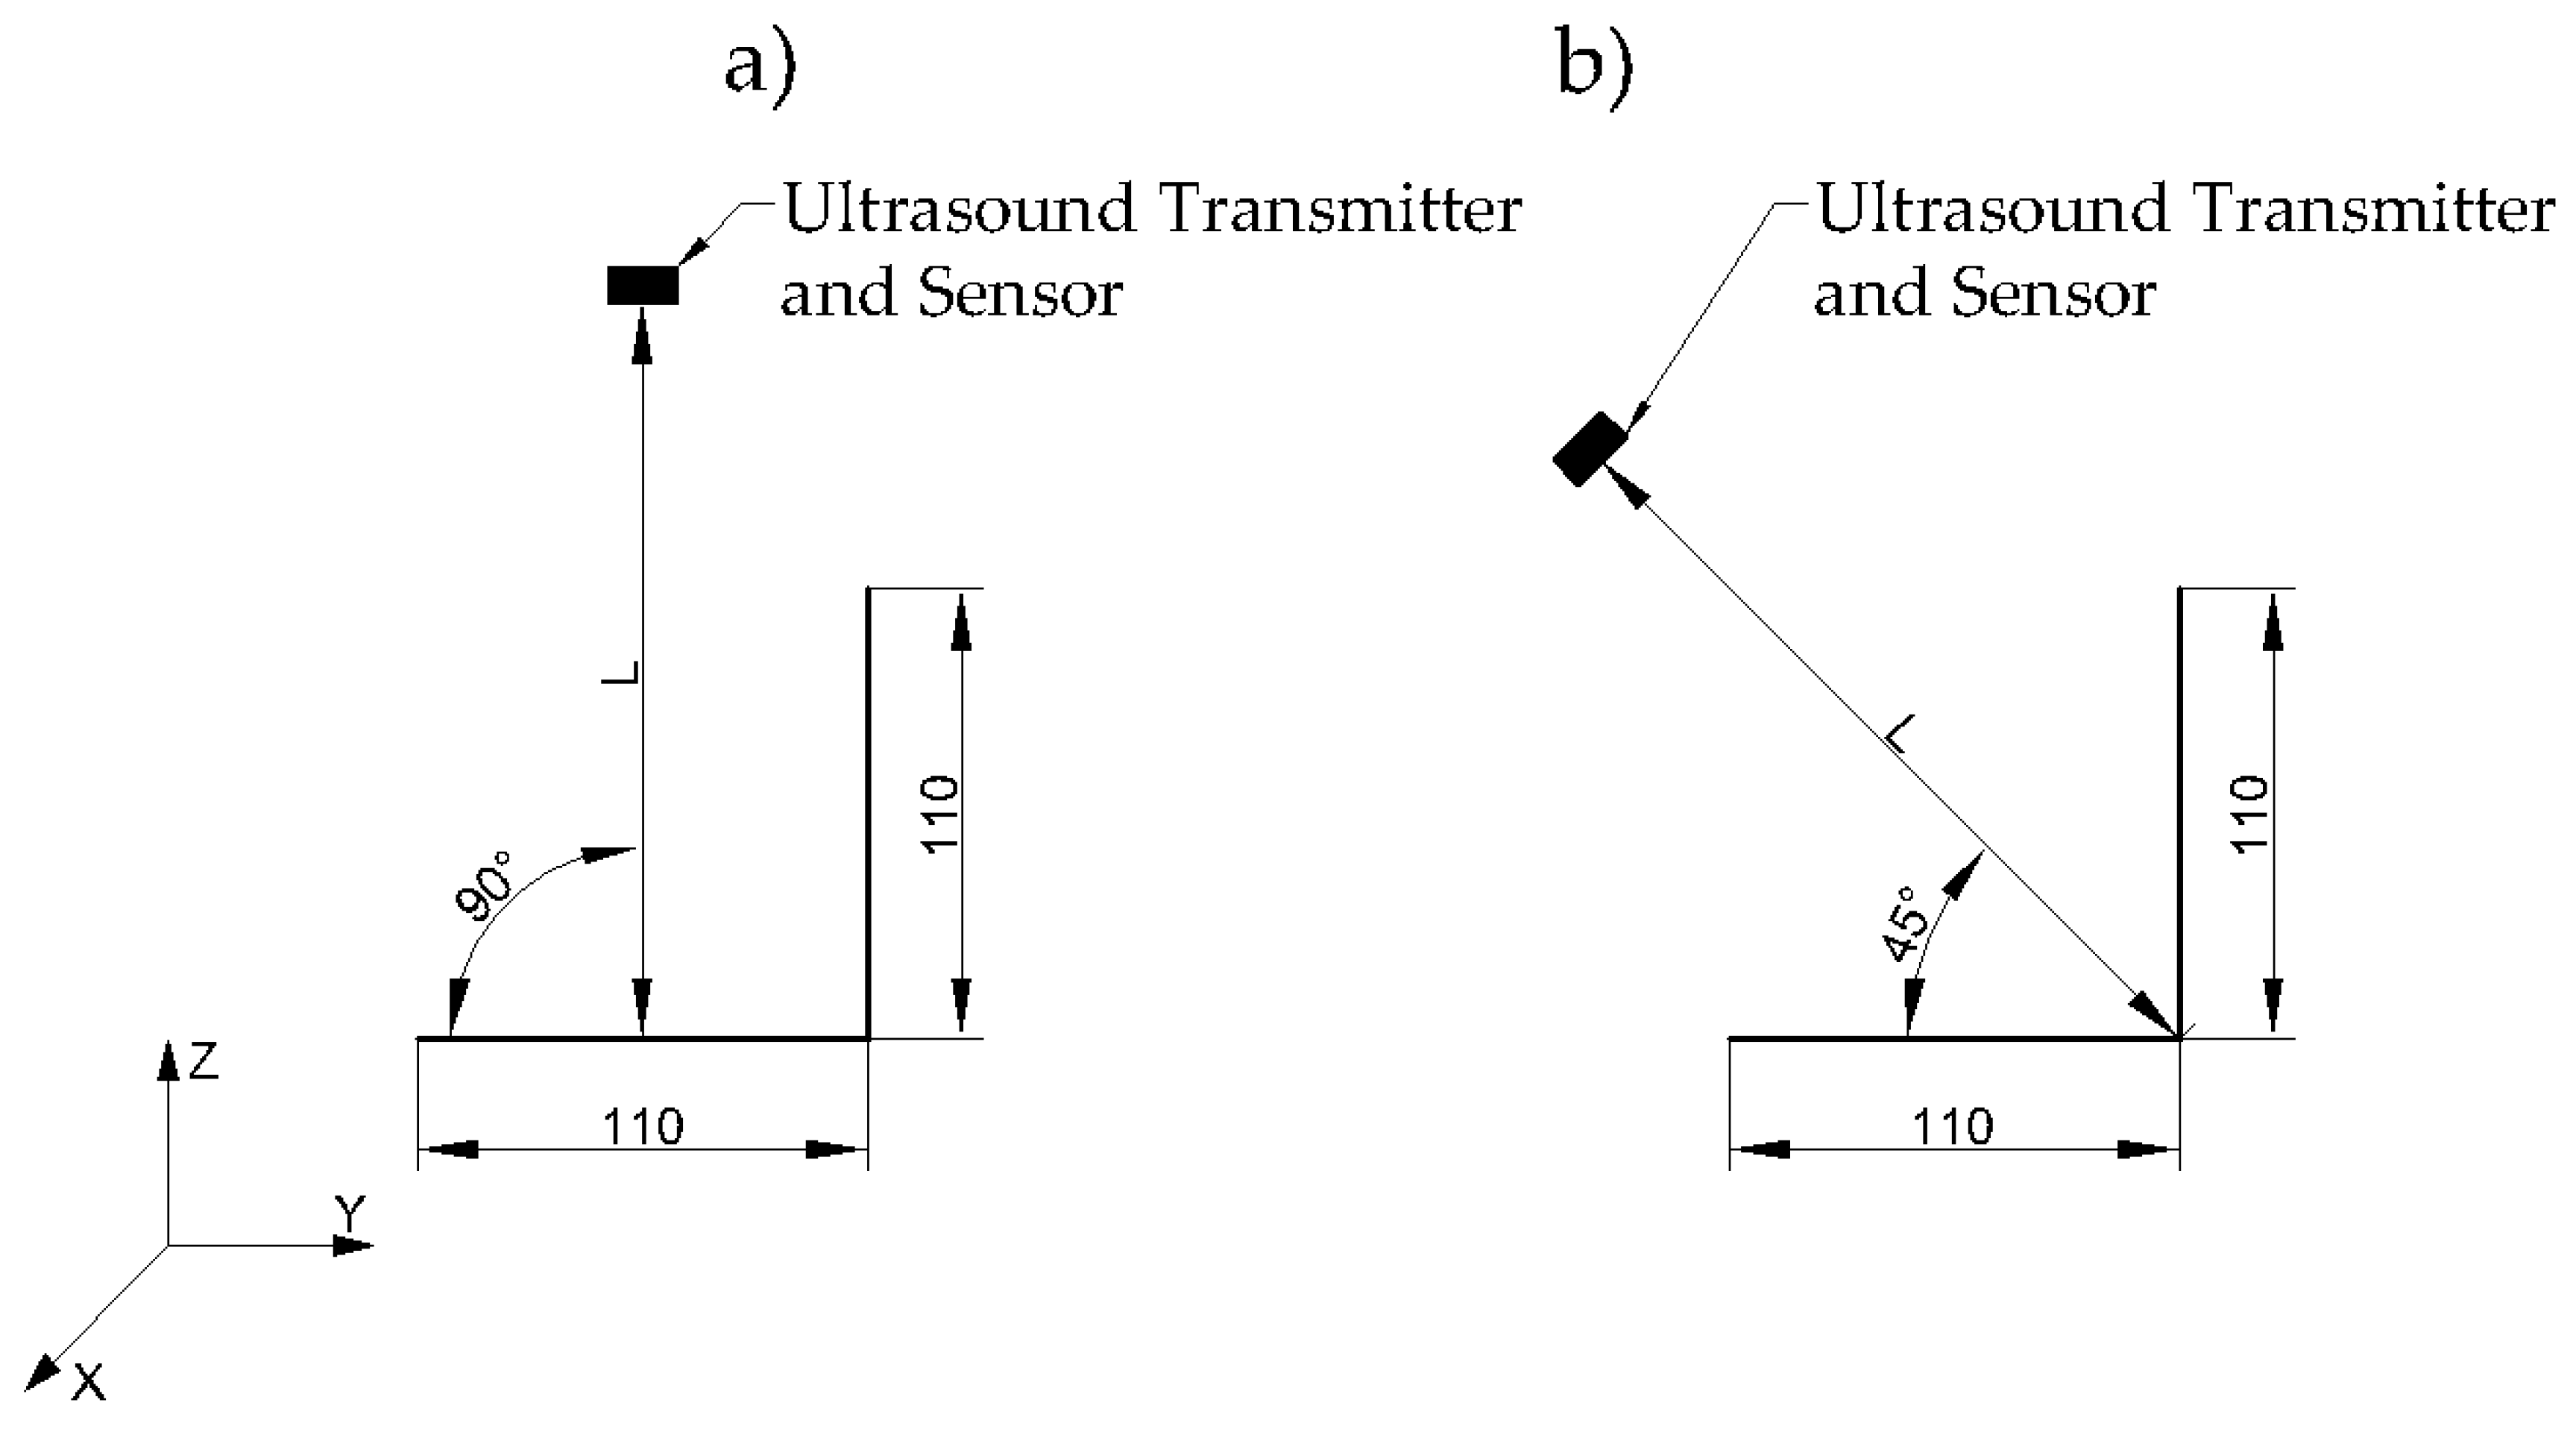
2.2. Conditions of Experiment

As a reflective surface, we used a metal surface with a thickness of 1.5 mm. Two surfaces perpendicular to each other formed a sharp corner and had dimensions of 230 mm (length, X-axis) by 110 mm (height, Z–axis). The reflective surface was exposed to ultrasonic impulses in the planar case (Figure 2, mark a) and in the corner case (Figure 2, mark b). During the experiment, we changed the distance between the transmitter and the reflecting surface in selected steps within the interval from 100 mm to 215 mm. In the corner case, a maximum distance of 215 mm was chosen as the maximum distance for the maximum possible acquisition of reflections from the surface with respect to its geometrical dimensions. The ultrasound transducer and sensor were situated at the geometric midpoint in the X-axis direction (Figure 2).

2.3. Data Processing and Used Software

For statistical processing of the observed data, the STATISTICA 10 software was used. The results are expressed as the arithmetic mean ± standard deviation. Statistically significant differences (p ≤ α) were obtained by Sidak’s test at a significance level of α = 0.05. The goodness of fit with a normal probability distribution of the measured data was verified by the Shapiro–Wilk test at a significance level of α = 0.05. The data meet the normal probability distribution when the condition (p > α) is satisfied. The experimental measurement was performed four times at a given distance. A frequency analysis of the measured data from the ultrasound sensor was performed by Discrete Fourier Transform. The modelling in the complex variable was performed in MATLAB R2015b software. The maximum frequency component was chosen as the quantifier of the frequency analysis result. We determined the correlation between the selected parameters by Pearson’s correlation coefficient r. The agreement of the modelled transfer functions with the experimental data is expressed by the coefficient of determination R2. The change of the signal in a logarithmic way is expressed as a logarithmic gain. The steady-state value of the transfer function is calculated according to the general relationship (Equation (1)):
y ( ) = lim s   0 [ G ( s ) ]
where: y(∞)–steady-state value of transfer function (-) and G(s)–transfer function of complex variable and s–complex variable.
The transfer function is expressed in a universal form by using poles and zeros, respectively (Equation (2)):
G ( s ) = m ( s s z m ) n ( s s p n )
where: G(s)—transfer function of complex variable, s—complex variable, sz—zero of transfer function (-), sp—pole of transfer function (-), m—order of transfer function numerator (-), and n—order of transfer function denominator (-), which represent the order of the dynamic system.
A dynamic system is stable if its poles have a negative real component of pole expression as a complex number. The zeros of the transfer function represent the character of the input vector of the dynamic system [12]. The complex poles and zeros indicate the oscillating characteristics of the dynamic system in expression as a linear differential equation with constant coefficients with a non-homogeneous solution. The phase shift between the input and output vectors is the expression of the poles and zeros of the transfer function in the number representation in the complex plane. The modelling of a complex variable is performed from a continuous ultrasonic impulse signal at the fixed sampling rate (200 kHz).

3. Results and Discussion

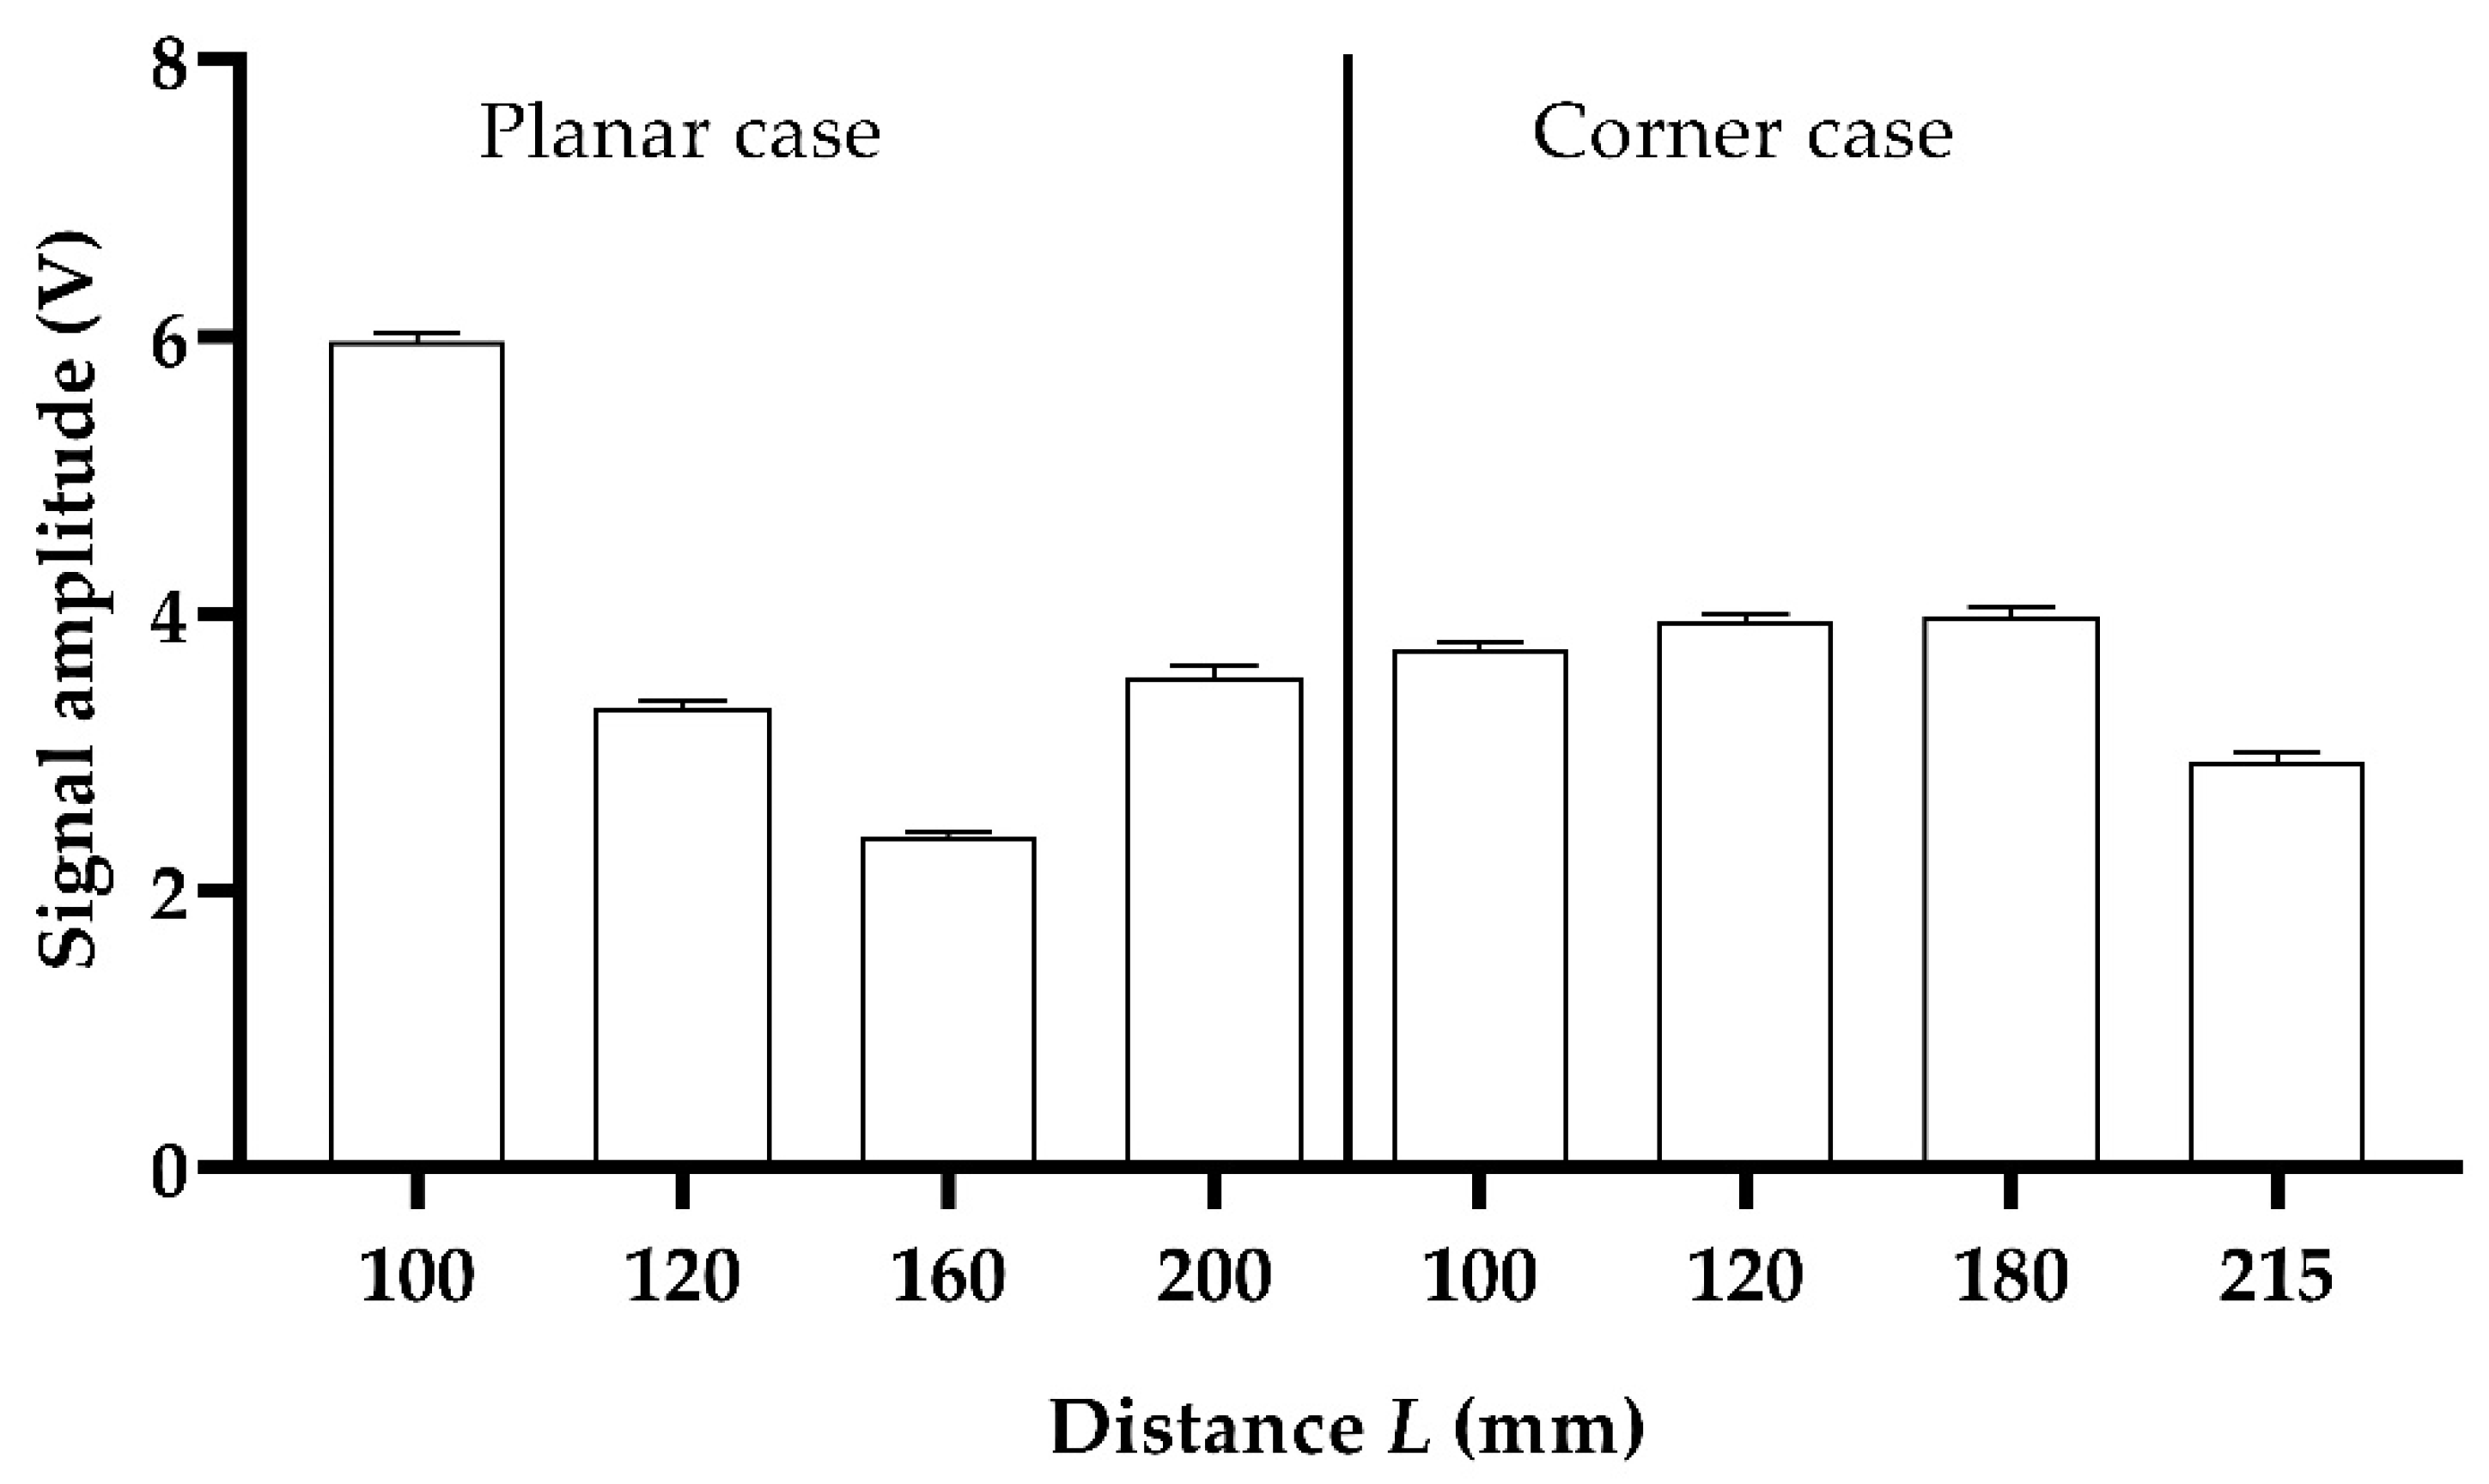
3.1. Analysis of Ultrasound Signal Amplitudes

The statistical treatment of the average signal amplitudes for the planar and corner cases is presented in Figure 3. The statistical sets of amplitudes fit the normal probability distribution (p > 0.05) in all cases. The variance coefficient ranged from 0.97% to 2.24% in the planar case. In the corner case, the variance coefficient ranged from 1.34% to 2.39%. The statistical evaluation of the signal amplitudes is illustrated in the Figure 3. The correlation between the signal amplitude and measured distance presented a medium nonlinear relationship with a correlation coefficient of r = −0.595 in the planar case. In the corner case, the correlation between the signal amplitude and measured distance also showed a medium nonlinear relationship with a correlation coefficient of r = −0.640. Statistically significant differences between the measured distances in the sorted sequence showed statistically significant differences (p ≤ 0.01) for all measured distances in both the planar and corner cases except for the vector pair L = (120 vs. 180) mm. The evaluation of the statistically significant differences between similar distance vectors for the planar case versus the corner case (100 mm vs. 100 mm; 120 mm vs. 120 mm; 160 mm vs. 180 mm; and 200 mm vs. 215 mm) indicated a statistically significant difference in each pair (p ≤ 0.01). From the perspective of the ultrasound signal amplitude itself, defining the characteristic shape of the reflecting surface agrees with the principle of the model [7] where the authors approximated the problem by a correction coefficient in an exponential regression. However, it was necessary to know the reflective characteristics of the surface in the environment.
For the evaluation of the signal amplitude differences, we took the maximum distances as a reference value (initial condition as 0 dB). We defined this postulate on the principle of decreasing measurement distances for deciding the nature of the reflecting surface. The differences are presented in Table 1.
Decreasing the measured distance causes a stepwise decrease in the amplitude of −32.756% in the planar case with a progressive increase of 68.481% compared to the highest distance. In the corner case, there is a stepwise increase in amplitude of 36.551% with a progressive decrease to a value of 28.117%. The correlation of the ultrasound signal amplitudes at the measured distances for variations of the distance vector from the highest (L = 100; 120; 160 mm) showed a strong nonlinear correlation with a correlation coefficient of r = −0.897. In the corner case, the correlation of ultrasound signal amplitudes for distance variations (L = 100; 120; 180 mm) showed a mid-strong linear correlation with a correlation coefficient of r = 0.795.

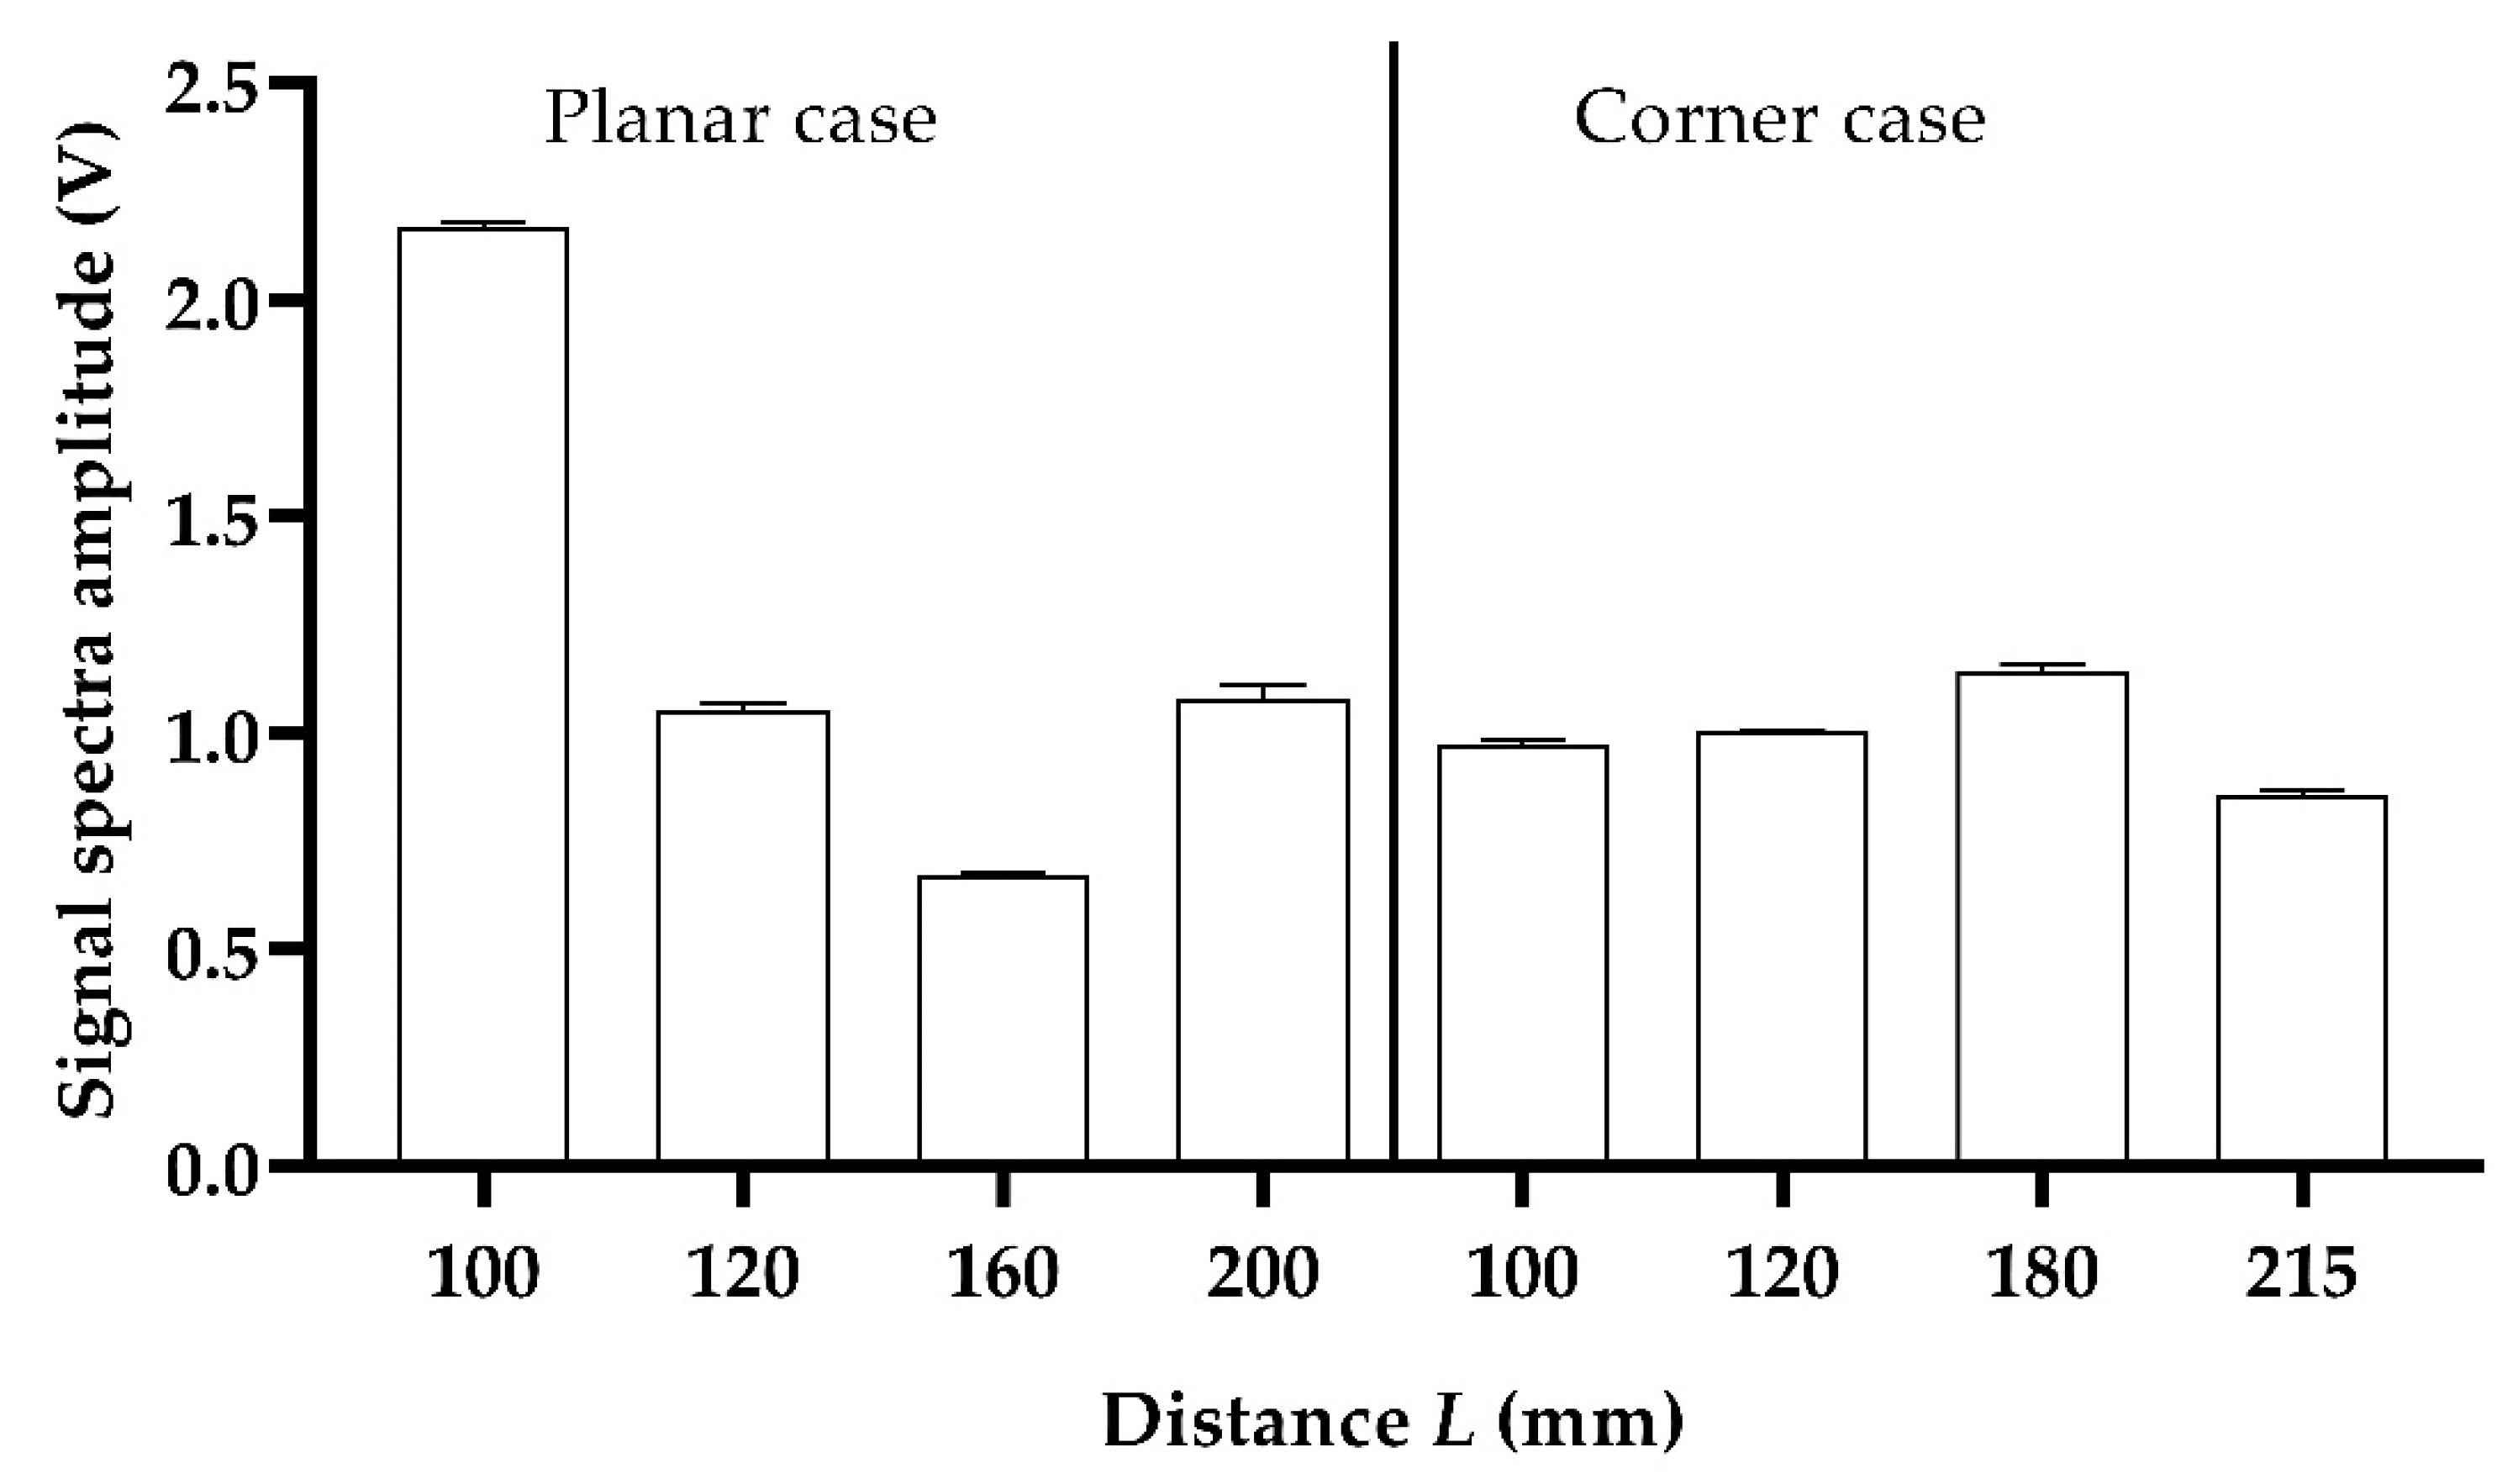
3.2. Analysis of Ultrasound Signal Frequency Spectra

Analysis of the frequency spectra of the ultrasound signal was applied to identify the maximum components of the frequency spectra. The interval of the frequency maxima component was from 40.039 kHz to 40.625 kHz for the planar and corner cases. The maximum spectral component data were consistent with a normal probability distribution (p > 0.05). The variance coefficient varied from 0.46% to 2.75% in the planar case. In the corner case, the variance coefficient varied in the interval from 0.41% to 1.52%. The correlation between the average values of the maximum component of the spectral decomposition and the distance vector shows a medium nonlinear relationship with a correlation coefficient of r = −0.635 for the planar case and a poor nonlinear relationship with a correlation coefficient of r = −0.195 for the corner case. A statistically significant difference between similar distance vectors was demonstrated in each pair for the planar case versus the corner case (100 mm vs. 100 mm; 120 mm vs. 120 mm; 160 mm vs. 180 mm; and 200 mm vs. 215 mm).
For the evaluation of the differences of the signal spectrum components, the same criteria as for the amplitude analysis were applied. The differences are presented in Table 2.
As the measured distance decreases, the maximum component of the frequency spectra in the planar case decreases in a stepwise way with a progressive increase up to 100.78% according to the highest distance. In the corner case, as the measured distance is progressively decreased, there is a progressive decrease in the signal spectra difference from a value of 32.93% to a value of 13.26%. The statistical evaluation of the signal spectra amplitudes is illustrated in the Figure 4. The correlation of the signal spectra difference at the variation of the distance (L = 100; 120; 160 mm) at the maximum of the spectral decomposition showed a strong nonlinear correlation with a correlation coefficient of r = −0.893. In the corner case, the correlation of the signal spectra difference at distance variations (L = 100; 120; 180 mm) at the maximum of the spectral decomposition showed a strong linear correlation with a correlation coefficient of r = 0.998.

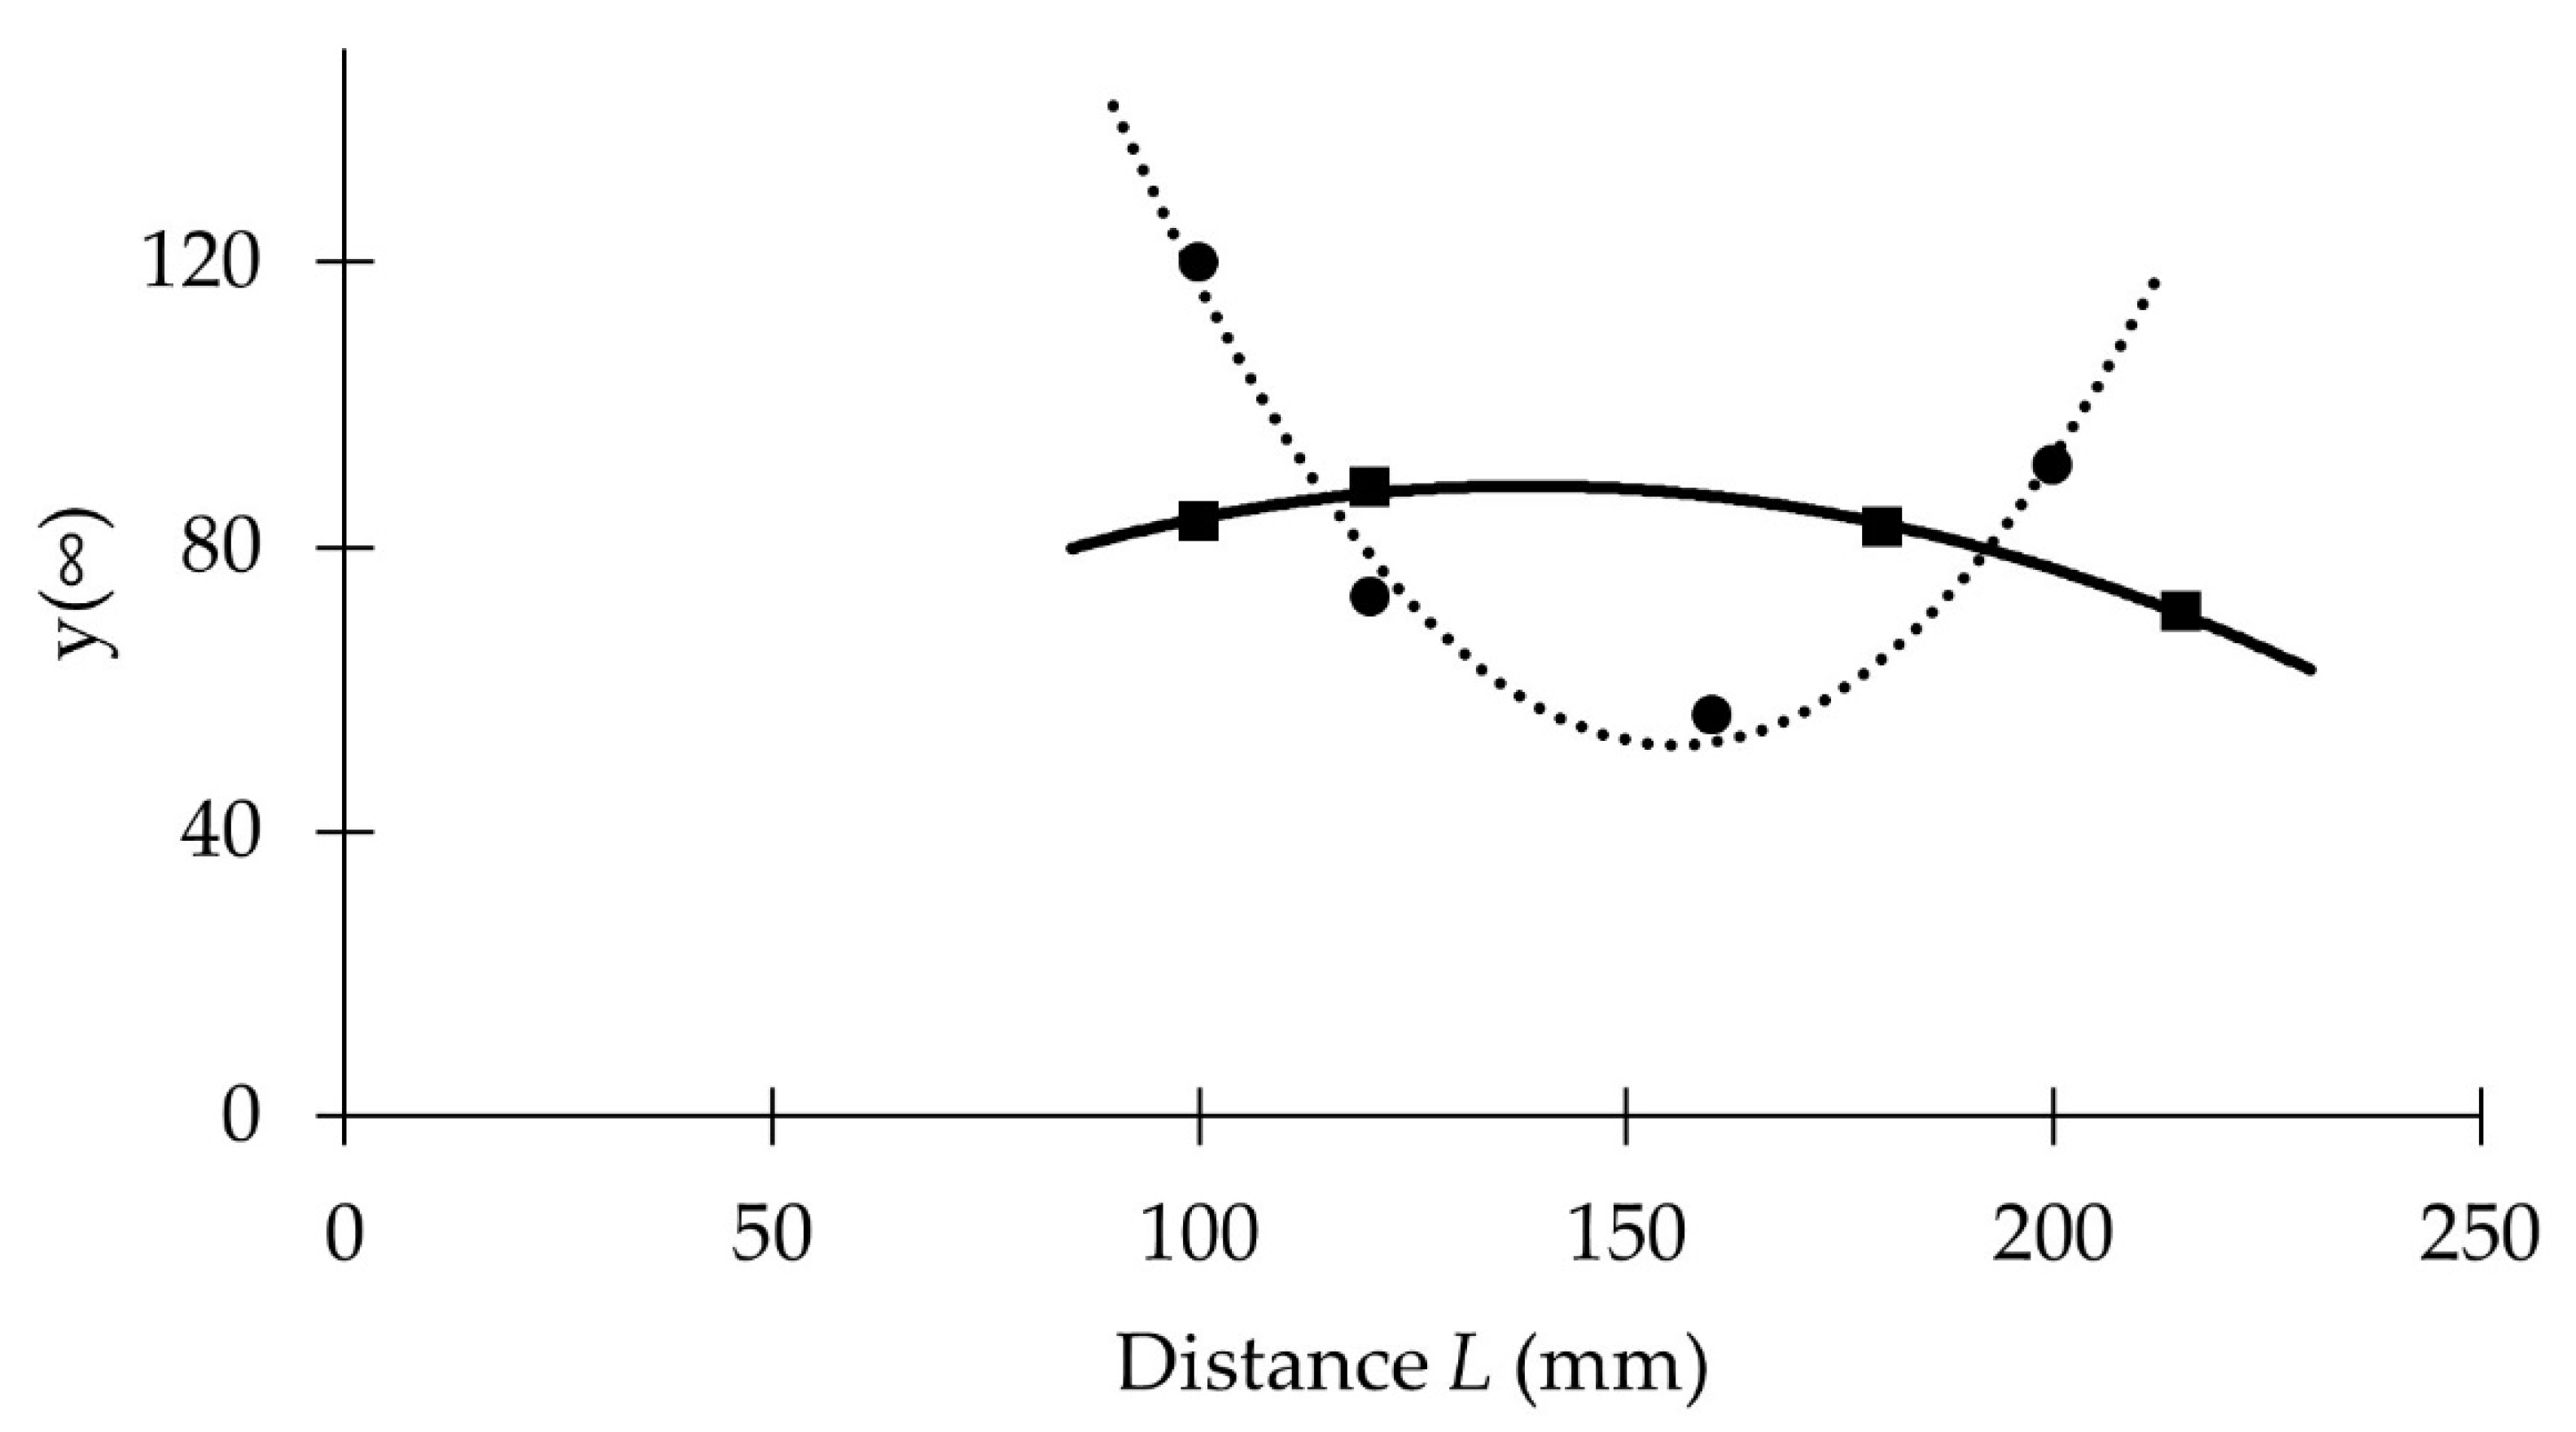
3.3. Analysis of Ultrasound Signal by Modelling on Complex Variable

The analysis was performed from continuous ultrasound signals at an unchanged sampling rate (200 kHz). We obtained a 3rd-order transfer function by modelling the ultrasonic impulses in a complex variable. The poles and zeros of modelled transfer functions are presented in Table 3. The existence of two zeros represents the physicality of the time derivative as well as the consideration of possible inflexibility, representing the noise in the dynamic system. A dynamic system is considered stable when its poles are negative real or complex with a negative real part. Zeros with positive real or complex with a positive real part are characteristic of non-minimum phase systems. This is a fundamental condition for the physical realization of the experiment, which the model describes. The existence of at least one zero in the transfer function gives support to the existence of a time derivative as the frequency of the ultrasonic signal. The two complex conjugate zeros express the physicality of the model because, when the ultrasonic impulse is applied, the ultrasonic echo is produced and terminated relatively quickly. The difference between the critical frequency from the complex conjugate zeros in the planar case versus the corner case is decreased by approximately 28.98%. The difference in the critical frequency is consistent with the increase in the rise time of the transient characteristic by 25.40% in the corner case versus the planar case (the absolute deviation is 3.58%). The positive complex-associated zeros of the transfer functions express the phase shift concerning the poles of the transfer functions because the poles express the physical characteristic of the output vector of the dynamic system (ultrasonic reflection) in time, and the zeros express the physical characteristic of an input vector of the dynamic system (generated ultrasonic signal) in time. We interpret this as a nonlinear shape of the ultrasonic impulse in time, which is confirmed by a 3rd-order (cubic) dynamic system together with a regression analysis of the steady-state values by a 2nd-degree polynomial. The coefficient of determination was in the interval from 74.54% to 85.86% for the planar case and in the interval from 74.48% to 86.12% for the corner case.
Comparing the rise time of the transfer functions, we observed an increase in the corner case of 25.40% with respect to the planar case, which is similar to the results of [7] in the multiple-reflection interpretation. In our case, we primarily analyzed the first group of the reflected signal. Statistically significant differences between the amplitude of the transfer function and the amplitudes of the ultrasound signals were observed in the planar case (p ≤ 0.05). Statistically insignificant differences between the transfer function amplitude and the amplitudes of the ultrasound signals were found in the corner case (p > 0.05). We obtained similar differences for the distance measurements compared to [13] when interpreting the ultrasound signal as a voltage level using the Hilbert transform.
The authors [14] used the triangulation method to identify the corner reflective surface. In our analysis of steady-state values, we demonstrated an inverse proportionality between the description by a polynomial of 2nd-degree as a global minimum in the corner case and a global maximum in the analysis of steady-state values of transfer functions.
By correlation analysis of the steady-state values of the modelled transfer functions, we identified a weak nonlinear correlation in the planar case with a correlation coefficient of r = −0.371. In the corner case, we identified a strong nonlinear correlation with a correlation coefficient of r = −0.810. We identified nonlinear functional dependencies between the steady-state value of the transfer function and the measured distance by a 2nd-degree polynomial with the fitting criterion of the experimental and model-derived data by polynomial expression of the transfer function. A graphical representation of the nonlinear regression is represented in Figure 5.
y ( ) = 0.0207 × L 2 6.464 × L + 555.763
y ( ) = 0.00308 × L 2 + 0.853 × L + 29.525
where: y(∞)—steady-state value of transfer function (-) and L—measured distance vector (mm).
The regression in the planar case is described by a polynomial (Equation (3)) with a coefficient of determination R2 = 97.36%. The regression in the corner case is described by a polynomial (Equation (4)) with the coefficient of determination R2 = 99.17%. The hypothesis of the physicality of the regression is supported by the cross sections of both regression functions for the distance interval from 75.6 mm to 148.8 mm, which is confirmed by the geometrical conditions of the performed experiment approximately from the statistical point of view. The characteristics of the reflection surface shape are possible in the interpretation of the global extrema of the regression function.

4. Conclusions

We demonstrated by correlation analysis the medium nonlinear relationship of the ultrasound signal amplitude to the reflective surface characteristics when changing from a planar surface to a sharp edge. The correlation analysis of the frequency spectra in the maximum component indicated a medium nonlinear correlation as a function of distance for the planar case and a poor nonlinear correlation in the corner case. Decreasing the distance vector caused a strong nonlinear correlation of the signal amplitude in the difference vectors versus the maximum distance in the planar case. In contrast, for the corner case, these amplitudes showed a linear relationship.
The difference polarity is a property that exhibits positive polarity for the corner case with a linear decrease with decreasing distance. The identification of ultrasonic impulses as a 3rd-order dynamic system with the physical expression of the existence of time derivative proves the relation between the regression analysis of the ultrasonic signal amplitude versus distance when the reflection surface characteristic changes in the inverse direction of the global maximum and the functional extrema. At the same time, a significant difference in the analysis of the transfer function response was found in the direction of an increase in the rise time of the transient response by approximately 25% for the corner case versus the planar case. This postulate is fully supported by articles [1,6,7,13,14,15].
The contribution of our article is in defining the descriptiveness of the polarity of the ultrasound signal difference when the characteristic of the reflective surface is changed as a medium or strong linear marker of the reflective surface character, while at the same time a strong nonlinear characteristic of the signal amplitude versus distance is observed. The nonlinear characteristic of the steady-state values of the transfer functions as a function of distance also expresses, in polynomial regression, the existence of differential discrimination in the global maximum on the reflection-surface characteristics from the planar case to the corner case. The results of our experiment can be implemented in obstacle identification by ultrasound as a periphery of a mobile robot. For higher measured distances, the Huygens principle must be used as in our experiment.

Author Contributions

Conceptualization, V.M. and V.C.; methodology, V.M. and V.C.; software, V.M. and V.C.; validation, V.M. and S.P.; formal analysis, V.C. and S.P.; resources, V.C.; data curation, V.M.; writing—original draft preparation, V.M.; writing—review and editing, V.C. and S.P.; supervision, V.C.; project administration, V.C. and S.P. All authors have read and agreed to the published version of the manuscript.

Funding

This contribution was realized with the support of the project of Ministry of Education, Science, Research and Sport of the Slovak Republic: KEGA 006SPU-4/2021 Implementation of technology of Industry 4.0 in education process in study program “Control Systems in Production Engineering”.

Conflicts of Interest

The authors declare no conflict of interest.

References

  1. Naba, A.; Khoironi, M.F.; Santjojo, D.D.H. Low cost but accurate ultra-sonic distance measurement using combined method of threshold-correlation. In Proceedings of the International Conference on Quality in Research, Lombok, Indonesia, 10–13 November 2015; pp. 23–25. [Google Scholar]
  2. Qiu, Z.; Lu, Y.; Qiu, Z. Review of Ultrasonic Ranging Methods and Their Current Challenges. Micromachines 2022, 13, 520. [Google Scholar] [CrossRef] [PubMed]
  3. Hirata, S.; Kurosawa, M.K.; Katagiri, T. Cross-Correlation by Single-Bit Signal Processing for Ultrasonic Distance Measurement. IEICE Trans. Fundam. Electron. Commun. Comput. Sci. 2008, 91, 1031–1037. [Google Scholar] [CrossRef]
  4. Vogt, M.; Gevers, M.; Musch, T. Evaluation of transducer configurations for ultrasound cross-correlation flow meters. In Proceedings of the IEEE International Instrumentation and Measurement Technology Conference Proceedings, Montevideo, Uruguay, 12–15 May 2014; pp. 40–44. [Google Scholar]
  5. Blasina, F.; Perez, N.; Budelli, E.; Lema, P.; Kiri Ing, R.; Negreira, C. Development of a multiple-scattering acoustic sensor for process monitoring: Application to monitoring milk coagulation. In Proceedings of the IEEE International Instrumentation and Measurement Technology Conference, Turin, Italy, 22–25 May 2017; pp. 1–5. [Google Scholar]
  6. Moreira, T.; Lima, J.; Costa, P.; Cunha, M. Low-Cost Sonar based on the Echolocation. In Proceedings of the 16th International Conference on Informatics in Control, Automation and Robotics, Prague, Czech Republic, 29–31 July 2019; pp. 818–825. [Google Scholar]
  7. Martínez, M.; Benet, G.; Blanes, F.; Simó, J.; Pérez, P.; Poza, J. Wall/corner classification. In A new ultrasonic amplitude-based approach. Proceedings of the IFAC Proceedings Volumes, Lisbon, Portugal, 5–7 July 2004; pp. 663–668. [Google Scholar]
  8. Lendelová, J.; Cviklovič, V.; Olejár, M.; Pogran, Š. Animal Position Identification Logging System. SK Patent No. 288467, 2 June 2017. [Google Scholar]
  9. Pro-Wave. Air Ultrasonic Ceramic Transducers: 400ST/R160; © 2005 Pro-Wave Electronic Corp.: New Taipei City, Taiwan, 2005. [Google Scholar]
  10. Keysight. Keysight U2300A Series USB Multifunction Data Acquisition Devices; © 2021 Keysight Technologies: Santa Rosa, CA, USA, 2021. [Google Scholar]
  11. Arm Keil. C51; © 2019 Arm Limited.: Cambridge, UK, 2019.
  12. Isermann, R.; Münchhof, M. Identification of Dynamic Systems, 1st ed.; Springer: Berlin, Germany, 2011; p. 705. [Google Scholar]
  13. Moreira, T.; Lima, J.; Costa, P.; Cunha, M. Low-Cost Binaural System Based on the Echolocation. In Proceedings of the Advances in Intelligent Systems and Computing, Porto, Portugal, 20–22 November 2019; pp. 60–71. [Google Scholar]
  14. Chen, B.C.; Chou, J. A corner differentiation algorithm by a single sonar sensor for mobile robots. Asian J. Control. 2008, 10, 430–438. [Google Scholar] [CrossRef]
  15. Yata, T.; Ohya, A.; Yuta, S. Use of amplitude of echo for environment recognition by mobile robots. In Proceedings of the 2000 IEEE/RSJ International Conference on Intelligent Robots and Systems, Takamatsu, Japan, 31 October 2000–5 November 2000; pp. 1298–1303. [Google Scholar]
Figure 1. Diagram of the measurement system.
Processes 10 02644 g001
Figure 2. Geometric conditions of the performed experiment ((a)–Planar case, (b)–Corner case, L–measured distance vector, all dimensions are in millimeters).
Processes 10 02644 g002
Figure 3. Statistical evaluation of the signal amplitudes from the acquired experimental data.
Processes 10 02644 g003
Figure 4. Statistical evaluation of signal spectra amplitudes from signal frequency decomposition.
Processes 10 02644 g004
Figure 5. Polynomial regression of steady-state transfer function values on measured distance vector (● and dotted line–Planar case; and solid line–Corner case).
Processes 10 02644 g005
Table 1. Difference of signal amplitudes with respect to maximum distance (*—reference value).
Distance L (mm)
Planar Case
Gain (dB)Difference (%)Distance L (mm)
Corner Case
Gain (dB)Difference (%)
1004.53168.4811002.15228.117
120−0.560−6.2401202.61835.171
160−3.447−32.7561802.70636.551
200**215**
Table 2. Difference of signal spectra amplitudes with respect to maximum distance (*—reference value).
Distance L (mm)
Planar Case
Gain (dB)Difference (%)Distance L (mm)
Corner Case
Gain (dB)Difference (%)
1006.0543100.7781001.081713.262
120−0.215−2.4461201.36116.965
160−4.116−37.7431802.47232.927
200**215**
Table 3. Poles and zeros of modelled transfer functions.
ParameterValue
Poles (-)Planar case−1564
−2249 ± i 3721
Corner case−1196
−1395 ± i 3885
Zeros (-)Planar case8943 ± i 8997
Corner case6383 ± i 6368
Publisher’s Note: MDPI stays neutral with regard to jurisdictional claims in published maps and institutional affiliations.

