Article

Impact of Geomagnetic Fields on the Geochemical Evolution of Oil

by
Andrey A. Ponomarev
1,*,
Marat R. Gafurov
2,
Marsel A. Kadyrov
1,
Oscar A. Tugushev
1,*,
Denis A. Drugov
1,
Yuri V. Vaganov
1 and
Mikhail D. Zavatsky
1
1
Department of Oil and Gas Deposits Geology, Tyumen Industrial University, ul. Volodarskogo 38, 625000 Tyumen, Russia
2
Institute of Physics, Kazan Federal University, ul. Kremlyovskaya 16a, 420008 Kazan, Russia
*
Authors to whom correspondence should be addressed.
Processes 2022, 10(11), 2376; https://doi.org/10.3390/pr10112376
Submission received: 9 September 2022 / Revised: 18 October 2022 / Accepted: 9 November 2022 / Published: 12 November 2022

Abstract

:
Here, we reported on experimental studies related to the exposure of oil to a 50 Hz electromagnetic field (0.81 T strength) and examined the changes in the geochemical characteristics of oil: n-alkane distribution, isotopic composition (δ13C), and concentration of paramagnetic centers. We discovered that electromagnetic fields have impacts on the distribution of n-alkanes and on their individual isotopic composition, with the concentration of paramagnetic centers remaining unchanged. While discussing the results, we looked into the state-of-the-art of research on electromagnetic exposures of the bottom-hole formation zone and into natural electric and geomagnetic fields. We consequently hypothesized that natural geomagnetic fields can influence the geochemical evolution processes of oil. This hypothesis requires further studies to reveal the frequency and strength characteristics of natural geomagnetic fields.

1. Introduction

In the 1950s, scholars noted the importance of the geochemical evolution of oil to solving applied geological and exploration problems and improving basic assumptions concerning oil reservoir formation [1,2,3]. Later on, researchers conducted comprehensive studies on the geochemical evolution of petroleum [4,5,6]. Today, there is a huge amount of comprehensive data regarding the transformation and evolution of oil over geologic time. The study [7] contains a great deal of survey materials evidencing that the key environmental factors in petroleum evolution are temperature (thermal transformations), high concentrations of dissolved gas (deasphaltization), migration processes (physical fractionation of specific oil components), bacterial factors (biodegradation), and the others. The scientific views on processes affecting the geochemical evolution of oil have changed very little since then. Many papers focus on specific applied problems by drawing specific correlations between petroleum geochemical characteristics and relatively well-studied geological processes mentioned above. However, there still remain issues regarding how the geochemical evolution of oil is influenced by natural geomagnetic fields.
Some studies do indicate that the geomagnetic field strength and polarity have been discontinuous because of geomagnetic reversals [8,9,10]. Furthermore, it was suggested that 183 geomagnetic reversals have occurred over the past 83 million years [11,12,13,14]. Additionally, the magnitude of the Earth’s magnetic field diminishes from about 65,000 nT to approx. 25,000 nT from the poles to the equator [15]. The paleo-environmental reconstruction of geomagnetic reversals is a high-cost and difficult-to-perform procedure, as it requires research into same-age rock samples from different parts of the globe using a set of specific methods. The most studied geomagnetic reversal is called the Laschamp event [16], which occurred about 40,000 years ago. During the Laschamp excursion, the poles were moving chaotically. The magnetic north crossed the entire planet, crossed the equator twice, and then moved to the Southern Hemisphere and back to North America, where it would stay for the longest period. Therefore, because geomagnetic fields influence the geochemical evolution of petroleum, the greatest impact of the geomagnetic field at the Laschamp excursion time is combined with other geological processes and must have been observed in North America.
The impact of a discontinuous geomagnetic field on petroleum geochemical evolution can simply be exemplified by applying various magnetic and electromagnetic factors to a high-viscosity oil reservoir, which is known as the oil recovery stimulation method [17,18]. Studies show that the stimulation of a high-viscosity oil reservoir triggers changes in the physicochemical properties of oil, including a decline in viscosity [19,20,21]. Clearly, the magnetic field strengths under lab-scale conditions far exceed the corresponding geomagnetic values. However, these are necessary for understanding that the geomagnetic fields have continued their influence for tens of million years, while in the laboratory settings, the stimulation lasts for only a few hours.
Pivovarova et al. [22] examined the impact of magnetic and geomagnetic fields on oil geochemistry. Their work suggests that magnetic, electromagnetic, and acoustic fields and the sunlight affect petroleum rheology. This explains the changes in the magnetic effect generated by singlet–triplet (S–T) or triplet–singlet (T–S) transitions, triggering the chemical polarization of electrons and nuclei. In radical reactions, spin polarization and magnetic effects are two closely related phenomena. In low magnetic fields, both electronic and nuclear polarizations may occur with S−T transitions, within a broad range of radical reactions. In addition, the ambient magnetic field impact intermolecular force and consequently can promote different chemical reactions. The quantum excitation of particles and interparticle formations within the structure of condensed media, followed by the excited state relaxation, are largely mediated by intermolecular force [23]. Therefore, knowledge about the electron–nuclei spin interaction and dynamics of spin systems inherent in oil is viewed as a requisite tool to follow the routes and mechanisms of the ambient impact on oil [24,25,26,27,28].
Buchachenko et al. [29,30,31,32,33] highlighted an important role of paramagnetic centers and magnetic species (nuclei, electrons, atoms, ions, and radicals) in chemical reactions. The stimulation of chemical reactions through magnetic spin change is called spin catalysis. Spin catalysis speeds up chemical reactions in the same manner as the other types of catalysis. Reactions with high activation barriers may have a much lower activation energy. The spin catalysis effects may vary within a particular reaction. However, tendencies towards an increase in the rate constant and a decrease in activation energy were observed in reactions such as hydrogenation, oxidation, and isomerization. The isotopic compositions of petroleum and bitumoids provide useful information on hydrocarbon evolution and genesis. The isotopic fractionation due to the exposure to a light quantum is exemplified in Figure 1.
Here, T–S is the area where a triplet–singlet spin conversion occurs in a radical pair, while is the light quantum. As shown in Figure 1, the electromagnetic impact on dibenzyl ketone in the presence of isotope 13C causes emerging radicals to assemble back into the original molecule, while the radicals generate two distinct molecules (reaction byproducts) in the presence of isotope 12C. Similar isotopic fractionation reactions with carbon may occur during the geochemical evolution of oil. This is because they come amid radical reactions and also have paramagnetic centers. If the hypothesis is true, magnetic isotopes and stable radicals have a high catalytic potential in the petroleum evolution processes. However, the mechanisms of these phenomena (isotopic fractionation and spin catalysis) in the oil evolution processes are not well-studied. To evaluate the likelihood of chemical reactions (P) and aforesaid magnetic effects, Buchachenko et al. [32] introduced the following function:
P = H , a i , µ n , I , m I , H I , ω , J  
where H is the ambient magnetic field, a i is the hyperfine coupling of unpaired electrons with nuclei, µ n is the nuclear magnetic momentum, I is the spin, m I is the spin projection, H I is the microwave amplitude, ω is the frequency, and J is the exchange coupling between unpaired electrons, which determines the triplet–singlet gap. According to Equation (1), the ambient magnetic field can serve as a stimulating factor for spin catalysis and isotopic fractionation. That influence depends on many parameters whose values must be investigated thoroughly.
The present study aimed to draw the scientific community’s attention to the problem of the geochemical evolution of oil when exposed to geomagnetic fields. The experiment sought to evaluate variations in the geochemistry of oil when exposed to a 50 Hz electromagnetic field. Some results concerning changes in the composition of oil for enhanced oil recovery have been reported elsewhere [34,35,36].

2. Materials and Methods

2.1. Oil Samples and Electromagnetic Treatment

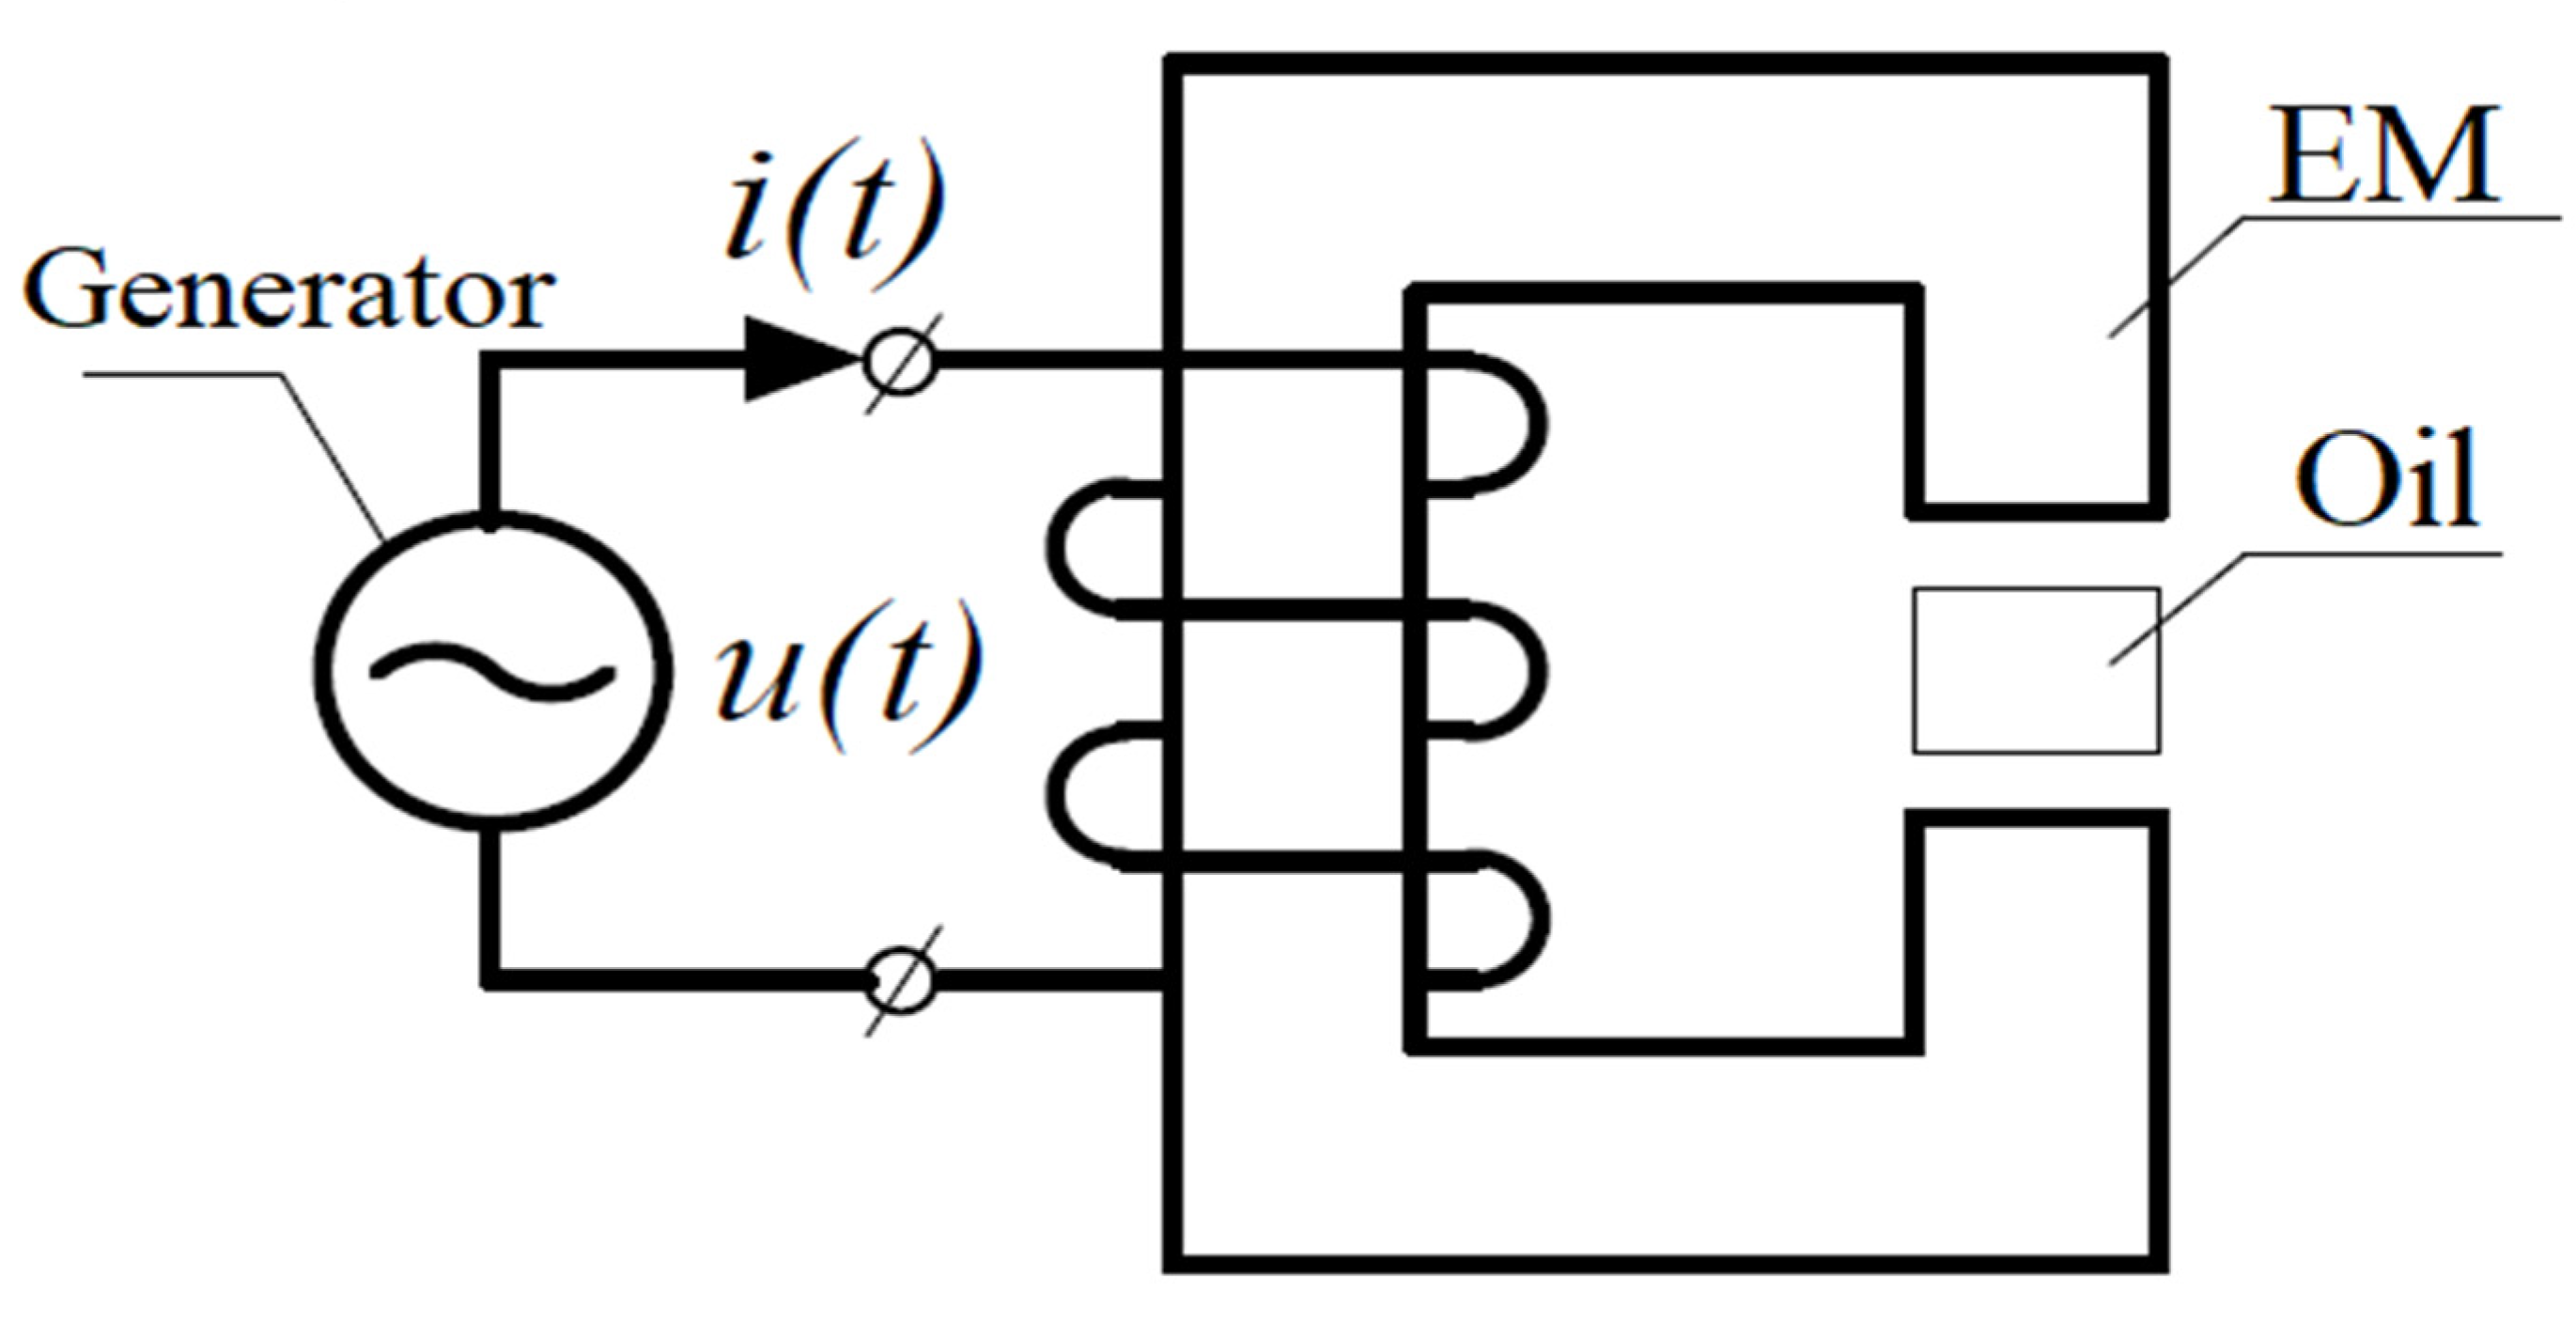
For this study, oil was extracted from the Salym reservoir in the Bazhenov Suite (with a sampling interval of 2873−2940 m) with a pace of 824 kg/m3 and a kinematic viscosity of 5.80 mm3/s at 20 °C, with the contents of asphaltene and resins being 0.5% and 3.1%, respectively [34,35,36]. The sulfur content of oil was very low and estimated to be less than 0.1%. For the electromagnetic (EM) treatment of oil, a coil on the split ferric core connected to a 50 Hz generator with sinusoidal electric current, as shown in Figure 2, to produce a 0.81 T effective magnetic field, which was exploited. The experimental setup is described in detail elsewhere [34,35,36]. Six 2 mL oil samples were prepared and put in sealed plastic containers. The samples were exposed to EM for 10, 20, 30, 40, 50, and 60 min, respectively, and then analyzed by a set of methods described below. The results were compared with the oil reference.

2.2. Methods

Analytical measurements used a Thermo Delta V Advantage isotopic mass spectrometer (ThermoFisher, Waltham, MA, USA) (the package includes an element analyzer and a gas chromatograph) and a Kristall-5000 chromatograph with a thermostat-cooling system. The overall isotopic composition (δ13C) was quantified from the average of the isotopic composition of n-alkanes that were detected by equipment. The variations in the material composition of the oil samples were monitored by gas chromatography on a Kristall-5000 chromatograph (ZAO Chromatec, Yoshkar-Ola, Russia) as follows: a 30 m capillary column and 100% polymethylsiloxane as the phase. The column temperature regime consisted of a programmable linear heating from 30 to 300 °C. The evaporator temperature regime consisted of a 310 °C isotherm. The chemical composition was estimated by the simulated distillation method.
The previous study [37] evaluated oil geochemistry, various characteristics and combinations thereof, and the obtained values. By relying on competences and available laboratory equipment of our research team, we assessed oil geochemical characteristics such as n-alkanes, total δ13C in oil, and some individual n-alkanes (from n-C-10 to n-C-22). Subsequently, it became necessary to interpret the data and compare the resulting characteristics with geochemical characteristics as applied to solving specific geological and prospecting problems. For example, to study the organic maturity degree, the scholars used the chromatography of oil (bitumoid) and consequently different types of coefficients arising from the n-alkane ratio, more specifically the predominance coefficient of the odd-numbered over even-numbered n-alkanes.
Bray and Evans [38] pioneered the use of Carbon Preference Indices (CPI) coefficient expressed in Equation (2):
C P I = 1 2 C 25 + C 27 + + C 33 C 24 + C 26 + + C 32 + C 25 + C 27 + + C 33 C 26 + C 28 + + C 34
Philippi [39] applied the R29 coefficient shown in Equation (3):
R 29 = 2 C 29 C 28 + C 29
The study [7] suggests that some natural samples have abnormal coefficients and derivatives. Therefore, scientists must develop hypotheses about catagenesis, biodegradation, or chemical composition of organic matter. These hypotheses cannot be univocally corroborated.
Another example is a study on petroleum reservoir formation processes using oil–oil correlations to examine the relationship between oil and oil-source rock. Tissot and Welte [7] noted that correlations work better with the aid of biomarkers such as pristane/phytane ratios. Furthermore, a comparison of the isotopic composition (δ13C) can be applied (see Equation (4)) [40]:
δ 13 C S a m p l e = C 13 C 12 S a m p l e             C 13 C 12 R e f e r e n c e 1 1000  
The studies by Russian scientists Kontorovich [40], Poturay [41], and Galimov [42] report many variations in the correlation parameters obtained by gas chromatography and isotopic mass spectrometry. Here, to evaluate the impact of geomagnetic fields on the geochemical evolution of oil, we used the following parameters: CPI, pristane/phytane, Σ even n-alkanes/Σ odd n-alkanes (from n-C-10 to n-C-38), phytane/n-C-18, pristane/n-C-17, and δ13C.
We also investigated the spectroscopic and relaxation characteristics of intrinsic oil paramagnetic centers by using a pulsed Bruker ElexSys 680 (W-band, 94 GHz microwave frequency) electron paramagnetic resonance (EPR) spectrometer (Bruker Corporation, Billerica, MA, USA). The two-pulse sequence π/2–τ–π with a π/2-pulse time of 16–32 ns and a delay time τ of 240 ns was used for electron spin echo (ESE) detection. The transverse (spin–spin) relaxation time T2e was measured from the decay of the primary ESE amplitude with an increment in the interval τ between pulses, with a pace of 4 ns and a fixed duration of π/2–π pulses. The recovery curve of the longitudinal magnetization and the longitudinal (spin–lattice) relaxation time T1e was determined by the inversion recovery pulse sequence of π–TDelay–π/2–τ–π–ESE for a fixed pulse length and time τ but with a variable TDelay time.
We also performed a statistical analysis of the data acquired by gas chromatography. In particular, the distribution of peak areas in the chromatograms was used as source data and was processed to obtain the ratios of the adjacent components of n-alkanes and biomarkers (pristine and phytane). Further, to prove the fact that an electromagnetic field influences the oil composition, we evaluated the averages and maxima that are characteristic of the difference in geochemical indicators between the initial oil (no electromagnetic exposure) and experimental oil samples (electromagnetically treated). This approach allowed us to clearly document the geochemical characteristics and components that were altered by the electromagnetic field treatment of oil.
The statistical analysis of the isotope mass spectrometry data was not performed. We statistically analyzed electronic relaxation times that are employed in EPR spectrometry. We built relationships and estimated the coefficient of determination, R2, between the electronic relaxation time (T1, T2) and electromagnetic exposure time of the experimental oil samples.

3. Results

3.1. Gas Chromatography Results

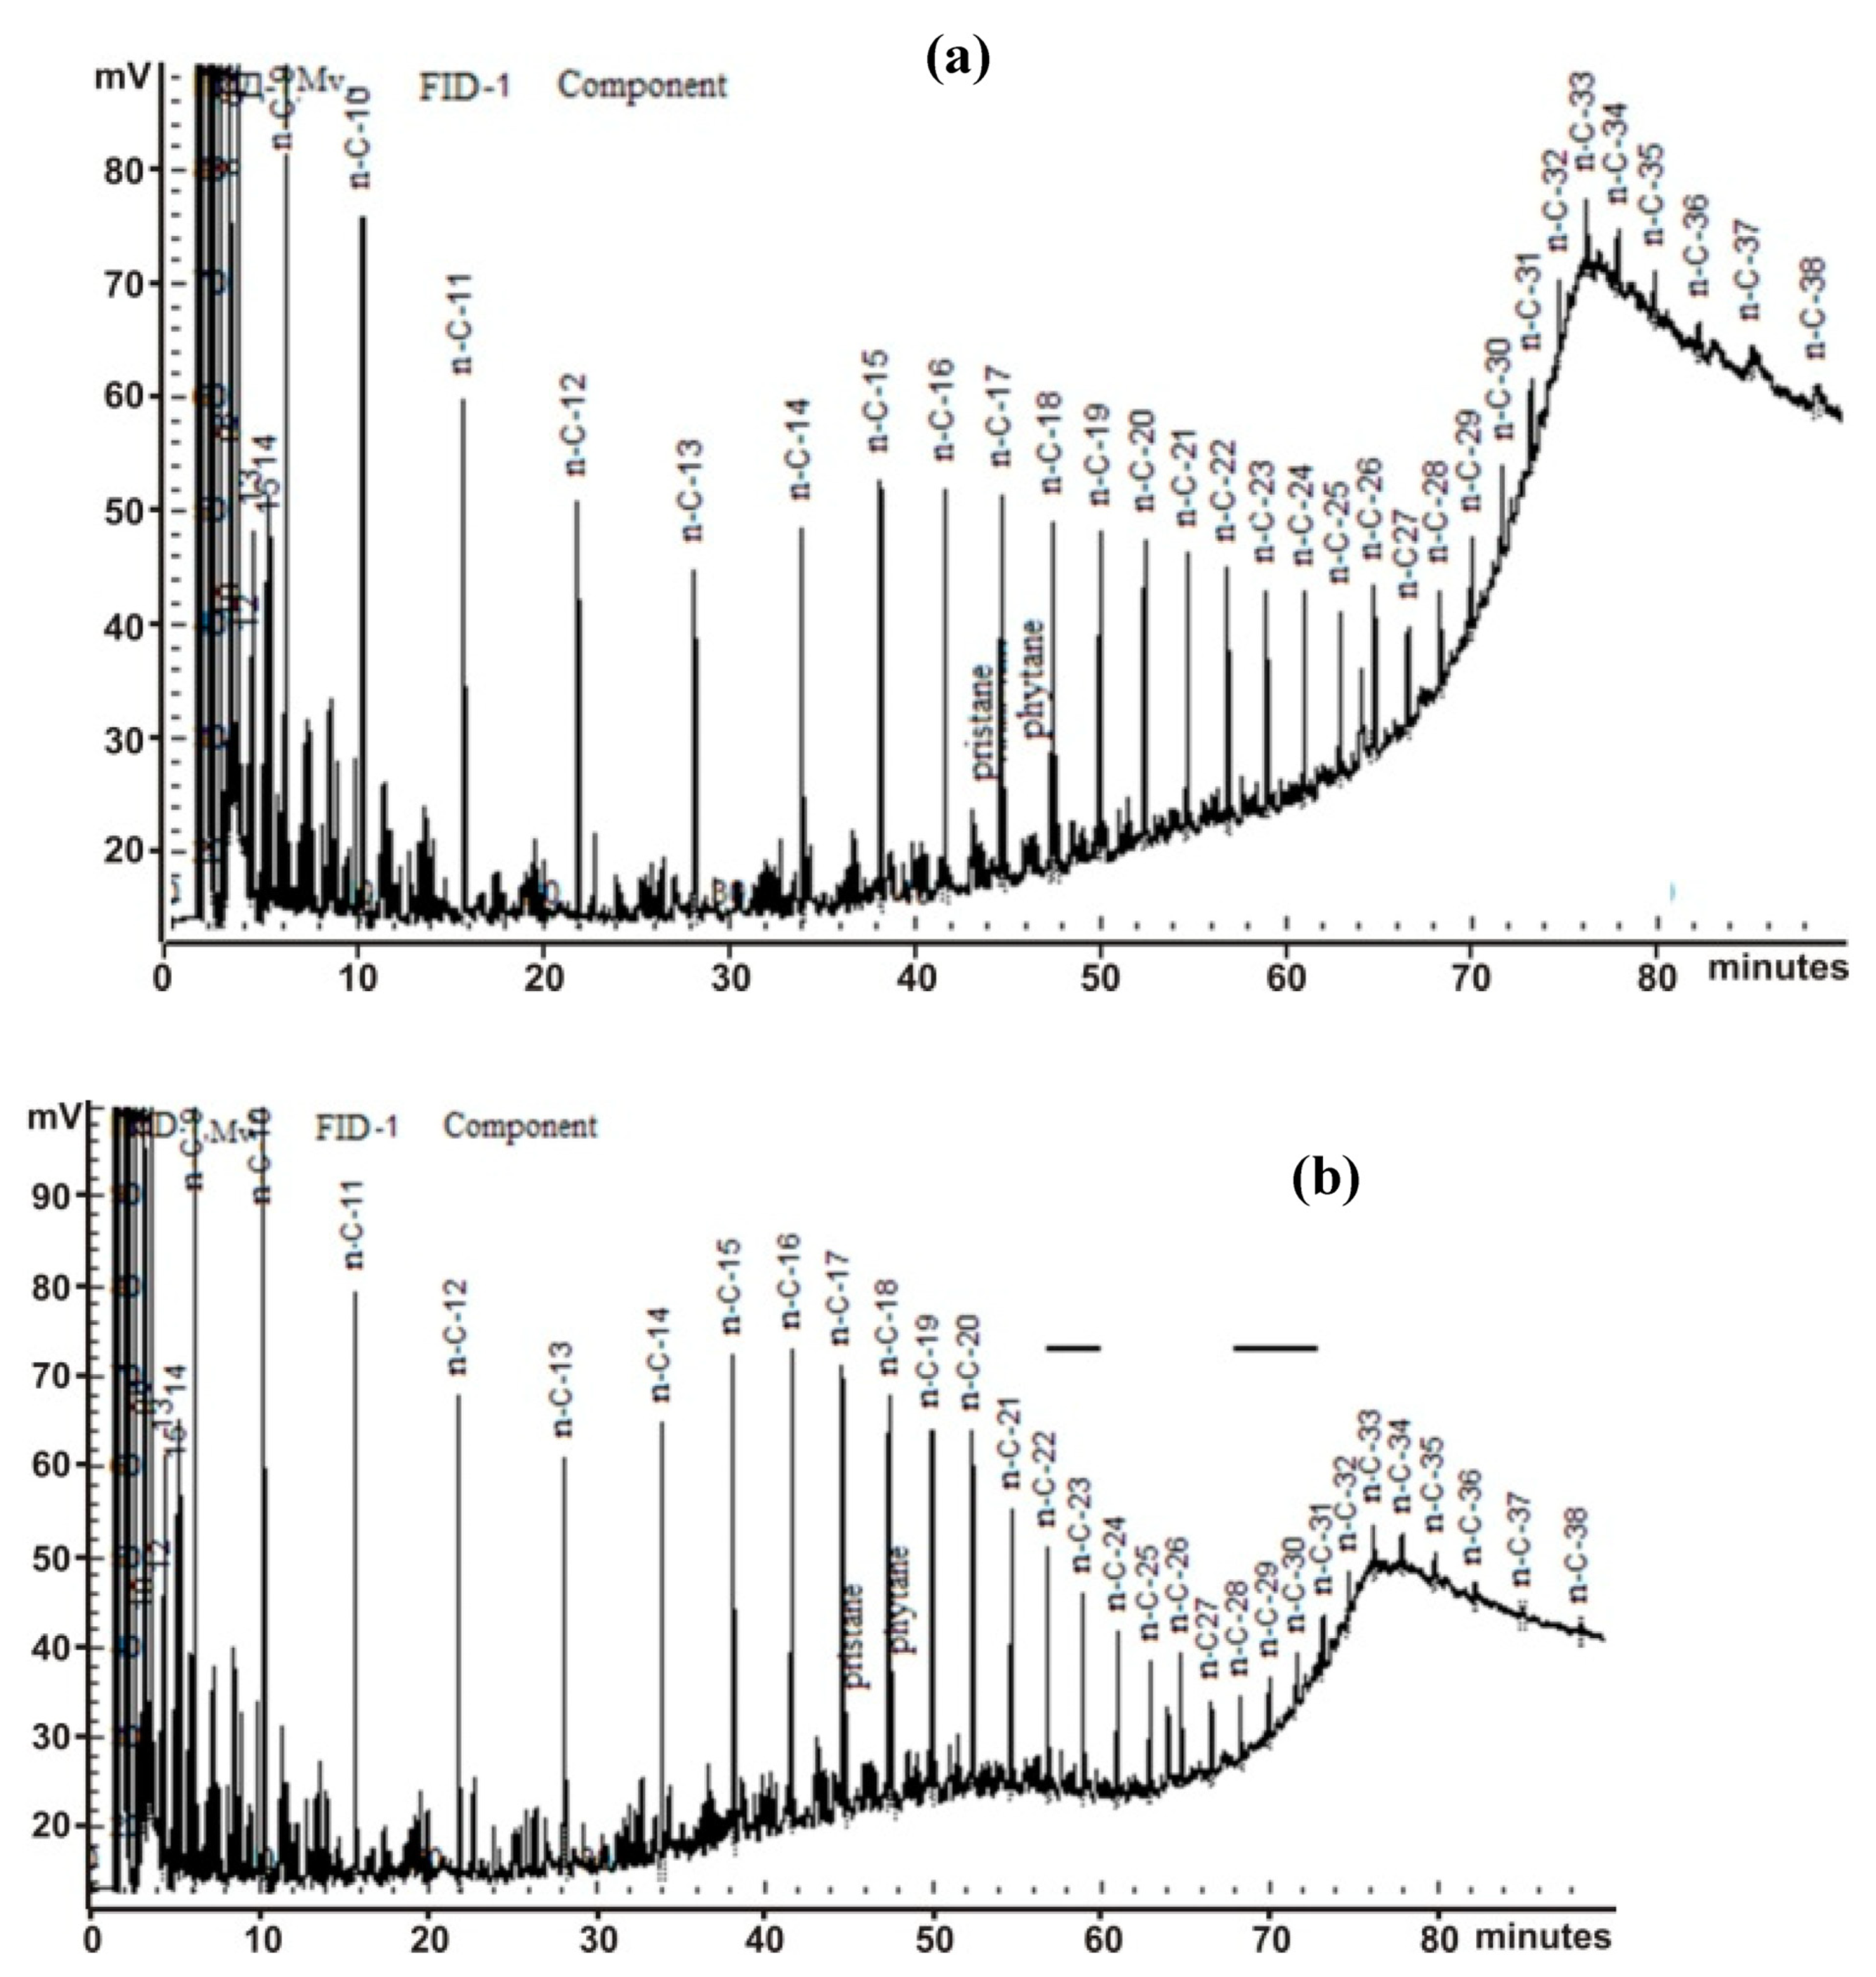
Two samples were compared in detail: a reference sample and a sample following a 50 min EM exposure (Figure 3). A comparison between the chromatograms revealed that the 50 min electromagnetic field exposure diminished the naphthene bump, which is an inseparable mixture of isoalkanes and cyclanes. This may indicate that the total concentrations of n-alkanes and acyclic isopropanes in the sample treated with the electromagnetic field are higher than those in the initial oil with no exposure [43].
Figure 4 shows that the n-alkane concentration remains almost unchanged up to 40 min of the EM exposure. The amount of n-alkanes increases suddenly over an interval between 40 and 50 min. This indicates that processes related to chemical polarization of electrons and nuclei in petroleum systems, which are understudied, trigger a collective recombination of hydrocarbon compounds.
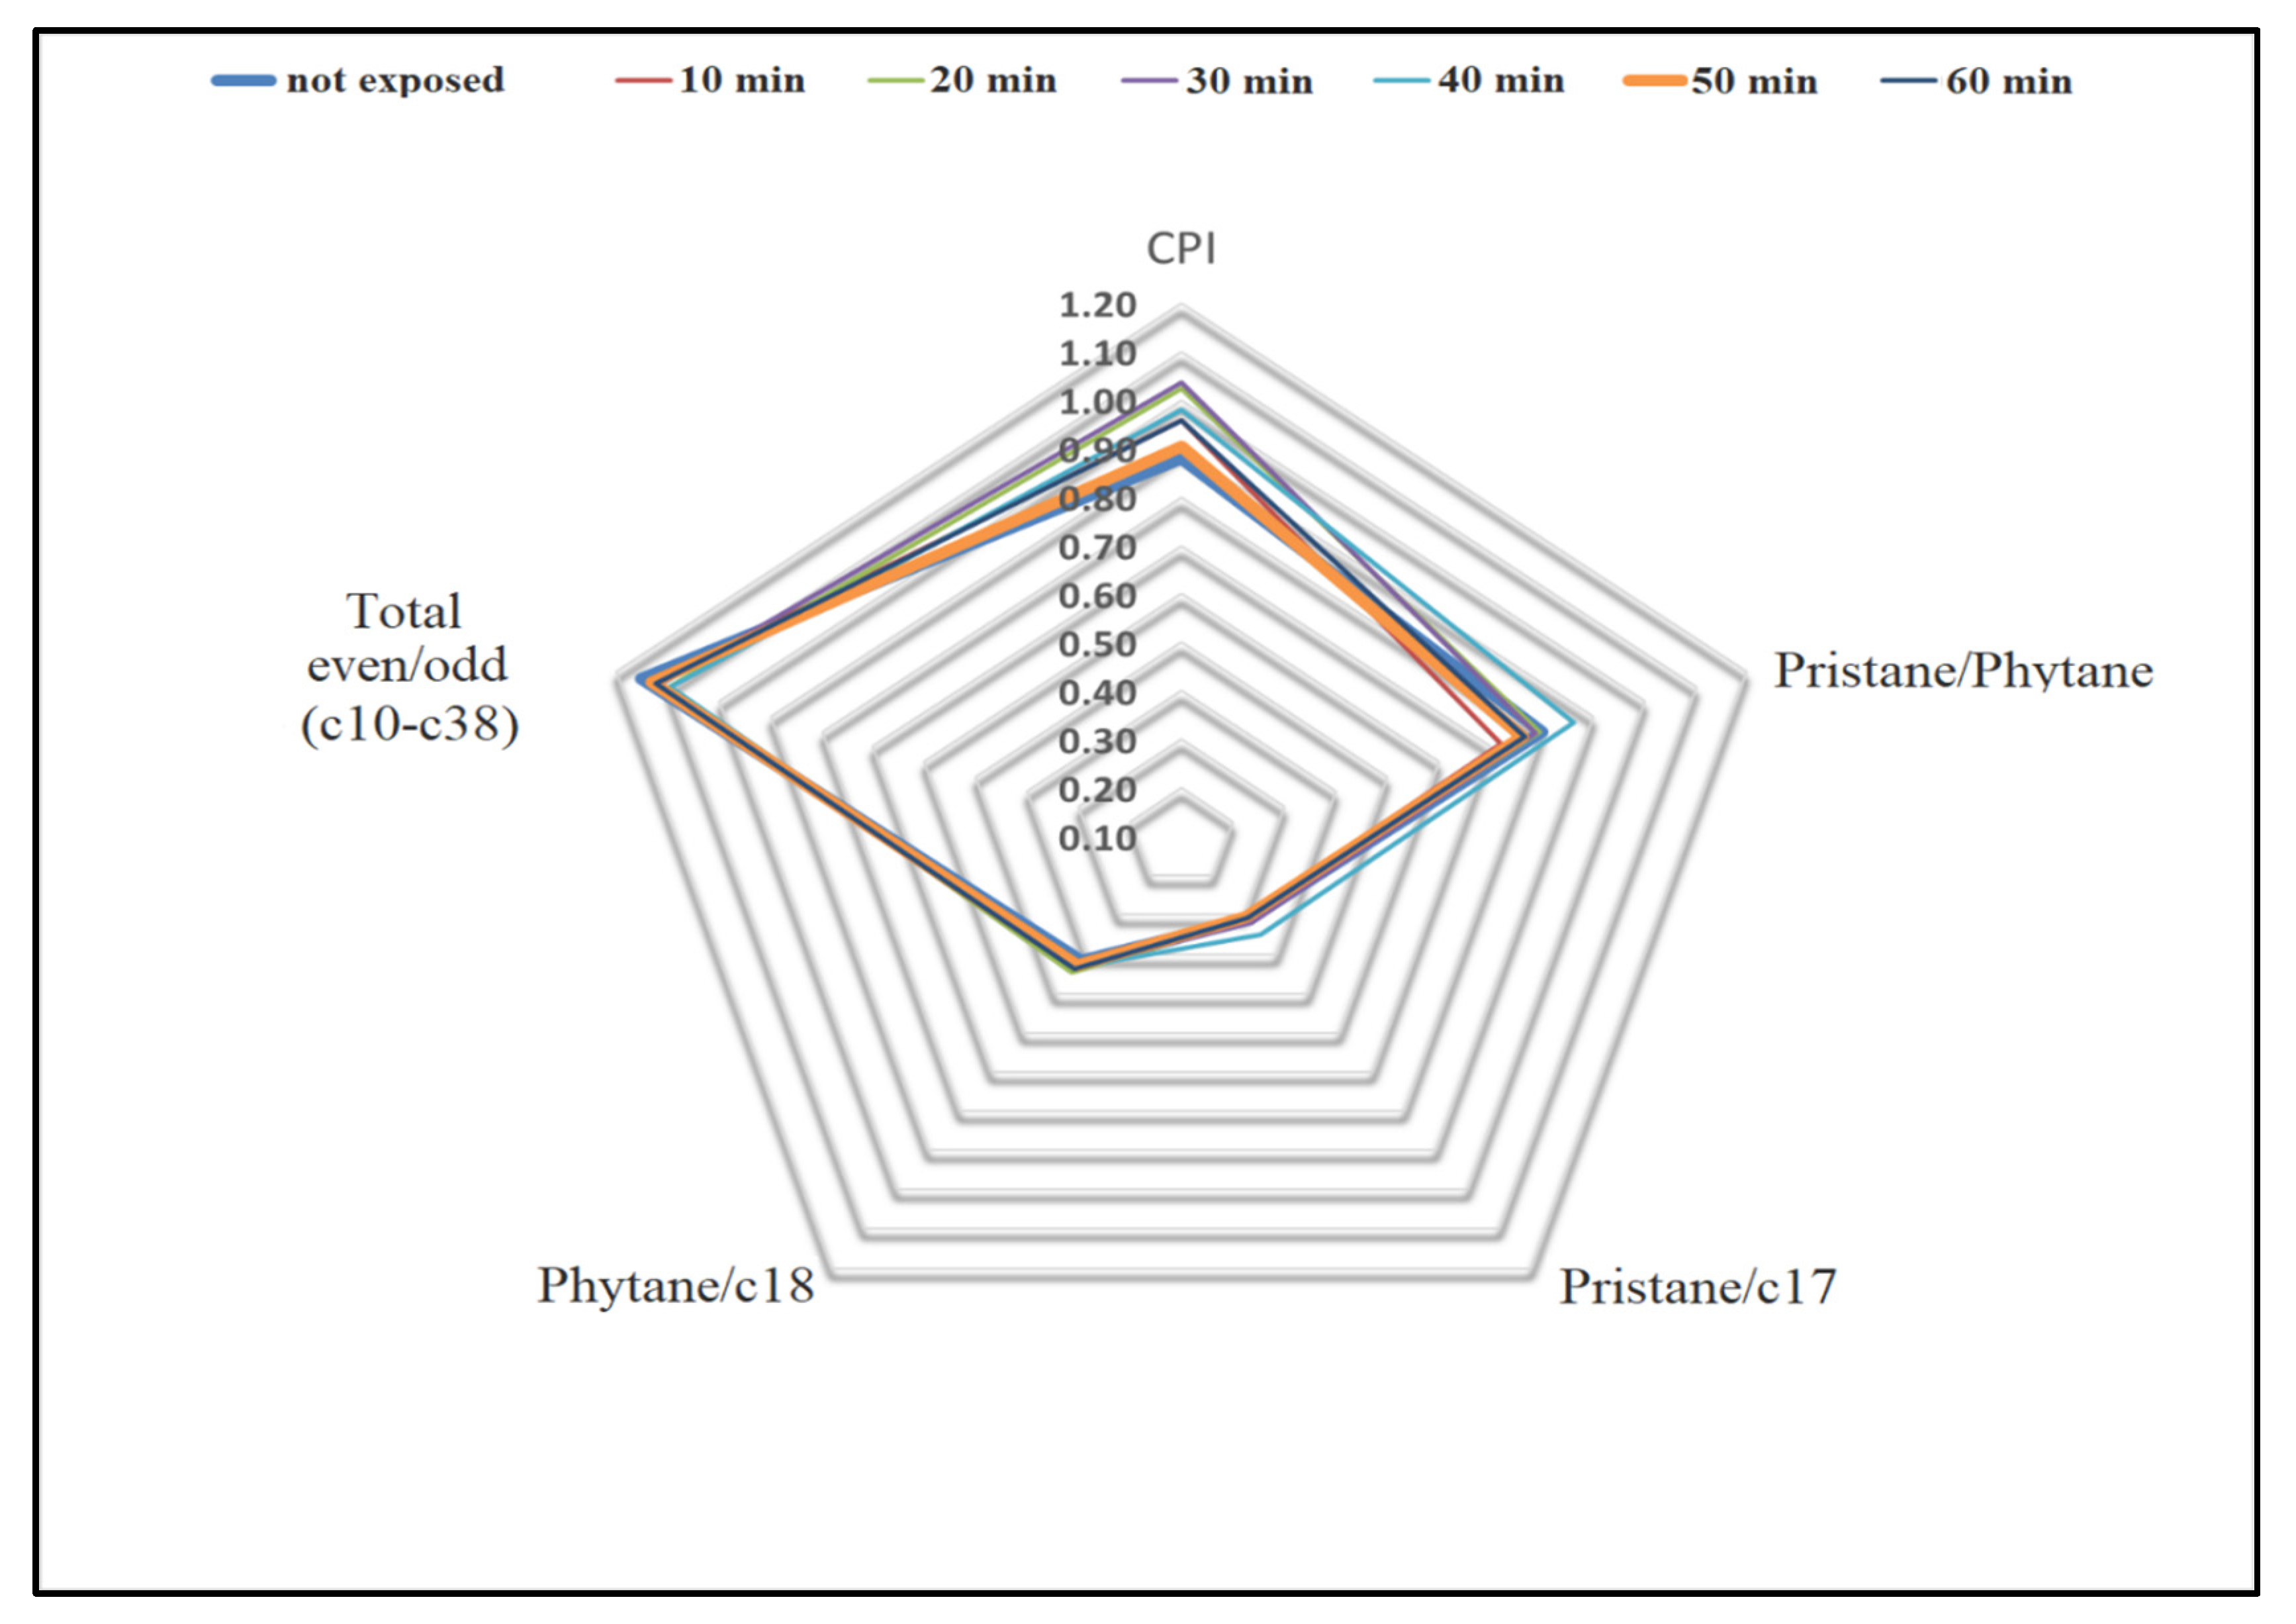
A comparative analysis of pristane/phytane, Σ even n-alkanes/Σ odd n-alkanes (n-C-10 to n-C-38), phytane/n-C-18, pristane/n-C-17, and CPI is shown in Figure 5. Surprisingly, the results show dramatic changes in the pristane/phytane and CPI coefficients, as well as 0.14‰ and 0.16‰ differences in maxima and minima, respectively. However, the other geochemical characteristics did not significantly change, as the differences in the maxima and minima did not exceed 0.06‰.

3.2. Isotopic Mass Spectrometry Results

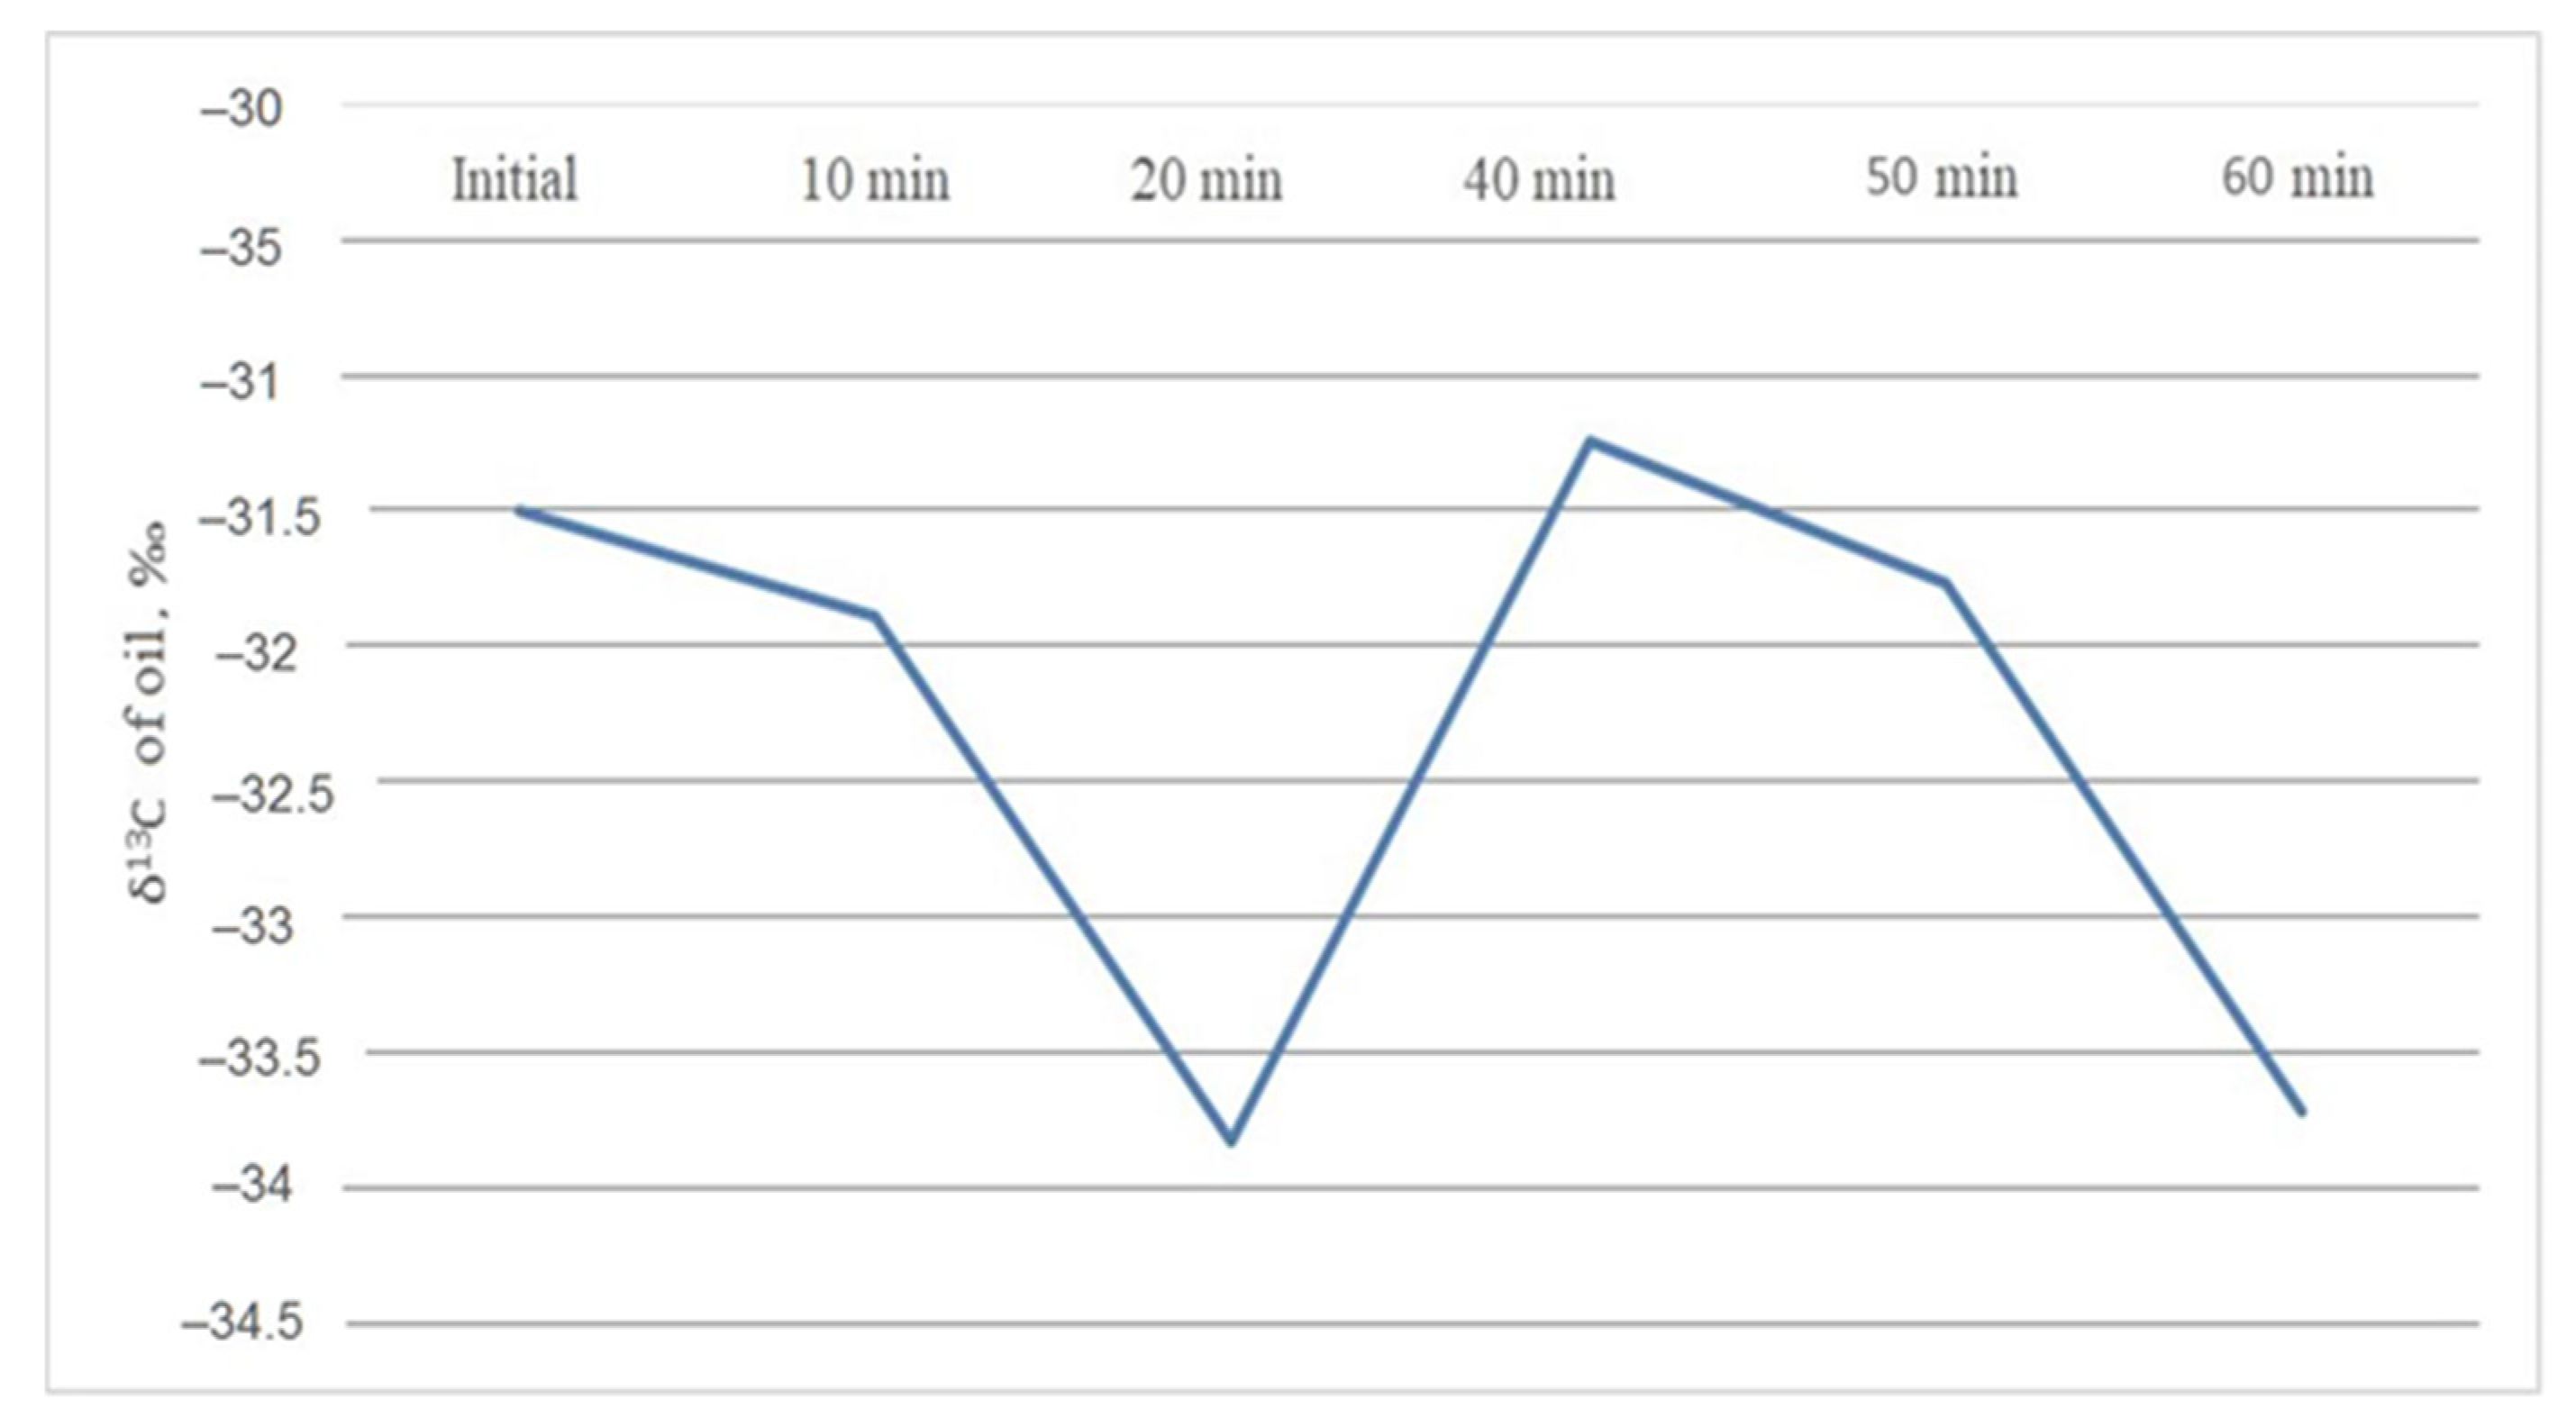
In his study [29], Buchachenko emphasized that isotopic composition data can be very useful in reconstructing the geochemical evolution process. Most of the current correlations, which are used in oil geochemistry, pertain to a comparison of the overall isotopic composition of chemical elements of matter. This subsection contains information on variations in δ13C of oil and in particular components of oil when exposed to an electromagnetic field. Figure 6 demonstrates general changes in δ13C occurring in the oil samples.
The general time course of δ13C in oil indicates that electromagnetic fields alter the isotopic composition of oil. The difference between the maxima and minima of δ13C is as high as 2.6‰. These results suggest that even a relatively short (60 min) exposure to an ambient magnetic field causes major changes in the isotopic composition (δ13C). This significance is confirmed by the fact that when geochemists use a classic approach to the interpretation of δ13C values, isotopic differences exceeding 2‰ are considered high enough to distinguish between different types of oil. This was confirmed by several studies [7,44,45,46]. Therefore, understanding the changes in the isotopic composition (δ13C) of oil when the reservoir is exposed to a natural geomagnetic field can be very helpful in specifying geochemical criteria while solving particular applied problems.
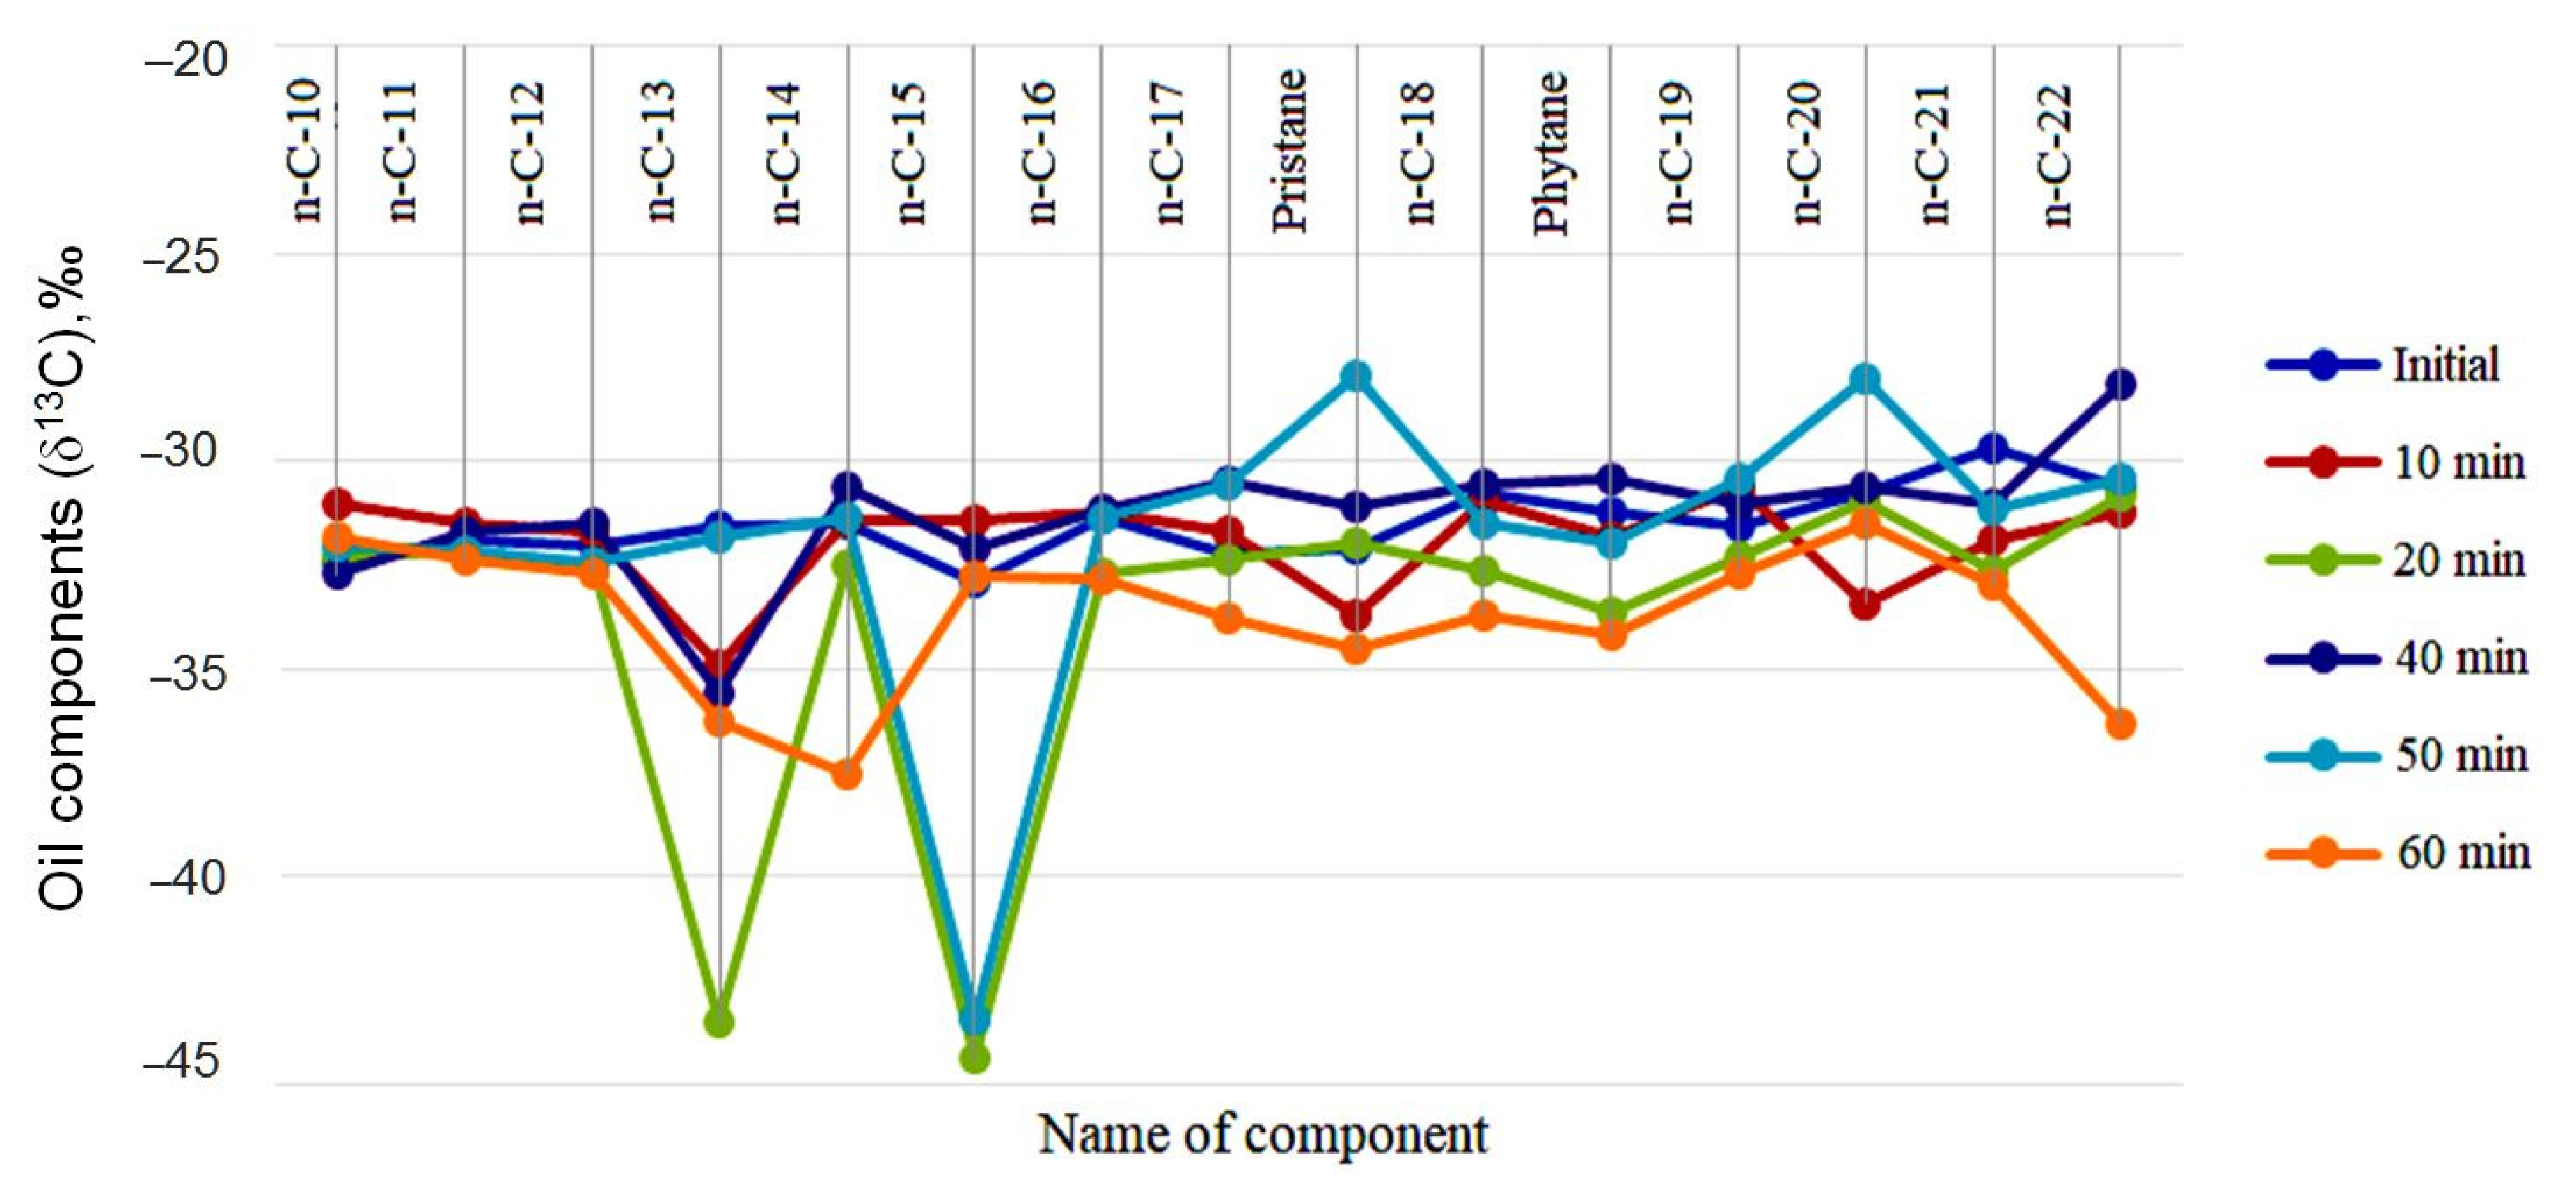
Here, we examined the geomagnetic field impact on both the isotopic composition (δ13C) of overall oil and specific normal components of alkanes. Figure 7 displays the transformation results of δ13C in oil components (n-C-10 to n-C-22, including pristane and phytane) contained in the samples.
Figure 7 shows three groups of components that are differentially sensitive to an electromagnetic impact. In Group 1, changes do not exceed 3% (C-10, n-C-11, n-C-12, n-C-16, and n-C-19); in Group 2, changes range from 3% to 6% (n-C-17, n-C-18, n-C-11, phytane, n-C-20, and n-C-21); in Group 3, δ13C varies from 6‰ to 13‰ (n-C-13, n-C-14, n-C-15, pristane, and n-C-22). In this context, the necessity of using more advanced approaches for the interpretation of isotopic mass spectrometry data with geochemical correlations is more evident. This concerns both the overall and specific isotopic compositions of oil. The mechanism of isotopic fractionation of stable isotopes with magnetic effects, including δ13C, supports petroleum geochemists developing an evidence-based approach to address key aspects of the geochemical evolution of oil. This may require a re-interpretation of the existing geological and geochemical data.

3.3. EPR Results

The EPR spectrum of the initial oil (the control sample) under study was described in detail in [24]. The main feature of the EPR spectrum of oil is that no EPR signals other than those from the “free” stable radicals (FR) were recorded with the instrument sensitivity at ambient temperatures. The signal exhibits a g-factor value of g = 2.0023(2), which is very close to that of free electrons. The concentration of FR was estimated to be 8(2)·1018 spin/g. No changes in the EPR spectrum and its intensity were detected in the EM treatment.
EPR spectra recorded by electron spin echo in the pulse mode are exemplified in Figure 8. The spectra can be simulated reasonably well, assuming that a single paramagnetic center of axial symmetry is existent [24]. The derived parameters, g = 2.00145(5) and g = 2.00235(5), are in good agreement with those given for the X-band and do not vary from sample to sample. The nature of the additional line in higher magnetic fields, which disappears after a 40 min EM exposure, is still intriguing but not discussed herein.
The relaxation characteristics measured at the ESE signal maximum are listed in Table 1. Even though there is a tendency of the relaxation times to increase slightly with exposure time, these changes are insignificant and, in our view, cannot be used to capture changes in asphaltenes and resins of oil when exposed to the electromagnetic field, as opposed to the study [47] on the use of supercritical water for oil properties improvement. Therefore, summarizing all the EPR results, it can be speculated that the change in the oil geochemistry has nothing to do with the combination–recombination processes of native carbon-centered FR.

3.4. Statistical Analysis Results

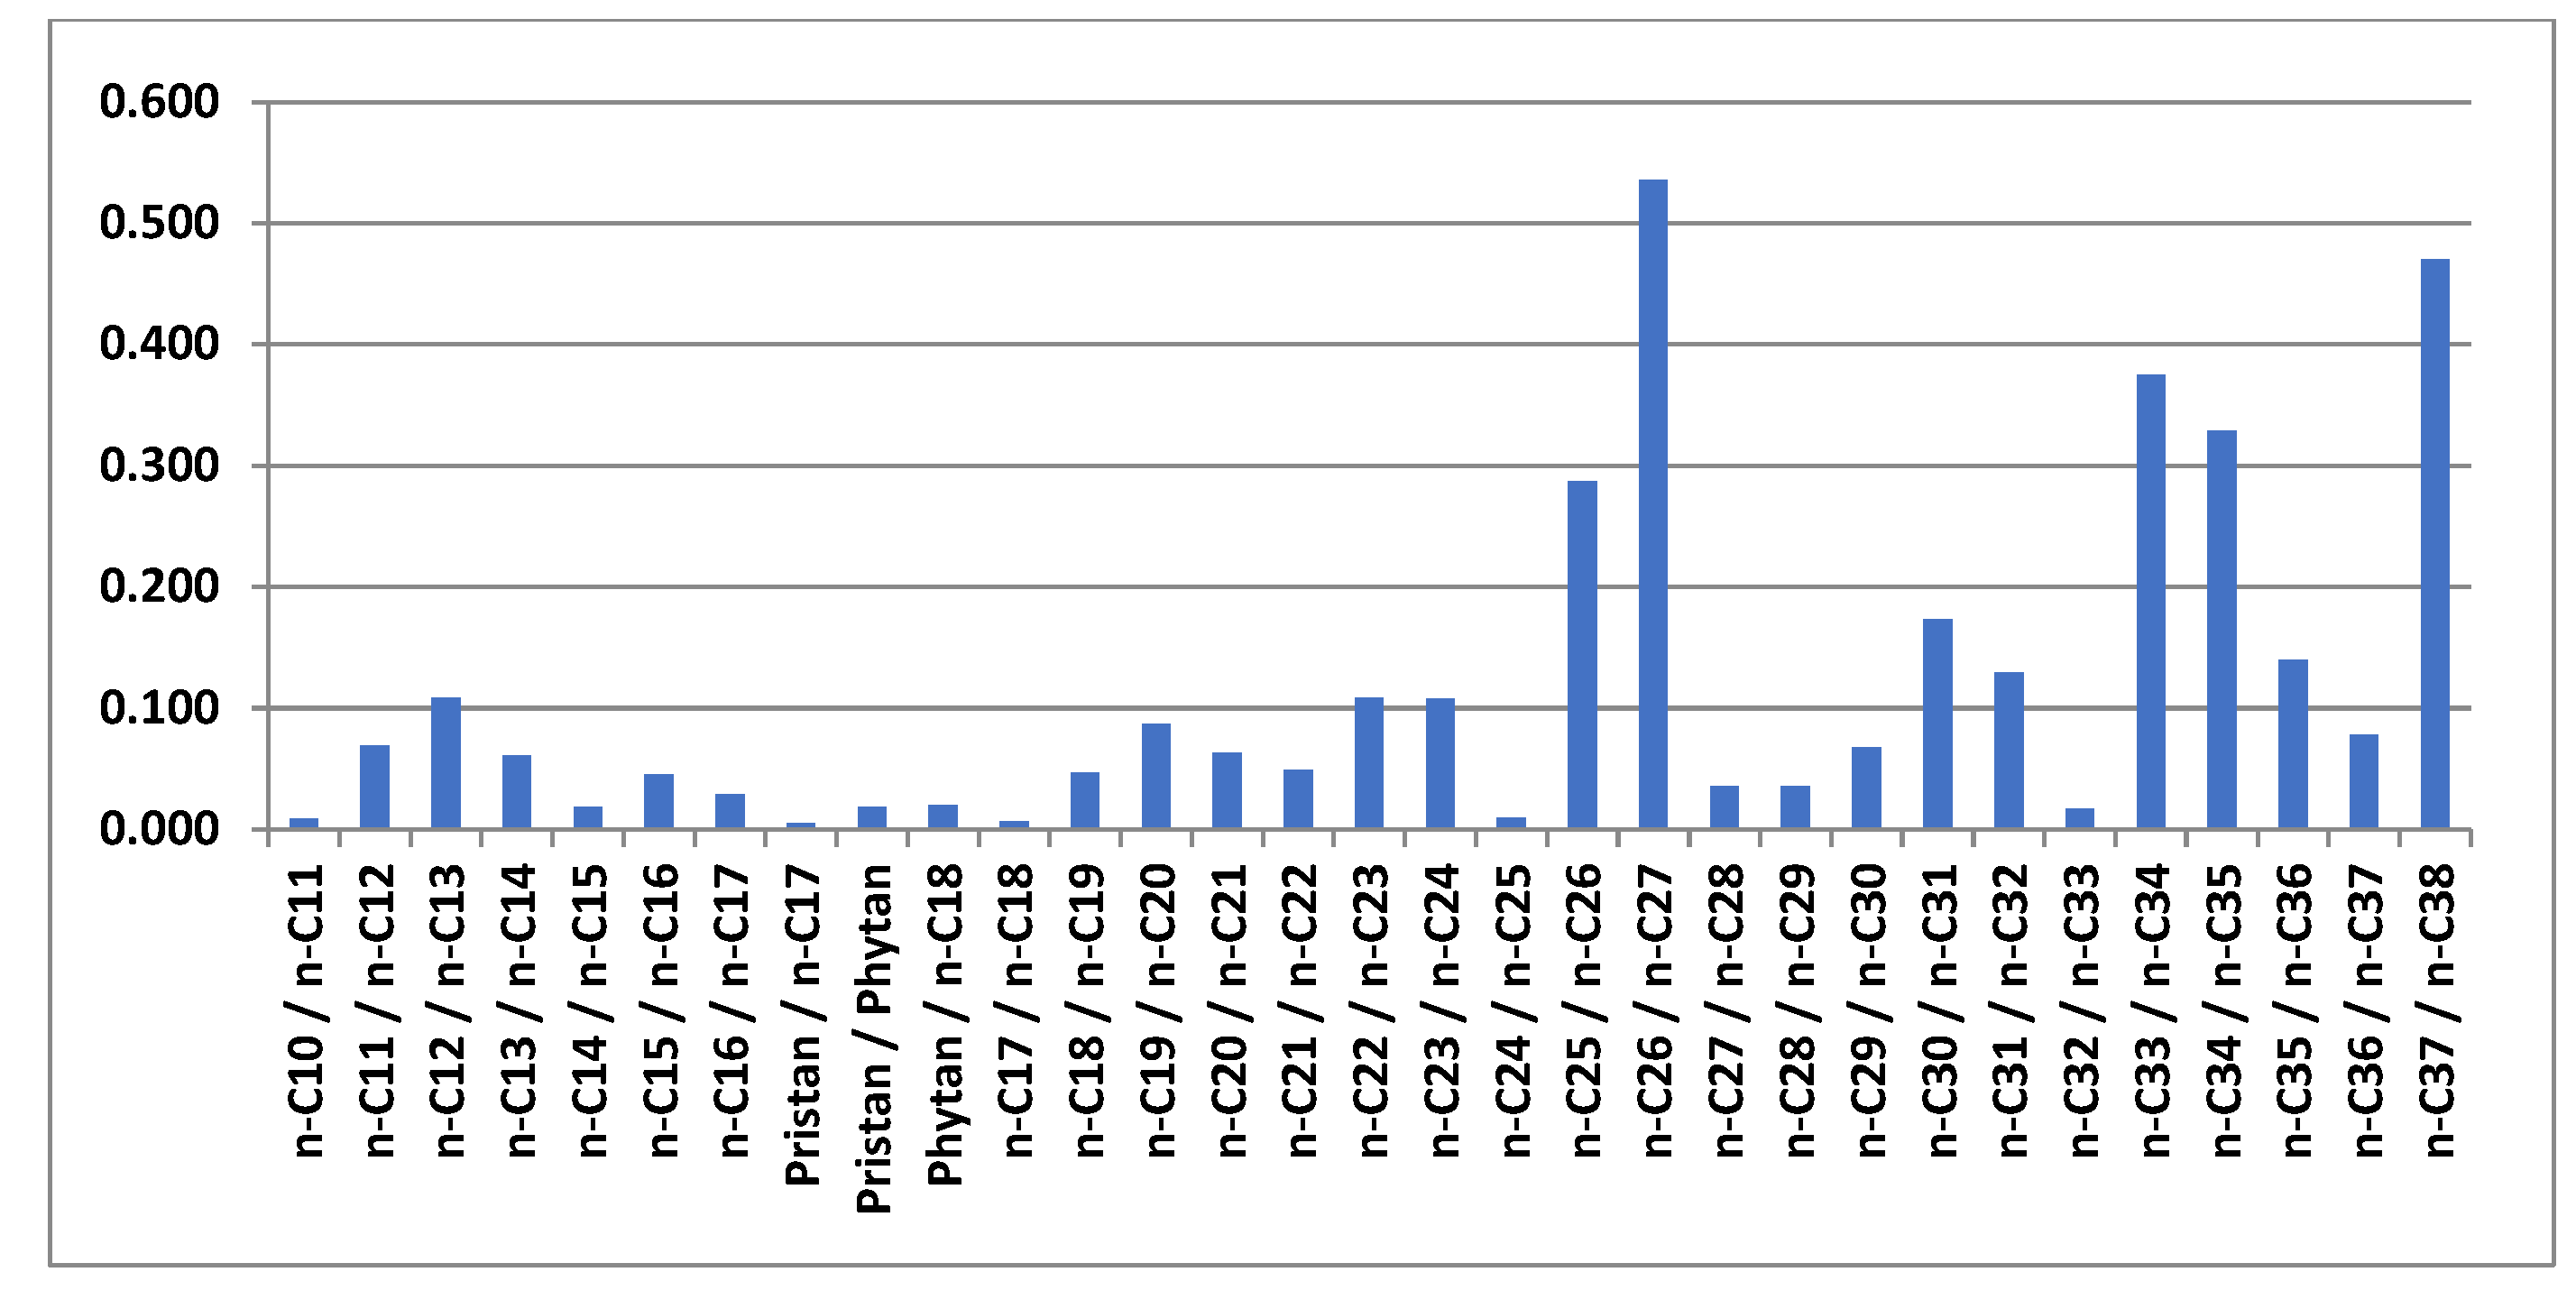
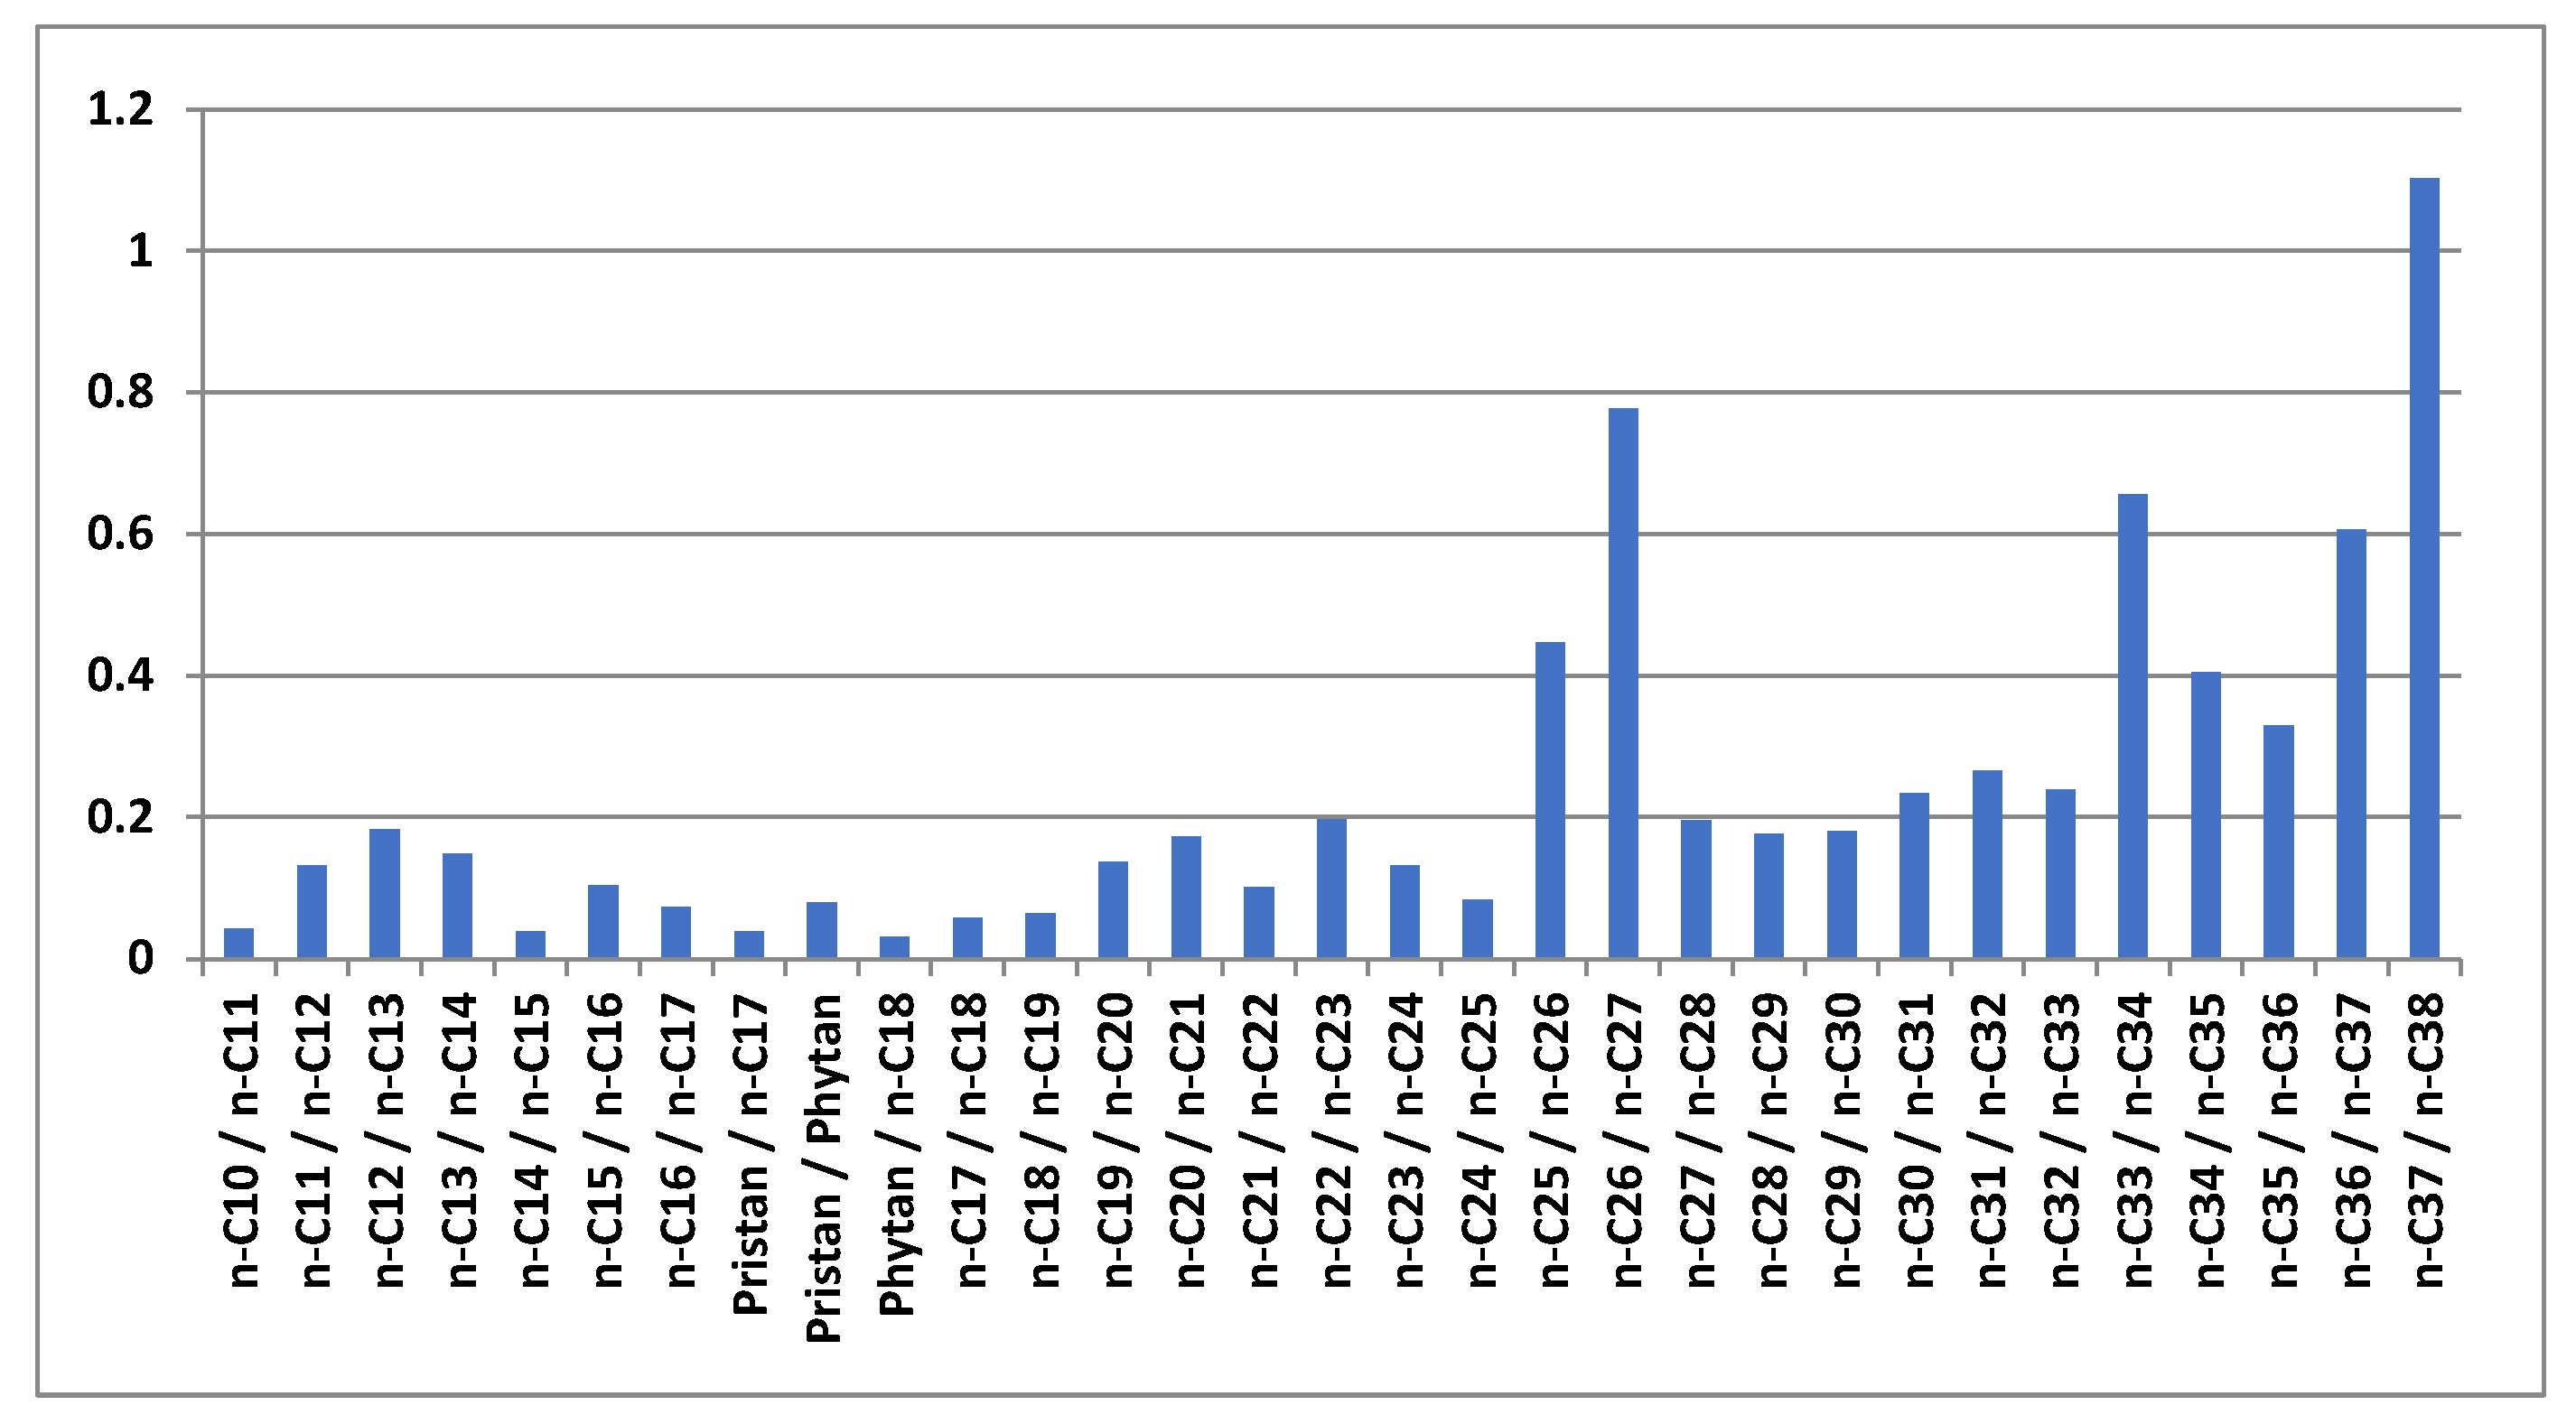
Figure 9 and Figure 10 show the results from the statistical analysis of the chromatographic data, which describe the geochemical characteristics of the samples.
The analysis of Figur9 shows significant differences in geochemical characteristics such as n-C25/n-C26, n-C26/n-C27, n-C33/n-C34, n-C34/n-C35, and n-C37/n-C38.
The analysis of Figure 10 shows geochemical characteristics that have the highest differences between the initial oil and oil exposed to the electromagnetic field. Significant differences were detected in geochemical characteristics such as n-C25/n-C26, n-C26/n-C27, and from n-C30/n-C31 to n-C37/n-C38.
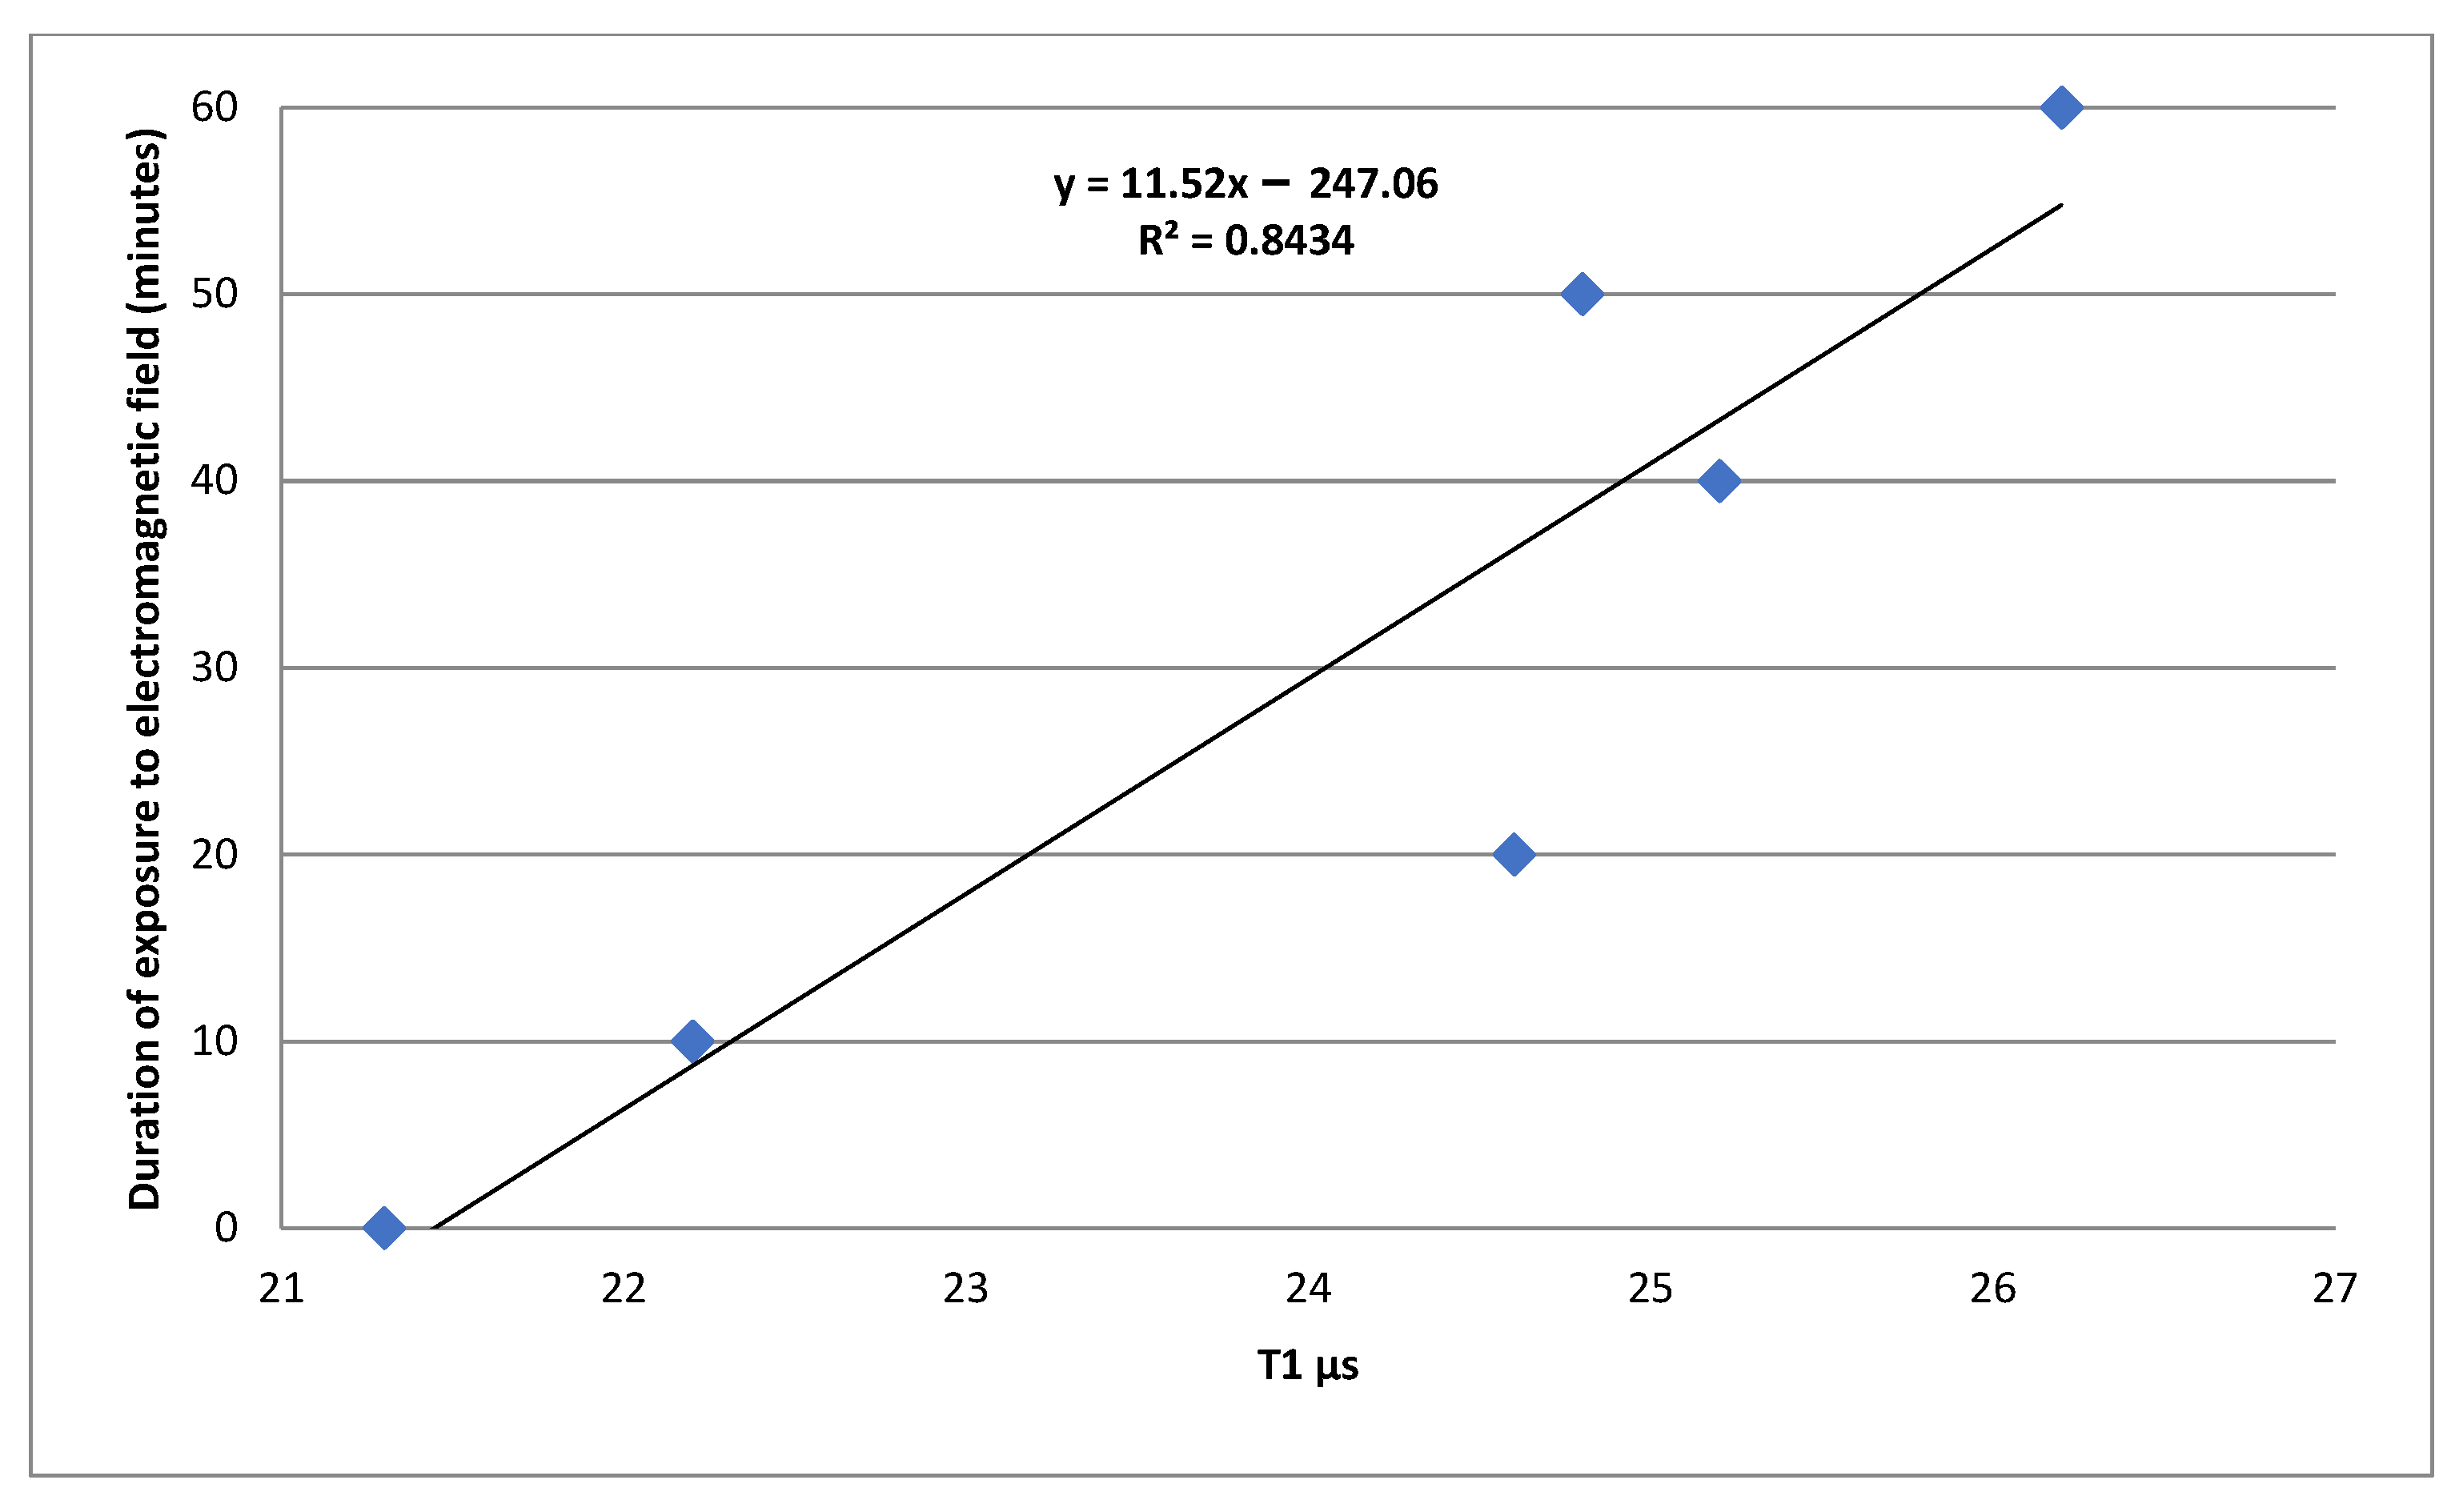
Figure 11 shows the electronic relation time, T1, plotted against the electromagnetic exposure time of oil.
Figure 12 displays the electronic relation time, T1, plotted against the electromagnetic exposure time of oil.
The analysis of Figure 11 and Figure 12 demonstrates that electronic relation times T1 and T2 are highly associated with the electromagnetic treatment time of oil. This is evidenced by the coefficient of determination values, R2, that exceed 0.84.

4. Discussion

By discussing our study results, we want to touch upon three key directions related to the present study: (1) experimental studies on variations in properties of oils when exposed to electromagnetic fields; (2) geochemical characteristics of oil and the applied significance thereof; and (3) natural magnetic, electric, and electromagnetic fields. Our obtained findings will be discussed hereinafter.
Before proceeding to discussing specific things related to our study results, we want to emphasize the relevance of the topic studied herein. Raw hydrocarbons such as oil and gas are strategic resources enabling nations to flourish. Hydrocarbon resources are well-known to be exhaustible, necessitating that the resource base be replenished by enhancing the oil recovery factor and discovering new hydrocarbon deposits. The oil recovery factor can be enhanced by using oil recovery enhancement methods (reservoir treatment methods), to which the electromagnetic exposures of the bottom-hole formation zone are also related, while the discovery of new deposits can be achieved by forming new fundamental insights into oil generation and geochemical evolution.
First, we will look into the studies in which oil and oil reservoirs are treated with electromagnetic fields. We overviewed recent review papers on this topic [48,49] and want to note the following: (1) in most cases, the electromagnetic treatment of a reservoir is used to increase the mobility of high-viscosity oils and separate the interphases near the water–oil contact; (2) the field effect is attained by heating oil reservoirs with an electromagnetic field; (3) to enhance the field effects, magnetic nanoparticles are utilized along with the electromagnetic exposure; (4) most studies are concerned with evaluating the oil rheology, whereas the variations in oil properties at the molecular level have almost not been studied. The present study carried additional information on the change in oil properties at the molecular level as a result of the electromagnetic exposure.
Now, we want to discuss the applied significance of oil geochemical characteristics that we investigated to the prospecting and exploration of new deposits. The current theory of oilfield genesis is premised on the fact that oil was generated in source rocks and further migrated to the overlying strata [7]. In order to find a new oil deposit, it is required that oil migration paths be tracked. This is achieved by comparing the geochemical characteristics of soluble organic matter (or oil) in the source rock or soluble organic matter (or oil) in potentially productive or productive reservoirs. A wide spectrum of geochemical instruments such as gas chromatographs, mass spectrometers, and isotope mass spectrometers are typically used to perform geochemical correlations (a comparison of geochemical characteristics). Then, different geochemical indices are employed. Below are outlined some examples of geochemical correlations.
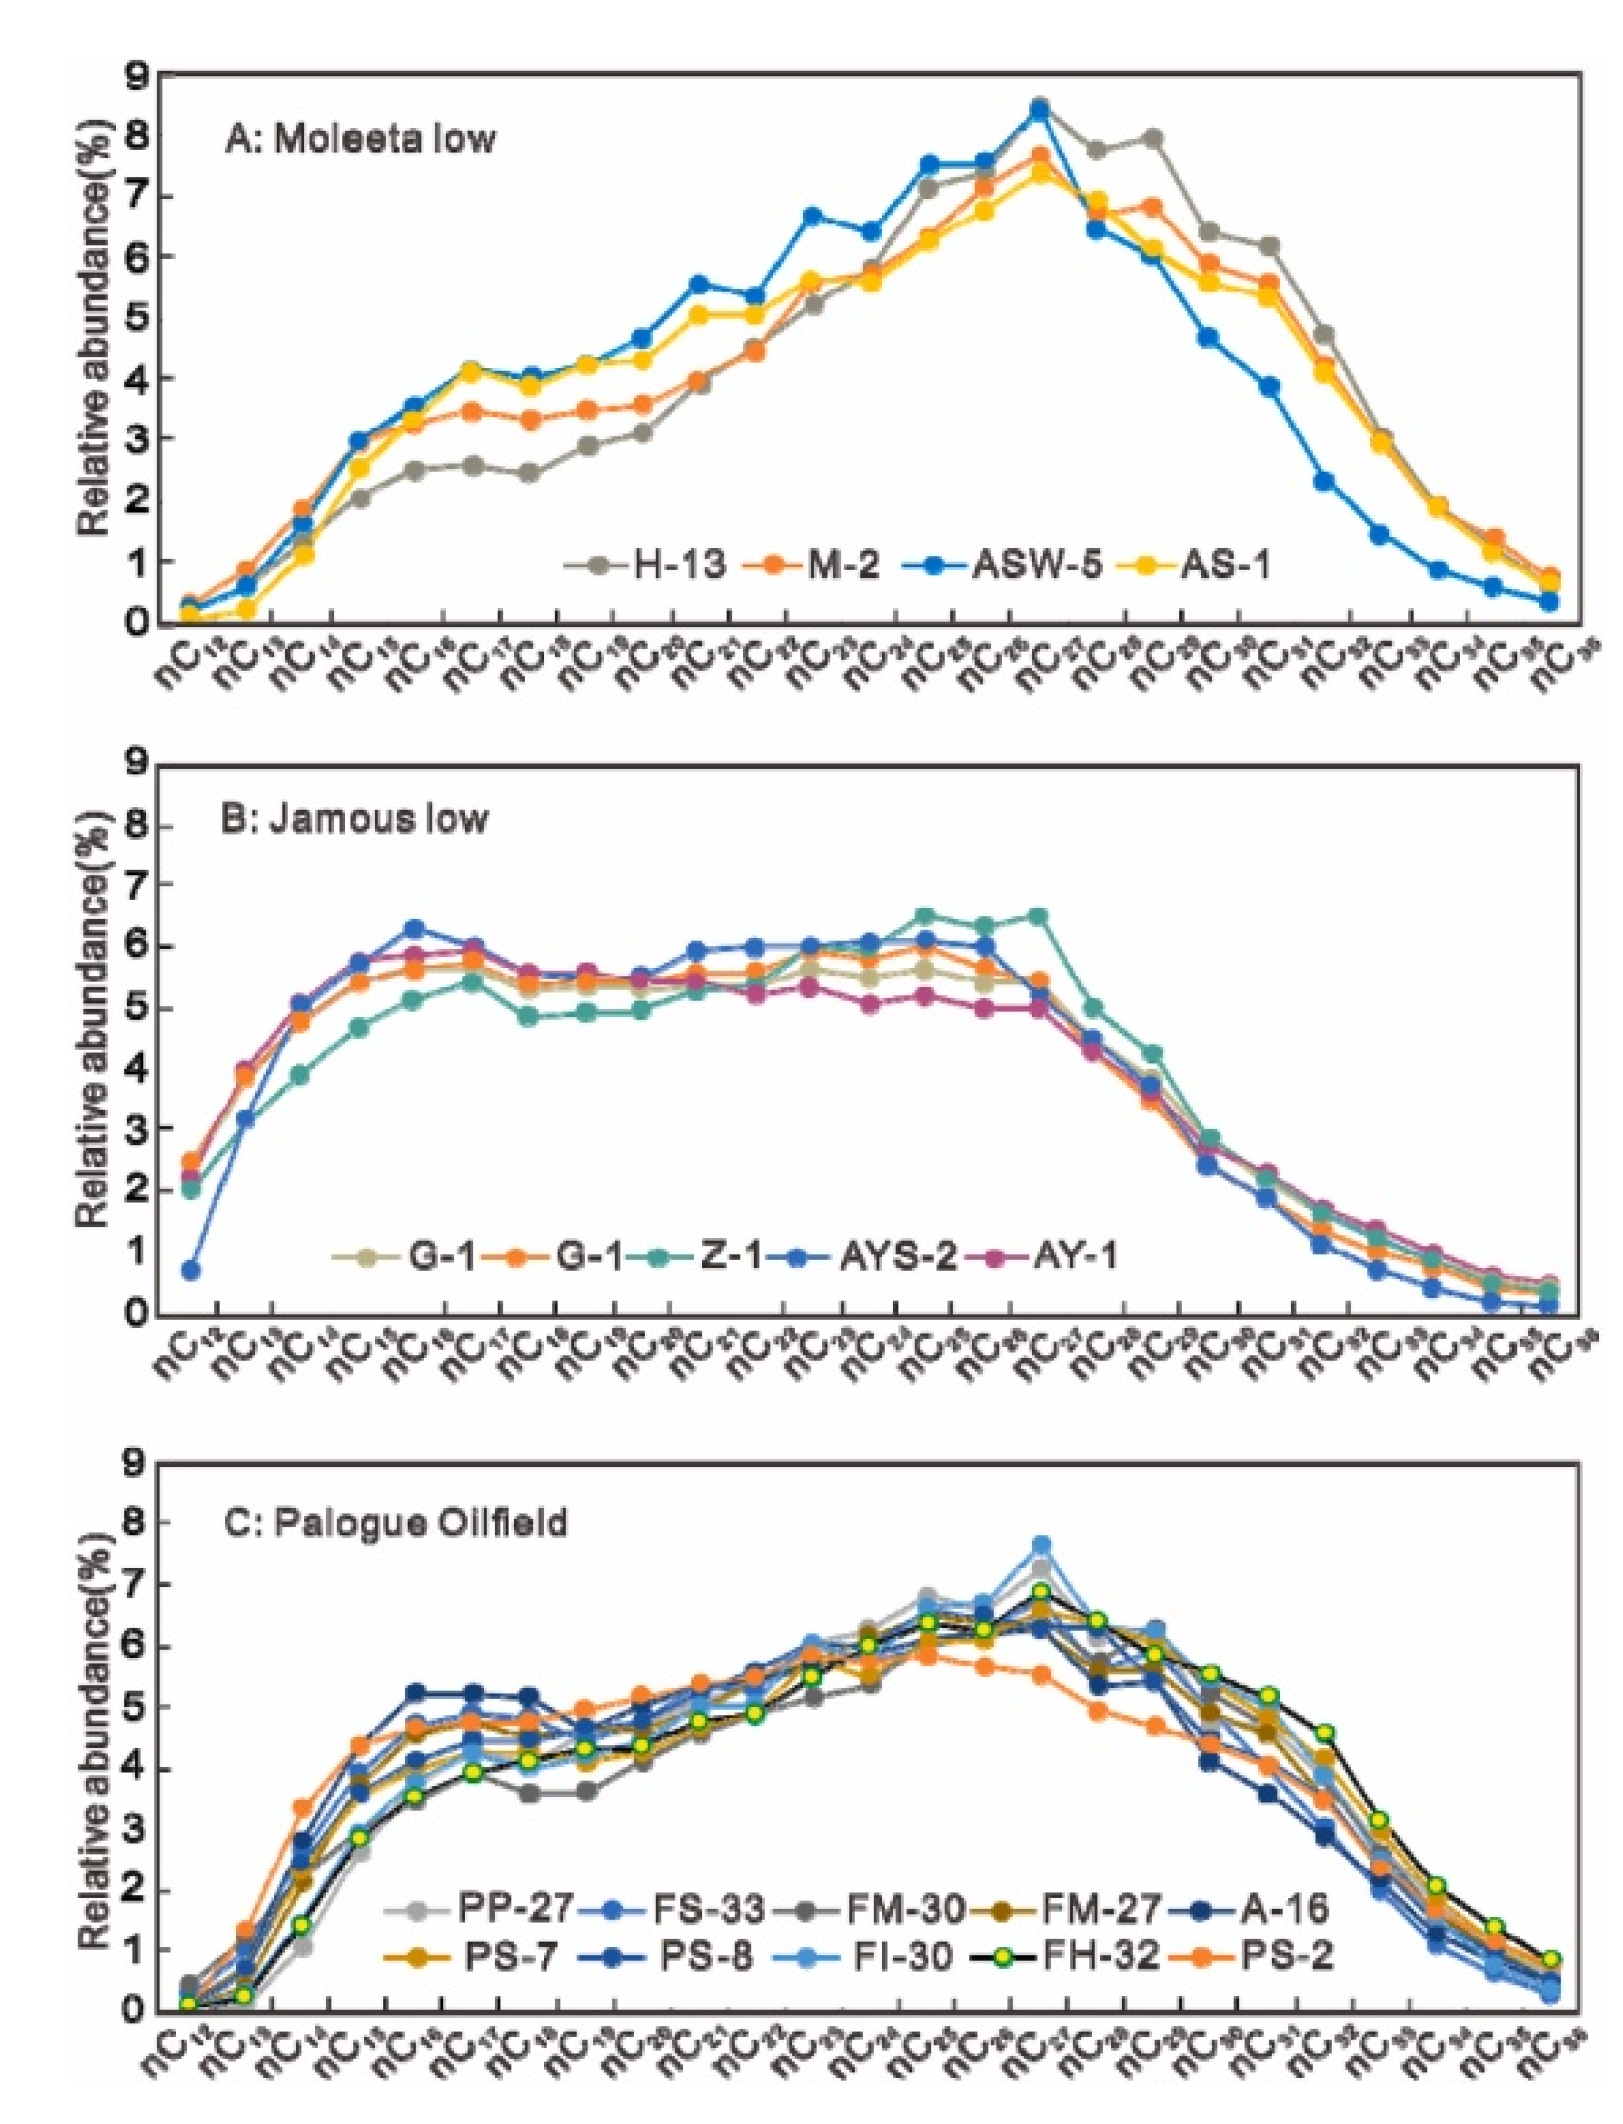
Shi et al. [50] sought to identify source-rock deposits from which the giant Palogue oilfield was formed.
Figure 13 illustrates a distribution of n-alkanes of crude oils from the Moleeta, Jamous, and Palogue oilfields.
Based on the comparison of the distribution of n-alkanes, as well as on the comparison of geochemical characteristics similar to those we used in our study, these authors were able to establish that the Palogue oilfield had formed with a mixed involvement of the source-rock deposits from the Moleeta and Jamous oilfields, although the source-rock deposits from the Jamous oilfield were the major contributor.
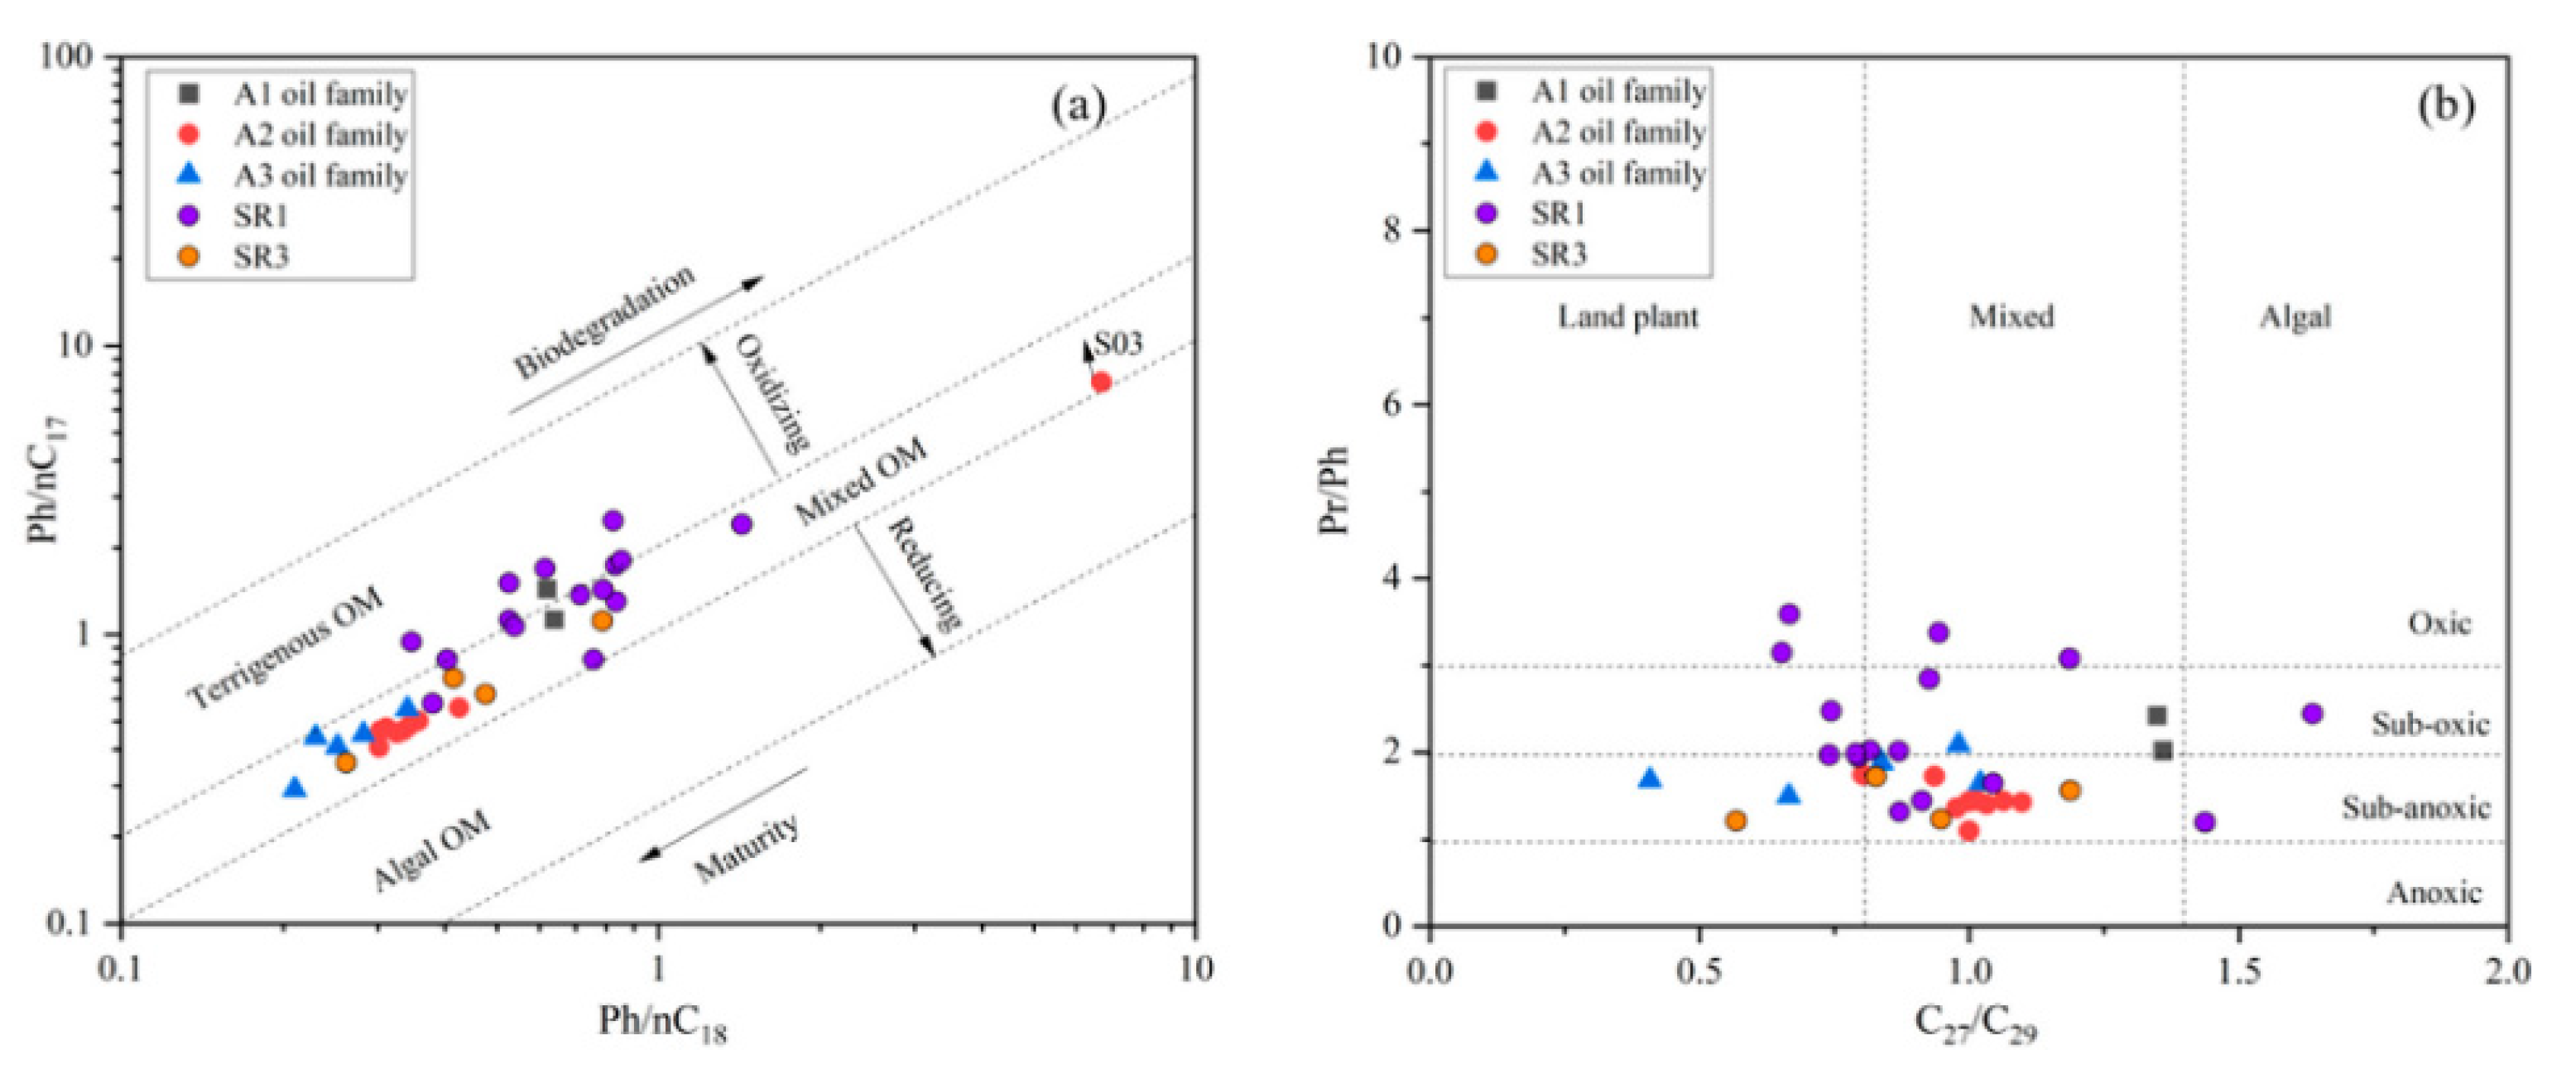
Ma et al. [51] investigated three oil families from the sub-sag A of the Weixinan Depression. Figure 14 compares geochemical characteristics, including those we used in our study.
By comparing the geochemical characteristics of oil in [51], these authors discovered that the oils refer to three different source rocks rather than a single one, as expected before. This makes geologic exploration works well-reasoned for the search for new oilfields on the surveyed terrain.
Now, we want to briefly describe the natural magnetic, electromagnetic, and electric fields. We shall not put a lot of time into this issue and shall try to outline some results from other scholars and formulate our own considerations. Oilfields are well-known to be dynamically active porous systems. The fluids are constantly moving within and interacting both with each other and with the rock walls. As a result of these movements in the reservoir rocks (for example, sandstones), the following effects may arise: (1) interfacial polarization, (2) electronic polarization, (3) orientation polarization, (4) ionic polarization, and others. Sikiru [52] notes that ionic strength has a vital role to play in reservoir sandstones and relies on the interaction between oppositely charged ions. The transport and distribution of ions in reservoir sandstones are dependent on types of salification within the medium and were considered to be affected by the evaporation rate and solubility of the salts in the porous medium.
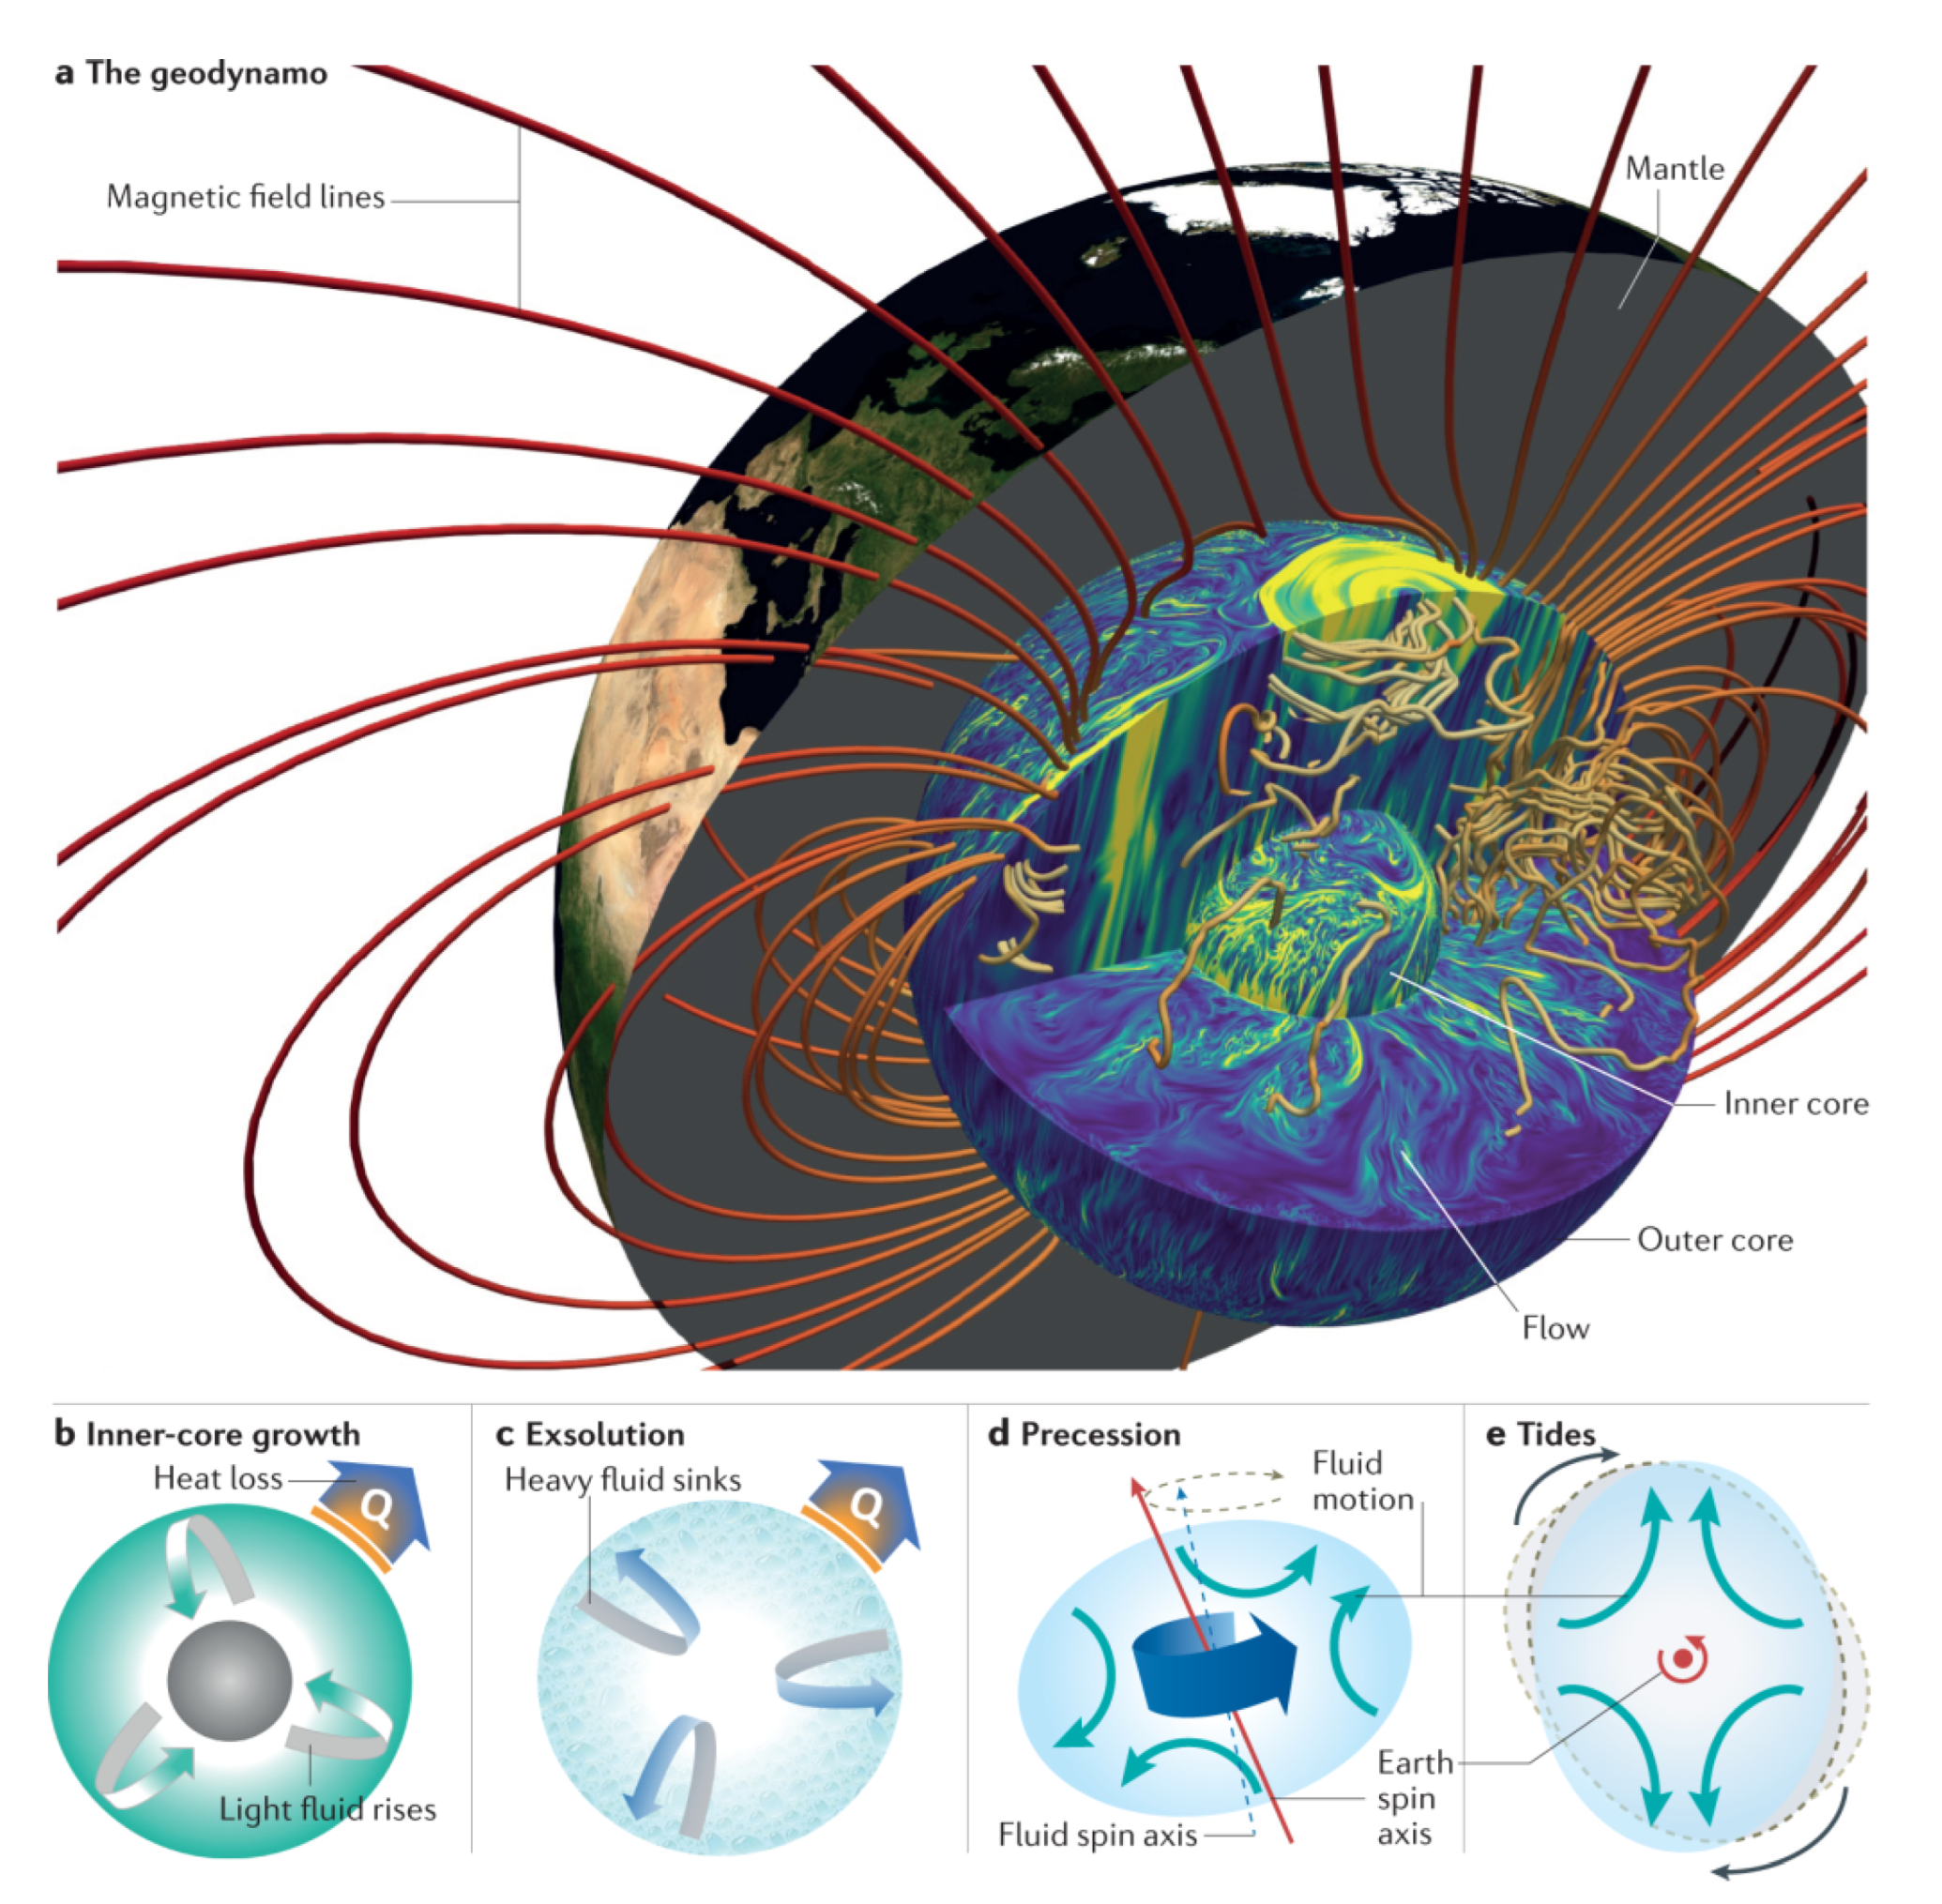
Additionally, it should be remembered that our planet Earth is a huge magnet. Of course, the Earth’s magnetic field strength is several orders of magnitude lower than the strength in our experiment, but we want to present our own considerations on that point. The current theory of geomagnetism is premised on the geomagnetic dynamo model, as shown in Figure 15.
In the context of our study, there is not much of a concern for us as to which processes govern the Earth’s magnetic field and geomagnetic reversals. Within the context of our study, an important aspect is that the geomagnetic field strength on the geomagnetic poles is higher than that on the geomagnetic equator. This means that the field strength is variable on different territories of our planet. Another important aspect is that the Earth’ crust is roughly dielectric, which governs our idea that the geomagnetic field strength 3000 m deep on the geomagnetic poles can be comparable to that in our experiment. Based on this, we can hypothesize that the changes in the Earth’s magnetic field strength in different territories could influence the geochemical behavior of oil over geologic time.
Now, we discuss the statistical analysis of the data from our study. The means method and the maximum difference method were employed to perform a comparison of the initial oil sample and the oil samples treated with the electromagnetic field. The findings demonstrate that the electromagnetic field can influence the essential geochemical characteristics of oil. For instance, Ma at al. [51] were able to divide oils into three classes by using the C27/C29 value in their geochemical comparisons, whereas the n-C26/n-C27 parameter considerably differed in our test samples, although we examined the same oil. Moreover, in the present study, we were able to document changes in the isotopic composition (δ13C) when the oil was electromagnetically treated. The overall isotopic composition of oil did not change, and the differences varied within measurement errors. However, the visual analysis of the variation in the isotopic composition of n-alkanes separately suggests that the electromagnetic exposure resulted in exchanges/changes in the quantity of the carbon isotope (δ13C) in the oil molecules (in n-alkanes). The literature on this topic includes only Buchachenko’s studies, but the scientific community does not find Buchachenko’s findings convincing.
In addition, we managed to establish a correlation between the electromagnetic exposure of oil and the electronic relaxation time; the coefficient of determination, R2, demonstrates a good correlation relationship between these characteristics, but the total concentration of paramagnetic centers is not influenced by the electromagnetic field. This evidences that the concentration of paramagnetic centers in asphaltenes can be advised as a parameter to perform a geochemical correlation, as exemplified hereinabove.

5. Conclusions

The present study demonstrates that electric fields are constantly observed in reservoir systems. Given that electromagnetic, electric, and magnetic fields are similar in the physical sense, it can be speculated that natural electromagnetic fields have an impact on the geochemical behavior of oil. It was discovered herein that the geochemical characteristics of oil, as evaluated by gas chromatography, underwent changes due to electromagnetic exposure, whereas the concentrations of paramagnetic centers in the samples, as determined by the electron paramagnetic resonance method, remained unchanged. In addition, the present study has hypothesized that natural geomagnetic fields can influence the geochemical evolution processes of oil, but this hypothesis requires a deeper study into characteristics of natural geomagnetic fields.

Author Contributions

Conceptualization, A.A.P. and M.R.G.; methodology, O.A.T. and D.A.D.; software, Y.V.V. and M.D.Z.; validation, Y.V.V., M.D.Z. and A.A.P.; formal analysis, O.A.T.; investigation, A.A.P., M.R.G., O.A.T., Y.V.V. and M.D.Z.; resources, M.A.K.; data curation, M.A.K., Y.V.V. and M.D.Z.; writing-original draft preparation, A.A.P., O.A.T. and D.A.D.; writing-review and editing, Y.V.V. and M.D.Z.; visualization, A.A.P. and O.A.T.; supervision, M.D.Z. and M.A.K.; project administration, M.D.Z. and M.A.K.; funding acquisition, M.A.K. All authors have read and agreed to the published version of the manuscript.

Funding

This work was supported by the Ministry of Science and Higher Education of the Russian Federation under the project titled “Low Pressure Gas Extraction Technologies of the Cenomanian Production Complex” (project No. FEWN-2020-0013 for 2020−2022).

Institutional Review Board Statement

Not applicable.

Informed Consent Statement

Not applicable.

Data Availability Statement

Data are available on request through the corresponding author (O.A. Tugushev).

Acknowledgments

The research was carried out using instruments provided by the Centre for Advanced Research and Innovation (Tyumen Industrial University, Tyumen city, Russia) and Centre of the Shared Facilities (Kazan Federal University). The authors give due credit to A.L. Buchachenko for Figure 1, to Z. Shi and co-workers for Figure 13, to X. Ma and co-workers for Figure 14 and to M. Landeau and co-workers for Figure 15.

Conflicts of Interest

The authors declare that they have no known competing financial interest or personal relationship that could have appeared to influence the work reported in this paper.

References

  1. Andreev, P.; Bogomolov, A.; Dobryanskii, A.; Kartsev, A. Transformation of Petroleum in Nature; Elsevier: Amsterdam, The Netherlands, 1968; p. 484. [Google Scholar] [CrossRef]
  2. Kartsev, A.A.; Tabasaransky, Z.A.; Subbota, M.I.; Mogilevskii, G.A. Geochemical Methods of Prospecting and Exploration for Petroleum and Natural Gas; Cambridge University Press: London, UK, 1959; p. 287. [Google Scholar] [CrossRef]
  3. Evans, R.C.; Rogers, M.A.; Bailey, N.J.L. Evolution and Alteration of Petroleum in Western Canada. Chem. Geol. 1971, 8, 147–170. [Google Scholar] [CrossRef]
  4. Bailey, N.J.L.; Krouse, H.R.; Evans, C.R.; Rogers, M.A. Alteration of Crude Oil by Waters and Bacteria: Evidence from eochemical and Isotope Studies. AAPG Bull. 1973, 57, 1276–1290. [Google Scholar] [CrossRef]
  5. Bailey, N.J.L.; Jobson, A.M.; Rogers, M.A. Bacterial Degradation of Crude Oil: Comparison of Field and Experimental Data. Chemistry 1973, 11, 203–221. [Google Scholar] [CrossRef]
  6. Milner, C.W.D.; Rogers, M.A.; Evans, C.R. Petroleum Transformations in Reservoirs. J. Geochem. Explor. 1977, 7, 101–153. [Google Scholar] [CrossRef]
  7. Tissot, B.P.; Welte, D.H. Petroleum Formation and Occurrence: A New Approach to Oil and Gas Exploration. Geol. J. 1979, 116, 243–244. [Google Scholar] [CrossRef]
  8. Cox, A. Plate Tectonics and Geomagnetic Reversal; WH Freeman & Co.: San Francisco, CA, USA, 1973; p. 702. [Google Scholar]
  9. Carbone, V.; Sorriso-Valvo, L.; Vecchio, A.; Lepreti, F.; Veltri, P.; Harabaglia, P.; Guerra, I. Clustering of Polarity Reversals of the Geomagnetic Field. Phys. Rev. Lett. 2006, 96, 128501. [Google Scholar] [CrossRef] [Green Version]
  10. Coe, R.; Prévot, M.; Camps, P. New Evidence for Extraordinarily Rapid Change of the Geomagnetic Field During a Reversal. Nature 1995, 374, 687–692. [Google Scholar] [CrossRef]
  11. Cande, S.C.; Kent, D.V. Revised Calibration of the Geomagnetic Polarity Timescale for the Late Cretaceous and Cenozoic. J. Geophys. Res. 1995, 100, 6093–6095. [Google Scholar] [CrossRef]
  12. Kent, D.V.; Gradstein, F.M. A Jurassic to Recent Chronology. The Geology of North America. Geol. Soc. Am. 1986, M, 45–50. [Google Scholar]
  13. Huestis, S.P.; Acton, G.D. On the Construction of Geomagnetic Timescales from Non-prejudical Treatment of Magnetic Anomaly Data from Multiple Ridges. Geophys. J. Int. 1997, 129, 176–182. [Google Scholar] [CrossRef] [Green Version]
  14. Heirtzler, J.R.; Dickson, G.O.; Herron, E.M.; Pittman, W.C., III; Le Pichon, X. Marine Magnetic Anomalies, Geomagnetic Field Reversals, and Motions of the Ocean floor and Continents. J. Geophys. Res. 1968, 73, 2119–2136. [Google Scholar] [CrossRef]
  15. Chulliat, A.; Macmillan, S.; Alken, P.; Beggan, C.; Nair, M.; Hamilton, B.; Woods, A.; Ridley, V.; Maus, S.; Thomson, A. The US/UK World Magnetic Model for 2015–2020; British Geological Survey (BGS) and National Centers for Environmental Information (NOAA): London, UK, 2015; 112p. [Google Scholar] [CrossRef]
  16. Nowaczyk, N.R.; Arz, H.W.; Frank, U.; Kind, J.; Plessen, B. Dynamics of the Laschamp Geomagnetic xcursion from Black Sea Sediments. Earth Planet. Sci. Lett. 2012, 351–352, 54–69. [Google Scholar] [CrossRef]
  17. Vakhin, A.V.; Khelkhal, M.A.; Mukhamatdinov, I.I.; Mukhamatdinova, R.E.; Tajik, A.; Slavkina, O.V.; Malaniy, S.Y.; Gafurov, M.R.; Nasybullin, A.R.; Morozov, O.G. Changes in Heavy Oil Saturates and Aromatics in the Presence of Microwave Radiation and Iron-Based Nanoparticles. Catalysts 2022, 12, 514. [Google Scholar] [CrossRef]
  18. Vakhin, A.V.; Khelkhal, M.A.; Tajik, A.; Gafurov, M.R.; Morozov, O.G.; Nasybullin, A.R.; Karandashov, S.A.; Ponomarev, A.A.; Krapivnitskaia, T.O.; Glyavin, M.Y.; et al. The Role of Nanodispersed Catalysts in Microwave Application during the Development of Unconventional Hydrocarbon Reserves: A Review of Potential Applications. Processes 2021, 9, 420. [Google Scholar] [CrossRef]
  19. Jing, J.Q.; Shi, W.; Wang, Q.; Zhang, B.G. Viscosity-reduction mechanism of waxy crude oil in low-intensity magnetic field. Energy Sources Part A Recovery Util. Environ. Eff. 2019, 44, 5080–5093. [Google Scholar] [CrossRef]
  20. Davletbaev, A.; Kovaleva, L.; Babadagli, T. Mathematical Modeling and Field Application of Heavy Oil Recovery by Radio-Frequency Electromagnetic Stimulation. J. Pet. Sci. Eng. 2011, 78, 646–653. [Google Scholar] [CrossRef]
  21. Hasanvand, M.Z.; Golparvar, A. A Critical Review of Improved Oil Recovery by Electromagnetic Heating. Pet. Sci. Technol. 2014, 32, 631–637. [Google Scholar] [CrossRef]
  22. Pivovarova, N.A.; Unger, F.G.; Tumanyan, B.P. Effect of a Constant Magnetic Field on the Paramagnetic Activity of Petroleum Systems. Chem. Technol. Fuels Oils 2002, 38, 381–385. [Google Scholar] [CrossRef]
  23. Demidov, V.N.; Ivanov, E.V.; Zarembo, Y.V. Supramolecular Association in Liquid Mediums within the Thermodynamic Cluster-continuum Model. Chem. Ind. 2003, 80, 34–43. [Google Scholar]
  24. Martyanov, O.N.; Larichev, Y.V.; Morozov, E.V.; Trukhan, S.N.; Kazarian, S.G. The Stability and Evolution of Oil Systems Studied via Advanced Methods in Situ. Russ. Chem. Rev. 2017, 86, 999. [Google Scholar] [CrossRef]
  25. Mehrabi-Kalajahi, S.S.; Varfolomeev, M.A.; Yuan, C.; Emelianov, D.A.; Khayarov, K.R.; Klimovitskii, A.I.; Rodionov, A.A.; Orlinskii, S.B.; Gafurov, M.R.; Afanasiev, I.S.; et al. EPR as a Complementary Tool for the Analysis of Low-Temperature Oxidation Reactions of Crude Oils. J. Pet. Sci. Eng. 2018, 169, 673–682. [Google Scholar] [CrossRef]
  26. Gafurov, M.; Mamin, G.; Gracheva, I.; Murzakhanov, F.; Ganeeva, Y.; Yusupova, T.; Orlinskii, S. High-Field (3.4 T) ENDOR Investigation of Asphaltenes in Native Oil and Vanadyl Complexes by Asphaltene Adsorption on Alumina Surface. Geofluids 2019, 2019, 3812875. [Google Scholar] [CrossRef] [Green Version]
  27. Gafurov, M.R.; Ponomarev, A.A.; Mamin, G.V.; Rodionov, A.A.; Murzakhanov, F.F.; Arash, T.; Orlinskii, S.B. Application of pulsed and high-frequency electron paramagnetic resonance techniques to study petroleum disperse systems. Georesursy Georesources 2020, 22, 2–14. [Google Scholar] [CrossRef]
  28. Gafurov, M.R.; Mamin, G.V.; Zverev, D.G. Modernization of the X-band EPR spectrometer Bruker ElexSys E580 for dynamic nuclear polarization. Magn. Reson. Solids 2021, 23, 21202. [Google Scholar] [CrossRef]
  29. Buchachenko, A.L. New Isotopy in Chemistry and Biochemistry; Russian Academy of Sciences, Monograph: Moscow, Russia, 2007; p. 189. [Google Scholar]
  30. Buchachenko, A.L. Magnetic Isotopy: New Horizons. Her. Russ. Acad. Sci. 2010, 80, 22–28. [Google Scholar] [CrossRef]
  31. Buchachenko, A.; Berdinskii, V. Spin Catalysis as a New Type of Catalysis in Chemistry. Russ. Chem. Rev. 2004, 73, 1033. [Google Scholar] [CrossRef]
  32. Buchachenko, A.; Molin, Y.; Sagdeev, R.; Salikhov, K.; Frankevich, E.L. Magnetic Spin Effects in Chemical Reactions. Uspekhi Fiz. Nauk. 1987, 151, 173. [Google Scholar] [CrossRef]
  33. Salikhov, K.M.; Molin, Y.N.; Sagdeev, R.Z.; Buchachenko, A.L. Spin Polarization and Magnetic Effects in Radical Reactions. “Studies in Physical and Theoretical Chemistry”; Elsevier Scientific Publ. Comp.: Amsterdam, The Netherlands, 1984; Volume 22, p. 419. [Google Scholar] [CrossRef]
  34. Ponomarev, A.A.; Golozubenko, V.A.; Hafizov, F.Z.; Savchenkov, A.L. Savchenkov Experimental Studies of Mechanism for Oil Heavy Fractions Cracking from the Bazhenov Suite. Period. Tche Quim. 2018, 15, 198–205. [Google Scholar]
  35. Ponomarev, A.A. The mechanism of cracking hydrocarbons in electromagnetic fields—to the question of oil in Bazhenov formation. Oil Gas Stud. 2019, 1, 14–18. (In Russian) [Google Scholar] [CrossRef]
  36. Nesterov, I.I.; Alexandrov, V.M.; Ponomaryov, A.A.; Zavatsky, M.D.; Lobodenko, E.I.; Kobylinsky, D.A.; Kadyrov, M.A. Experimental Studies of Radical Reactions of Hydrocarbons Conversion. Oil Gas Stud. 2019, 4, 57–69. [Google Scholar] [CrossRef]
  37. Bazhenova, O.K.; Burlin, Y.K.; Sokolov, B.A.; Khain, V.E. Geologiya I Geokhimiya Goryuchikh Iskopaemykh Geology and Geochemistry of Fossil Fuels, 3rd ed.; Moscow State University: Moscow, Russia, 2004. (In Russian) [Google Scholar]
  38. Bray, E.; Evans, E.D. Distribution of n-paraffins as a Clue to Recognition of Surce Beds. Geochim. Et Cosmochim. Acta 1961, 22, 2–15. [Google Scholar] [CrossRef]
  39. Philippi, G.T. On the Depth, Time and Mechanism of Petroleum Generation. Geochim. Et Cosmochim. Acta 1965, 29, 1021–1049. [Google Scholar] [CrossRef]
  40. Kontorovich, A.E.; Kostyreva, E.A.; Sarayev, S.V.; Melenevsky, V.N.; Fomin, A.N. Geochemistry of the Organic Matter of the Cambrian Pre-Yenisei Subprovince (based on the results of drilling Vostok-1 and Vostok-3 cores). Geol. Geophys. 2011, 52, 737–750. [Google Scholar]
  41. Poturay, V.A.; Kompanichenko, V.N. Composition and Distribution of Saturated Hydrocarbons in the Thermal Waters and Vapor–water Mixture of the Mutnovskii Geothermal Field and Uzon Caldera, Kamchatka. Geohimia 2019, 64, 79–88. [Google Scholar]
  42. Galimov, E.M.; Sevastianov, V.S.; Kamaleyeva, A.I.; Kuznetsova, O.V.; Konopleva, I.V.; Vlasova, L.N.; Karpov, G.A. Hydrocarbons From a Volcanic Area, Oil Seeps in the Uzon Caldera, Kamchatka. Geochem. Int. 2015, 53, 1019–1027. [Google Scholar] [CrossRef]
  43. Pevneva, G.S.; Fursenko, E.A.; Voronetskaya, N.G.; Mozhaiskaya, M.V.; Golovko, A.K.; Nesterov, I.I.; Kashirtsev, V.A.; Shevchenko, N.P. Hydrocarbon Composition and Structural Characteristics of Resins and Asphaltenes of Naphtene Oils of Northern West Siberia. Geol. Geophys. 2017, 58, 522–532. [Google Scholar] [CrossRef]
  44. Koons, C.B.; Peirce, F.L.; Bond, J.G. Effects of Depositional Environment and Postdepositional History on Chemical Composition of Lower Tuscaloosa Oils: Abstract. AAPG Bull. 1972, 56, 633–634. [Google Scholar] [CrossRef]
  45. Zubkov, M.Y. Mineral Composition and Presence of δ13C in Fissured Carbonate Rocks of the Bazheno-Abalak Complex of West Siberia. Geol. Oil Gas 2017, 6, 67–81. [Google Scholar]
  46. Magomedov, S.A.; Mamayev, O.A.; Chuplaev, C.M.; Rasulov, G.S. Determining the Maturity of Oil by the Isotopic Composition of Methane Carbon. In Proceedings of the All-Russian Conference “New Ideas in Oil-and-Gas Geology”, Moscow State University, Moscow, Russia, 25–26 May 2017; pp. 95–199. Available online: http://www.spsl.nsc.ru/FullText/cdrom/HoвыеГеoлИдеи2017.pdf (accessed on 11 June 2022).
  47. Djimasbe, R.; Varfolomeev, M.A.; Al-muntaser, A.A.; Yuan, C.; Suwaid, M.A.; Feoktistov, D.A.; Rakhmatullin, I.Z.; Milovankin, A.A.; Murzakhanov, F.; Morozov, V. Deep Insights into Heavy Oil Upgrading Using Supercritical Water by a Comprehensive Analysis of GC, GC–MS, NMR, and SEM–EDX with the Aid of EPR as a Complementary Technical Analysis. ACS Omega 2021, 6, 135–147. [Google Scholar] [CrossRef]
  48. Kuznetcov, I.; Kantzas, A.; Bryant, S. Electro-acoustic excitation of the interface. Adv. Colloid Interface Sci. 2020, 283, 102217. [Google Scholar] [CrossRef]
  49. Hassan, Y.M.; Guan, B.H.; Zaid, H.M.; Hamza, M.F.; Adil, M.; Adam, A.A.; Hastuti, K. Application of magnetic and dielectric nanofluids for electromagnetic-assistance enhanced oil recovery: A review. Crystals 2021, 11, 106. [Google Scholar] [CrossRef]
  50. Shi, Z.; Dou, L.; Shi, J.; Bai, J.; Xue, L.; Chen, B.; Wang, L. Geochemical characteristics of crude oils and hydrocarbon accumulation in the Palogue Oilfield, Melut Basin, South Sudan. J. Afr. Earth Sci. 2022, 195, 104642. [Google Scholar] [CrossRef]
  51. Ma, X.; Wei, L.; Hou, D.; Xu, C.; Man, Y.; Li, W.; Wu, P. Geochemical Characteristics of Three Oil Families and Their Possible Source Rocks in the Sub-Sag A of Weixinan Depression, Beibuwan Basin, Offshore South China Sea. ACS Omega 2022, 7, 24795–24811. [Google Scholar] [CrossRef]
  52. Sikiru, S. Ionic transport and influence of electromagnetic field interaction within electric double layer in reservoir sandstone. J. Mol. Liq. 2021, 344, 117675. [Google Scholar] [CrossRef]
  53. Landeau, M.; Fournier, A.; Nataf, H.C.; Cébron, D.; Schaeffer, N. Sustaining Earth’s magnetic dynamo. Nat. Rev. Earth Environ. 2022, 3, 255–269. [Google Scholar] [CrossRef]
Figure 1. Fractionation of 13C and 12C isotopes by photolysis of dibenzyl ketone. (Adapted with permission from Ref. [30], 2010, A.L. Buchachenko.)
Processes 10 02376 g001
Figure 2. A schematic diagram of a 50 Hz electromagnetic oil treatment test setup.
Processes 10 02376 g002
Figure 3. Chromatograms: (a) untreated oil and (b) oil after a 50 min exposure to the electromagnetic field.
Processes 10 02376 g003
Figure 4. A time profile of N-alkane concentration of oil samples.
Processes 10 02376 g004
Figure 5. Changes in the geochemical characteristics of samples after an electromagnetic exposure.
Processes 10 02376 g005
Figure 6. A time course of δ13C in samples exposed to an electromagnetic field.
Processes 10 02376 g006
Figure 7. Isotopic (δ13C) changes of sample components.
Processes 10 02376 g007
Figure 8. W-band EPR spectra and their simulations assuming the existence of a single axial symmetry center exhibiting two g-factor values: before (left) and after EM treatment (right).
Processes 10 02376 g008
Figure 9. The means of the difference modulus of geochemical characteristics of oil (untreated and treated with the electromagnetic field) as per gas chromatography data.
Processes 10 02376 g009
Figure 10. The maxima of the difference modulus of geochemical characteristics of oil (untreated and treated with the electromagnetic field) as per gas chromatography data.
Processes 10 02376 g010
Figure 11. Electronic relation time T1 plotted against the electromagnetic exposure time of oil.
Processes 10 02376 g011
Figure 12. Electronic relation time T2 plotted against the electromagnetic exposure time of oil.
Processes 10 02376 g012
Figure 13. The distribution of n-alkanes of oil samples in the Palogue oilfield and the Moleeta and Jamous lows. (Adapted with permission from Ref. [50], 2022, Z. Shi.)
Processes 10 02376 g013
Figure 14. Comparison of geochemical characteristics of oil: (a) Ph/nC17 plotted against Pr/nC18 and (b) Pr/Ph plotted against C27/C29 (Adapted with permission from Ref. [51], 2022, X. Ma.)
Processes 10 02376 g014
Figure 15. (a) The three-layer structure of Earth’s interior. The rocky mantle overlies a metallic core. The core, which is essentially made of iron, is divided into a liquid outer core and a solid inner core. The flow of liquid metal sustains dynamo action. The magnetic field lines (red to yellow lines) and the velocity field strength (blue to yellow) are taken from a direct numerical simulation of the dynamo driven by turbulent convection. (be) Candidate mechanisms that may drive the geodynamo in the outer core. (b) Convection driven by core cooling and inner-core growth. The heat Qcmb leaving the core leads to the solidification of the inner core, releasing light elements at the base of the outer core. At the outer edge of the core, cooling releases a cool, denser fluid that sinks into the deeper core. (c) Convection driven by the exsolution of light oxides such as MgO or SiO2. The iron-rich liquid released at the top of the core sinks into the core. (d) Precession makes the fluid rotate along an axis (blue) that is different from the mantle rotation axis (red); a secondary circulation (teal arrows) is induced by the non-spherical shape. (e) Tides induce a deformation that rotates around the liquid core over approximately one day, inducing a recirculation. (Adapted with permission from Ref. [53], 2022, M. Landeau.)
Processes 10 02376 g015
Table 1. Electronic relaxation times for the test samples.
SampleT1 (µs)T2 (ns)
Untreated21.3 (3)610 (20)
EM treatment 10 min.22.2 (3)620 (20)
EM treatment 20 min.24.6 (4)640 (20)
EM treatment 40 min.25.2 (3)635 (20)
EM treatment 50 min.24.8 (3)660 (20)
EM treatment 60 min.26.2 (4)690 (20)
Publisher’s Note: MDPI stays neutral with regard to jurisdictional claims in published maps and institutional affiliations.