Article

Mechanics-Seepage Experimental and Simulation Study of Gas-Bearing Coal under Different Load Paths

1
School of Safety Engineering, Heilongjiang University of Science and Technology, Harbin 150022, China
2
Heilongjiang Longmei Jixi Mining Co., Ltd., Jixi 158199, China
*
Author to whom correspondence should be addressed.
Processes 2022, 10(11), 2255; https://doi.org/10.3390/pr10112255
Submission received: 9 October 2022 / Revised: 30 October 2022 / Accepted: 31 October 2022 / Published: 2 November 2022
(This article belongs to the Special Issue Process Safety in Coal Mining)

Abstract

:
Mechanics-seepage synchronous tests on gas-bearing coal under three different stress paths were designed and implemented to evaluate how load path affected the mechanical strength and permeability of deep mining-disturbed coal. The cracks-count evolution of coal specimens during instability was observed through DEM numerical simulation. The results showed significant stress-strain and strength variations under different paths. At the time of failure, the specimen deformation and peak strength were Test 1 > Test 2 > Test 3, while the permeability was Test 3 > Test 2 > Test 1, with specimen permeability in Test 3 rising prominently. From numerical simulation, the cracks count was Test 2 > Test 3 > Test 1, with tensile cracks taking the largest proportion in Test 2 and shear cracks taking the largest proportion in Test 3. Our findings shed some light on the research and disaster prevention regarding coal and gas outburst.

1. Introduction

Coal and gas outburst, as a major cause of gas hazards in coal mines, results from a very complex dynamic instability process at underground mine sites [1,2]. When such a hazard occurs, the gas adsorption/desorption and seam stress-strain at the outburst site undergo tremendous change. The gas also affects the deformed coal body, causing it to change further [3,4,5]. Currently, the mechanisms underlying coal and gas outburst remain unsolved. Wider investigation into the mechanical properties and seepage behavior of gas-bearing coal under stress-seepage coupling is of great importance.
As field testing is impractical, given the high risk factor of seams prone to coal and gas outburst, experimental study of coal-gas coupling mechanisms forms the fundamental means of understanding coal permeability evolution and damage mechanisms [6,7]. Xu et al. [8,9] experimentally characterized coal deformation and permeability under loading/unloading conditions and revealed that coal permeability variation is closely related to coal deformation and damage. Yin et al. [10] evaluated the effect of loading/unloading conditions on the mechanical properties of gas-bearing coal and established a whole process seepage speed–axial pressure equation. Wang et al. [11] studied the dynamic behaviors in coal seams under different mining layouts. Zhao et al. and Wang et al. [12,13] analyzed the relationship between coal permeability, stress difference and strain during loading/unloading through whole-process stress-strain permeability tests. Li et al. [14] observed the deformation and permeability behaviors of outburst coal samples under cyclic loads and found that permeability variation is closely related to coal damage and deformation. Cao et al. [15] analyzed how confining pressure and axial pressure affect coal gas seepage under constant gas pressure. Xue et al. [16] performed uniaxial tension and compression, conventional triaxial and dynamics tests, and obtained the mechanical characteristic parameters and deformation failure behaviors of coal samples under different load paths and load rates.
The discrete element method (DEM) is an important numerical method of solving coal mechanical problems due to its ability to assess coal mechanics and crack mechanisms from a mesoscopic perspective [17,18,19]. Indraratna et al. [20] made cyclic biaxial simulation tests at different frequencies with DEM software. They also analyzed the evolution of meso-mechanical parameters such as contact force and bond force formed during cyclic loading and explained the mechanism of particle fracture. Wang et al. [21] simulated crack propagation with a PFC-based particle flow model and observed how coal stress affects crack propagation. Jiang et al. [22] simulated a series of biaxial compression tests with DEM and observed the mechanical behavior of deep-sea methane-hydrate-bearing soils. Ismail et al. [23] built a DEM model for visualizing damage evolution and predicting failure envelopes of composite laminae under biaxial loads. Yang et al. [24] numerically simulated the failure behavior around a circular opening under biaxial compression. Sagong et al. [25] made experimental and numerical analyses of the sliding of fissures and joints in fissure-bearing rock under biaxial compression. Raisianzadeh et al. [26] used DEM to simulate the interaction between particles under biaxial load, and studied the crack propagation path and failure strength of rock containing prefabricated cracks Xu et al. [27] studied the influence of the angle between two cracks on the strength and crack propagation of the specimen.
From the literature review above, both physical experiments and numerical simulations help to understand the mechanisms behind coal and gas outburst. However, few attempts have been made to combine physical experiments with numerical simulation. In this paper, the deformation failure and gas-seepage behavior of briquette specimens under different stress paths are tested. The test results are then verified through particle flow code (PFC) numerical simulation. Specimen-crack evolution under different paths is also characterized. Our method offers a new approach to understanding the mechanisms behind coal and gas outburst.

2. Experimental Section

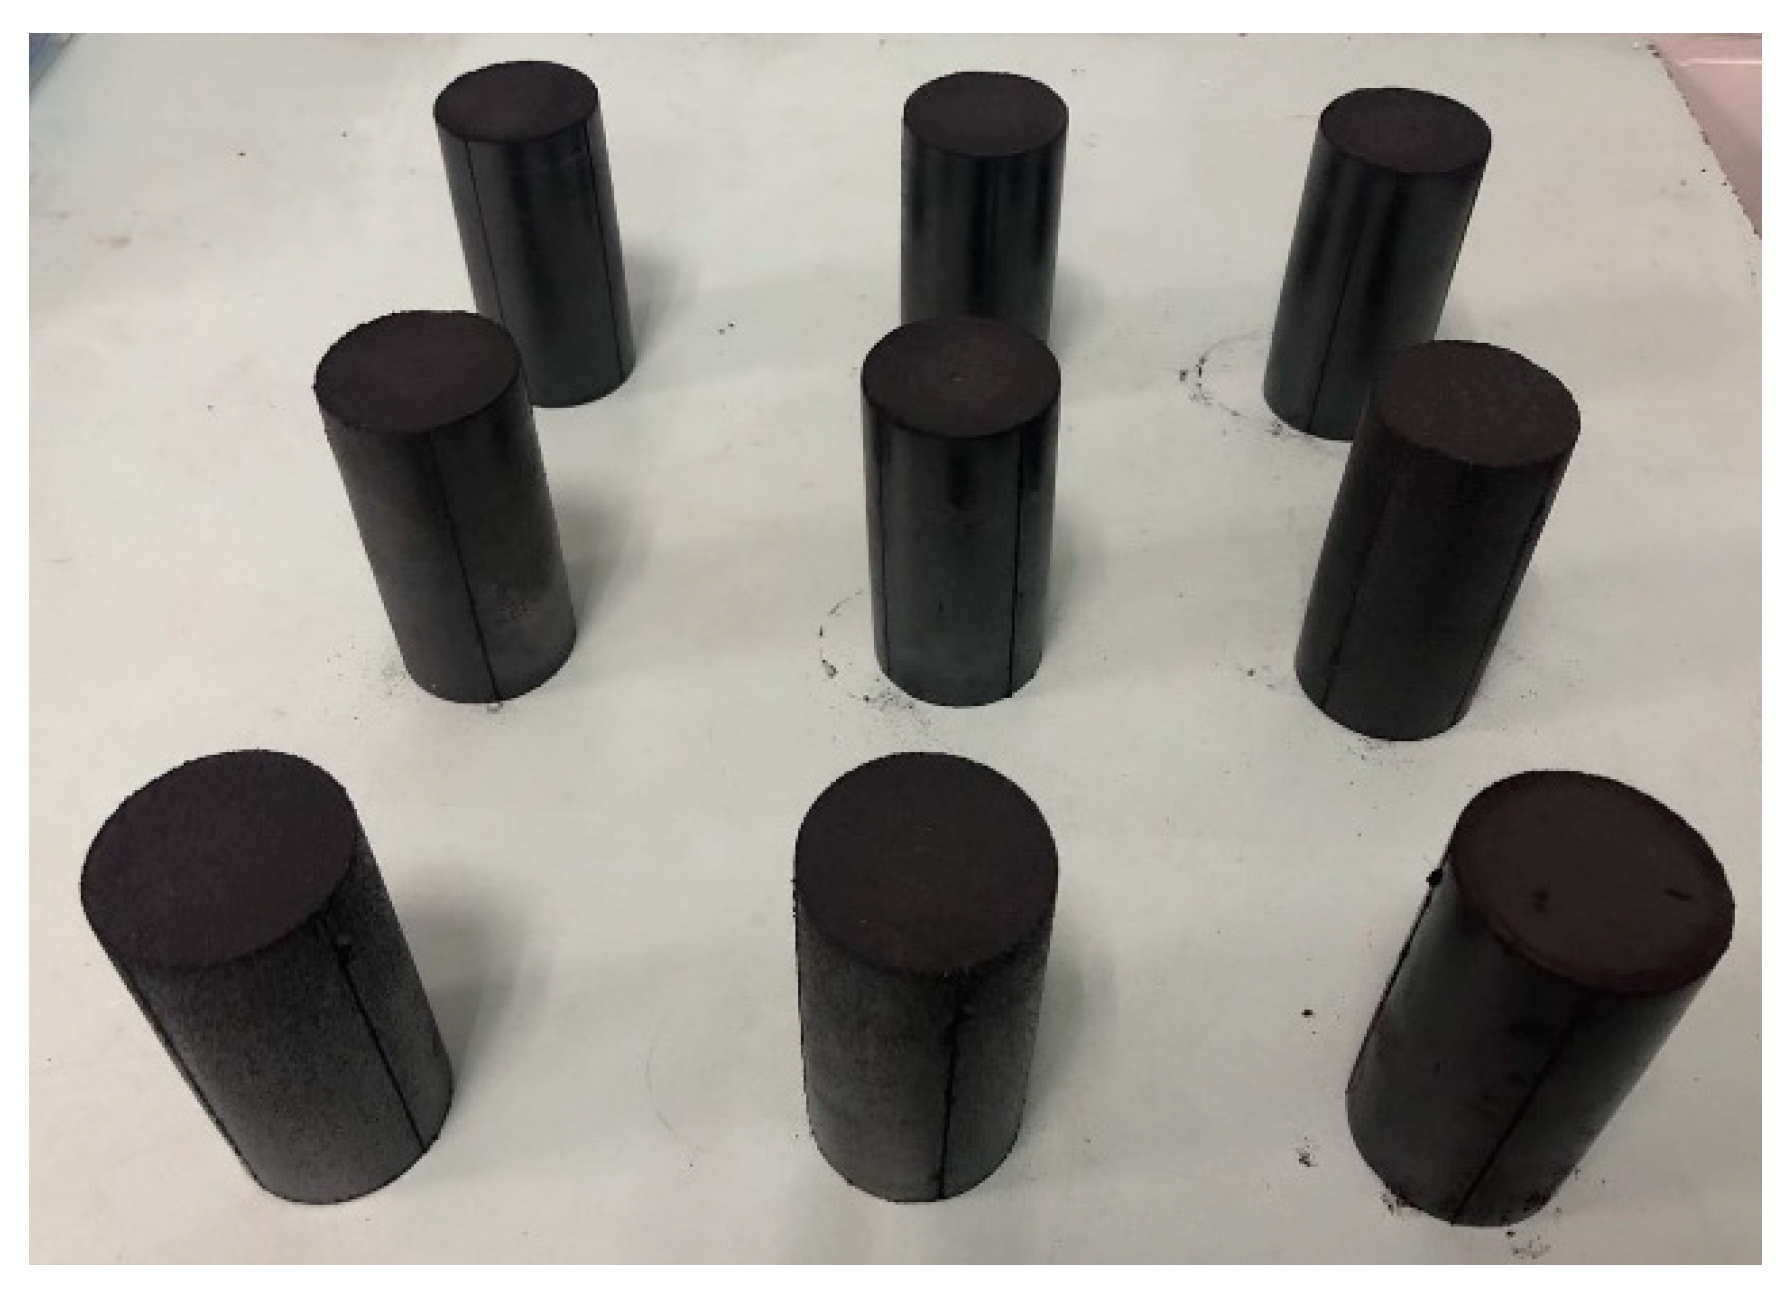
2.1. Specimen Procurement and Preparation

The structural complexity of raw coal can give rise to substantial discreteness of test results. Previous studies have demonstrated that briquette, in one way or another, possesses the physical–mechanical and adsorption properties of raw coal. It is also easy to transport and handle. For this reason, briquette is often used in laboratory studies as a substitute for raw coal [28].
The coal sample came from Jixi Mining Group’s Xinfa coal mine, which is a high-gas mine. The sample has an ash content of 61.28%, a volatile content of 22.9%, and a solidity factor of 0.5866. After the sample was recovered from the mine face, it was sealed and delivered to the laboratory where it was crushed. When preparing specimens, 30 g river sand, 30 g cement, 210 g crushed coal, and 30 g water were mixed together and kept under 200 kN moulding pressure for 12 h before the specimens were demoulded and placed in a curing box for further use. Figure 1 shows the ready-made briquette specimens.

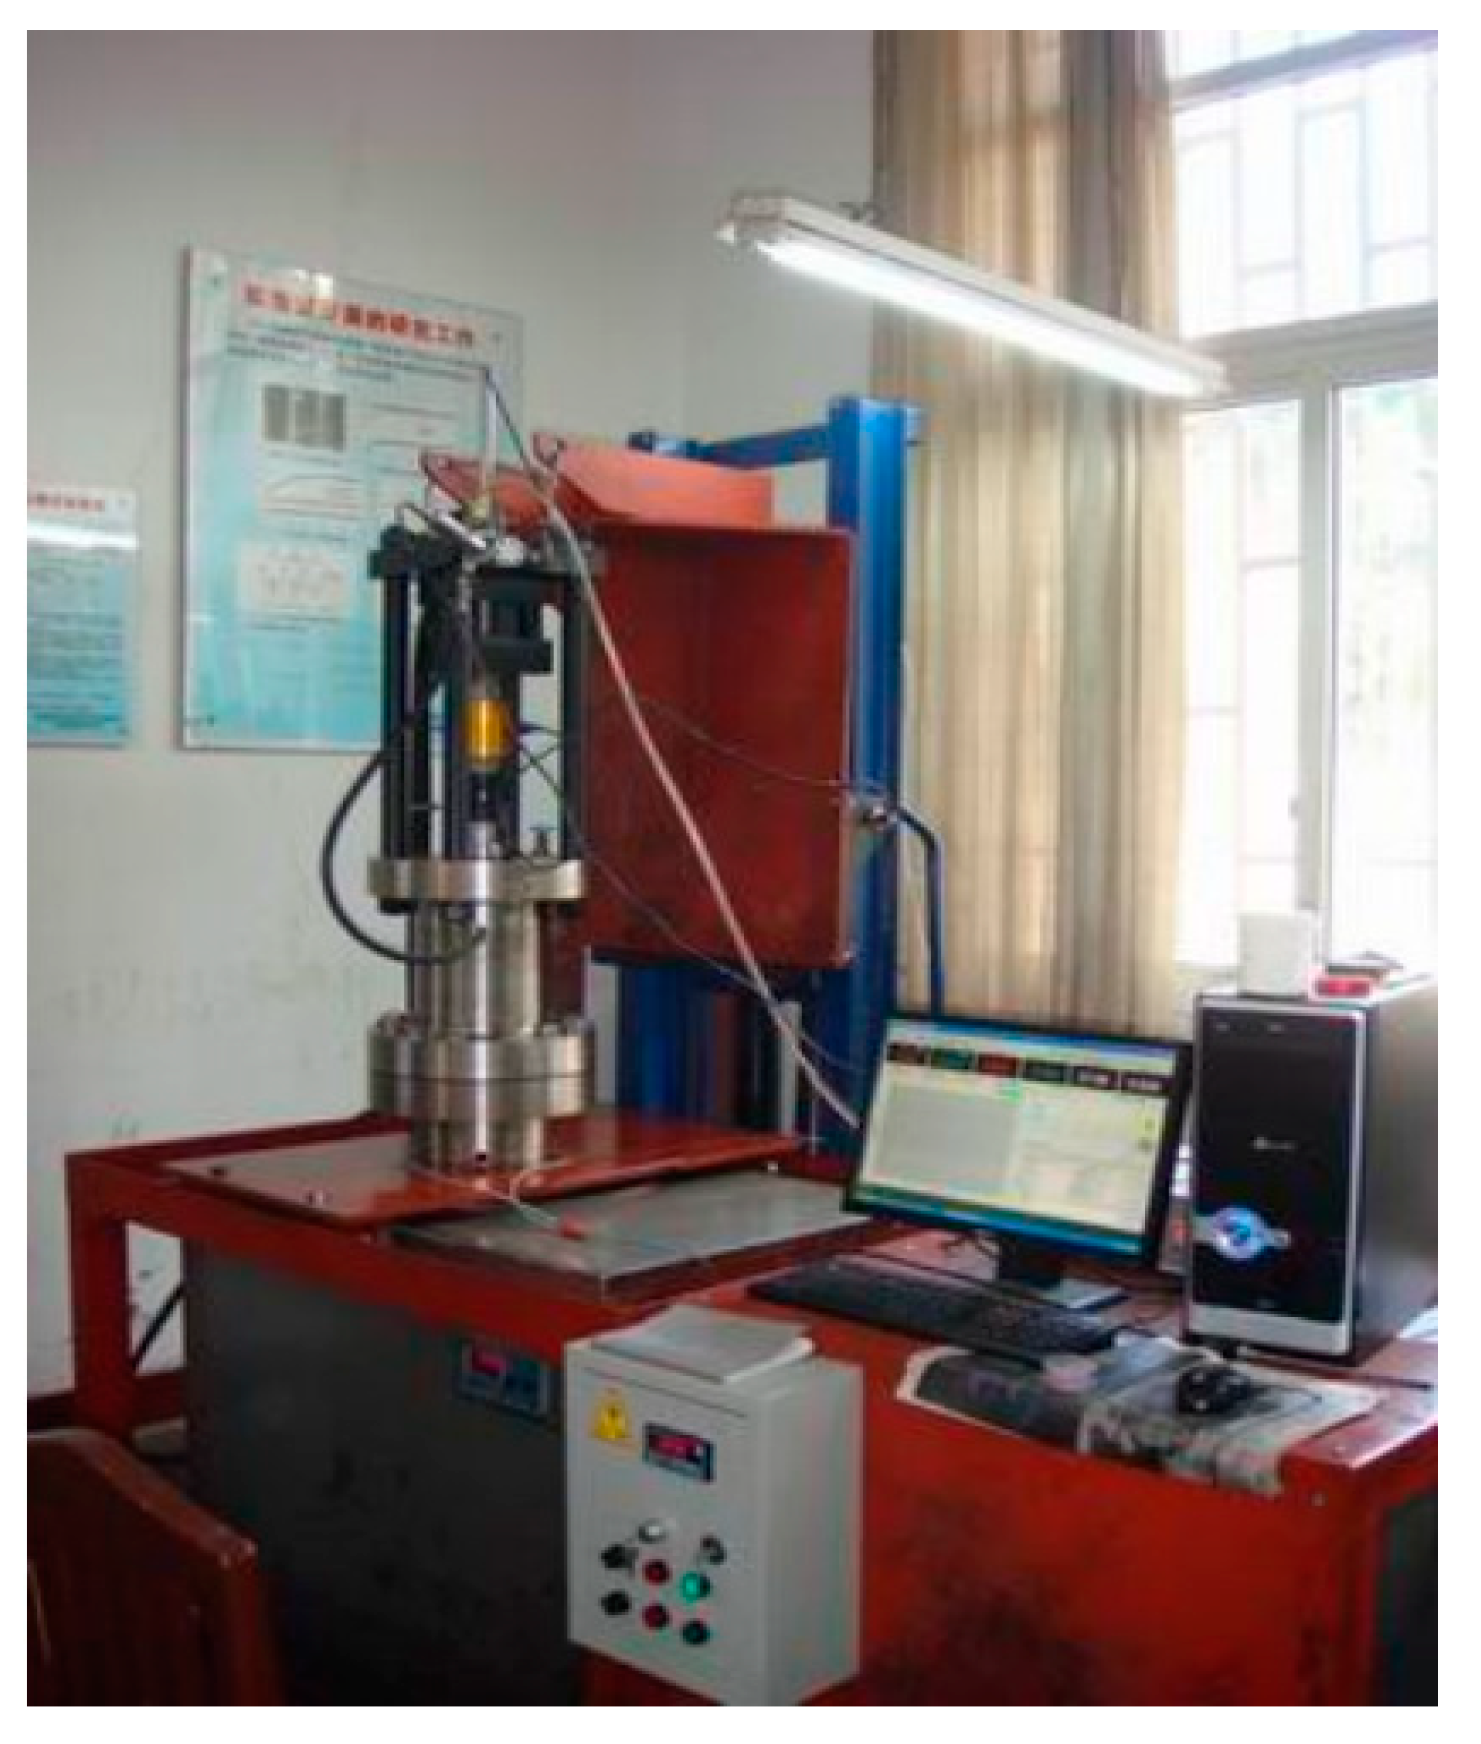
2.2. Experimental Apparatus

A triaxial servo-controlled seepage apparatus for thermofluid–solid coupling of gas-bearing coal shown in Figure 2 was used for the test, featuring ϕ50 mm × 100 mm standard specimens [9].

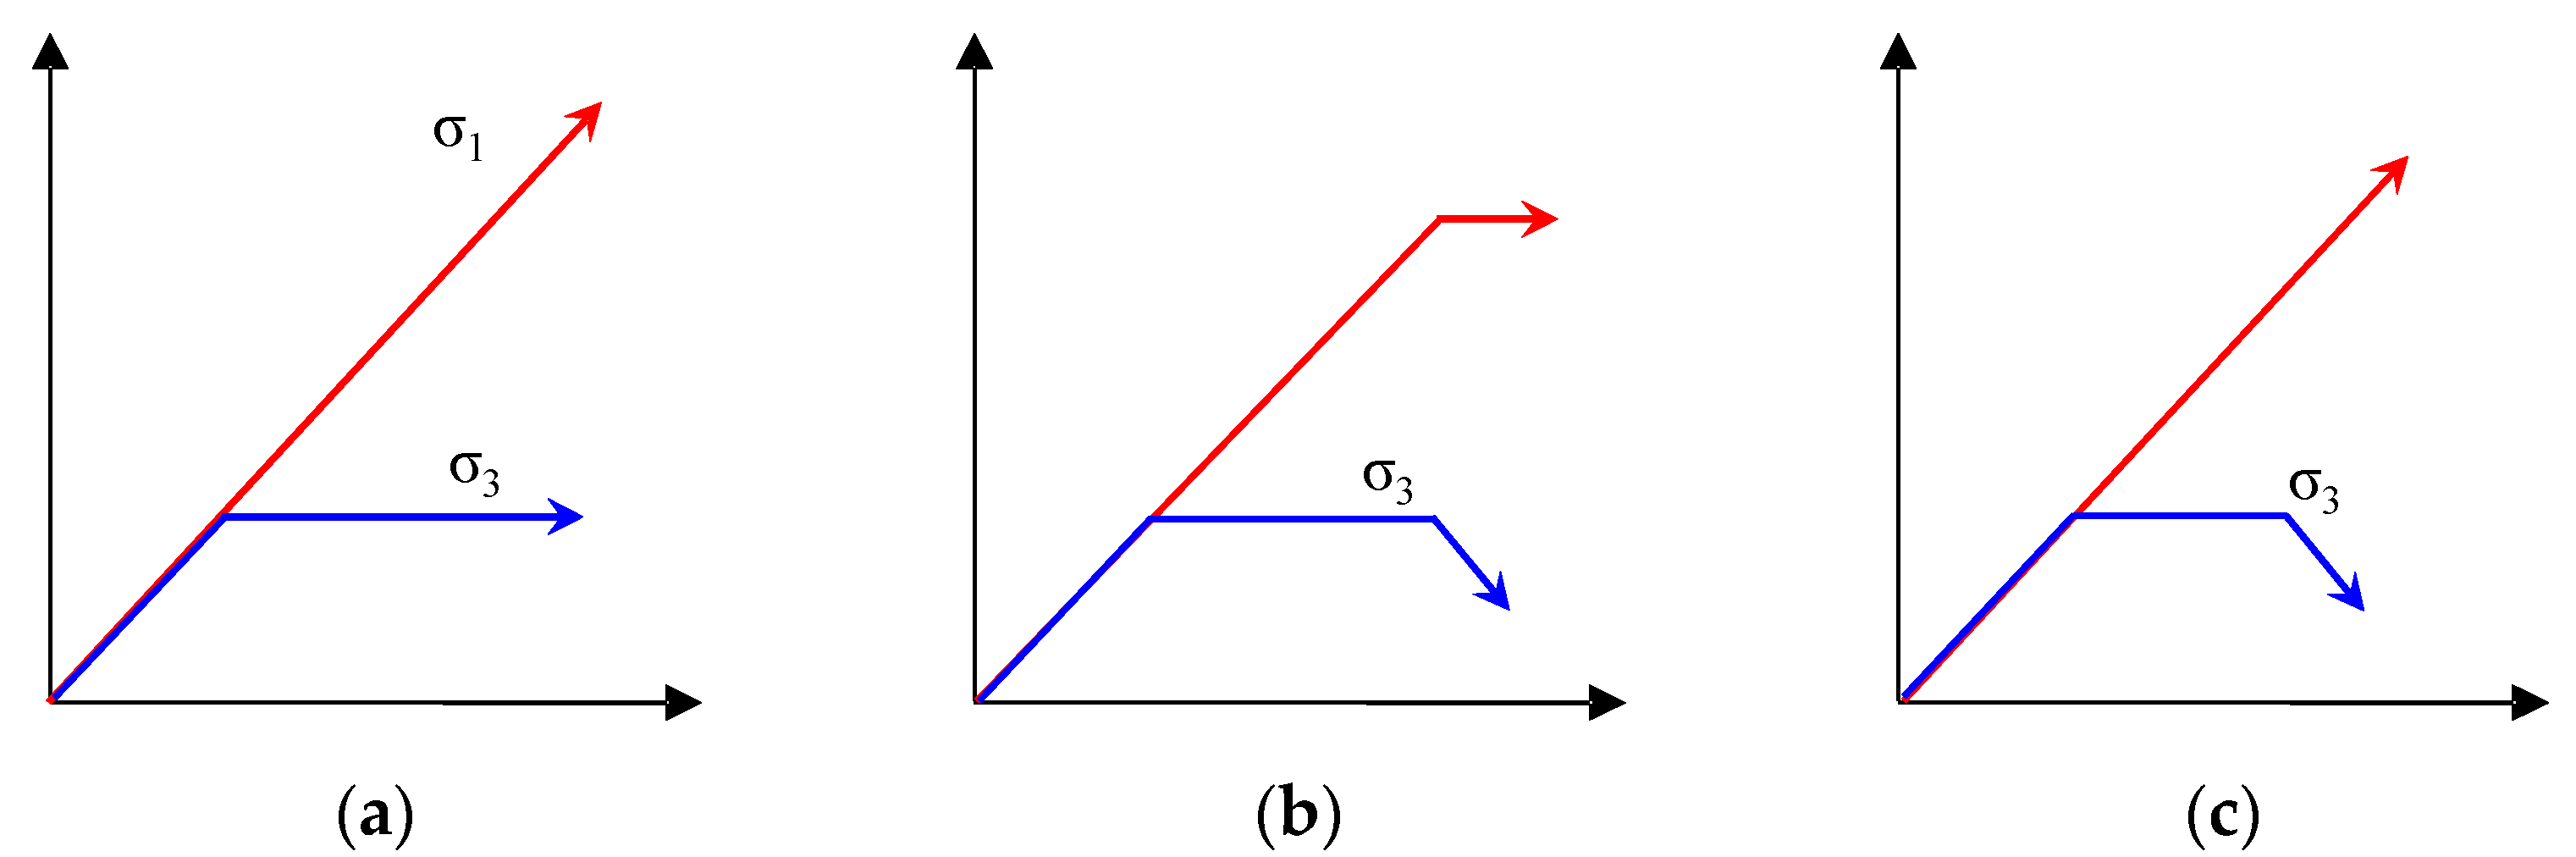
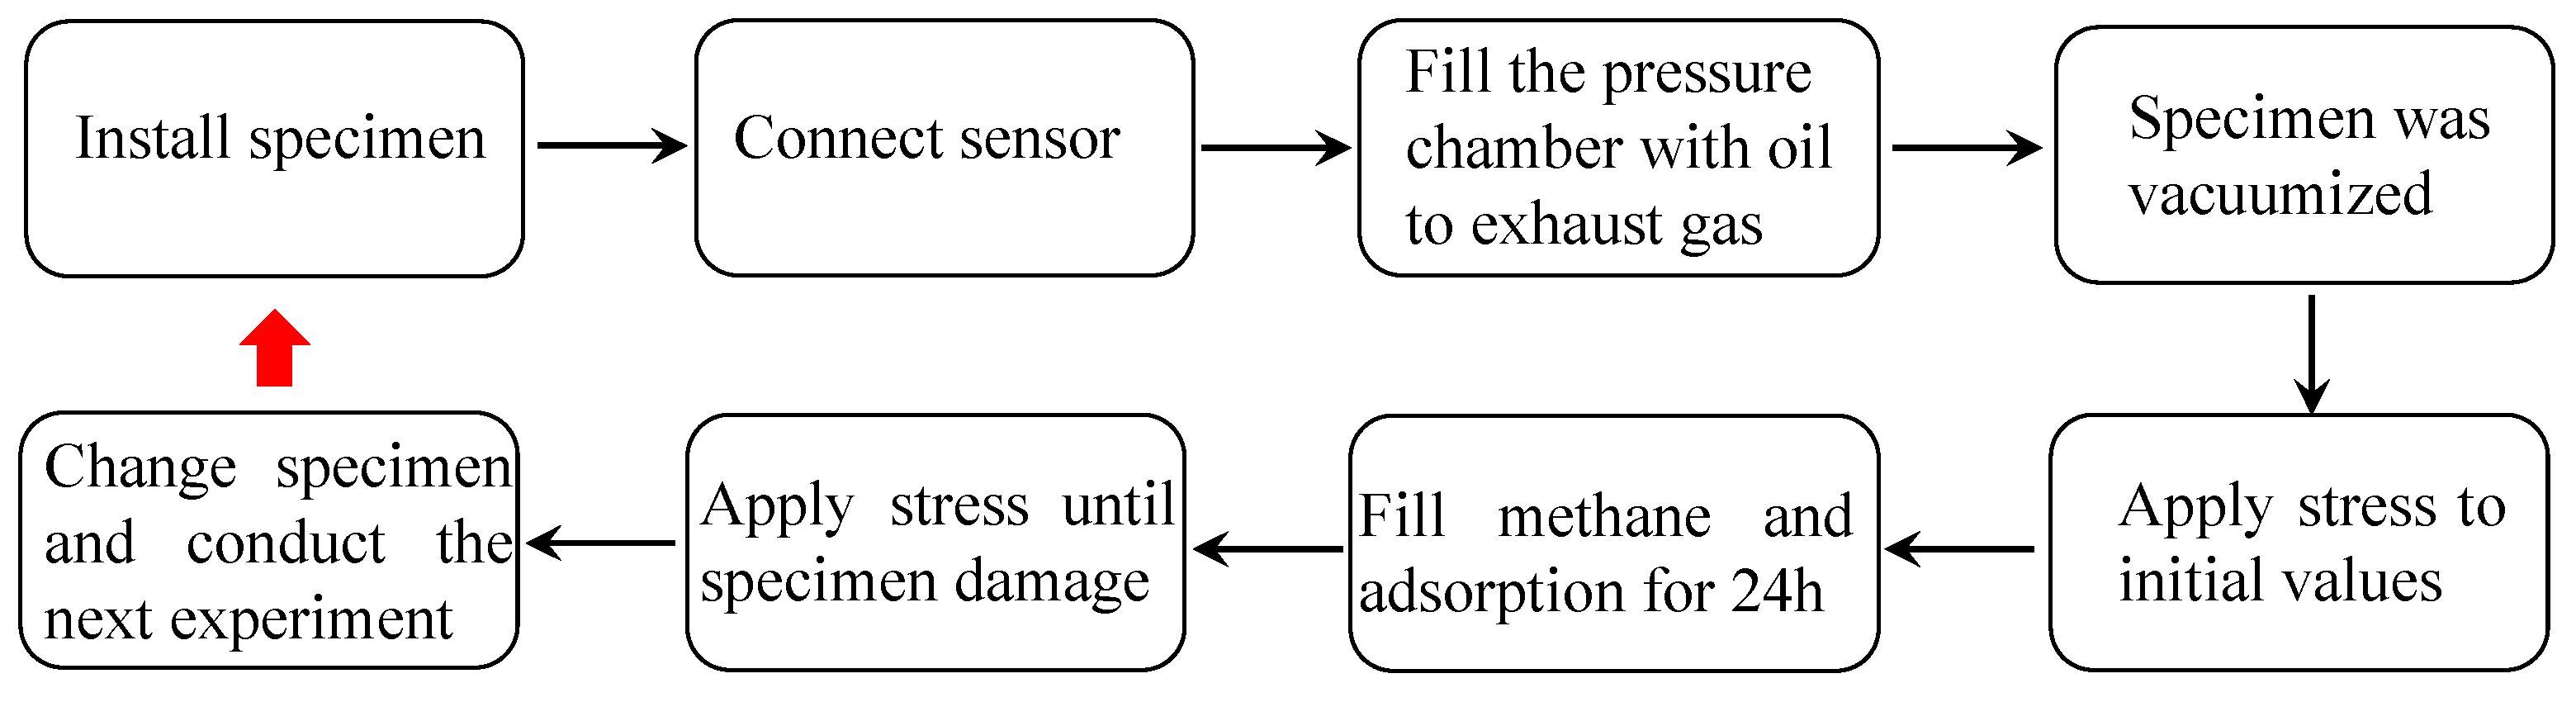
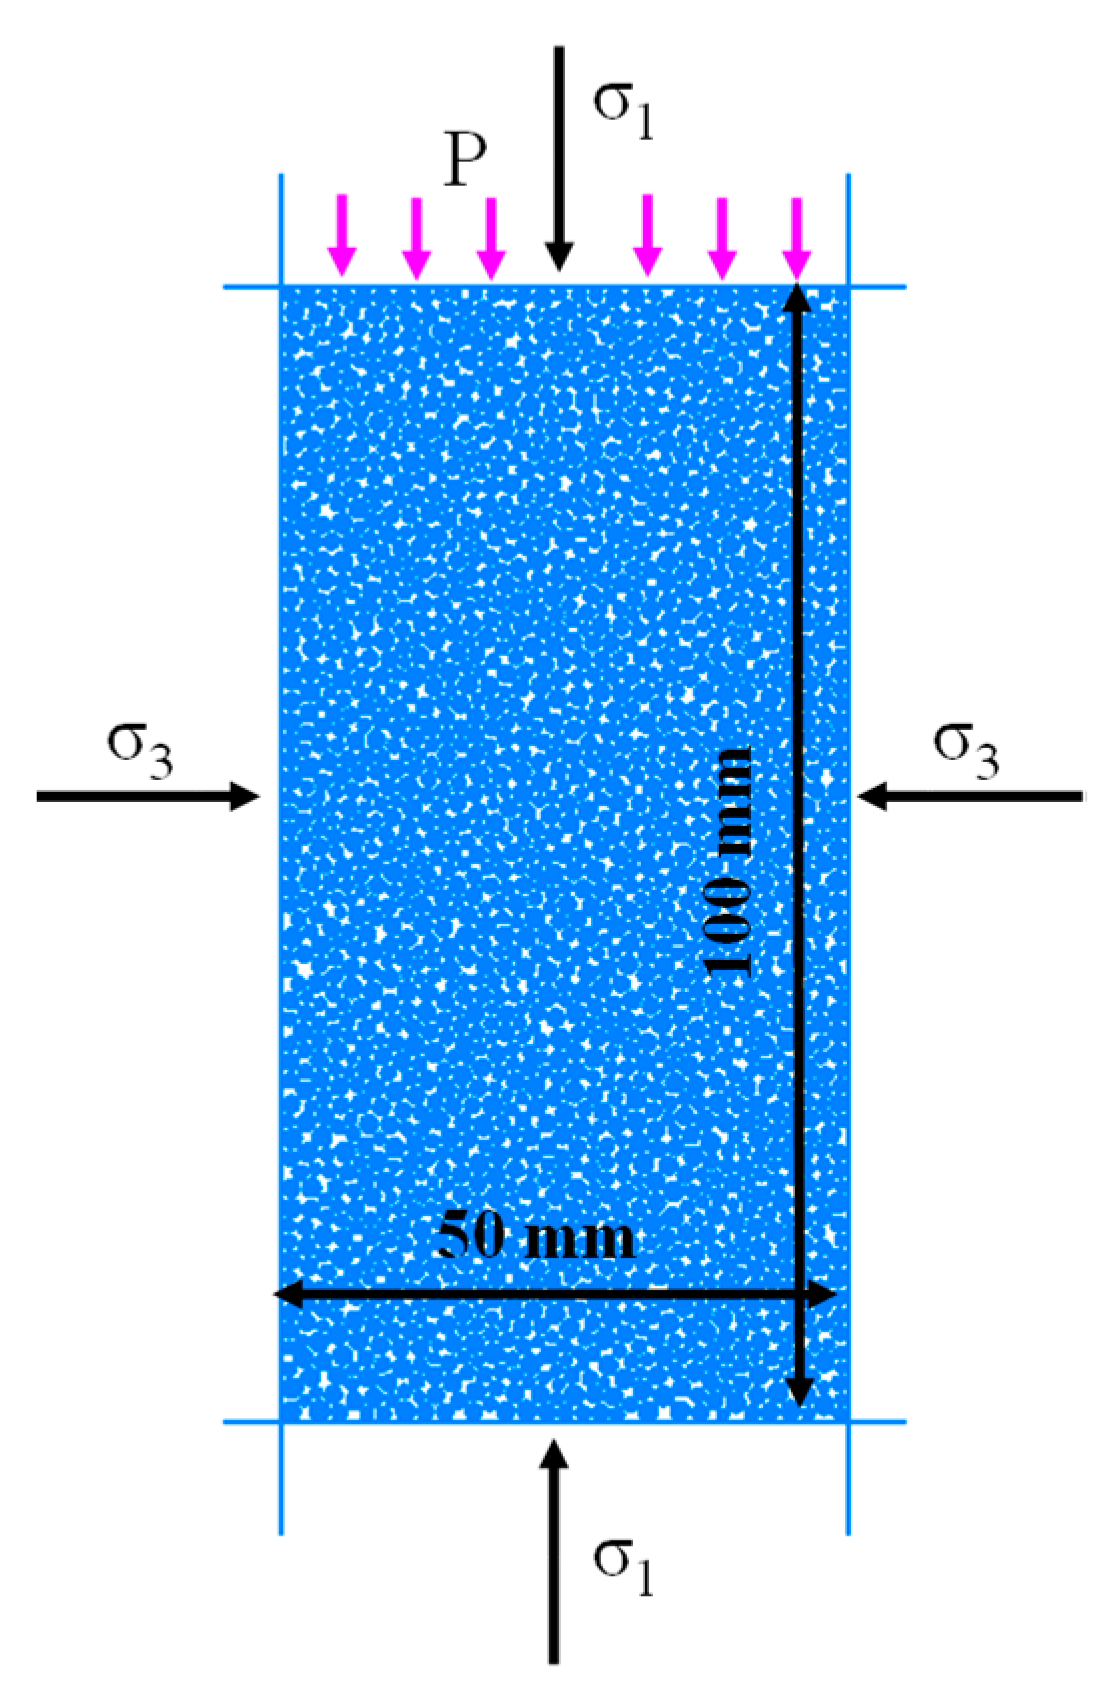
2.3. Experimental Methods

The real load state of mining-disturbed coal at deep levels was simplified into three load paths: axial pressure loading in Test 1, confining pressure unloading in Test 2, and composite loading/unloading in Test 3, as shown in Figure 3, where σ1 represents axial pressure and σ3 represents confining pressure, and the flow chart for the experiment is shown in Figure 4. The exact test plan is described below:
Test 1: Load σ1 and σ3 to 6 MPa, then feed 1 MPa gas. After adsorption for 24 h, load σ1 at the rate of 5 kN/s until the specimen fails. Conduct gas seepage test at the same time.
Test 2: Load σ1 and σ3 to 6 MPa, then feed 1 MPa gas. After adsorption for 24 h, load σ1 to σU (which is 60% of the peak axial stress in Test 1) at the rate of 5 kN/s, keep σ1 unchanged and unload σ3 at the rate of 0.01 mm/min until the specimen fails. Conduct gas seepage test at the same time.
Test 3: Load σU in the same steps as Test 2, then keep the loading rate of σ1 unchanged and unload σ3 at the rate of 0.01 mm/min until the specimen fails. Conduct gas seepage test at the same time.

3. Results and Analysis

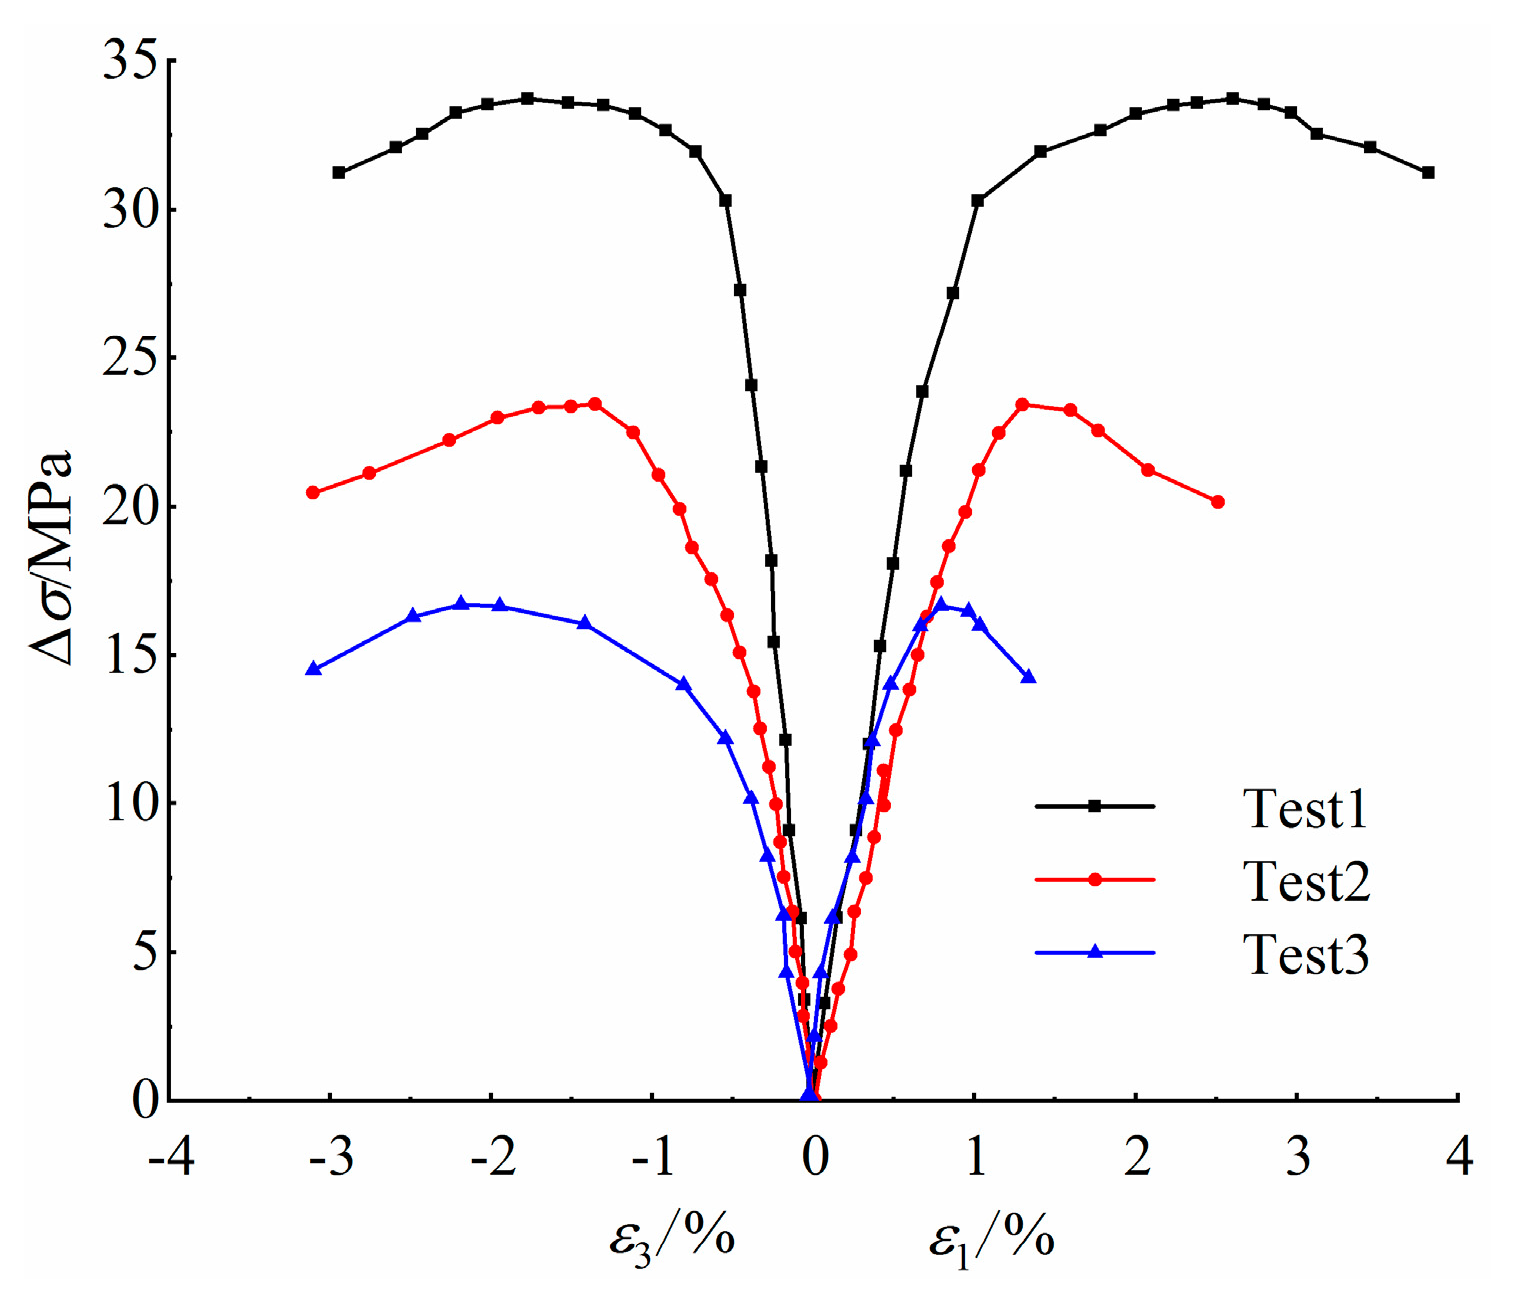
3.1. Strain and Strength Characteristics

Figure 5 compares the stress-strain relationship of specimens under the true-triaxial path, where ε1 and ε3 are the axial strain and radial strain of the specimen, and Δσ is the principal stress difference, i.e., σ1σ3. From these diagrams, the stress-strain curves of gas-bearing coal are much the same under the three paths. They all involve five stages: compaction, linear elasticity, plastic deformation, stress decline, and residual stress. Stress path is shown to have a strong impact on the deformation and strength of gas-bearing coal. In Test 1, the specimen strength is the highest, with stress difference of 33.750 MPa. In Test 2, the specimen strength is the second highest, with stress difference of 23.480 MPa. In Test 3, the specimen strength is the lowest, with stress difference of 16.711 MPa. The specimen-bearing capacity is greatly reduced.
At peak strength, ε1 and ε3 are 2.607 and −1.771 in Test 1; 1.301 and −1.354 in Test 2; and 0.793 and −2.186 in Test 3. In Test 1, the axial strain is the largest. In Test 3, the axial strain is the smallest, but the radial strain is the largest. At peak strength, the axial-to-radial strain ratios of the specimens are 1.472, 0.961, and 0.363. The gradual reduction in the axial-to-radial strain ratio indicates that, during instability, the axial deformation intensifies and the specimen is more prone to axial failure, especially in Test 3, where the specimen has a strong shear dilatancy. Also, by observing the stress-strain curves, it can be seen that the post-peak curve slope gradually increases. In Test 2 and Test 3, with the unloading of confining pressure, the strain increment gradually increases. When this increase has accumulated to a limit, the bearing capacity declines and the specimen immediately becomes unstable. This is particularly obvious in Test 3, where the specimen gradually changes from ductile failure to brittle failure.

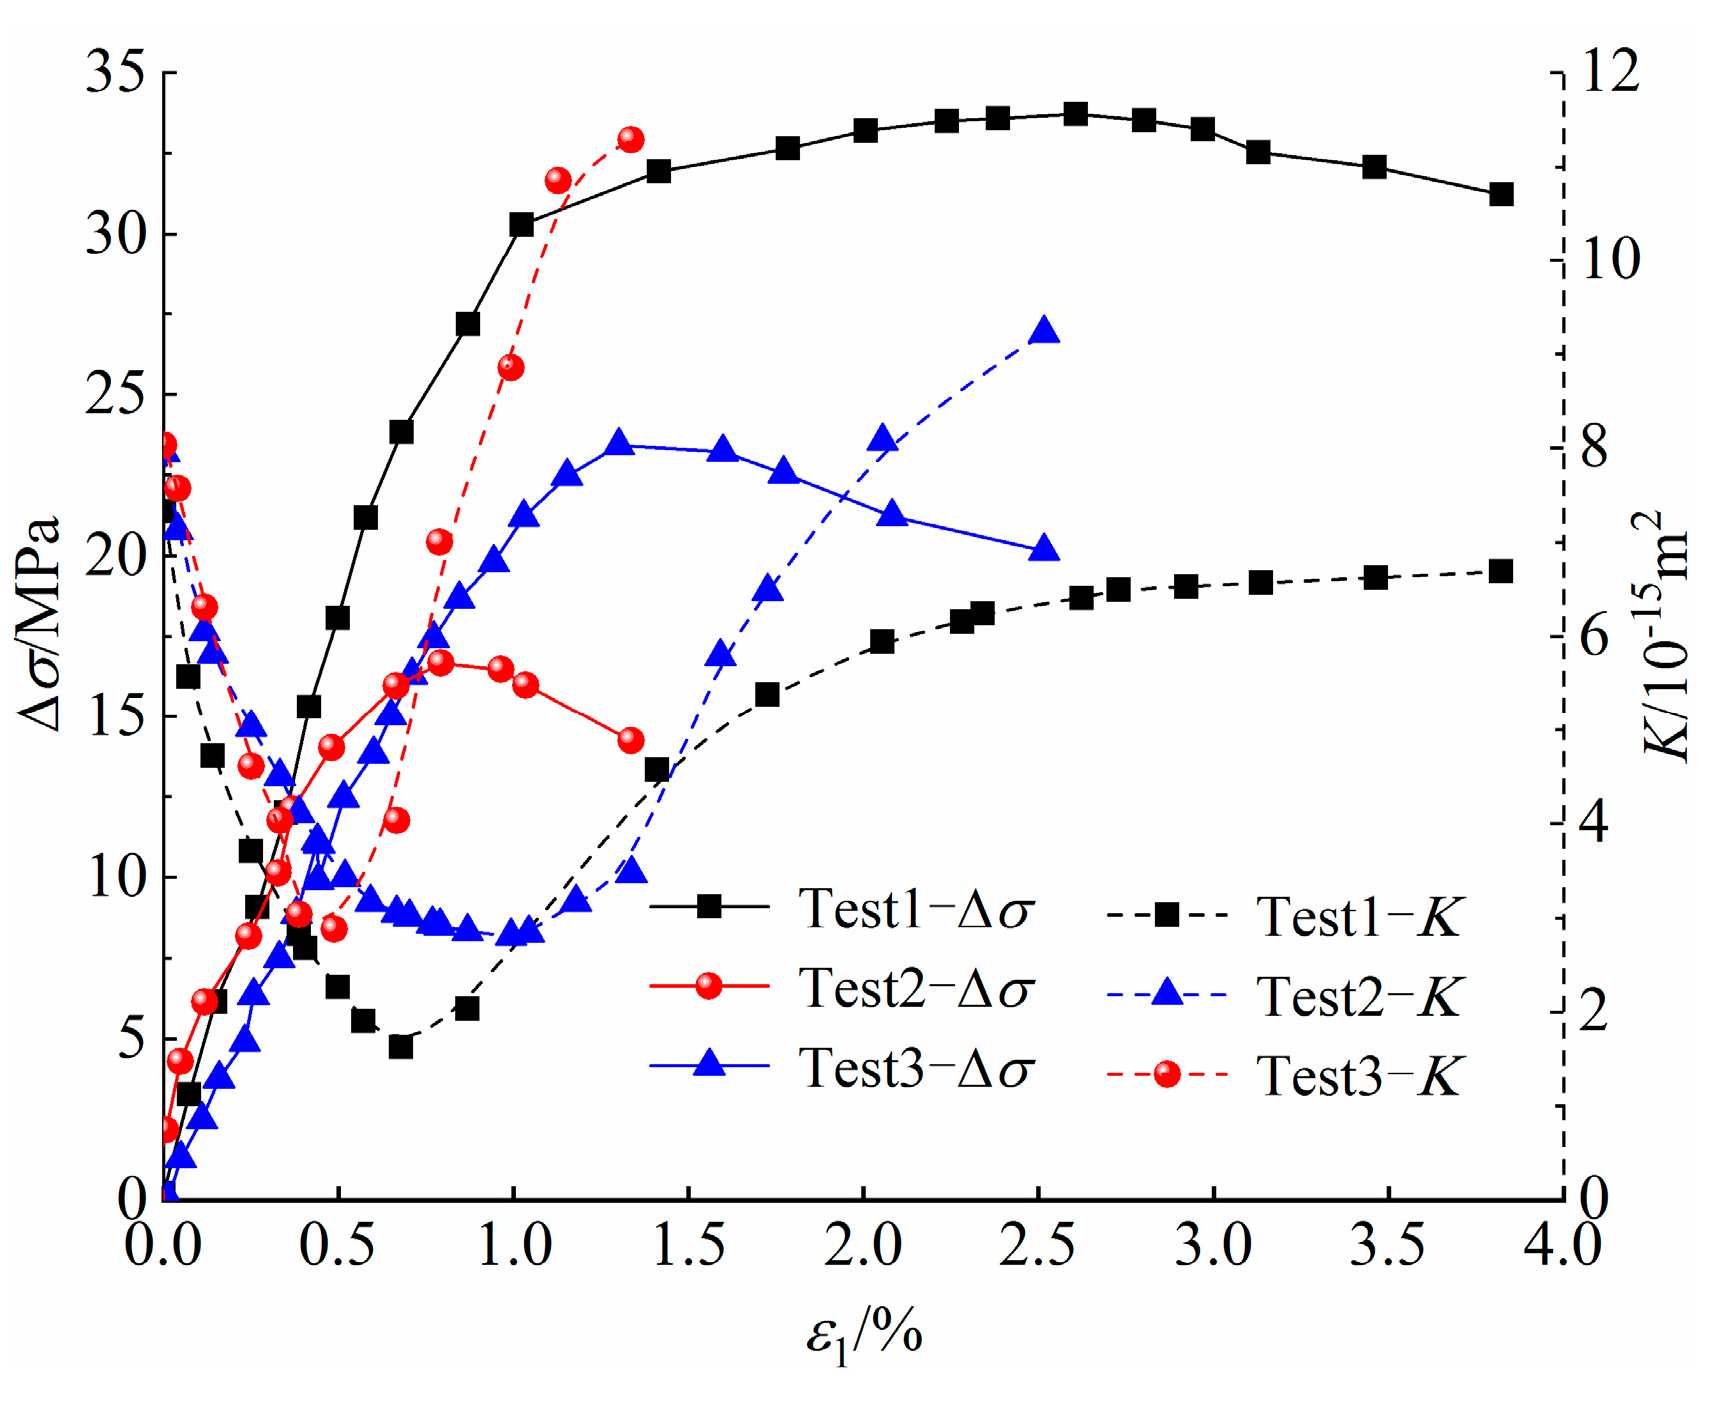
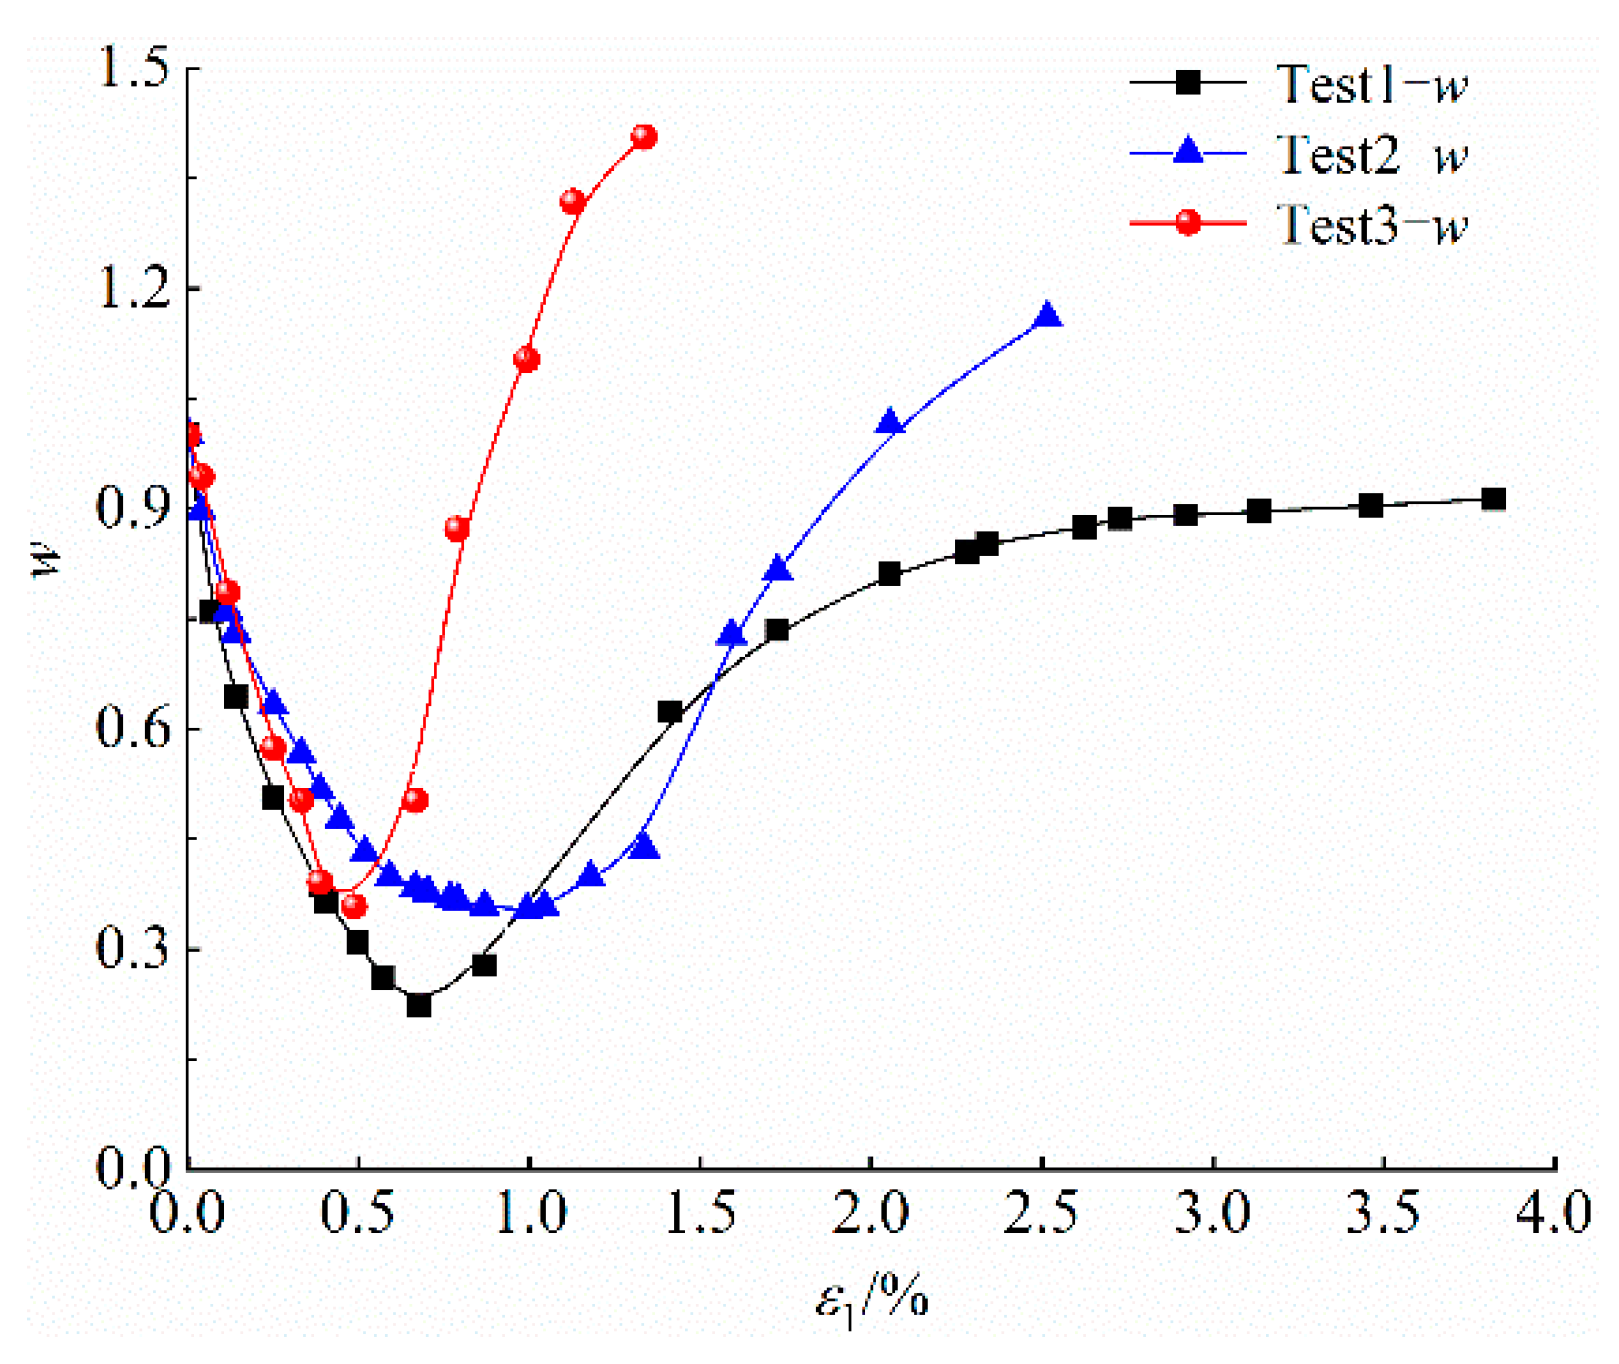
3.2. Permeability Evolution Characteristics

Gas seepage in the specimens obeys Darcy’s law. Permeability is calculated by the following formula [29]:
K = 2 P 0 Q μ L A ( P 1 2 P 2 2 )
where K is permeability (m2); Q is the gas flow (m3/s); μ is the absolute viscosity of the methane; L is the specimen length (m); A is the effective area of permeability (m2); P0 prime is standard atmosphere; P1 is the inlet pressure (MPa); and P2 is outlet pressure (MPa).
Figure 6 compares the principal stress difference and permeability variations of gas-bearing coal as a function of axial strain under different test paths. From the ε1–Δσ and ε1K curves, as the test goes on, permeability first reduces then increases; the valley deflection of permeability falls before the peak deflection of the ε1–Δσ curve in all cases. This is because, during elastic deformation at the beginning of the test, with the loading of external stress, the primary pores and fissures inside the specimen are compressed, which narrows the gas seepage pathway and brings down the permeability. With the loading of σ1, the specimen enters plastic deformation. Cracks begin to develop inside and damage is expanded, adding more seepage pathways and stepping up permeability. After that, with the further increase of σ1, cracks inside become interconnected, leading to instability failure. The gas seepage pathway is opened and the permeability soars.
Relative permeability (w) variations were observed against initial permeability to examine how stress path affects permeability evolution. From the diagram in Figure 7, under Test 1, the specimen permeability variation is modest, with minimum w of 0.222, which increases marginally to 0.913 at the end of the test. Under Test 2, w is 0.353 minimum and 0.358 maximum. Under Test 3, w is 0.370 minimum and 1.405 maximum. Compared with the other paths, the specimen permeability variation is the largest at the end of the test under composite loading/unloading path, proving that the specimen is more badly damaged under this path.

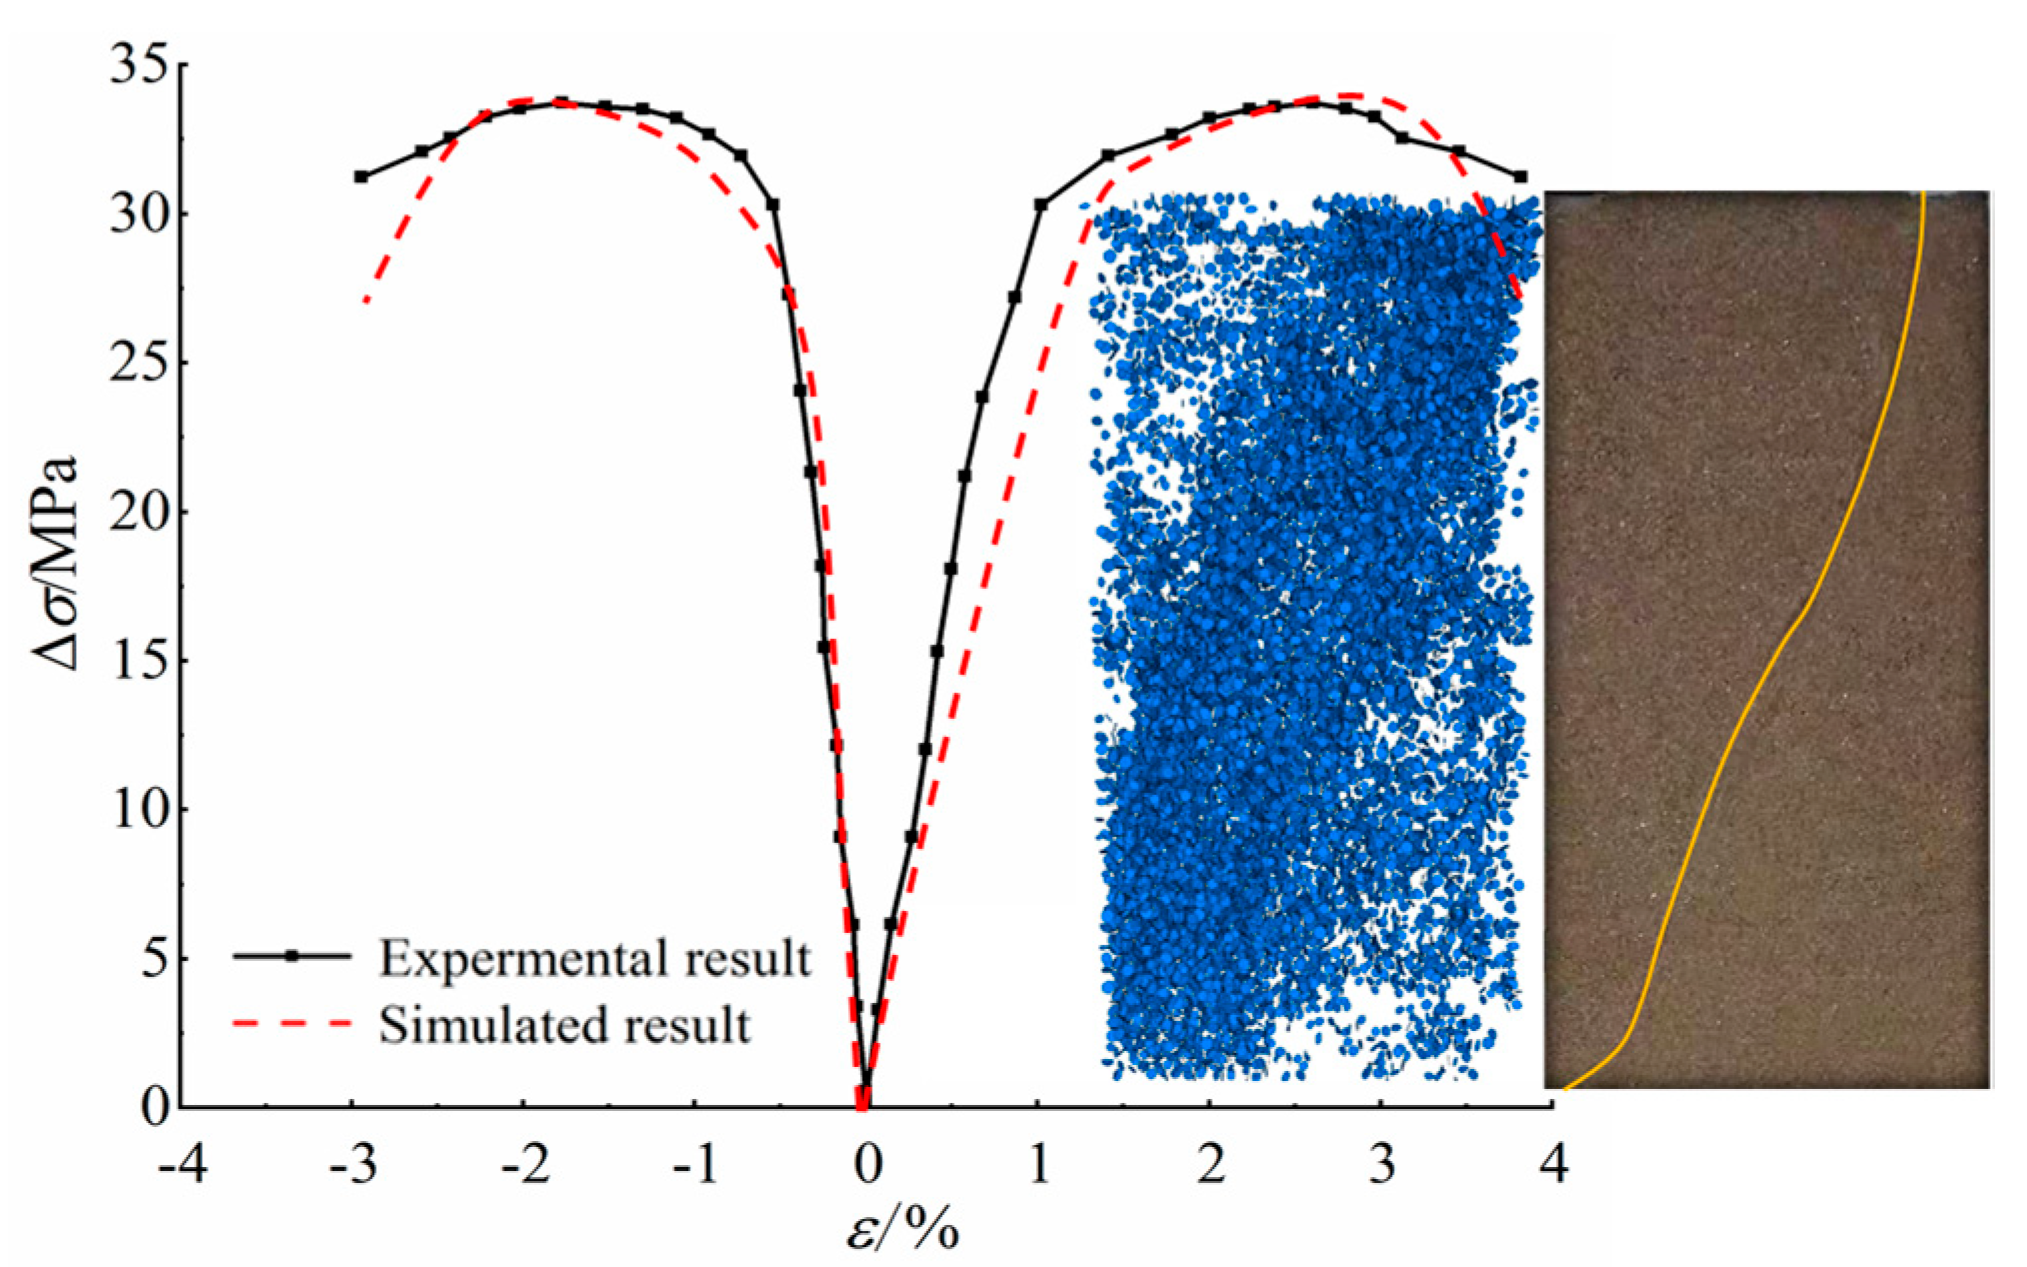
4. Numerical Simulation of Crack Characteristics

In order to examine how cracks in gas-bearing coal evolve under triaxial stress paths, numerical simulations were performed with PFC software to see how crack-count changes in the specimens during loading.

4.1. Model Construction

The model was sized with the same dimensions as the laboratory specimens, i.e., ϕ50 mm × 100 mm. In the computational model, the minimum particle radius was 0.25 mm, with a particle size ratio of 1.66. A total of 3665 particle samples were generated.
Figure 8 shows the initial and boundary conditions used for simulation. First, the model was loaded with biaxial compression of axial and confining pressure to 6 MPa by the servo mechanism. Then a high-pressure zone with pressure P was set at the top of the model. The fluid field pressure at the bottom of the model was fixed to 0.1 MPa to indicate connecting to atmospheric pressure.

4.2. Determination of Coal Meso-Mechanical Parameters

First, coal compression and tension simulations were made with PFC software to correlate the meso- and macro-mechanical parameters of coal.
Data regression yielded a correlation coefficient of 0.992 (R2 = 0.992) between elastic modulus and meso-mechanical parameter, 0.998 (R2 = 0.998) between Poisson’s ratio and meso-mechanical parameter, 0.997 (R2 = 0.997) between compressive strength and meso-mechanical parameter, and 0.995 (R2 = 0.995) between tensile strength and meso-mechanical parameter. The empirical equations between these coefficients are shown in Equations (2)–(5).
E E c = a 1 + b 1 ln ( k n k s )
where E is the elastic modulus, GPa; Ec is the Young’s modulus, GPa; kn/ks is the stiffness ratio; a1 = 1.652, and b1 = −0.395.
μ = a 2 + b 2 ln ( k n k s )
where μ is the Poisson’s ratio; a2 = 0.111; b2 = 0.209.
σ c σ ¯ = a 3 ( τ ¯ σ ¯ ) 2 + b 3 τ ¯ σ ¯   ,   0 < τ ¯ σ ¯ 1 c 1     ,   1 < τ ¯ σ ¯  
where σc is the compressive strength, MPa; σ ¯ is the parallel connection normal strength, MPa; τ is the parallel connection tangential strength, MPa; a3 = −0.965; b3 = 2.292; and c1 = 1.327.
σ t σ ¯ = a 4 ( τ ¯ σ ¯ ) 2 + b 4 τ ¯ σ ¯   ,   0 < τ ¯ σ ¯ < 1 c 2     ,   1 < τ ¯ σ ¯  
where σt is the tensile strength, MPa; a4 = −0.174; b4 = 0.463; c2 = 0.289. Based on Equations (2)–(5) and the data in Table 1, the coal mesoscopic parameters required for simulation can be retrieved as shown in Table 2.
It has been demonstrated that among all fluid parameters, residual pore size a0 and fluid viscosity μ make the greatest difference to permeation pressure–stress coupling during permeation. After repeated simulation, fluid computational parameters were worked out, as presented in Table 3.
Figure 9 compares the numerical simulation results with the test results of gas-bearing coal under the stress path of triaxial loading. From this diagram, at the end of the loading path of axial pressure, an oblique shear crack appears in the specimen. The stress-strain curve and failure form from numerical simulation almost entirely agrees with the laboratory test results. This suggests that our numerical simulation model and meso-mechanical parameters are appropriate enough for subsequent meso-mechanical simulation.

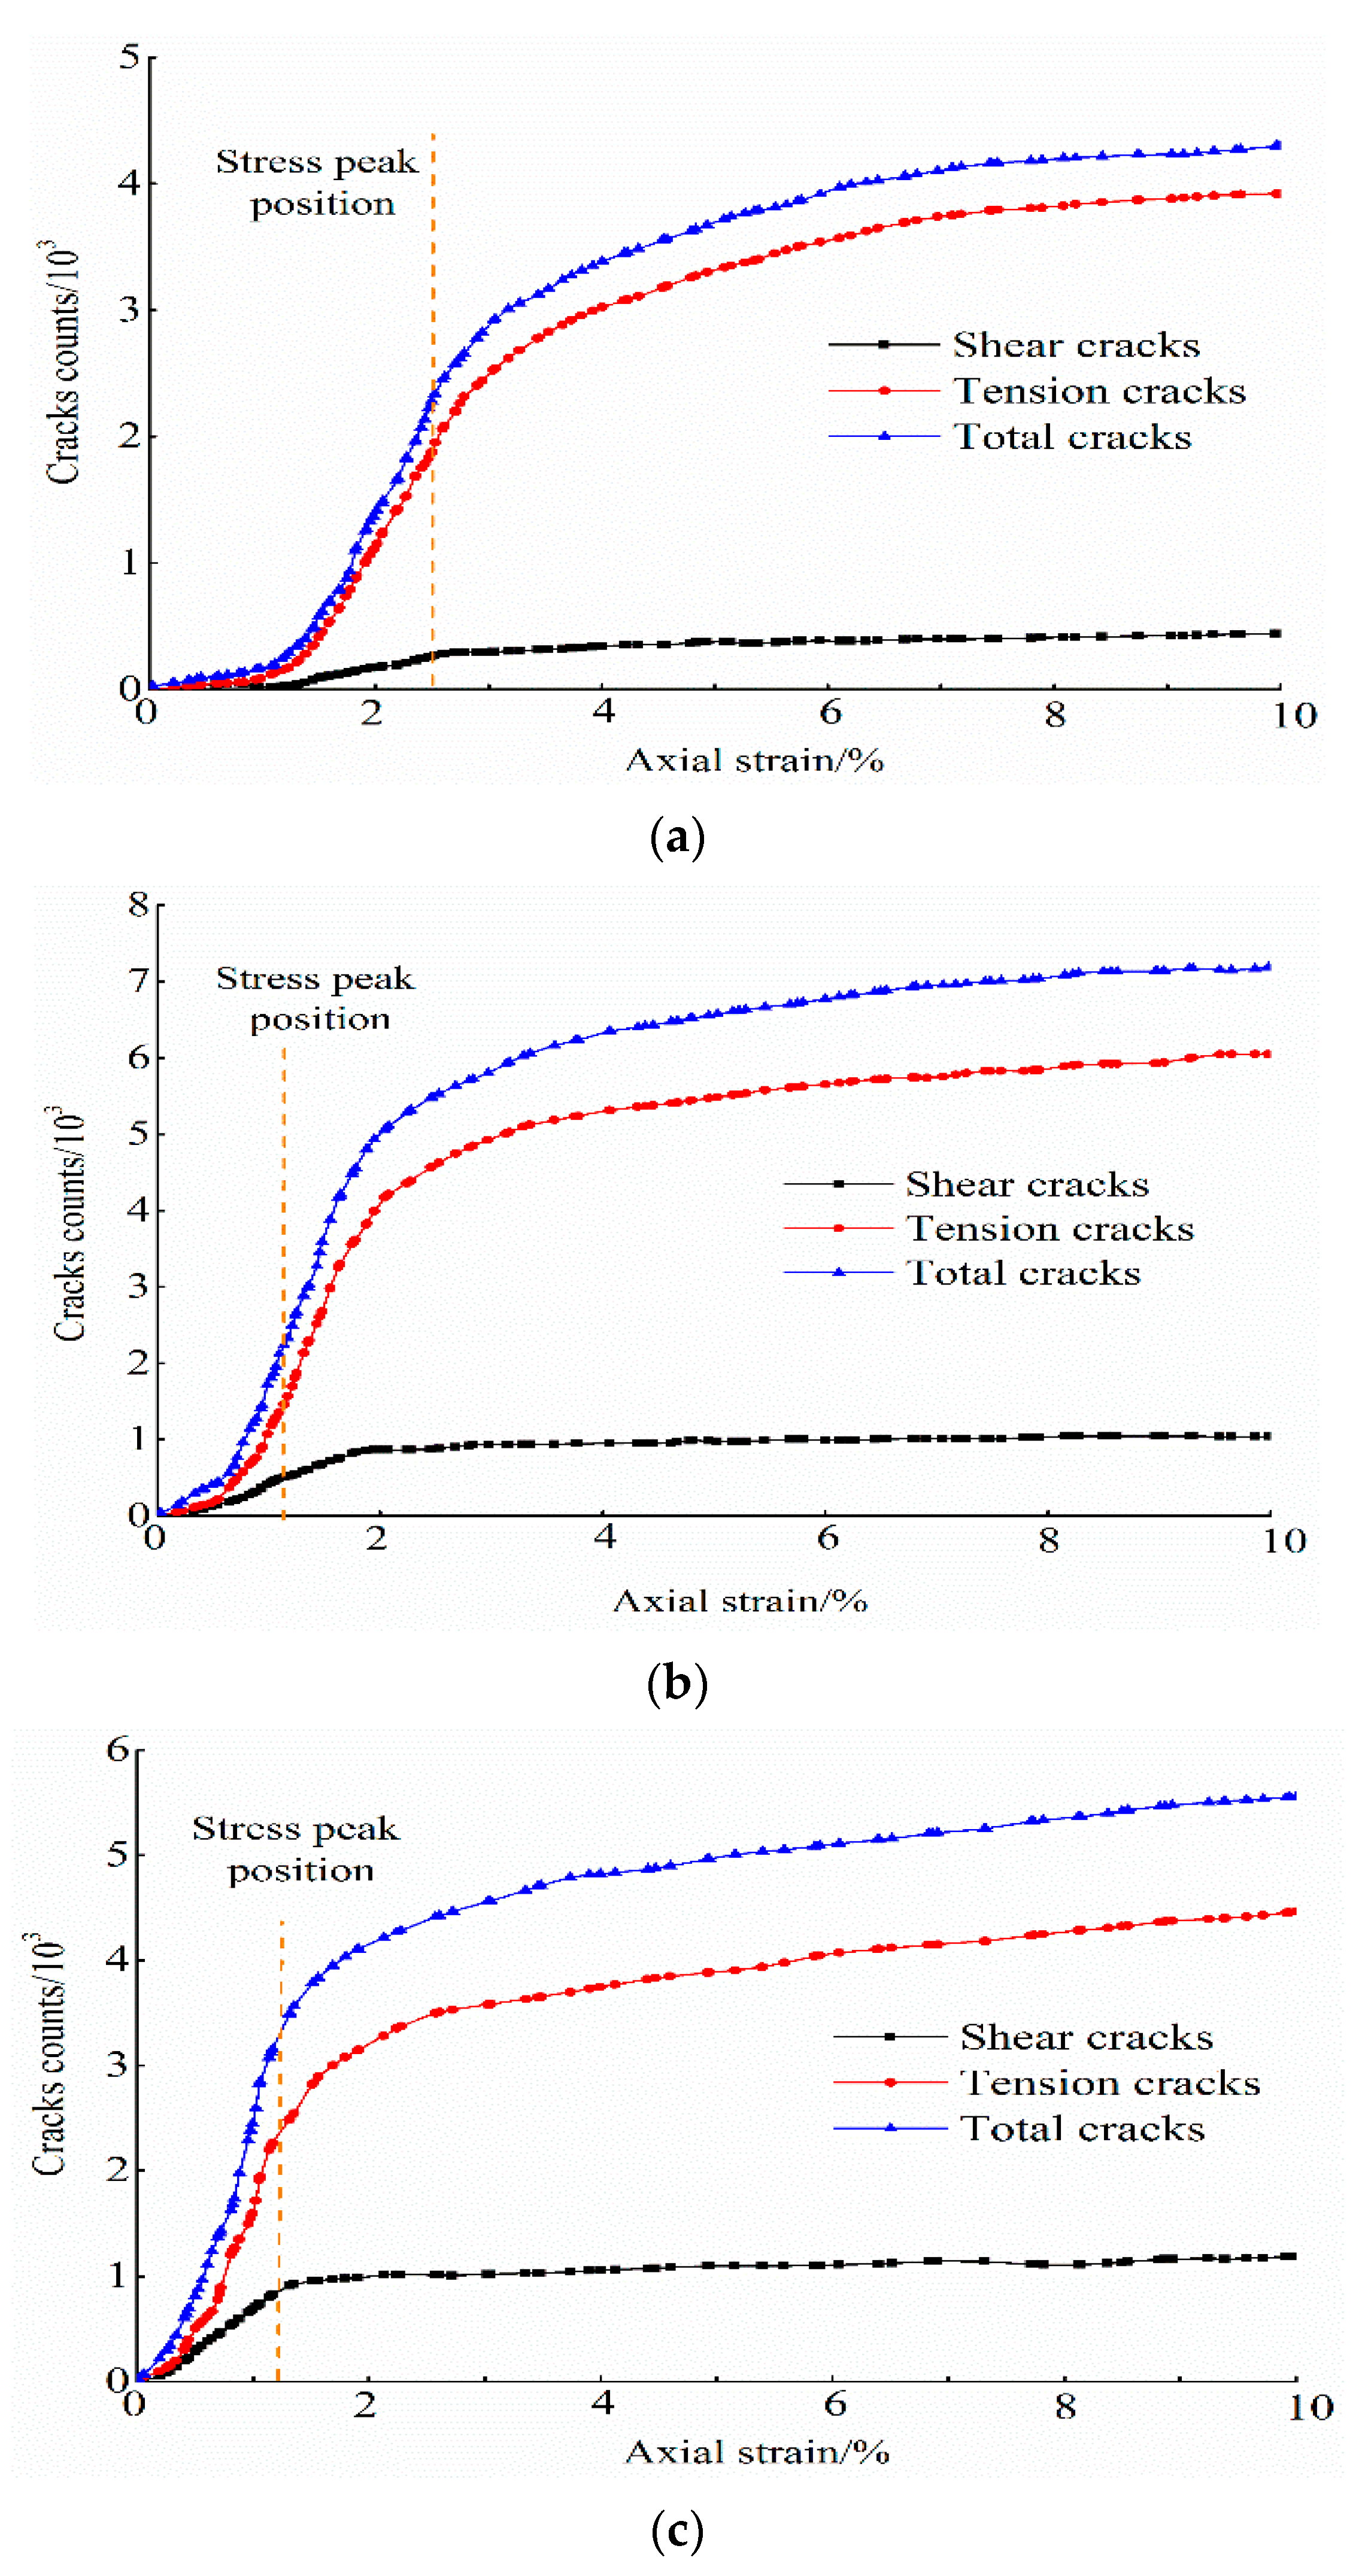
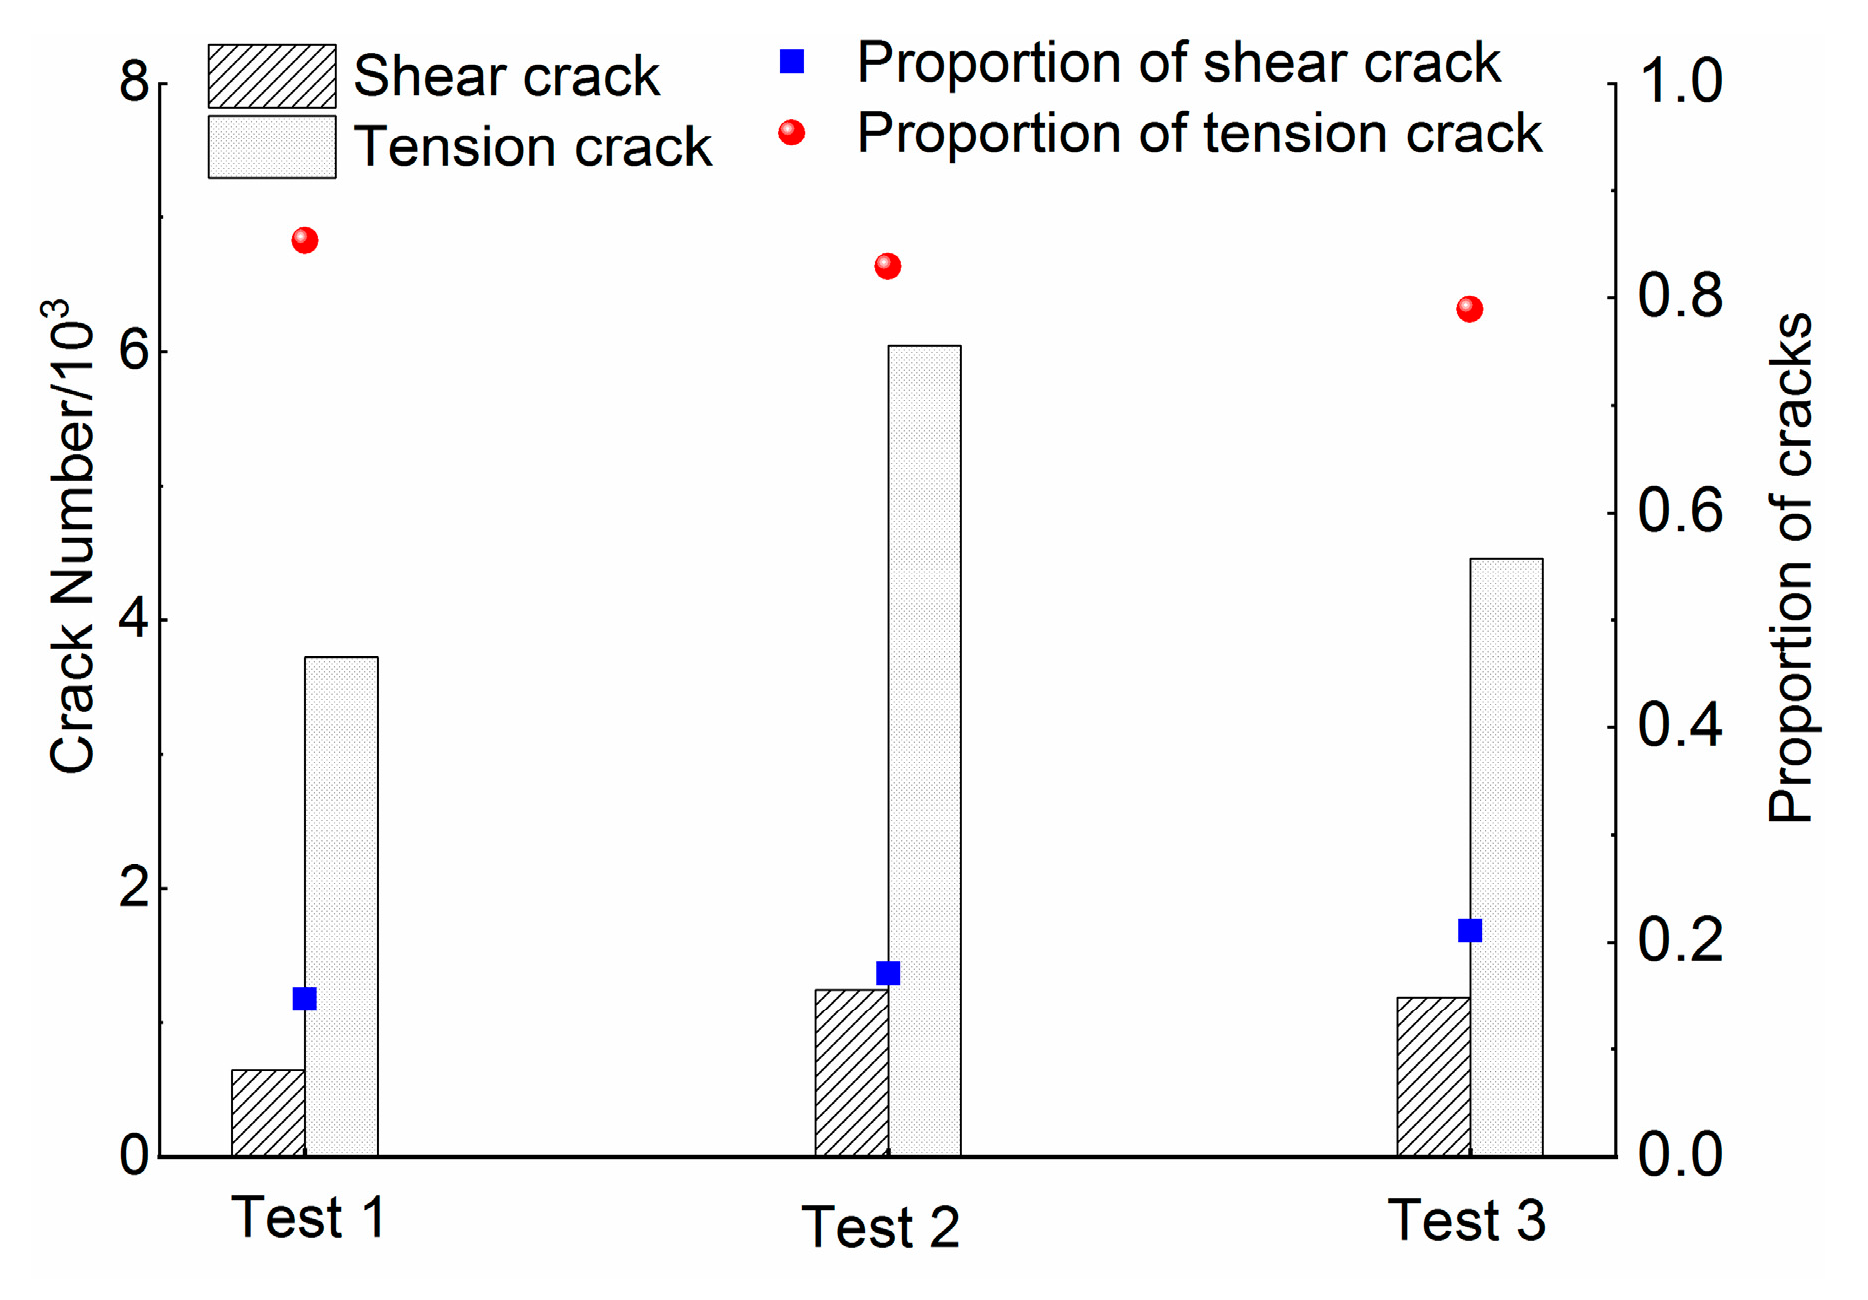
4.3. Crack Number Characteristic Analysis

To observe crack development inside the specimen under different paths, a cracks count–axial strain plot shown in Figure 10 was drawn. The cracks count inside the specimen changes in much the same way. As axial stress increases, cracks count first increases slowly and then increases quickly, especially near the site of peak stress. Finally, the rate of increase slows down and gradually stabilizes. The evolution of tension and shear-induced cracks count is not much different: it first increases and then stabilizes. However, as tensile strength is greater than shear strength in coal particles, there are many more tensile cracks than shear cracks.
Figure 11 compares the cracks counts at the end of simulation under different paths. In Test 1, the total model cracks count is 4.36 × 10³, including 3.72 × 10³ tensile cracks, accounting for 85.29% of total cracks; and 0.64 × 10³ shear cracks, accounting for 14.71% of total cracks. In Test 2, the model cracks count is 7.29 × 10³, including 6.05 × 10³ cracks, accounting for 82.91% of total cracks; and 1.25 × 10³ shear cracks, accounting for 17.09% of total cracks. In Test 3, the model cracks count is 5.65 × 10³, including 4.46 × 10³ tensile cracks, accounting for 78.93% of total cracks; and 1.19 × 10³ shear cracks, accounting for 21.07% of total cracks. By cracks count, Test 2 > Test 3 > Test 1; by cracks proportion, from Test 1 to Test 3, the proportion of shear cracks gradually increases, suggesting that both tensile cracks and shear cracks are present at the time of failure. For this reason, the model displays a composite tensile–shear failure, although the specimens are more prone to shear failure under loading and composite loading/unloading paths.

5. Conclusions

In Test 1, the specimen strength is the highest, with Δσ = 33.750 MPa. In Test 2, the specimen strength is the second highest, with Δσ = 33.750 MPa. In Test 3, the specimen strength is the lowest, with Δσ = 23.480 MPa. The specimen-bearing capacity is much lower under loading and composite loading/unloading paths.
Under the three paths, as the test goes on, permeability first reduces then increases; the valley deflection of permeability falls before the peak deflections of the ε1–Δσ curve in all cases. Compared with the other paths, the specimen-permeability variation is the largest at the end of Test 3, proving that the specimens are more badly damaged in Test 3.
The total cracks count is the largest in Test 2. From cracks proportion, from Test 1 to Test 3, the proportion of shear cracks in the model gradually increases, suggesting that both tensile and shear cracks are present at the time of macroscopic failure. For this reason, the model displays a composite tensile–shear failure, although the specimens are more prone to shear failure under loading and composite loading/unloading paths.

Author Contributions

Conceptualization, H.S. (Haibo Sun), B.Z., Z.S., B.S. and H.S. (Hongyu Song); Writing—original draft, H.S. (Haibo Sun); Funding acquisition, B.Z.; Formal analysis, H.S. (Haibo Sun), B.Z. and Z.S.; Software, H.S. (Haibo Sun), B.S.; Data curation, H.S. (Haibo Sun), B.Z. and H.S. (Hongyu Song). All authors have read and agreed to the published version of the manuscript.

Funding

This research received no external funding.

Data Availability Statement

All relevant data presented in the article are according to institutional requirements and, as such, are not available online. However, all data used in this manuscript can be made available upon request to the authors.

Conflicts of Interest

The authors declare no conflict of interest.

References

  1. Xie, H.; Gao, M.; Zhang, R. Study on the mechanical properties and mechanical response of coal mining at 1000 m or deeper. Rock Mech. Rock Eng. 2019, 52, 1475–1490. [Google Scholar] [CrossRef]
  2. Yuan, L. Control of coal and gas outbursts in Huainan mines in China: A review. J. Rock Mech. Geotech. Eng. 2016, 8, 559–567. [Google Scholar] [CrossRef] [Green Version]
  3. Wang, K.; Guo, Y.; Wang, G.; Du, F. Seepage and Mechanical Failure Characteristics of Gas-bearing Composite Coal-Rock under True Triaxial Path. J. China Coal Soc. 2022. [Google Scholar]
  4. Zhang, C.; Xu, J.; Peng, S. Dynamic behavior of gas pressure and optimization of borehole length in stress relaxation zone during coalbed methane production. Fuel 2018, 233, 816–824. [Google Scholar] [CrossRef]
  5. Wang, K.; Du, F.; Zhang, X.; Wang, L.; Xin, C. Mechanical properties and permeability evolution in gas-bearing coal-rock combination body under triaxial conditions. Environ. Earth Sci. 2017, 76, 815. [Google Scholar] [CrossRef]
  6. Du, F.; Wang, K.; Zhang, X. Experimental study of coal-gas outburst: Insights from coal-rock structure, gas pressure and adsorptivity. Nat. Resour. Res. 2020, 29, 2481–2493. [Google Scholar] [CrossRef]
  7. Du, F.; Wang, K. Unstable failure of gas-bearing coal-rock combination bodies: Insights from physical experiments and numerical simulations. Process Saf. Environ. Prot. 2019, 129, 264–279. [Google Scholar] [CrossRef]
  8. Chen, Y.; Xu, J.; Peng, S.; Zhang, Q.; Chen, C. Strain localisation and seepage characteristics of rock under triaxial compression by 3D digital image correlation. Int. J. Rock Mech. Min. Sci. 2022, 152, 105064. [Google Scholar] [CrossRef]
  9. Chen, C.; Xu, J.; Okubo, S.; Peng, S. Damage evolution of tuff under cyclic tension–compression loading based on 3D digital image correlation. Eng. Geol. 2020, 275, 105736. [Google Scholar] [CrossRef]
  10. Yin, G.; Li, W.; Li, M. Experimental study of mechanical properties of coal containing methane under different loading-unloading conditions. Chin. J. Rock Mech. Eng. 2013, 32, 892–901. [Google Scholar]
  11. Wang, Y.; Xie, H.; Chen, S. Petrophysical and Mechanical Properties of Complex Structure Coalbed Methane Reservoir: A Laboratory Investigation. Rock Mech. Rock Eng. 2022, 1–19. [Google Scholar] [CrossRef]
  12. Zhao, H.; Wang, J. Experimental study of evolution law of mechanical properties of coal containing gas under unloading confining Pressure. Rock Soil Mech. 2011, 32 (Suppl. S1), 270–274. [Google Scholar]
  13. Wang, G.; Xue, D.; Gao, H. Study on permeability characteristics of coal rock in complete stress-strain process. J. China Coal Soc. 2012, 37, 107–112. [Google Scholar]
  14. Li, X.; Yin, G.; Cai, B. Experimental study on deformation and seepage properties of outburst coal samples under cyclic loading. Chin. J. Rock Mech. Eng. 2010, 29 (Suppl. S2), 3498–3504. [Google Scholar]
  15. Cao, S.; Bai, Y.; Li, Y. Experiments of coal’s gas seepage with outburst dangers. J. Chongqing Univ. 2011, 34, 91–95. [Google Scholar]
  16. Xue, D.; Zhou, H.; Wang, Z. Failure mechanism and mining-induced mechanism of coal a under different loading rates. J. China Coal Soc. 2016, 41, 595–602. [Google Scholar]
  17. Chaudry, M.A.; Wriggers, P. On the computational aspects of comminution in discrete element method. Comput. Part. Mech. 2018, 5, 175–189. [Google Scholar] [CrossRef]
  18. Zhu, F.; Zhao, J. A peridynamic investigation on crushing of sand particles. Geotechnique 2019, 69, 526–540. [Google Scholar] [CrossRef] [Green Version]
  19. Tan, X.; Hu, Z.; Cao, M.; Chen, C. 3D discrete element simulation of a geotextileencased stone column under uniaxial compression testing. Comput. Geotech. 2020, 126, 103769. [Google Scholar] [CrossRef]
  20. Indraratna, I.; Thakur, P.; Vinod, J.S. Experimental and numerical study of railway ballast behavior under cyclic loading. Int. J. Geomech. 2010, 10, 136–144. [Google Scholar] [CrossRef]
  21. Wang, P. Study of the borehole hydraulic fracturing and the principle of gas seepage in the coal seam. Procedia Earth Planet. Sci. 2009, 1, 1561–1573. [Google Scholar]
  22. Jiang, M.; Zhang, F.; Sun, Y. An evaluation on the degradation evolutions in three constitutive models for bonded geomaterials by DEM analyses. Comput. Geotech. 2014, 57, 1–16. [Google Scholar] [CrossRef]
  23. Ismai, Y.; Yang, D.; Ye, J. A DEM model for visualising damage evolution and predicting failure envelope of composite laminae under biaxial loads. Compos. Part B Eng. 2016, 10, 9–28. [Google Scholar] [CrossRef] [Green Version]
  24. Yang, X.; Jing, H.; Chen, K. Numerical simulations of failure behavior around a circular opening in a non-persistently jointed rock mass under biaxial compression. Int. J. Min. Sci. Technol. 2016, 26, 729–738. [Google Scholar] [CrossRef]
  25. Sagong, M.; Park, D.; Yoo, J.; Lee, J. Experimental and numerical analyses of an opening in a jointed rock mass under biaxial compression. Int. J. Rock Mech. Min. Sci. 2011, 48, 1055–1067. [Google Scholar] [CrossRef]
  26. Raisianzadeh, J.; Mirghasemi, A.A.; Mohammadi, S. 2D simulation of breakage of angular particles using combined DEM and XFEM. Powder Technol. 2018, 336, 282–297. [Google Scholar] [CrossRef]
  27. Xu, H.; Qin, Y.; Wang, G.; Fan, C.; Wu, M.; Wang, R. Discrete element study on mesomechanical behavior of crack propagation in coal samples with two prefabricated fissures under biaxial compression. Powder Technol. 2020, 375, 42–59. [Google Scholar] [CrossRef]
  28. Wang, G.; Guo, Y.; Wang, P. A new experimental apparatus for sudden unloading of gas-bearing coal. Bull. Eng. Geol. Environ. 2020, 79, 857–868. [Google Scholar] [CrossRef]
  29. Zhao, Y.; Cui, D.; Liu, J.; Wei, M.; Liu, Y. Evolution of Coal Permeability under Constant Effective Stresses: Direct Measurements and Numerical Modeling. Energy Fuels 2021, 35, 15489–15501. [Google Scholar] [CrossRef]
Figure 1. Briquette specimens.
Processes 10 02255 g001
Figure 2. The triaxial servo-controlled seepage equipment for thermofluid–solid coupling of coal containing methane.
Processes 10 02255 g002
Figure 3. Schematic diagram of experimental loading path. (a) Test 1, (b) Test 2, (c) Test 3.
Processes 10 02255 g003
Figure 4. Flow chart for the experiment.
Processes 10 02255 g004
Figure 5. Stress–strain curves of specimens under different test paths.
Processes 10 02255 g005
Figure 6. Variation curves of principal stress difference and permeability with axial strain during test.
Processes 10 02255 g006
Figure 7. Relative permeability change.
Processes 10 02255 g007
Figure 8. Model, initial conditions and boundary conditions.
Processes 10 02255 g008
Figure 9. Comparison of physical test and numerical simulation results.
Processes 10 02255 g009
Figure 10. Relationship between the number of cracks and axial strain. (a) Test 1, (b) Test 2, (c) Test 3.
Processes 10 02255 g010
Figure 11. Characteristics of the number of cracks under different paths.
Processes 10 02255 g011
Table 1. Macro-mechanical characteristics of the moulded coal specimen.
Bulk Density
(kN/m3)
Elastic Modulus
(104 MPa)
Internal Friction
Angle (°)
Tensile Strength
(MPa)
Cohesion (MPa)Poisson
Ratio
13.576.8942.61.342.430.28
Table 2. Mesoscopic mechanical parameters of the DEM numerical model.
ParametersValue
Contact stiffness ratio2.14
Contact modulus (GPa)5.1
Friction factor0.4
Parallel bond modulus (GPa)5.1
Normal strength of parallel bonding4.6
Parallel bond tangential strength (MPa)4.6
Parallel bond stiffness ratio2.14
Table 3. Computational parameters of fluid.
Fluid Viscosity μ/(Pa s)Fluid Volume Modulus Kf (GPa)Residual Pore Size a0 (m)Initial Normal Stress F0 (kN)Time Step Δt (s)
0.0150.00961 × 10−35 × 1030.1
Publisher’s Note: MDPI stays neutral with regard to jurisdictional claims in published maps and institutional affiliations.

