Article

A Scientometric Study of the Stylometric Research Field

by
Panagiotis D. Michailidis
Department of Balkan, Slavic and Oriental Studies, University of Macedonia, 54636 Thessaloniki, Greece
Informatics 2022, 9(3), 60; https://doi.org/10.3390/informatics9030060
Submission received: 30 June 2022 / Revised: 13 August 2022 / Accepted: 15 August 2022 / Published: 18 August 2022
(This article belongs to the Special Issue Digital Humanities and Visualization)

Abstract

:
Stylometry has gained great popularity in digital humanities and social sciences. Many works on stylometry have recently been reported. However, there is a research gap regarding review studies in this field from a bibliometric and evolutionary perspective. Therefore, in this paper, a bibliometric analysis of publications from the Scopus database in the stylometric research field was proposed. Then, research articles published between 1968 and 2021 were collected and analyzed using the Bibliometrix R package for bibliometric analysis via the Biblioshiny web interface. Empirical results were also presented in terms of the performance analysis and the science mapping analysis. From these results, it is concluded that there has been a strong growth in stylometry research in recent years, while the USA, Poland, and the UK are the most productive countries, and this is due to many strong research partnerships. It was also concluded that the research topics of most articles, based on author keywords, focused on two broad thematic categories: (1) the main tasks in stylometry and (2) methodological approaches (statistics and machine learning methods).

1. Introduction

Stylometry is a research area which applies quantitative methods in order to study the linguistic or writing style of a text. A basic research problem of stylometry is to attribute authorship to anonymous documents based on stylistic features, which is known as the authorship attribution problem. One of the first efforts to solve this problem was that of Mendenhall, who used the frequency distribution of words of various lengths to identify the true author of Shakespeare plays [1]. In the digital age, stylometry has academic, literary, and social science applications ranging from plagiarism detection and visual arts to social media forensics [1].
A recent and systematic review of stylometry research was reported [1]. This study provides an overview of the statistical methods used for the three main tasks in stylometry, including authorship attribution, authorship verification, and authorship profiling. Authorship attribution seeks a true author, authorship verification aims to determine whether documents were written by the same author, and authorship profiling seeks the demographic profile of an author (such as age or gender) [1]. Stylometry is a field which is continually evolving, and a review study in this field from a bibliometric and evolutionary perspective is absent. Inspired by this fact, the main goal of this paper is to provide an insightful bibliometric analysis of the research articles focused on the stylometry field.
Bibliometric analysis involves the application of quantitative methods to explore and analyze a large volume of research articles, compared to a systematic review, which refers to a review of a small number of articles. In recent years, bibliometric analysis has attracted interest from many researchers for a variety of reasons, such as the emergence of digital technologies or bibliometric software such as VOSviewer, CiteSpace, Biblioshiny, and academic databases such as Web of Science, Scopus, and Google Scholar [2,3,4]. The bibliometric methods can be categorized in two classes: performance analysis and science mapping analysis. Performance analysis refers to the indicators of the research output of a field (the number of publications or citations, etc.,) and identifying the most important research constituents (top cited papers, top productive sources, etc.,), whereas science mapping analysis refers to the relationships between research constituents [2]. Science mapping analysis is conducted through co-word analysis, co-citation analysis, and collaboration analysis [2,3].
This paper carried out bibliometric research in the field of stylometry to answer the following research questions:
  • RQ1: What is the current trend and evolution of publications and citations in stylometry research?
  • RQ2: Which are the productive and influential sources and countries that are relevant to the research field of stylometry?
  • RQ3: Which are the papers that have a significant impact on stylometry research?
  • RQ4: What is the conceptual structure and topics related to stylometry?
  • RQ5: What is the intellectual structure of the science of stylometry?
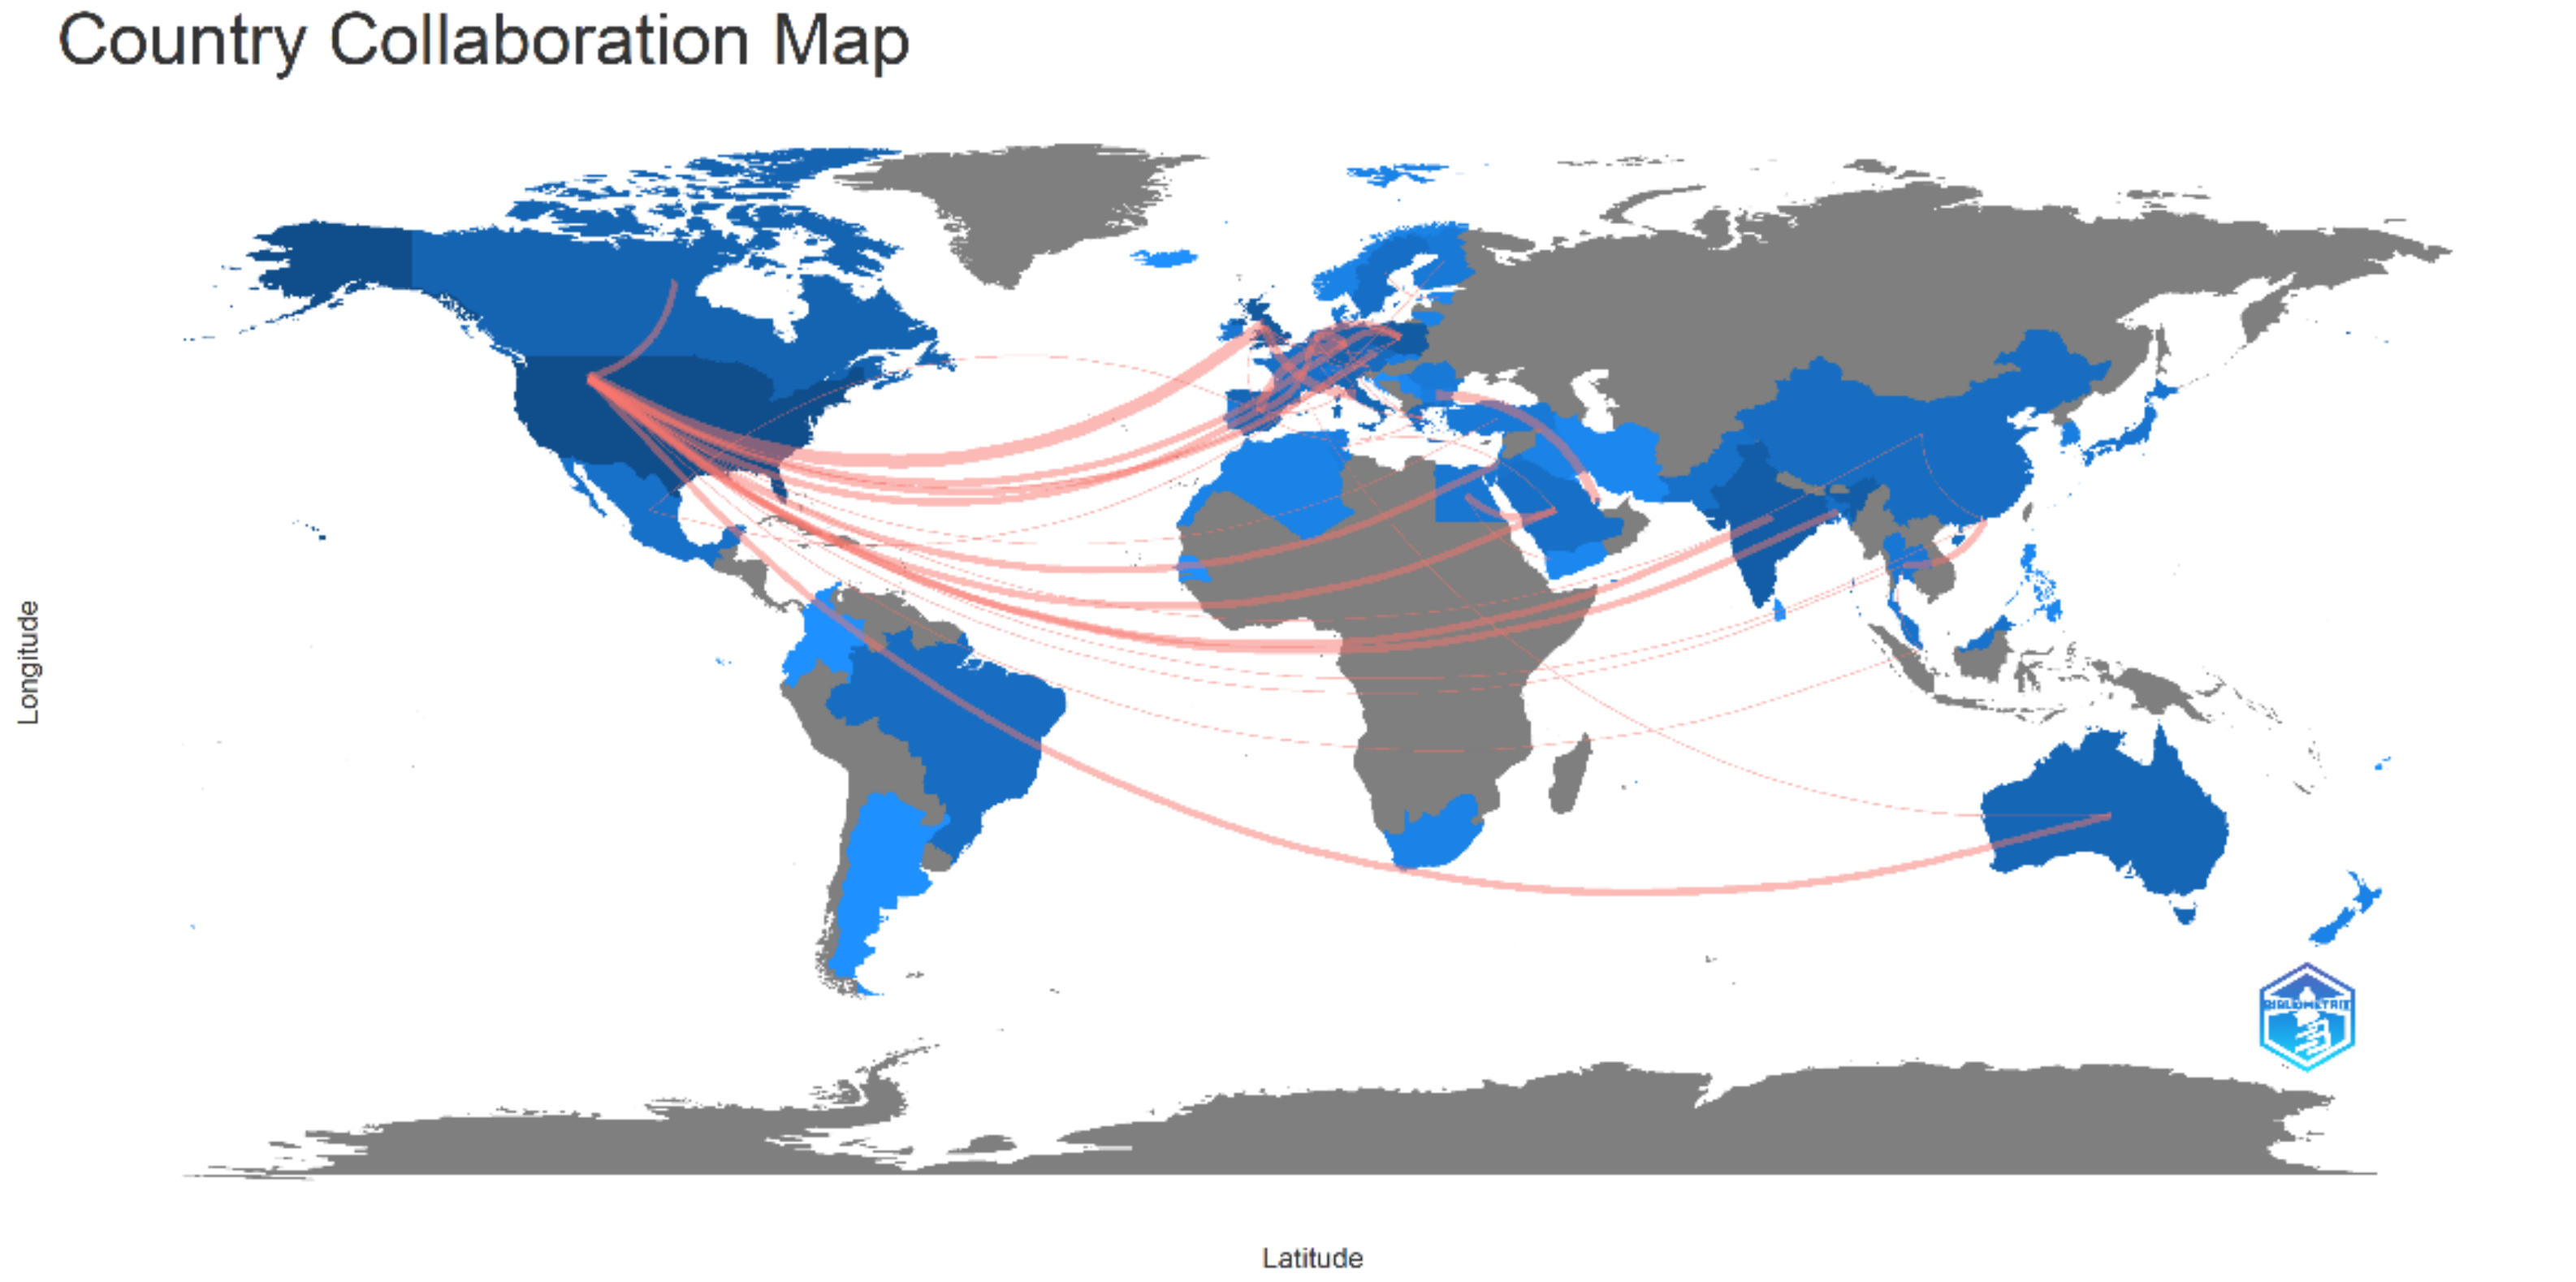
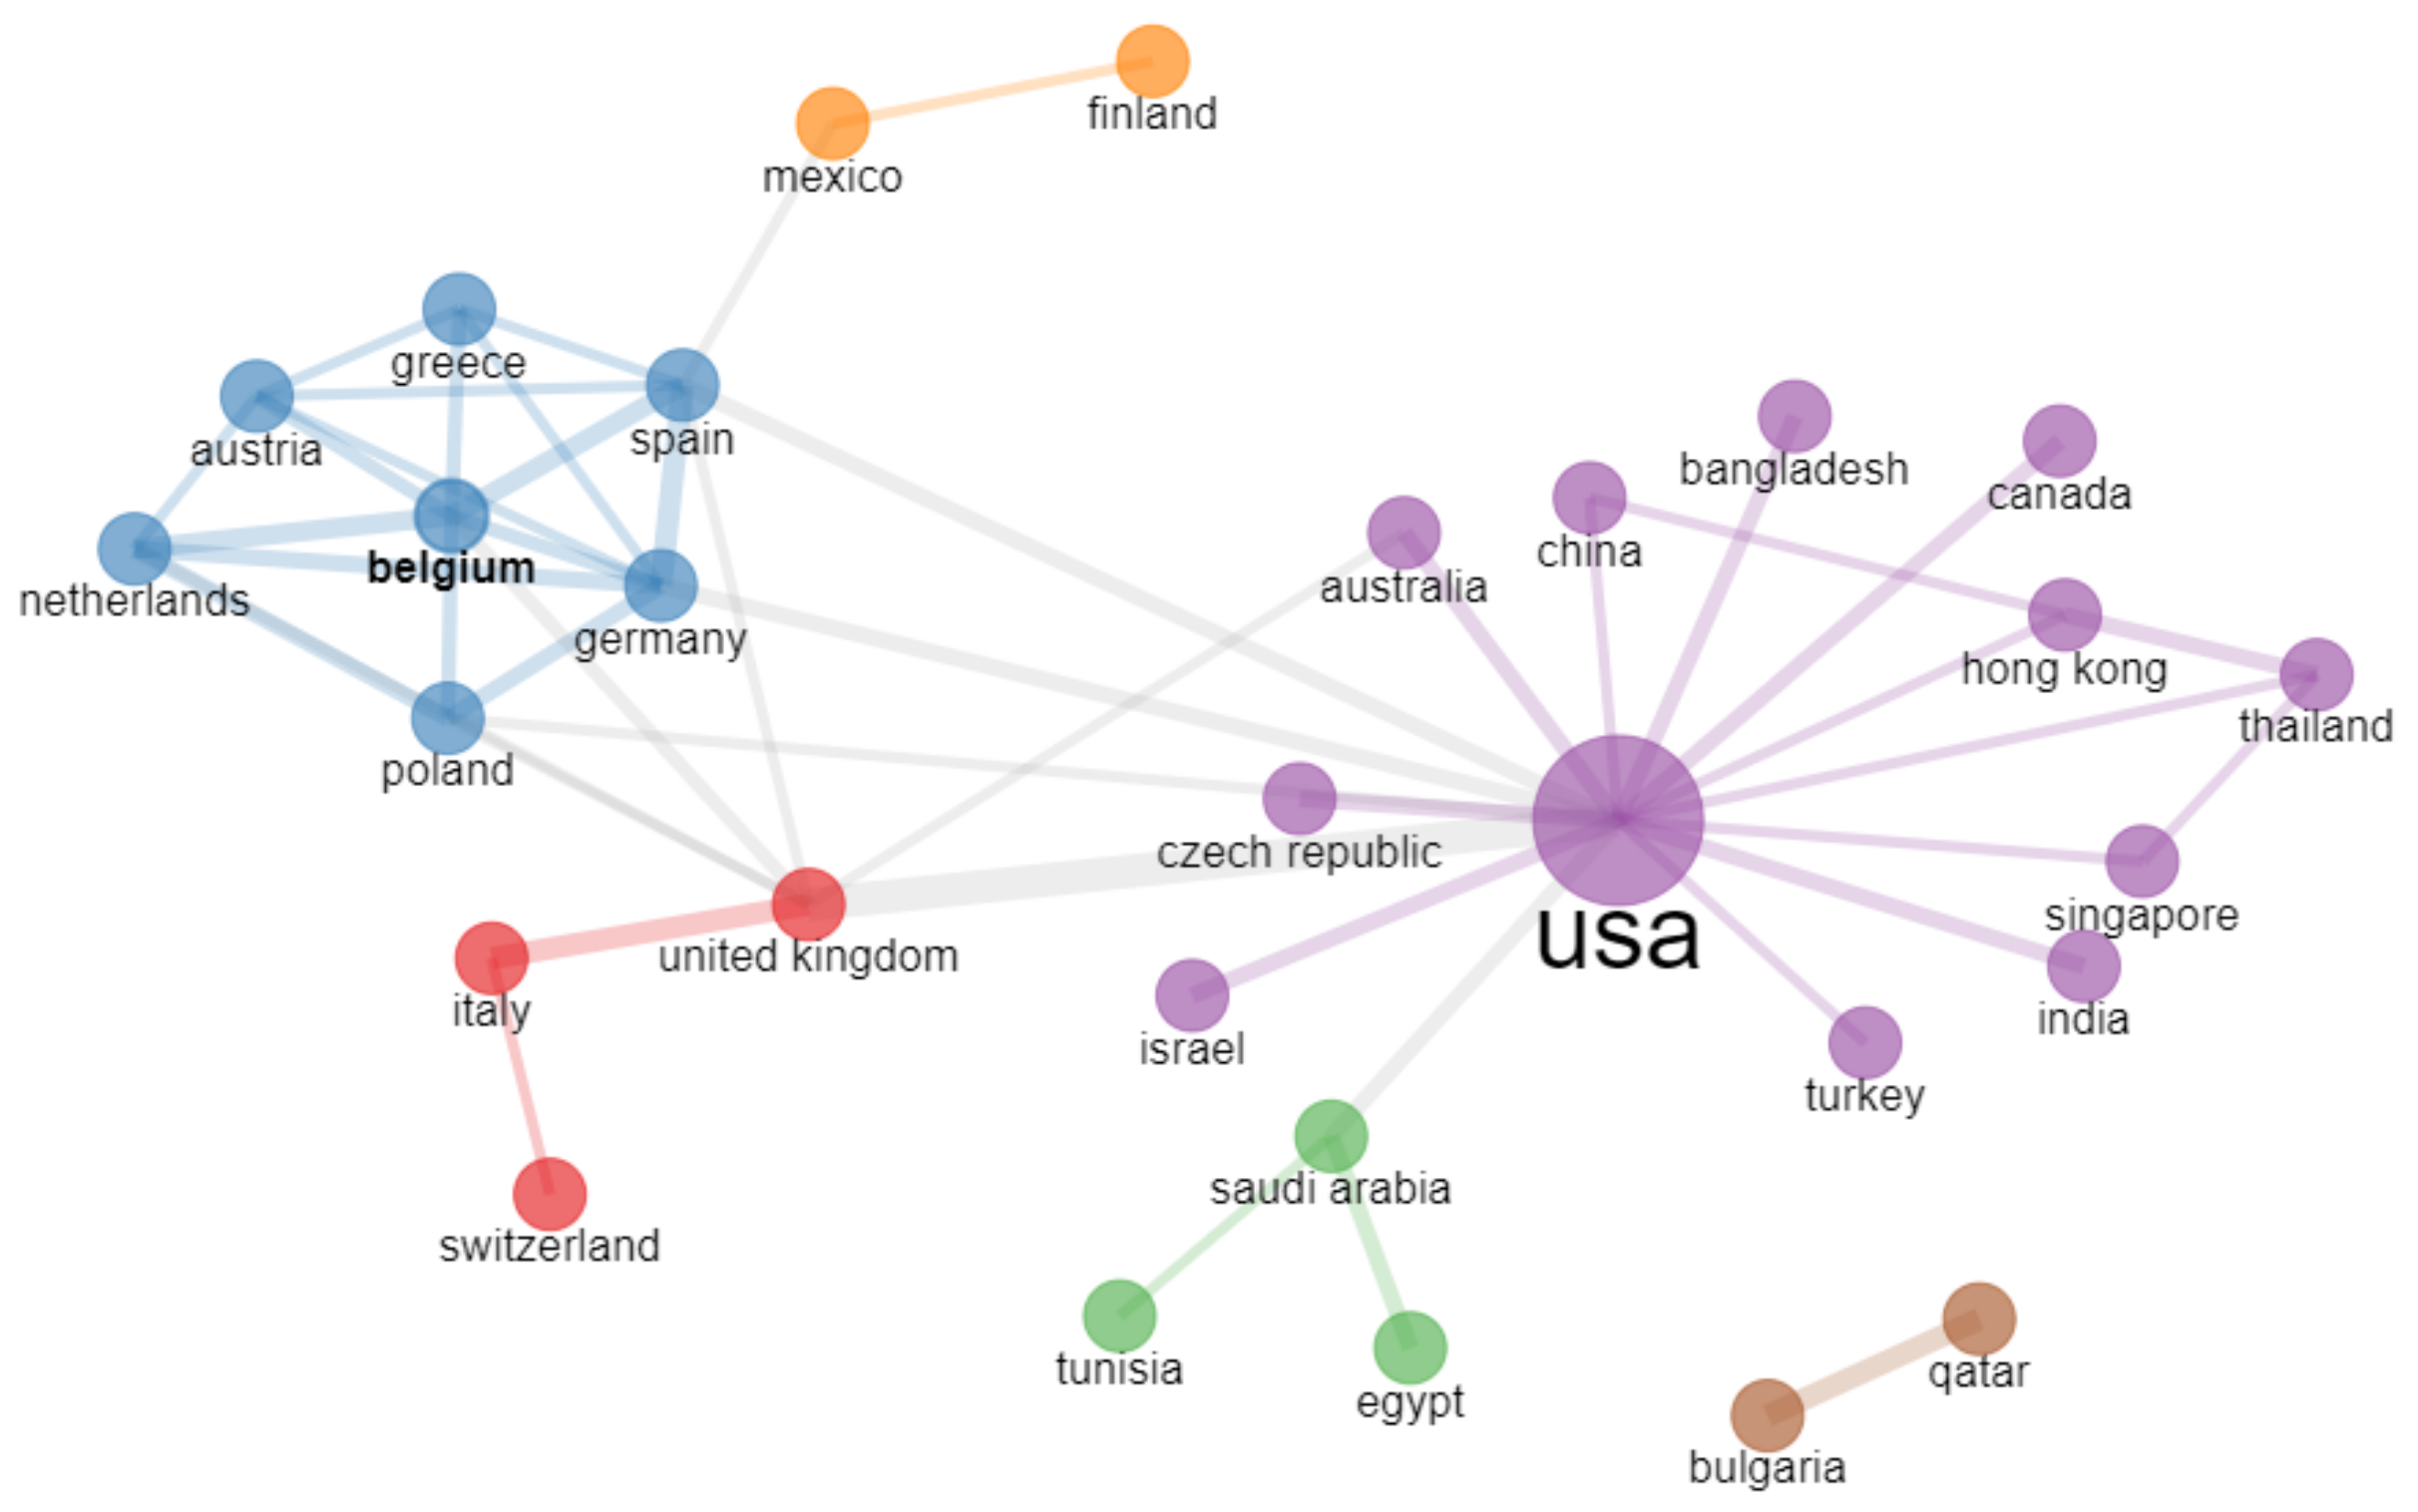
  • RQ6: What is the country collaboration structure in stylometry research?
This paper is organized as follows: Section 2 presents a bibliometric methodology used in this paper. Section 3 provides performance analysis results. The science mapping analysis results are presented in Section 4. Finally, Section 5 provides a short overview of the main findings and conclusions of the paper.

2. Materials and Methods

In this section, data collection and data analysis are reported.

2.1. Data Collection and Preparation

For this bibliometric research, bibliographic data were collected from the Scopus database. The following search criteria were used: “stylometr*” OR “computational stylistic*” in the topic (that is, title, abstract and keywords). The search was launched on 23 April 2022 and 1093 documents were extracted.
The search was then refined by year (1968–2021), document type (conference paper, article, review), and language (English). The filtering stage returned 920 documents. Editorials, notes, and duplicated documents were all excluded. The final dataset consisted of 905 documents. Finally, these documents were exported to “.bib” file format via the Scopus search interface.
The Bibliometrix R 3.2.1 (Aria & Cuccurullo, Naples, Italy) package was used for bibliometric analysis [5], being a great software choice for visualization as well as its importing and exporting capabilities [4]. The BibTeX file containing the documents from Scopus was loaded via the Biblioshiny 3.2.1 (Aria & Cuccurullo, Naples, Italy) web interface. Then, the sample bibliographic dataset was exported to a Microsoft Excel file for data cleaning. The data cleaning phase is necessary in order for the bibliometric analysis to be reliable, and it was performed using the Open Refine software, providing user-friendly data cleaning tasks, since the Bibliometrix package did not support many preprocessing capabilities other than only filters and time slice [4]. The data cleaning tasks performed were as follows: first, the authors’ full names were standardized so that the two different forms of the same author’s name were reduced to the same author’s name format. Finally, coding errors in the cited references were manually corrected. For example, some authors used a different style of references for their papers, and so these references were unified in a standard reference style. These corrections concerned the top 50 cited references.

2.2. Data Analysis

The data analysis of this bibliometric study was performed in two levels in order to answer the research questions. First, a performance analysis was conducted to show the publication and citation patterns of the research field, the productive sources and countries as well as the most cited papers. Second, a science mapping analysis was performed to explore the conceptual structure and topic trends on stylometry, the co-citation network structure as well as the country collaboration structure. These two levels of analysis were supported well by the Biblioshiny environment, such as computing bibliometric metrics and the visualization of various bibliometric networks [5].

3. Performance Results

In this section, the results are presented from the performance analysis perspective, including the descriptive statistics of data collection, the publication and citation trends, the productive and influential sources and countries, and finally the highly cited papers.

3.1. Descriptive Statistics of Data Collection

Table 1 presents the statistical information of the bibliographic data collection for the research field of stylometry. Specifically, the collection contains 905 articles published between 1968 and 2021. These articles were published in 477 scientific sources. Additionally, the collection covers 1687 authors and the collaboration index is around 2.2. On average, each article was written by about two authors (i.e., the number of authors per document is 1.86), and 221 articles were written by one author.

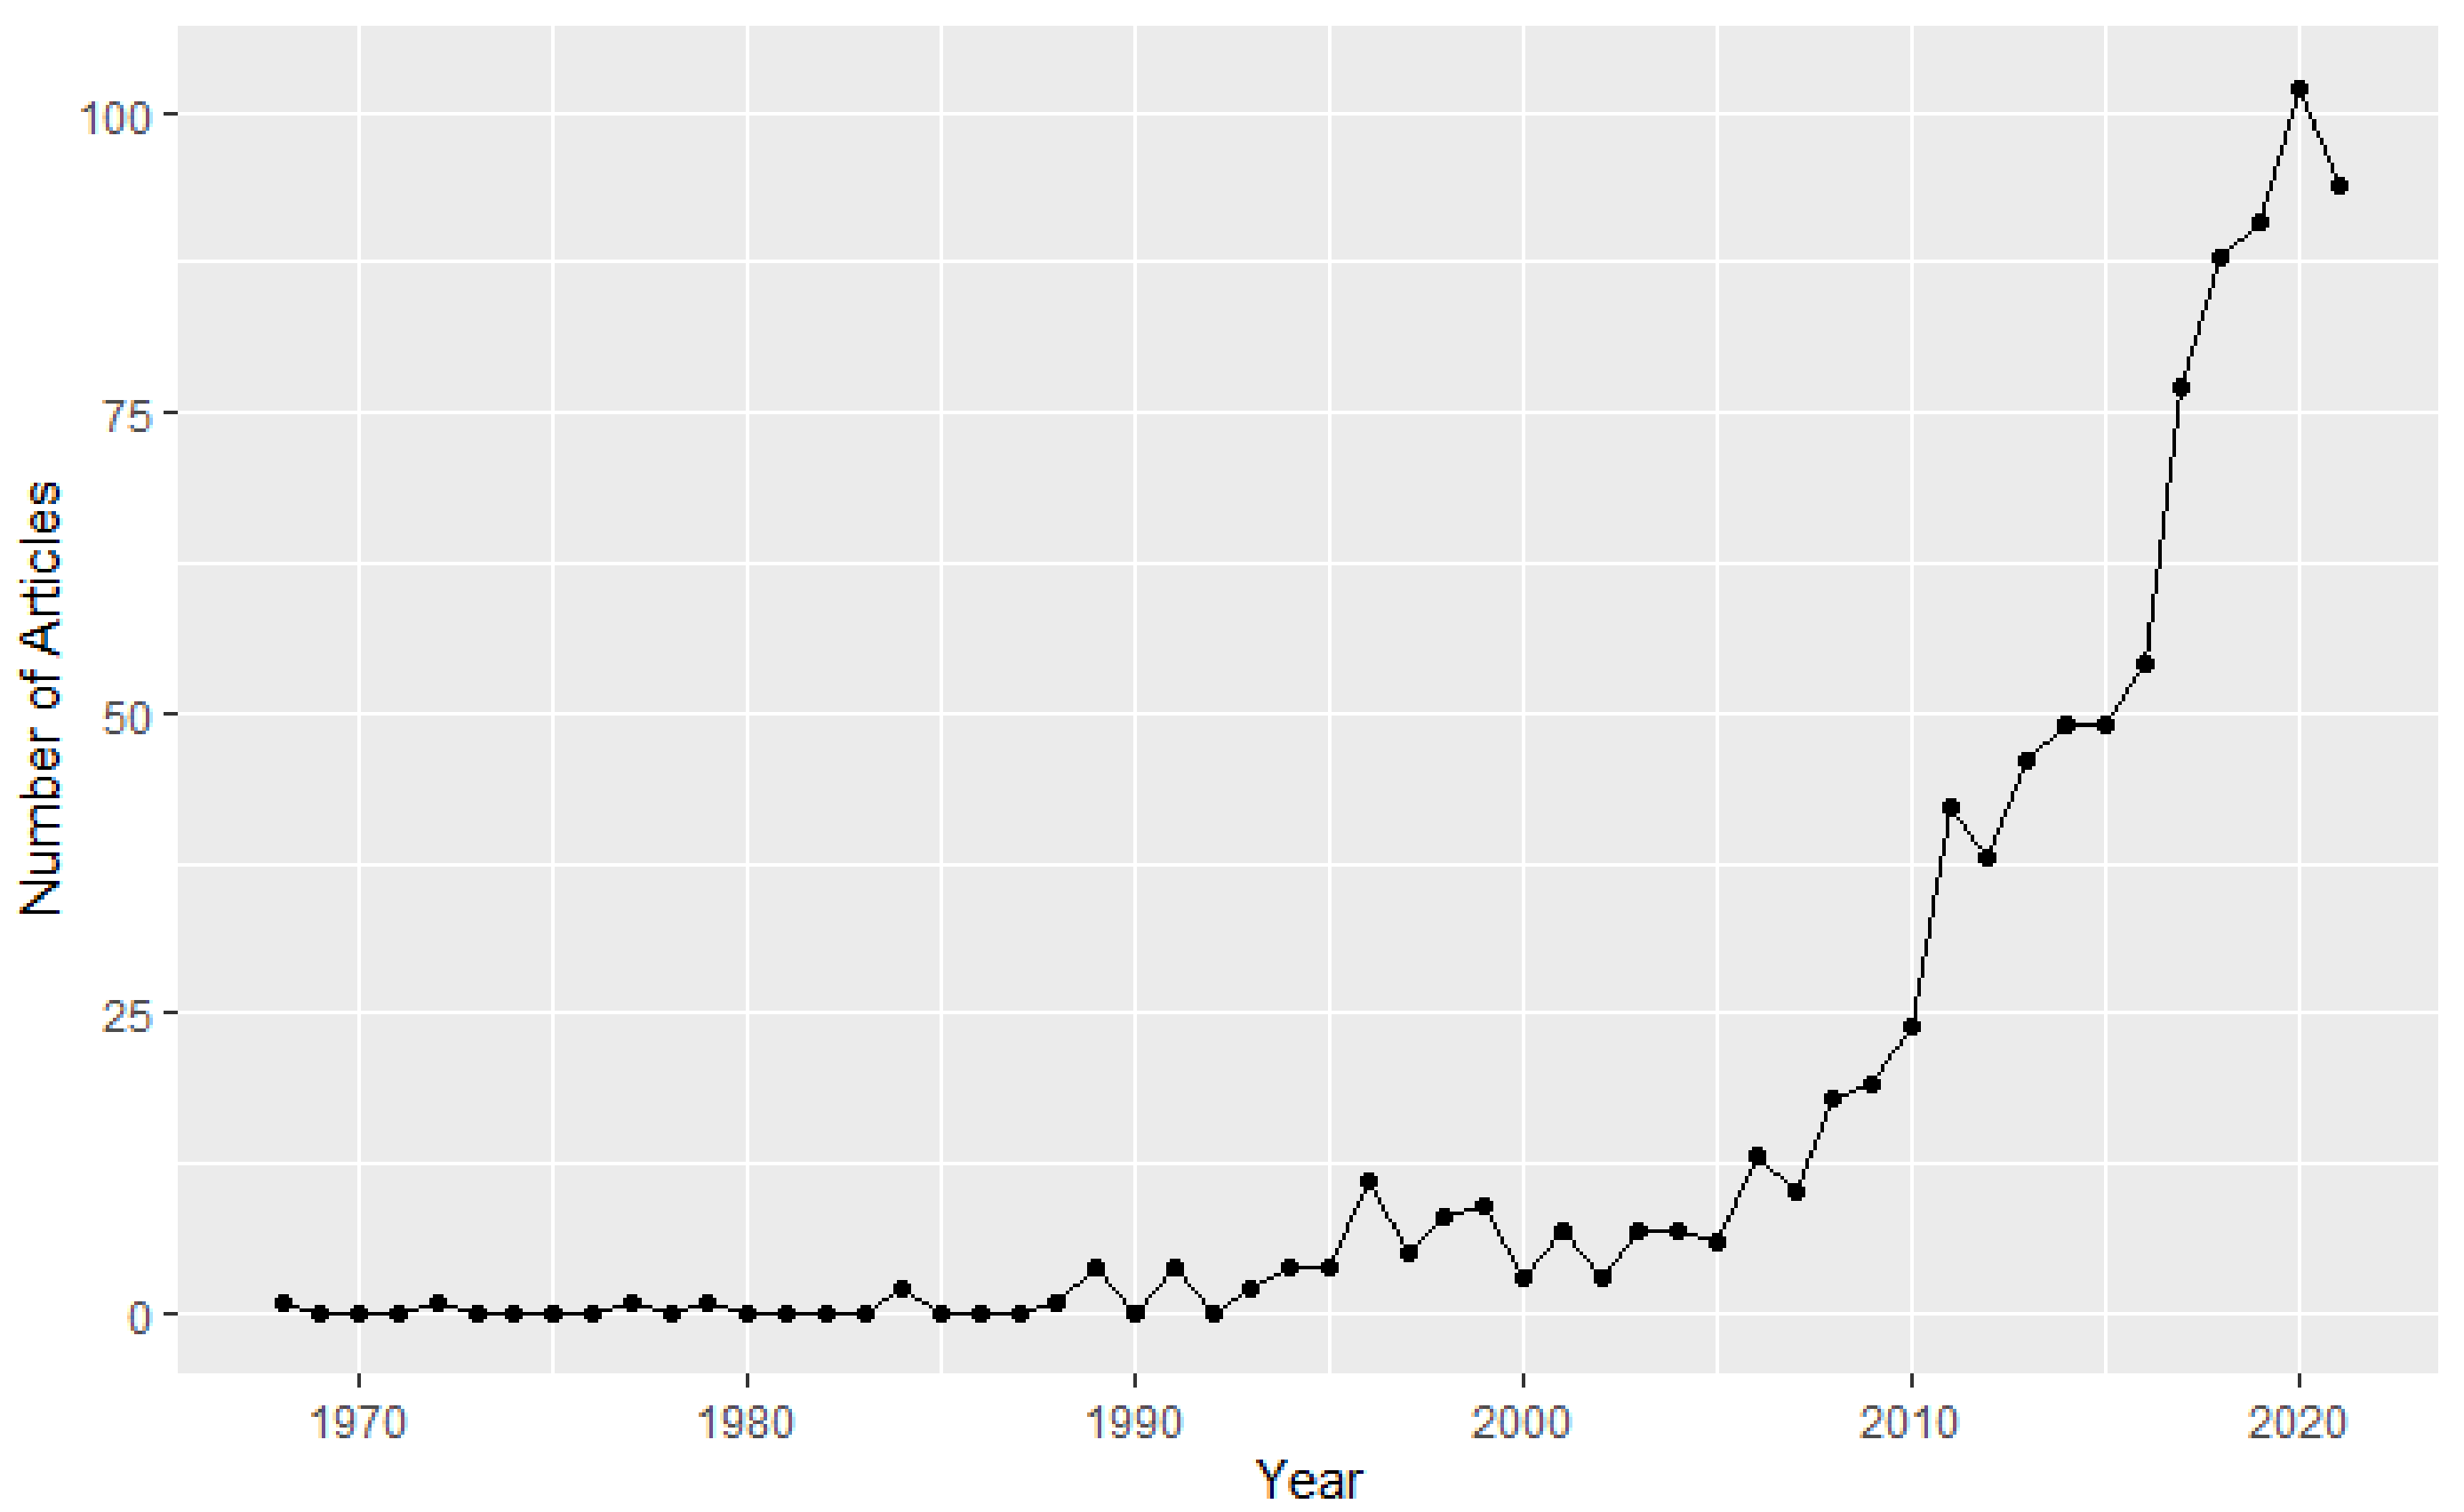
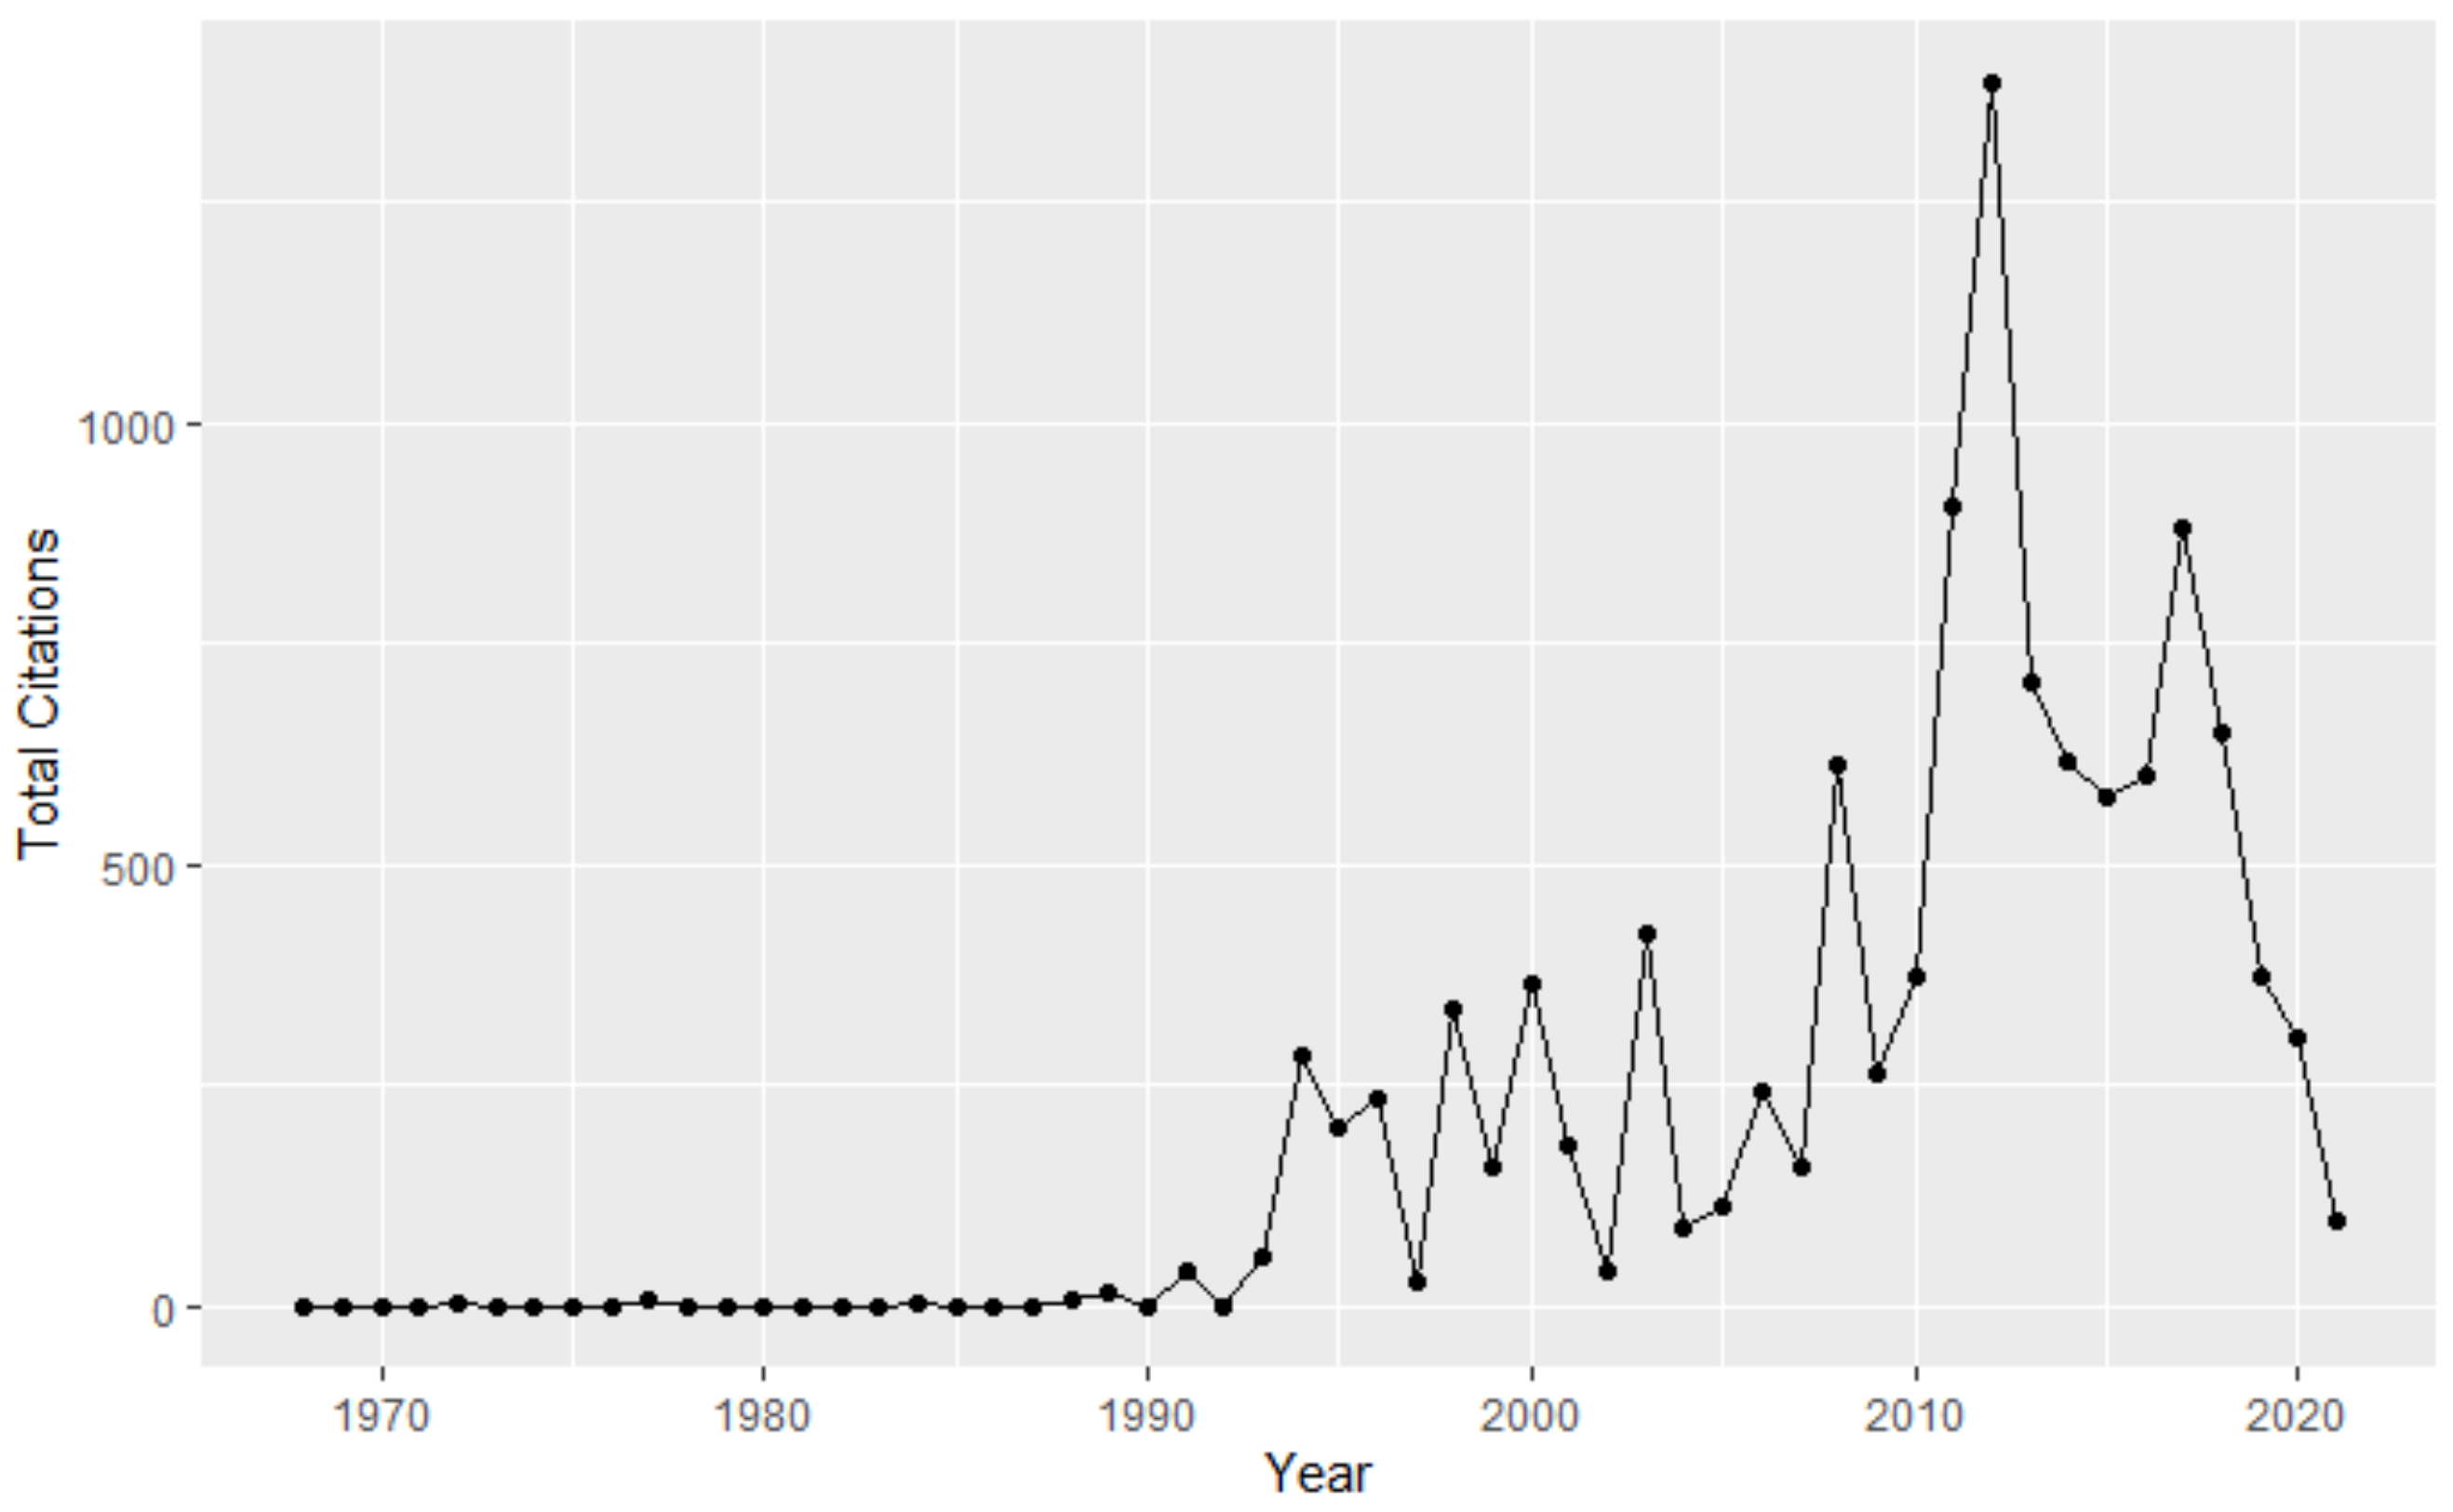
3.2. Publication and Citation Trends

Figure 1 shows the annual scientific production of the research field. The annual scientific growth rate was nearly 13.5%. As shown in Figure 1, there was a large increase in the number of publications in the past decade (2011–2021), comprising 80% of the articles. This means that stylometry is a growing research field that is receiving more and more attention from researchers. Furthermore, stylometry will take place in research publications around the world in the future. Looking at Figure 1, the higher number of research articles was published in 2020, whereas the lowest number of publications was published over the 1970–1990 period. However, the number of publications decreased slightly in 2021, and this may be due to the fact that there is a significant delay between the publication of articles and their appearance in the Scopus database.
Figure 2 shows the total citations throughout the entire period of the research field. From this figure, we can see that in the early years of the research field (1970–1990), there was a low number of citations, and this was due to the lower number of publications in this period. Between 1993 and 2013, the pattern of citations received per year was variable, reaching the highest number of citations (1385 citations) in 2012. Then, the number of citations remained around 600–700 from 2013 to 2018 and decreased significantly after 2019. This decreasing trend may be caused by the small citation period.

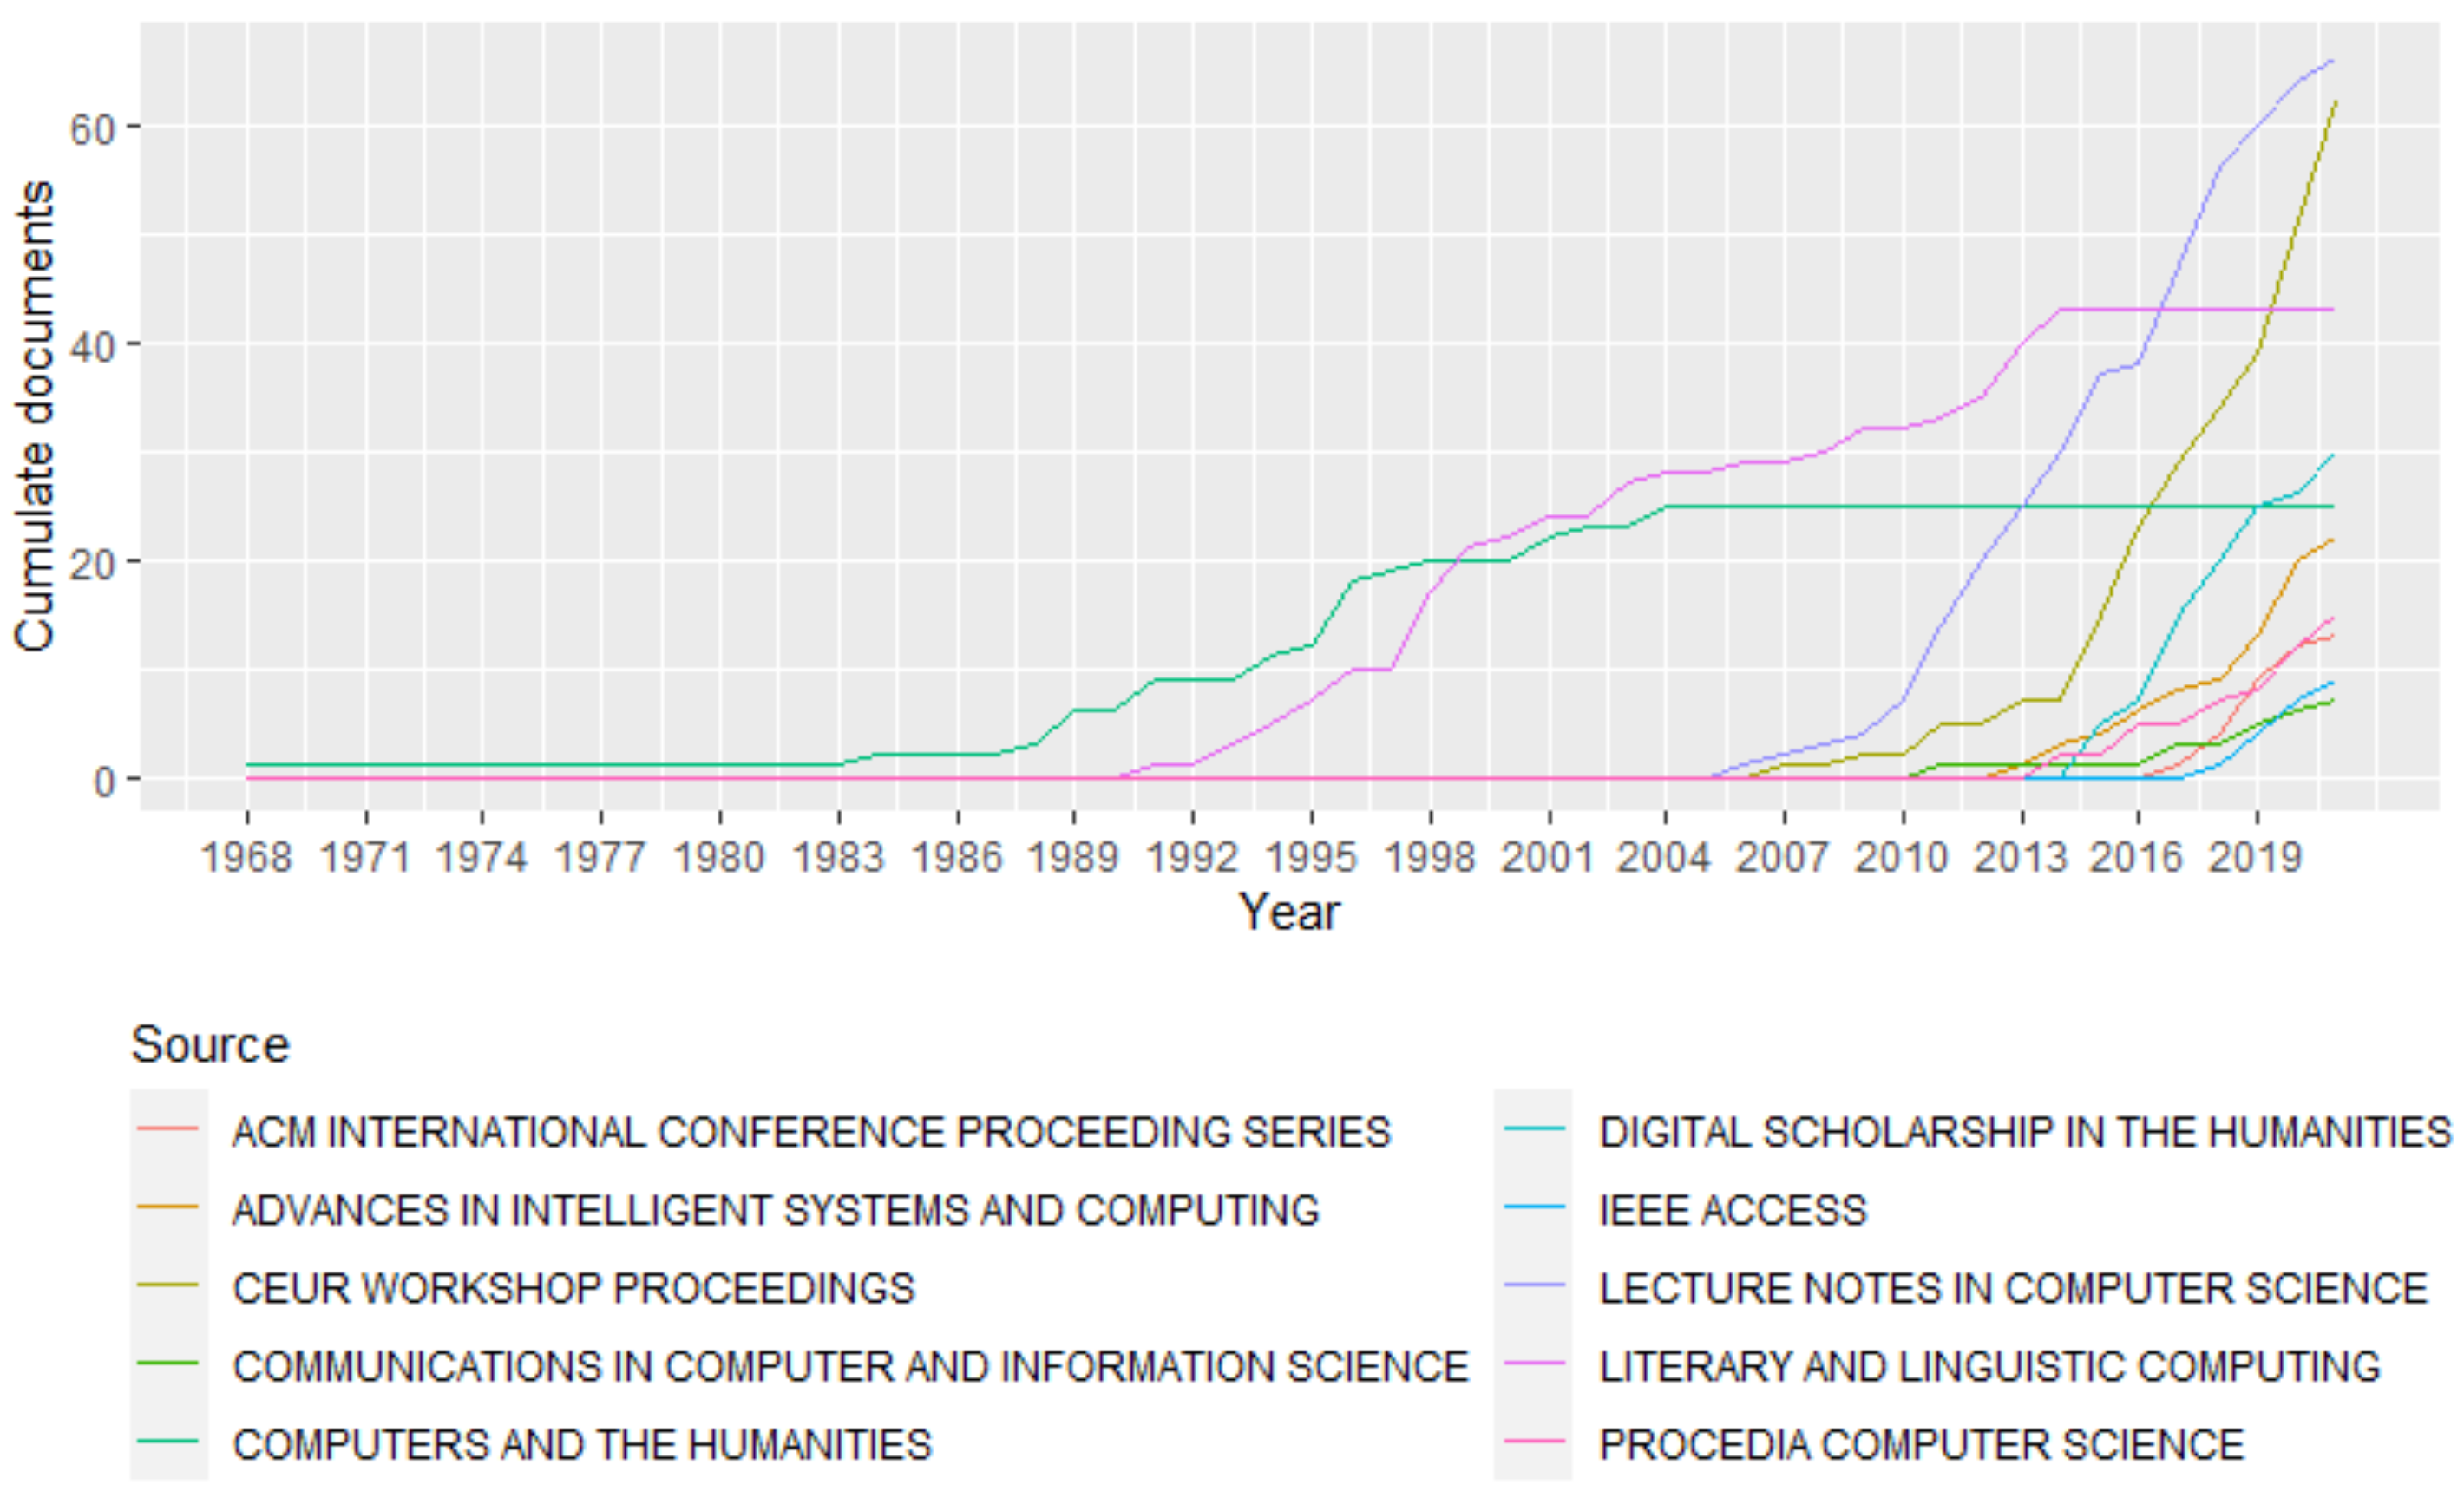
3.3. Most Productive and Influential Sources

Table 2 presents the top productive sources (journals and conferences) that attract a large number of publications on stylometry research. These sources cover 38% of the publications in our bibliographic collection. The top three journals that cover articles on stylometry are Literary and Linguistic Computing, Digital Scholarship in the Humanities and Computers and the Humanities. On the other hand, the top three conferences are Lecture Notes in Computer Science, CEUR Workshop Proceedings and Advances in Intelligent Systems and Computing.
Figure 3 shows the evolution of the cumulate number of publications for the top 10 sources (journals and conferences) over time. From this figure, we can see that the Computers and the Humanities journal covers papers from 1968 to 2004 and then discontinued. Furthermore, the Literary and Linguistic Computing journal published a large number of papers from 1991 to 2014. Then, this journal was renamed to Digital Scholarship in the Humanities in 2014, and it continues to publish an increased number of papers on stylometry today. On the other hand, Lecture Notes in Computer Science and CEUR Workshop Proceedings have published an increased number of papers on stylometry since 2006. Finally, the sources such as Advances in Intelligent Systems and Computing, Procedia Computer Science, ACM International Conference Proceedings Series, Communications in Computer and Information Science and IEEE Access show an increasing trend in the number of publications for the last five years.
Table 3 shows the 20 influential sources based on the total citations. From this table, we can observe that Literary and Linguistic Computing, Computers and the Humanities and Lecture Notes in Computer Science have achieved a high position with a relatively high number of publications. It is worth nothing that there are sources that have a high impact with a limited number of publications. For instance, the conference sources IEEE Symposium on Security and Privacy and Annual Meeting of The Association for Computational Linguistics ranked fourth and sixth overall in the number of citations, with three and one published papers, respectively. In addition, the journal sources such as Text, Computational Linguistics and Digital Investigation have a high impact with one, two, and three publications, respectively.

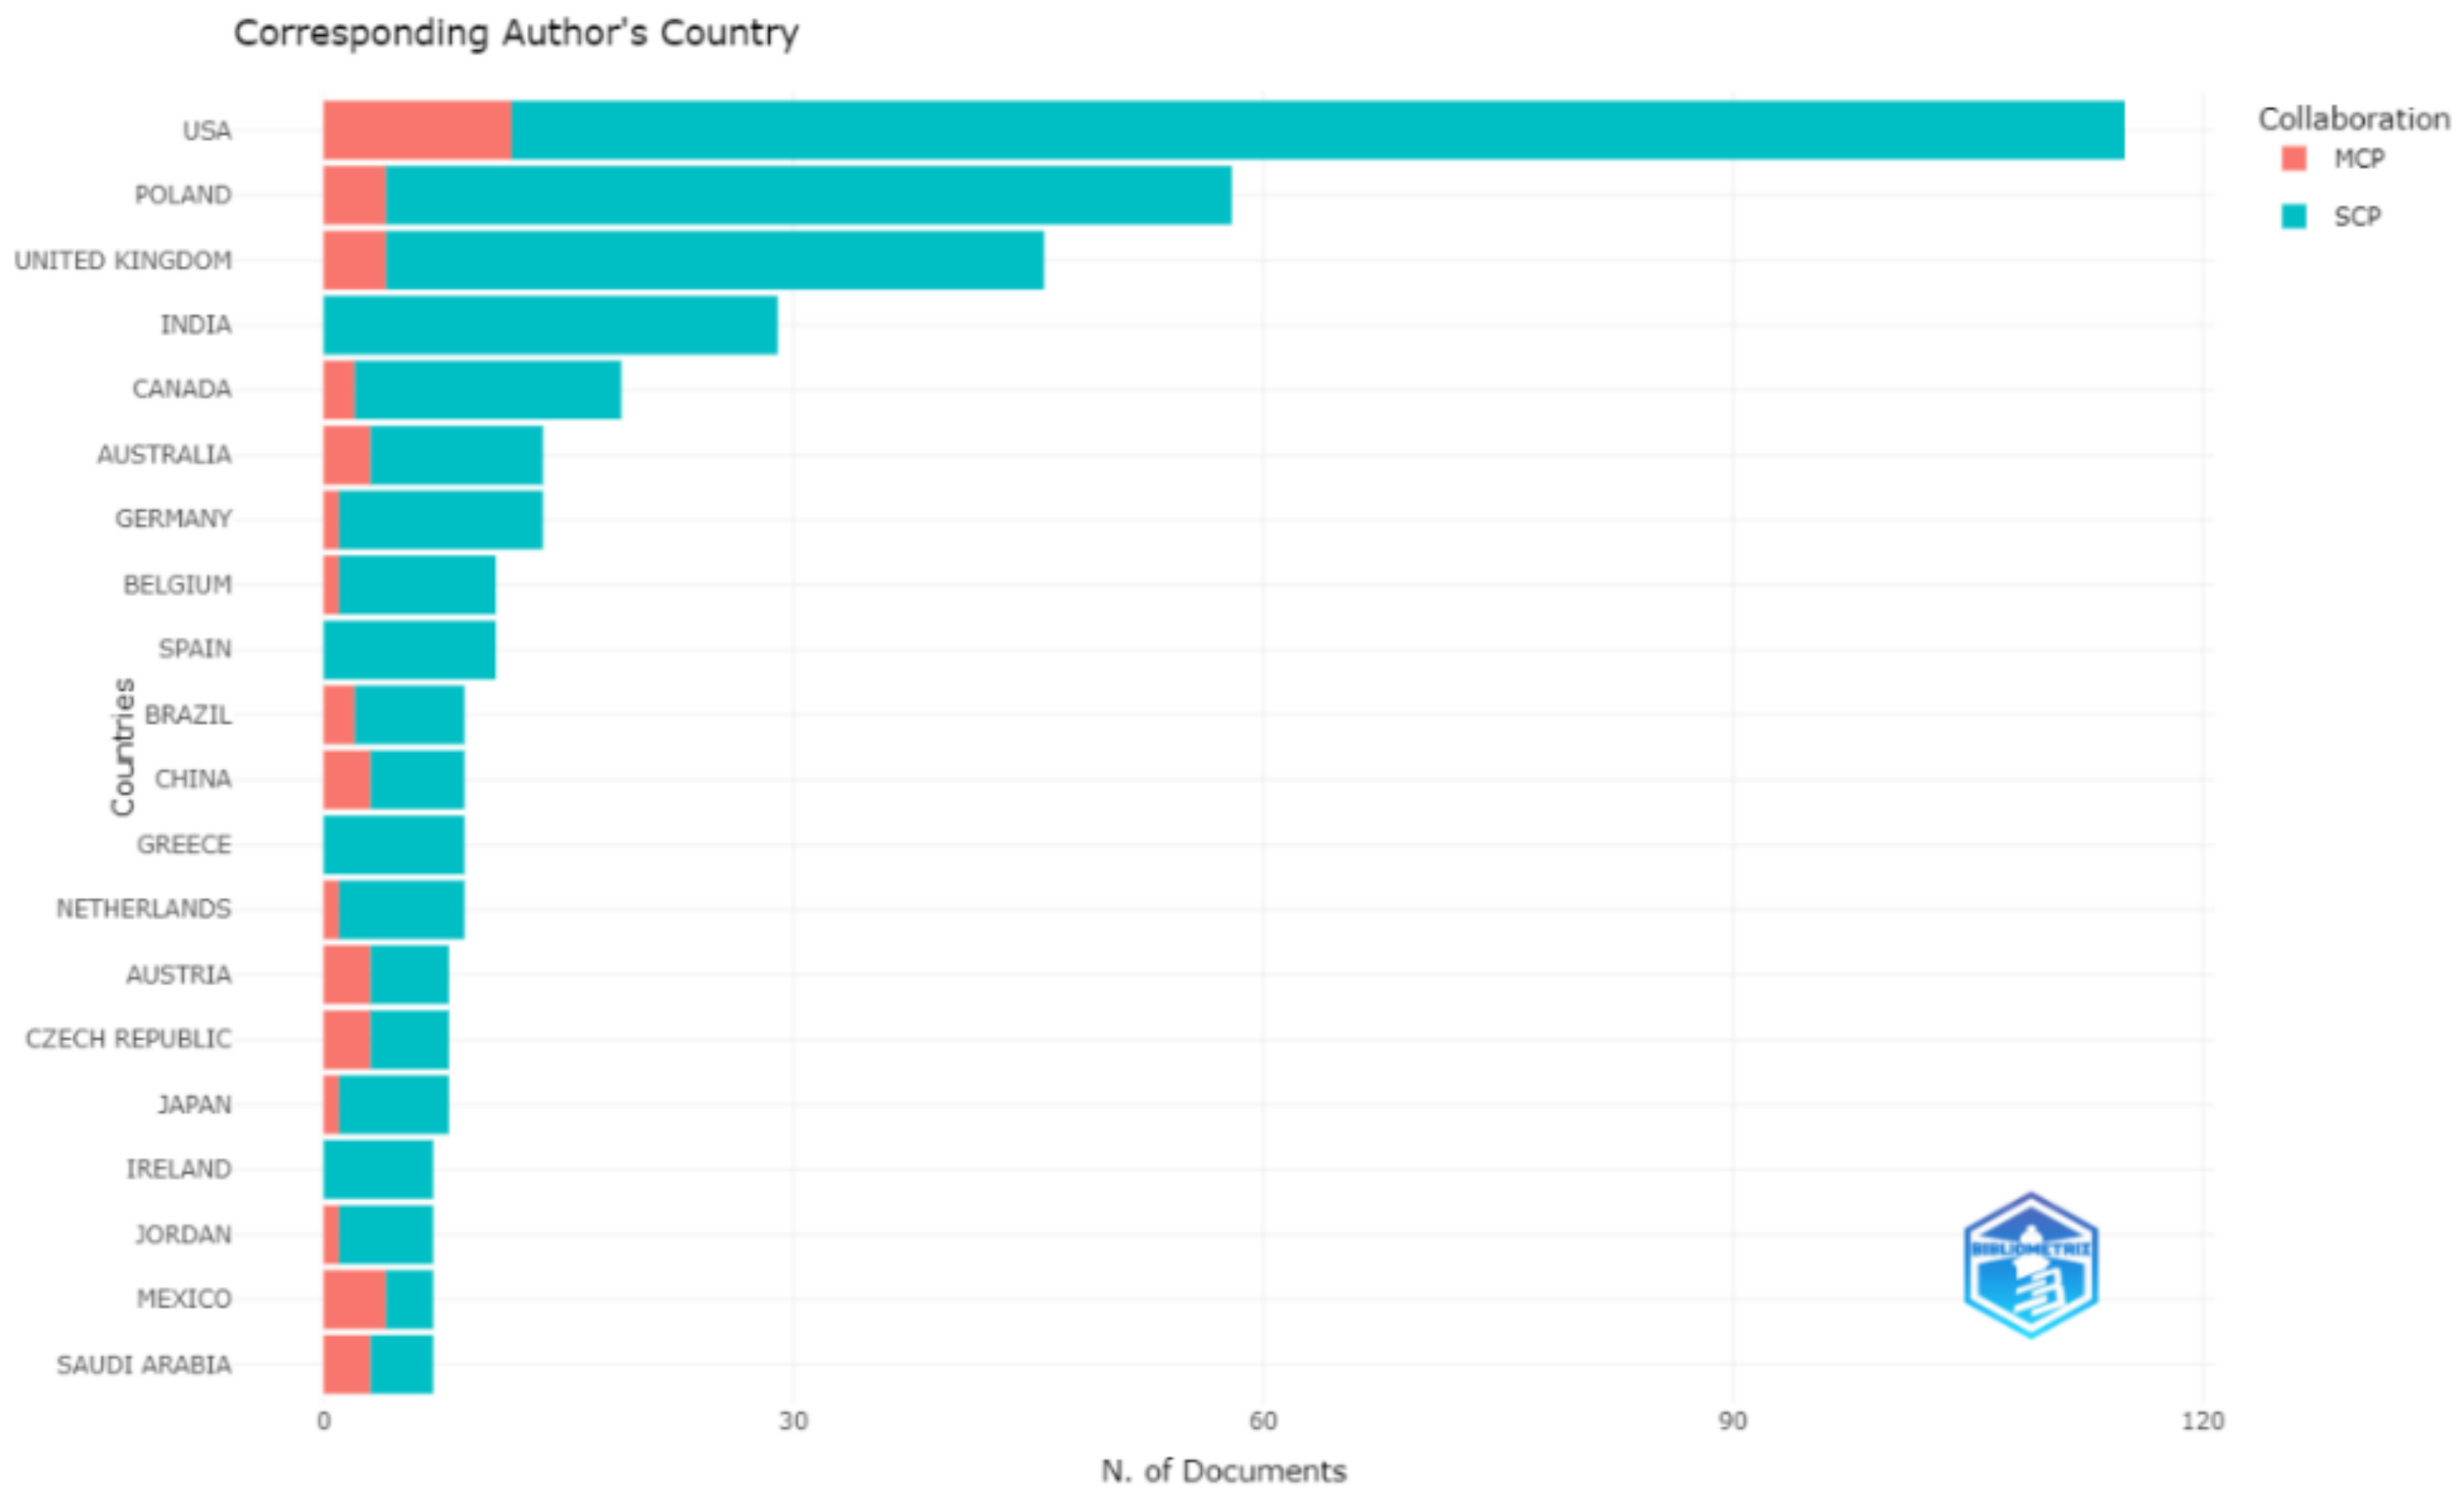
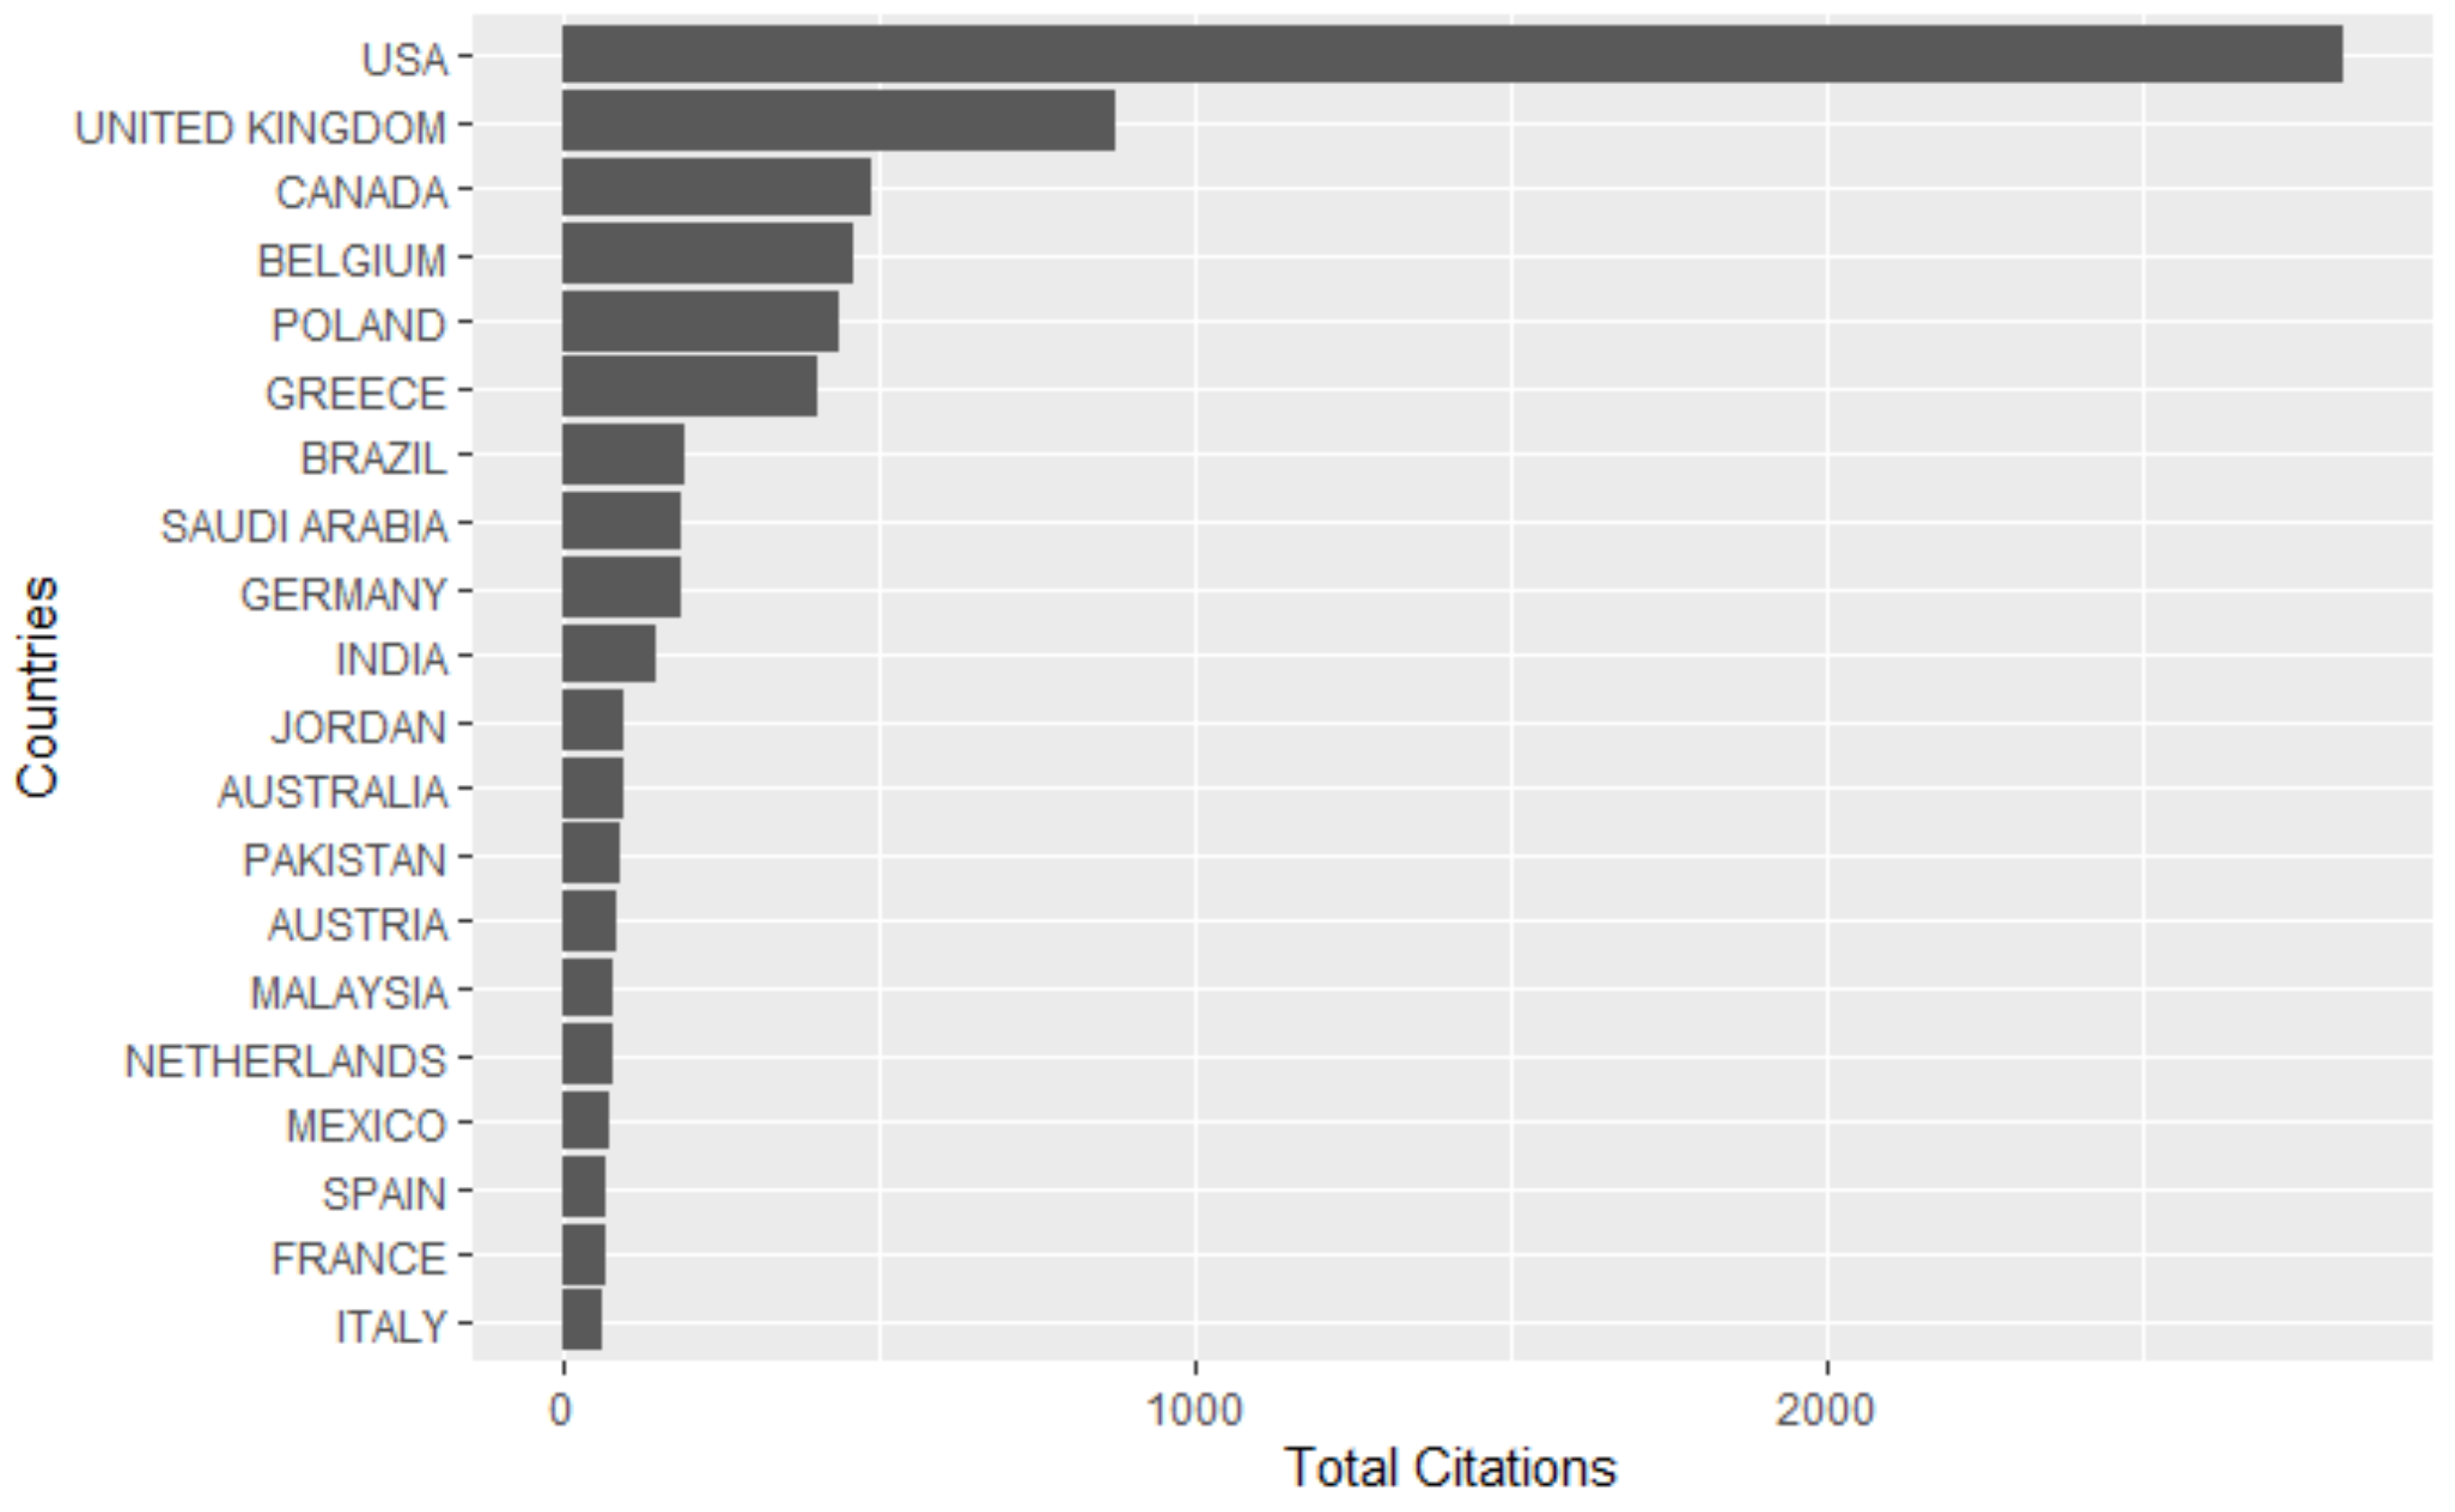
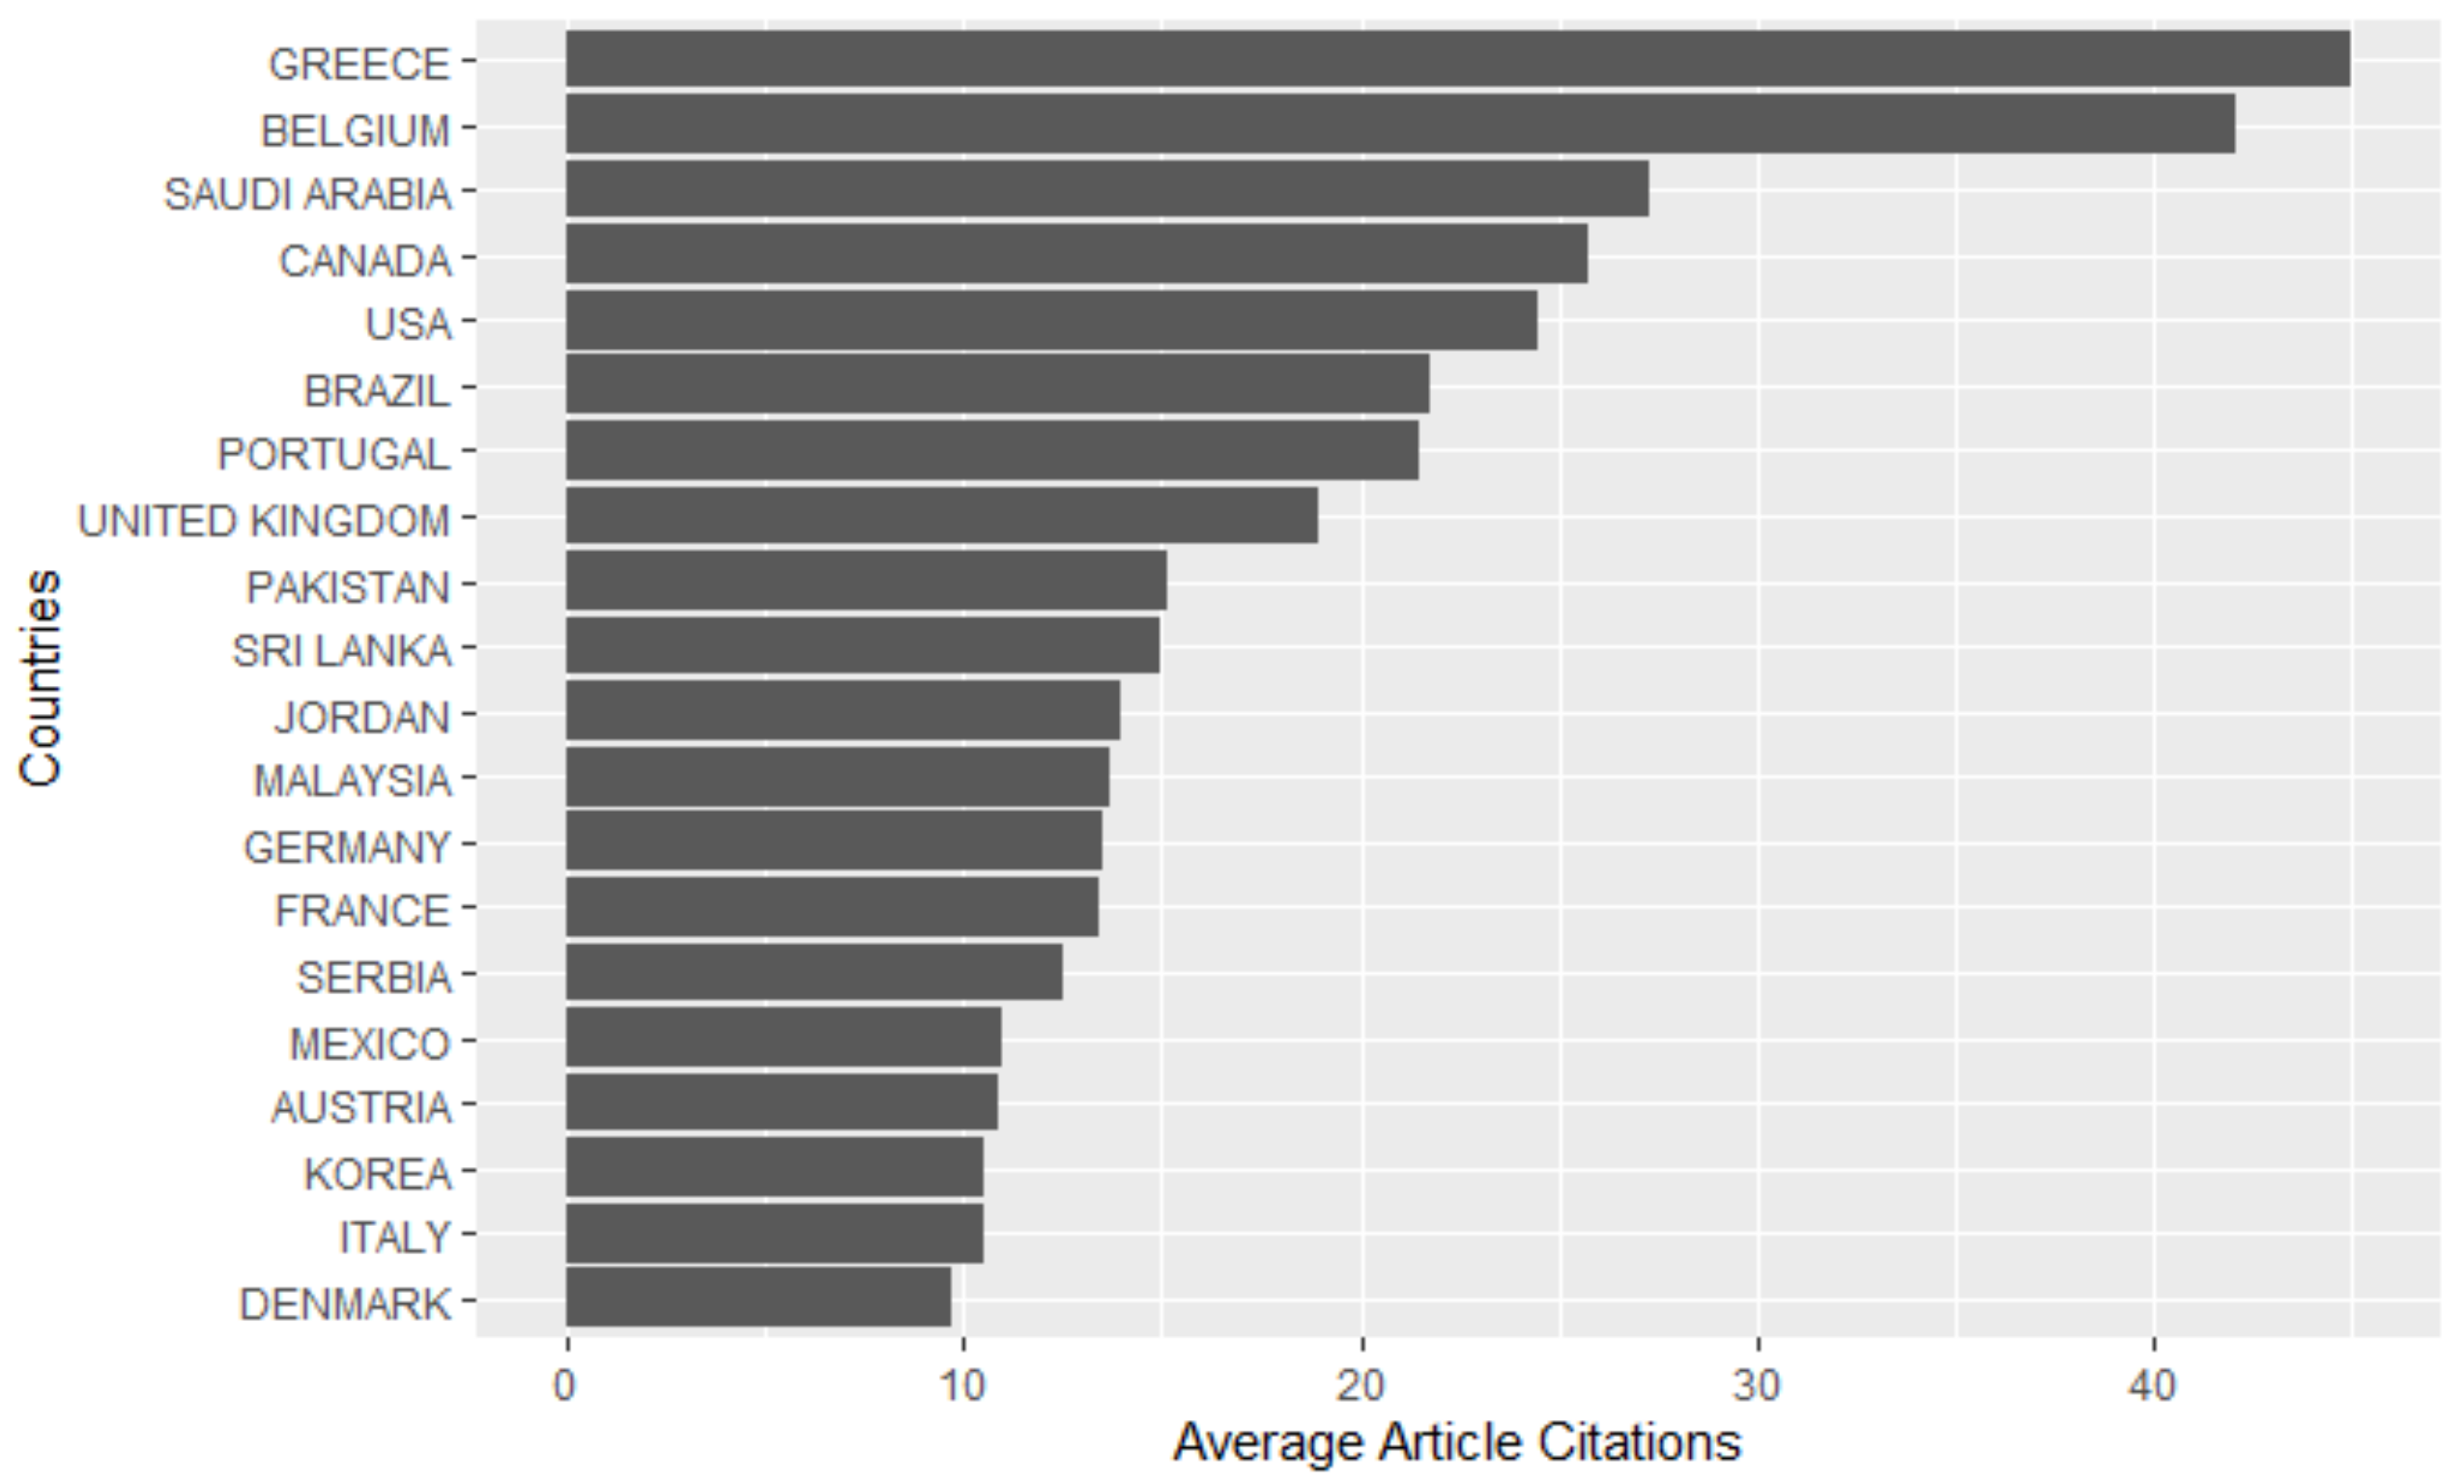
3.4. Most Productive and Influential Countries

Figure 4 shows the scientific production of countries regarding publications and the multi-country collaboration in stylometry research based on the corresponding author’s country. SCP is the abbreviation of Single Country Publications and MCP is Multiple Country Publications. From these results it is shown that the USA, Poland, and the UK have published 115, 58, and 46 articles, respectively. Twelve of the 118 articles from the USA were obtained with international collaboration. Therefore, the countries with a high number of international collaborations are the USA, Poland, UK, Mexico, Australia, China, Austria, Czech Republic, and the Saudi Arabia. However, some observations can be made regarding the MCP ratio of the top twenty countries, i.e., as a proportion of total number publications. Mexico has the highest MCP ratio (57%), followed by the Saudi Arabia (43%), Austria (38%), and Czech Republic (38%). Meanwhile, other countries (such as India, Spain, Greece, and Ireland) have a relatively high number of contributed publications (7 to 29 articles) without international collaboration.
Figure 5 shows the most cited countries in the stylometry research field. This figure shows that the USA is the leader in this research field, followed by the UK and Canada. More specifically, these countries have a high impact because they have contributed many research publications in this field. However, countries such as Greece, Belgium, and Saudi Arabia have a high average citation rate, as is shown in Figure 6, and this means that they received a high number of citations compared to the number of published articles.

3.5. Most Cited Papers

Table 4 shows the top 20 articles based on total citations. As we can observe from the results reported in Table 4, the study by Agramon, Koppel, Fine, and Shimoni (2003) [6] has received the highest number of citations, followed by those written by Feng, Banerjee, and Choi (2012) [7] and by Holmes (1998) [8]. Six of the top 20 highest ranked papers are review papers, and the others are research articles.
The works by Holmes (1998) [8], Holmes (1994) [11], Alzahrani, Salim, and Abraham (2012) [15], Eder, Rybicki, and Kestemont (2016) [19], Rocha et al. (2017) [22] as well as Holmes and Forsyth (1995) [17] are review papers. More specifically, Holmes (1998) presents a detailed discussion on the historical development of stylometry [8]. Holmes (1994) examines a set of stylometric variables which can be used as a stylistic fingerprint of an author and a set of statistical methods to address the authorship attribution problem [11]. Alzahrani, Salim, and Abraham (2012) present a taxonomy of plagiarism and linguistic patterns and examine state-of-the-art techniques for plagiarism detection [15]. Eder, Rybicki, and Kestemont (2016) is a software paper review which describes Stylo, a R package for the high-level analysis of writing style in stylometry [19]. Rocha et al. (2017) provide a review of the methods of authorship attribution that can be applied to the problem of social media forensics [22]. Finally, Holmes and Forsyth (1995) present three stylometric methods for authorship attribution in the Federalist Papers. The methods are based on vocabulary richness, word frequency analysis, and the use of machine learning based on a genetic algorithm [17].
The paper by Agramon, Koppel, Fine, and Shimoni (2003) explores the differences in writing style between male- and female-authored documents in a corpus of 604 documents from the British National Corpus [6]. The works by Peersman, Daelemans, and Vaerenbergh (2011) and Cheng, Chandramouli, and Subbalakshmi (2011) refer to the authorship profiling problem to predict gender and age in online social media using machine learning methods [13,14].
The works by Feng, Banerjee, and Choi (2012) [7], Abbasi and Chen (2008) [9], Narayanan et al. (2012) [12], Afroz, Brennan and Greenstadt (2012) [16], Potthast, Kiesel, Reinartz, Bevendorff, and Stein (2018) [18], Brennan, Afroz, and Greenstadt (2012) [23], and Iqbal, Binsalleeh, Fung, and Debbabi (2010) [25] refer to adversarial stylometry. There are three forms of adversarial stylometry: obfuscation, imitation, and translation. Obfuscation is a subject’s attempt to hide their identity, imitation is a subject’s attempt to frame another subject by imitating their writing style, and translation involves the original passages being obfuscated with machine translation services [23]. These papers deal with the various forms of adversarial stylometry and social media forensics using several methods of machine learning.
The paper by Stamatatos, Fakotakis, and Kokkinakis (2000) proposed a classification model based on stylometric features extracted from a natural language processing tool for addressing the authorship verification problem [10]. The proposed model was applied to texts in Modern Greek. The authorship verification problem examines whether two documents were written by the same author. Furthermore, the paper by Lyckx and Daelemans (2008) proposed a framework for authorship attribution and verification for many authors compared to previous studies focused on authorship attribution for a small number of authors and unrealistic data sizes [21].
The paper by Fridman, Weber, Greenstadt, and Kam (2017) presented an approach for active authentication on mobile devices, which is a variant of the authorship attribution problem of stylometry [24]. Another variant of the authorship attribution problem is the work by Caliskan-Islam et al. (2015), which investigated machine learning methods to deanonymize source code authors of C/C++ using coding style [20].

4. Science Mapping Results

In this section, we present results from science mapping analysis including topic and keywords trends, co-citation structure, and country collaboration patterns.

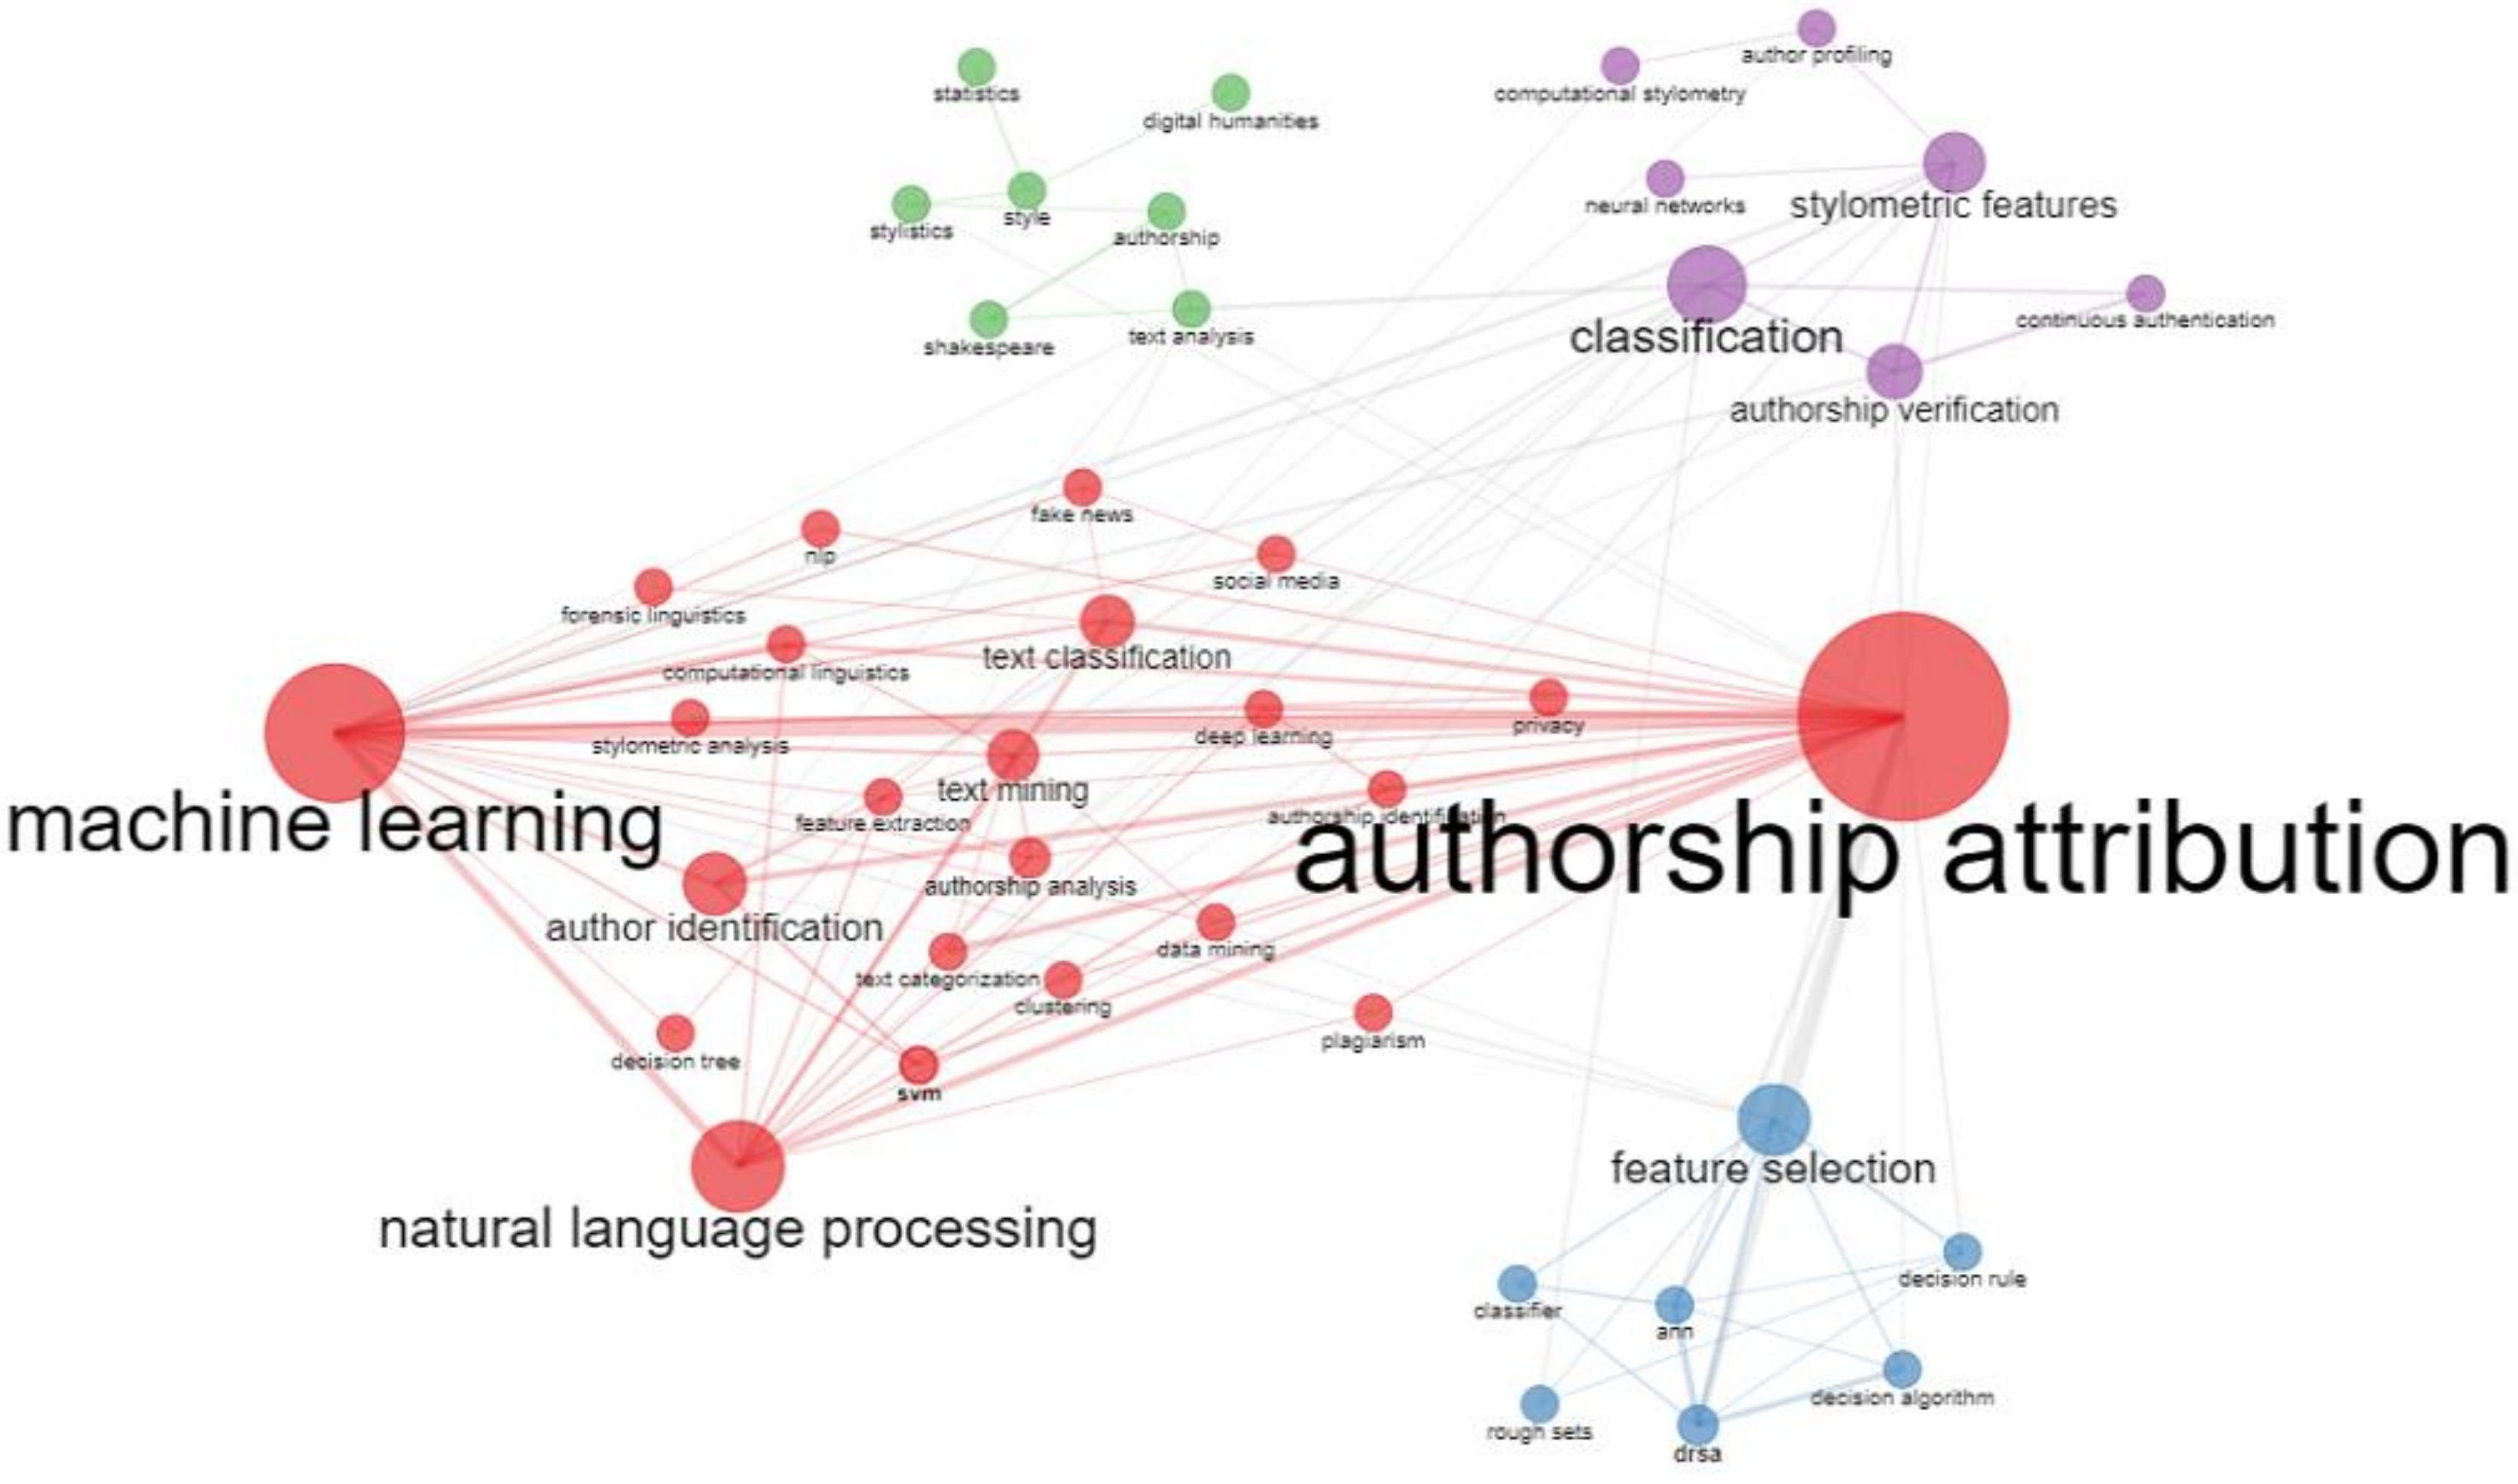
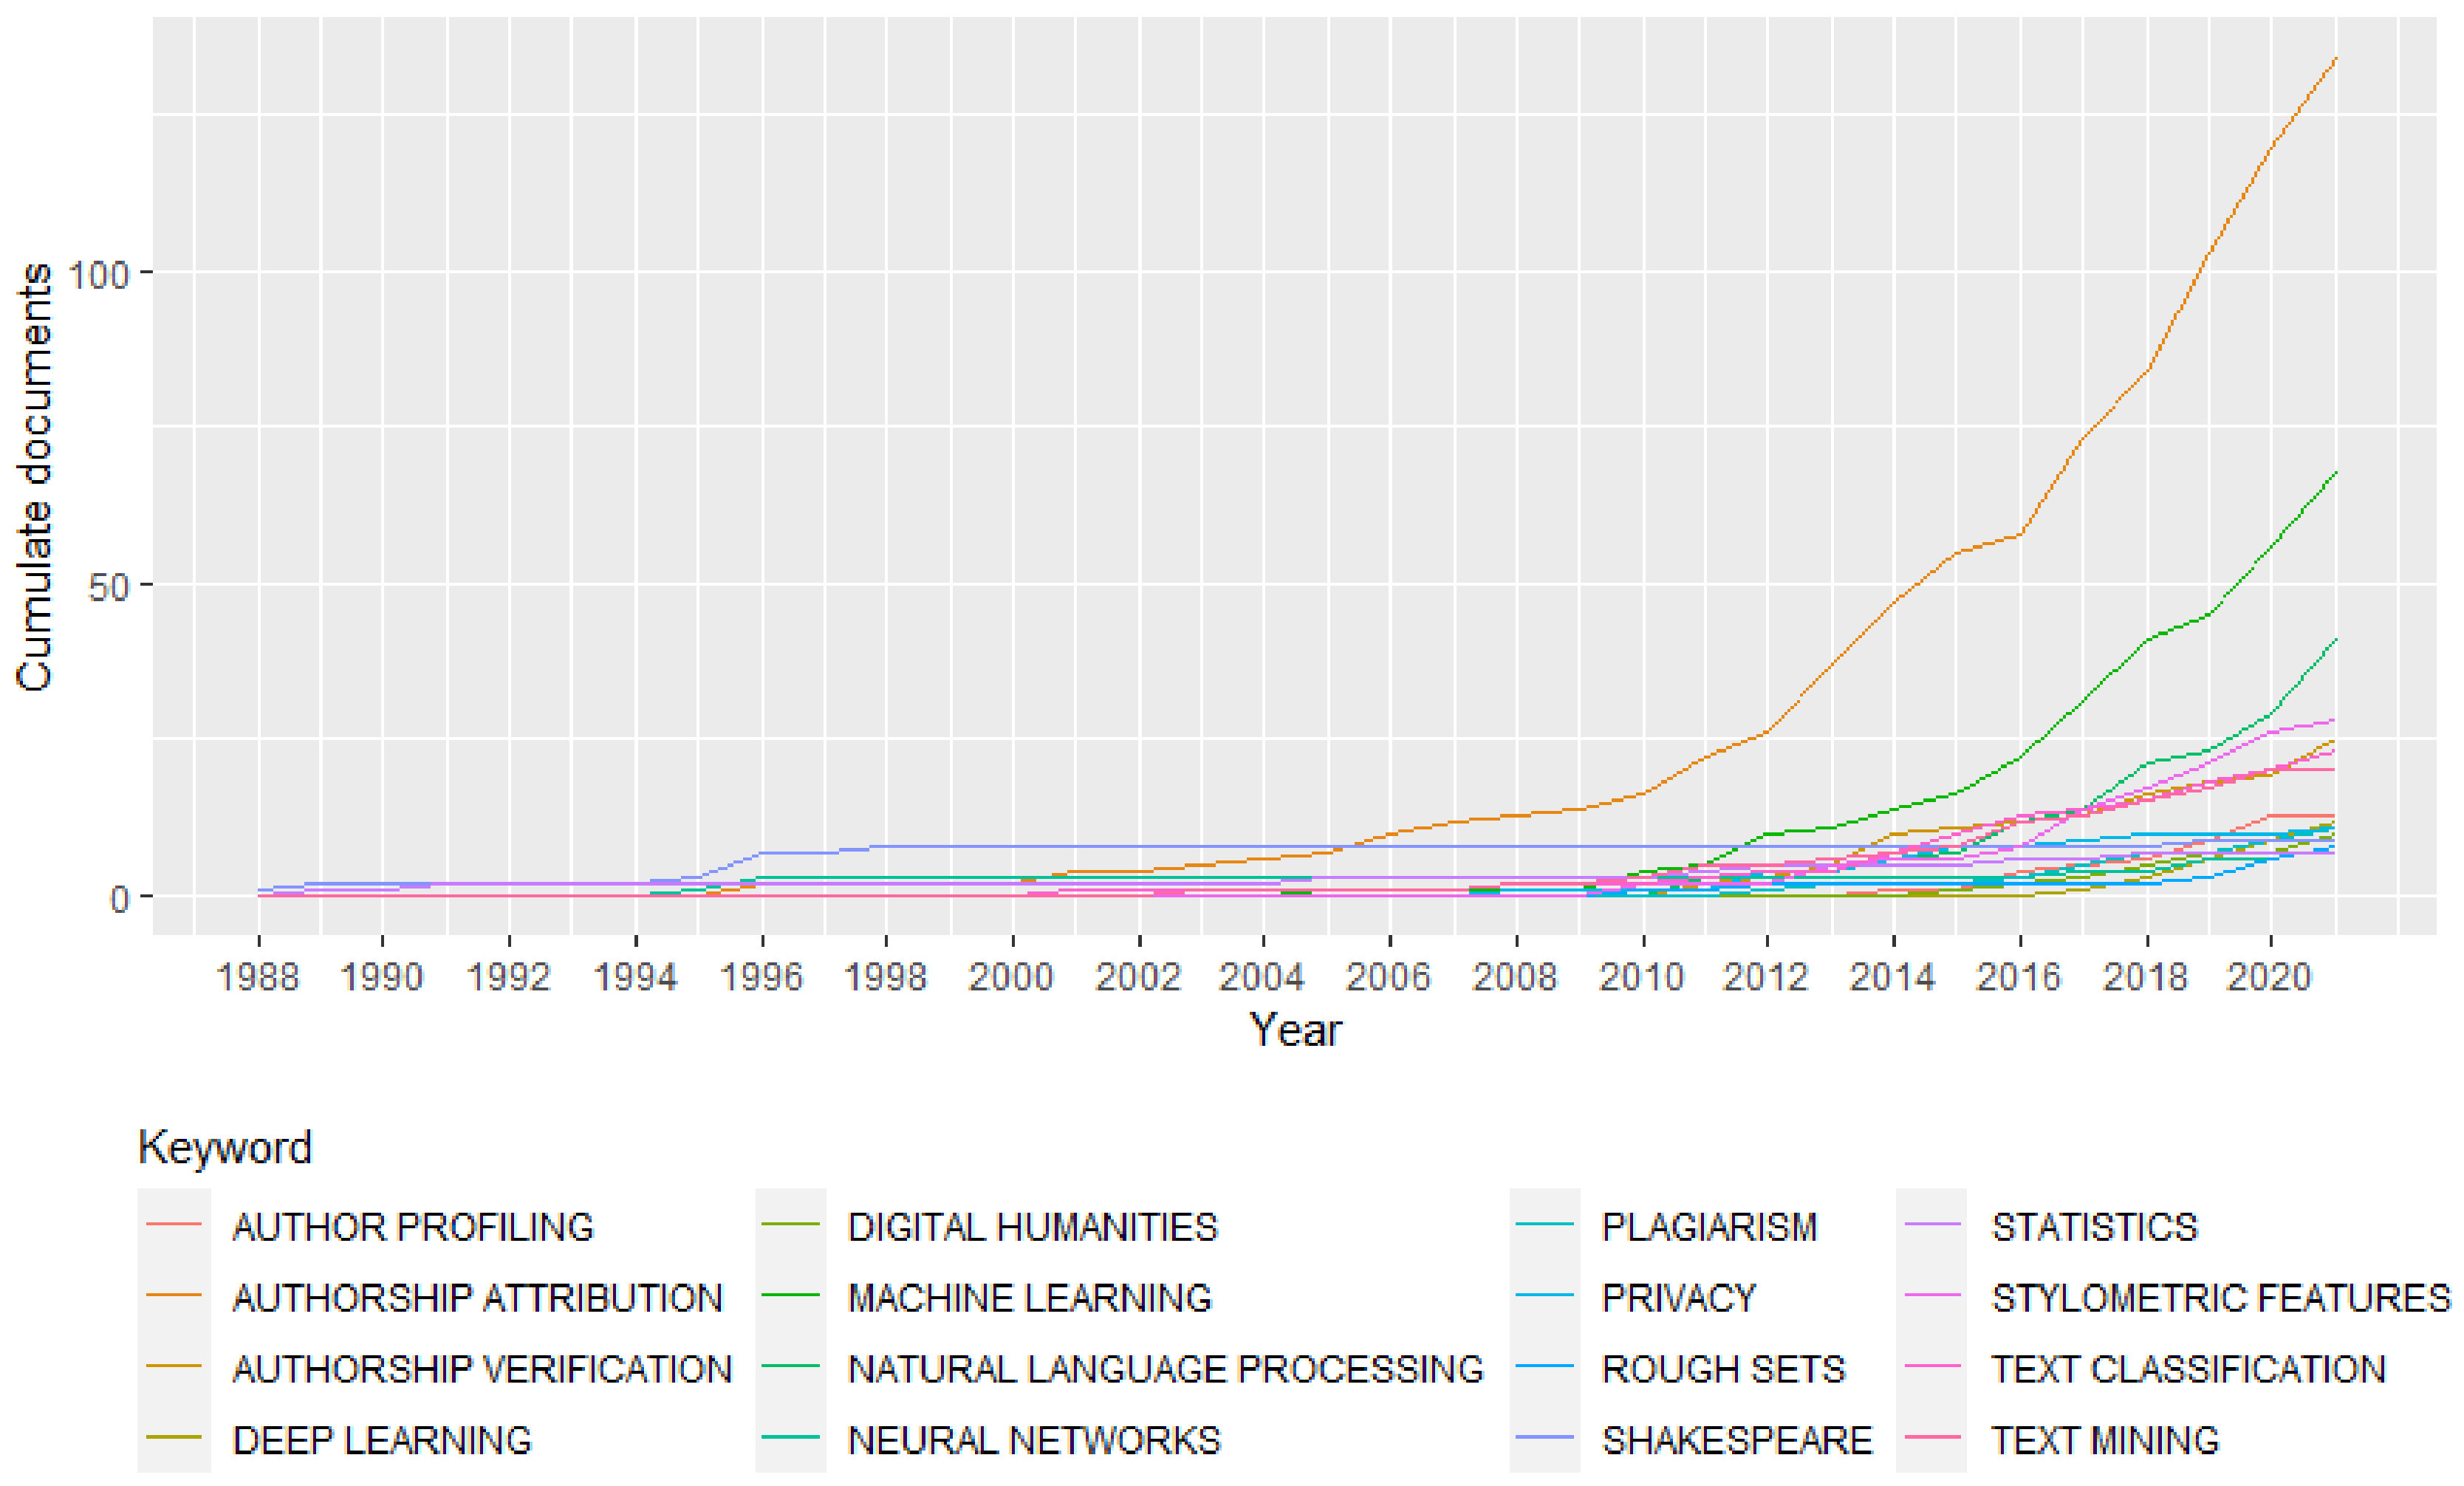
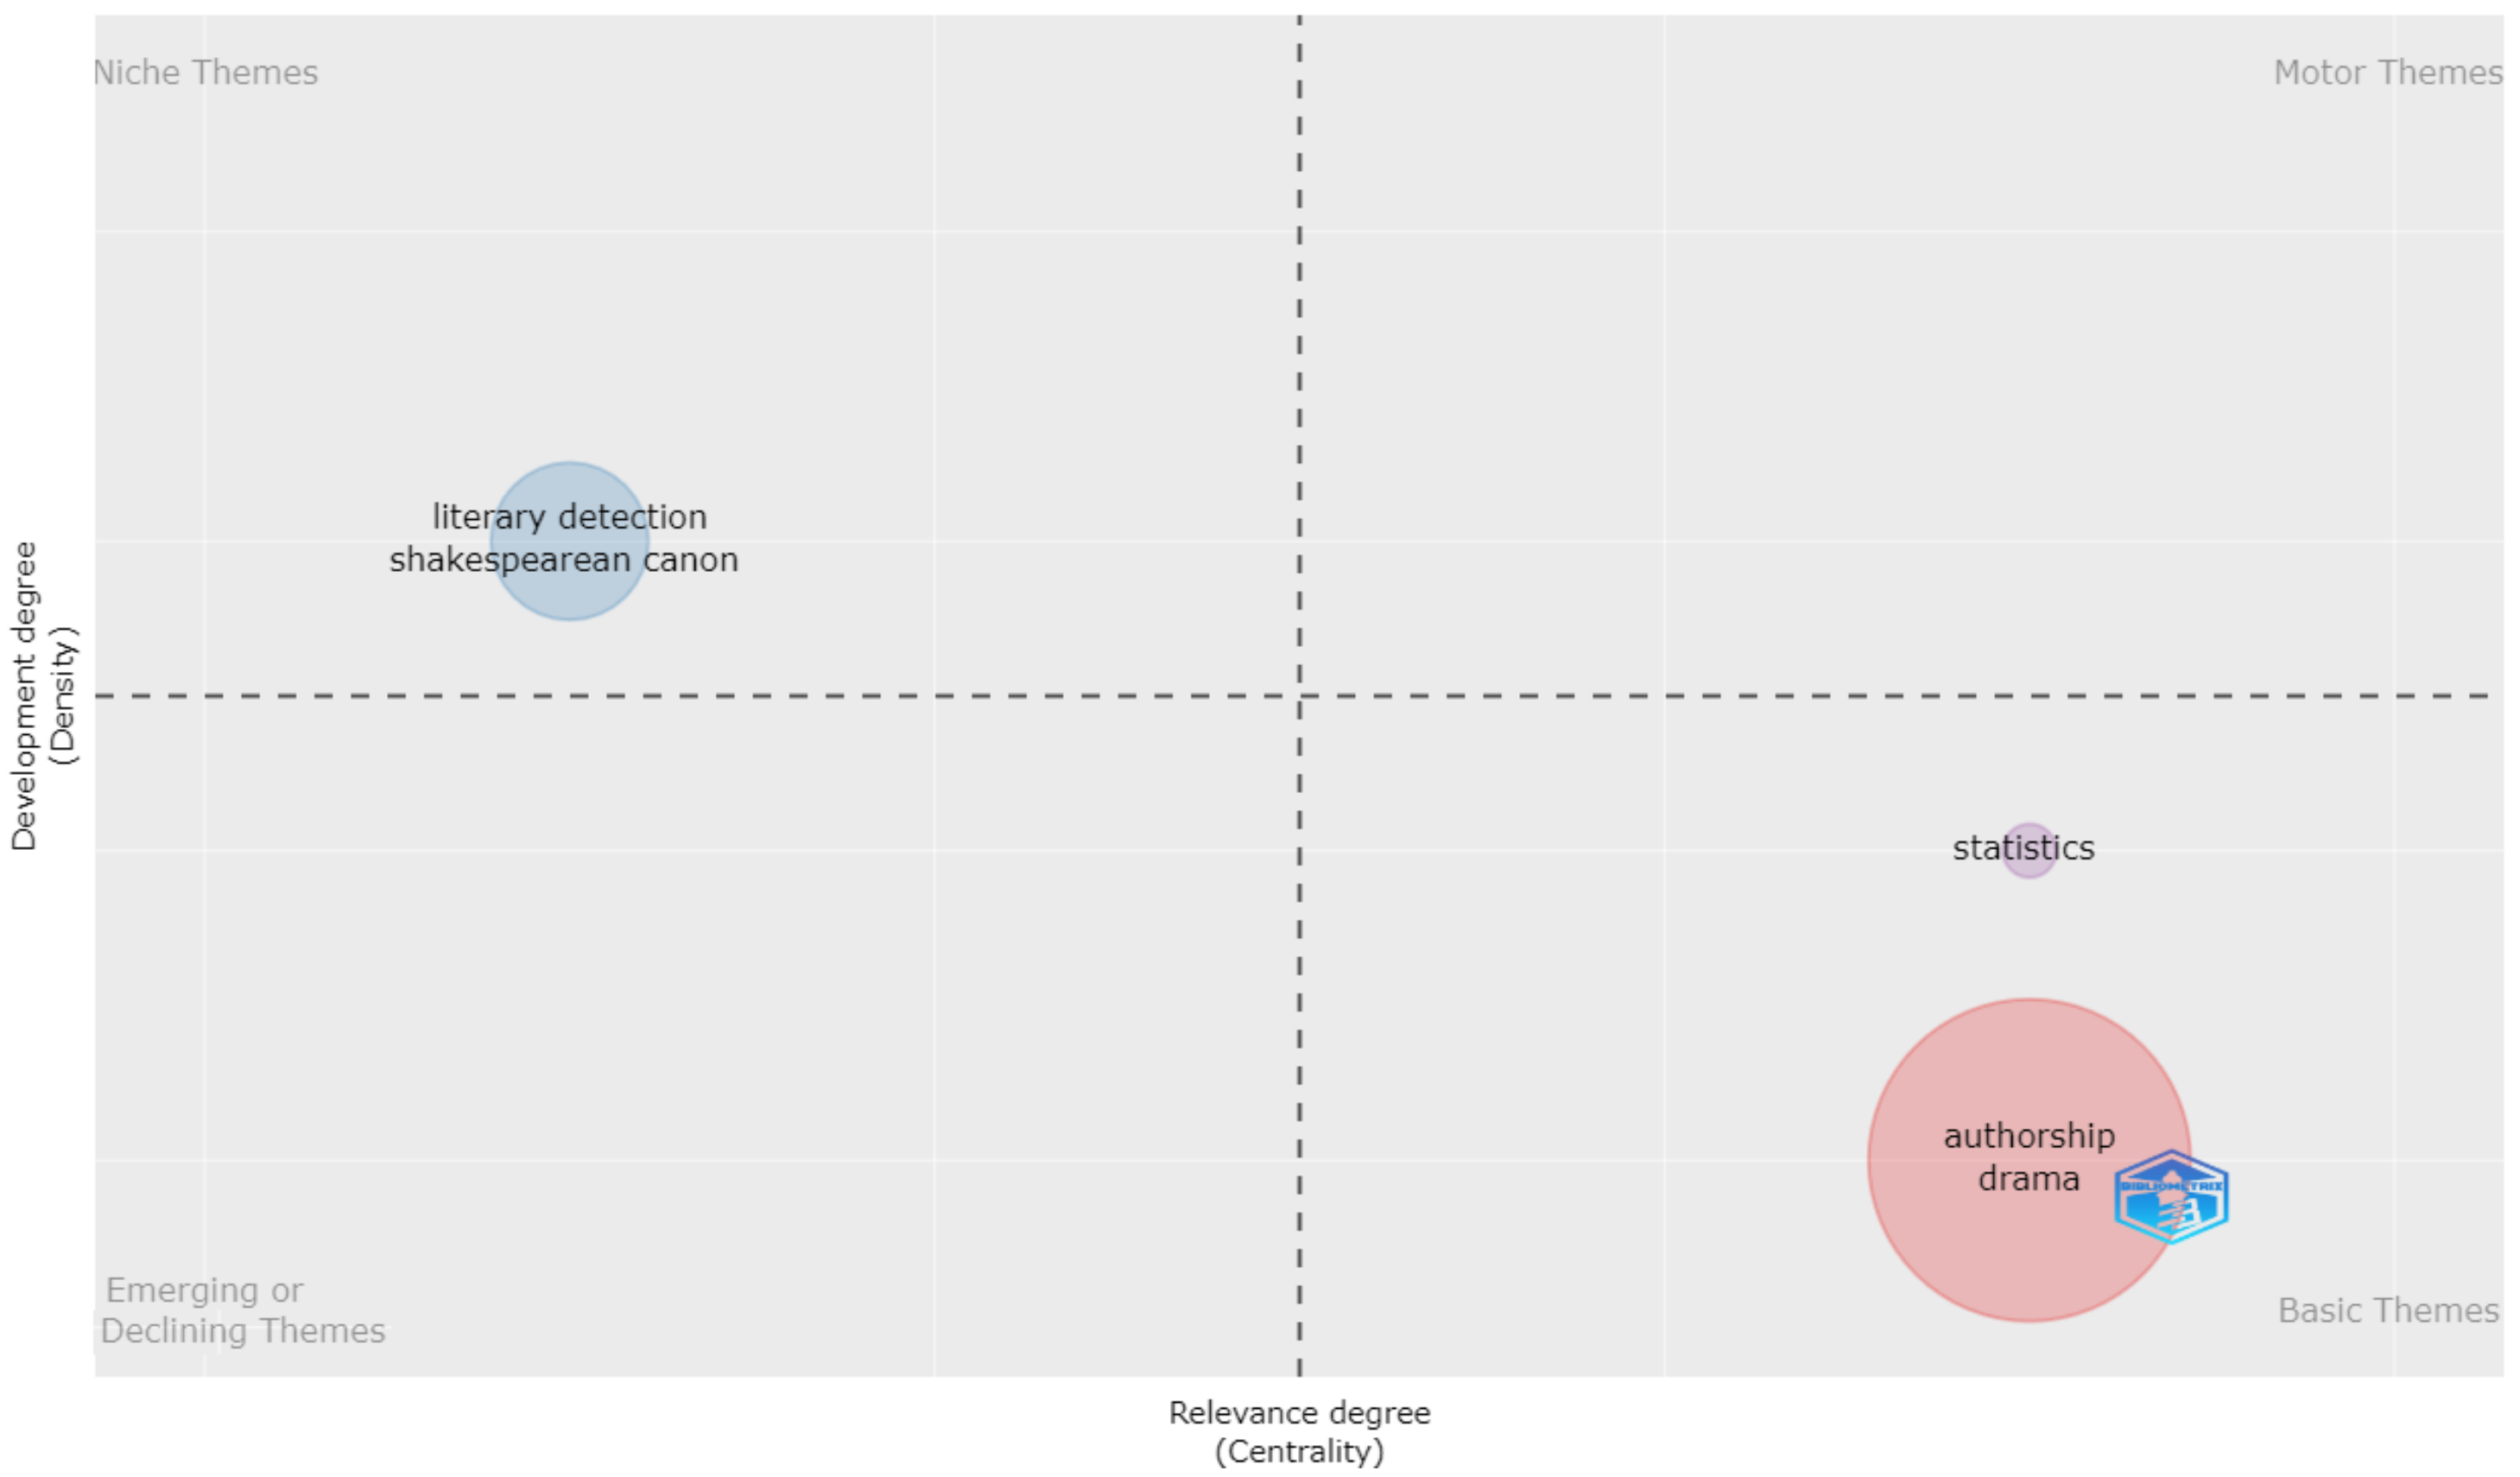
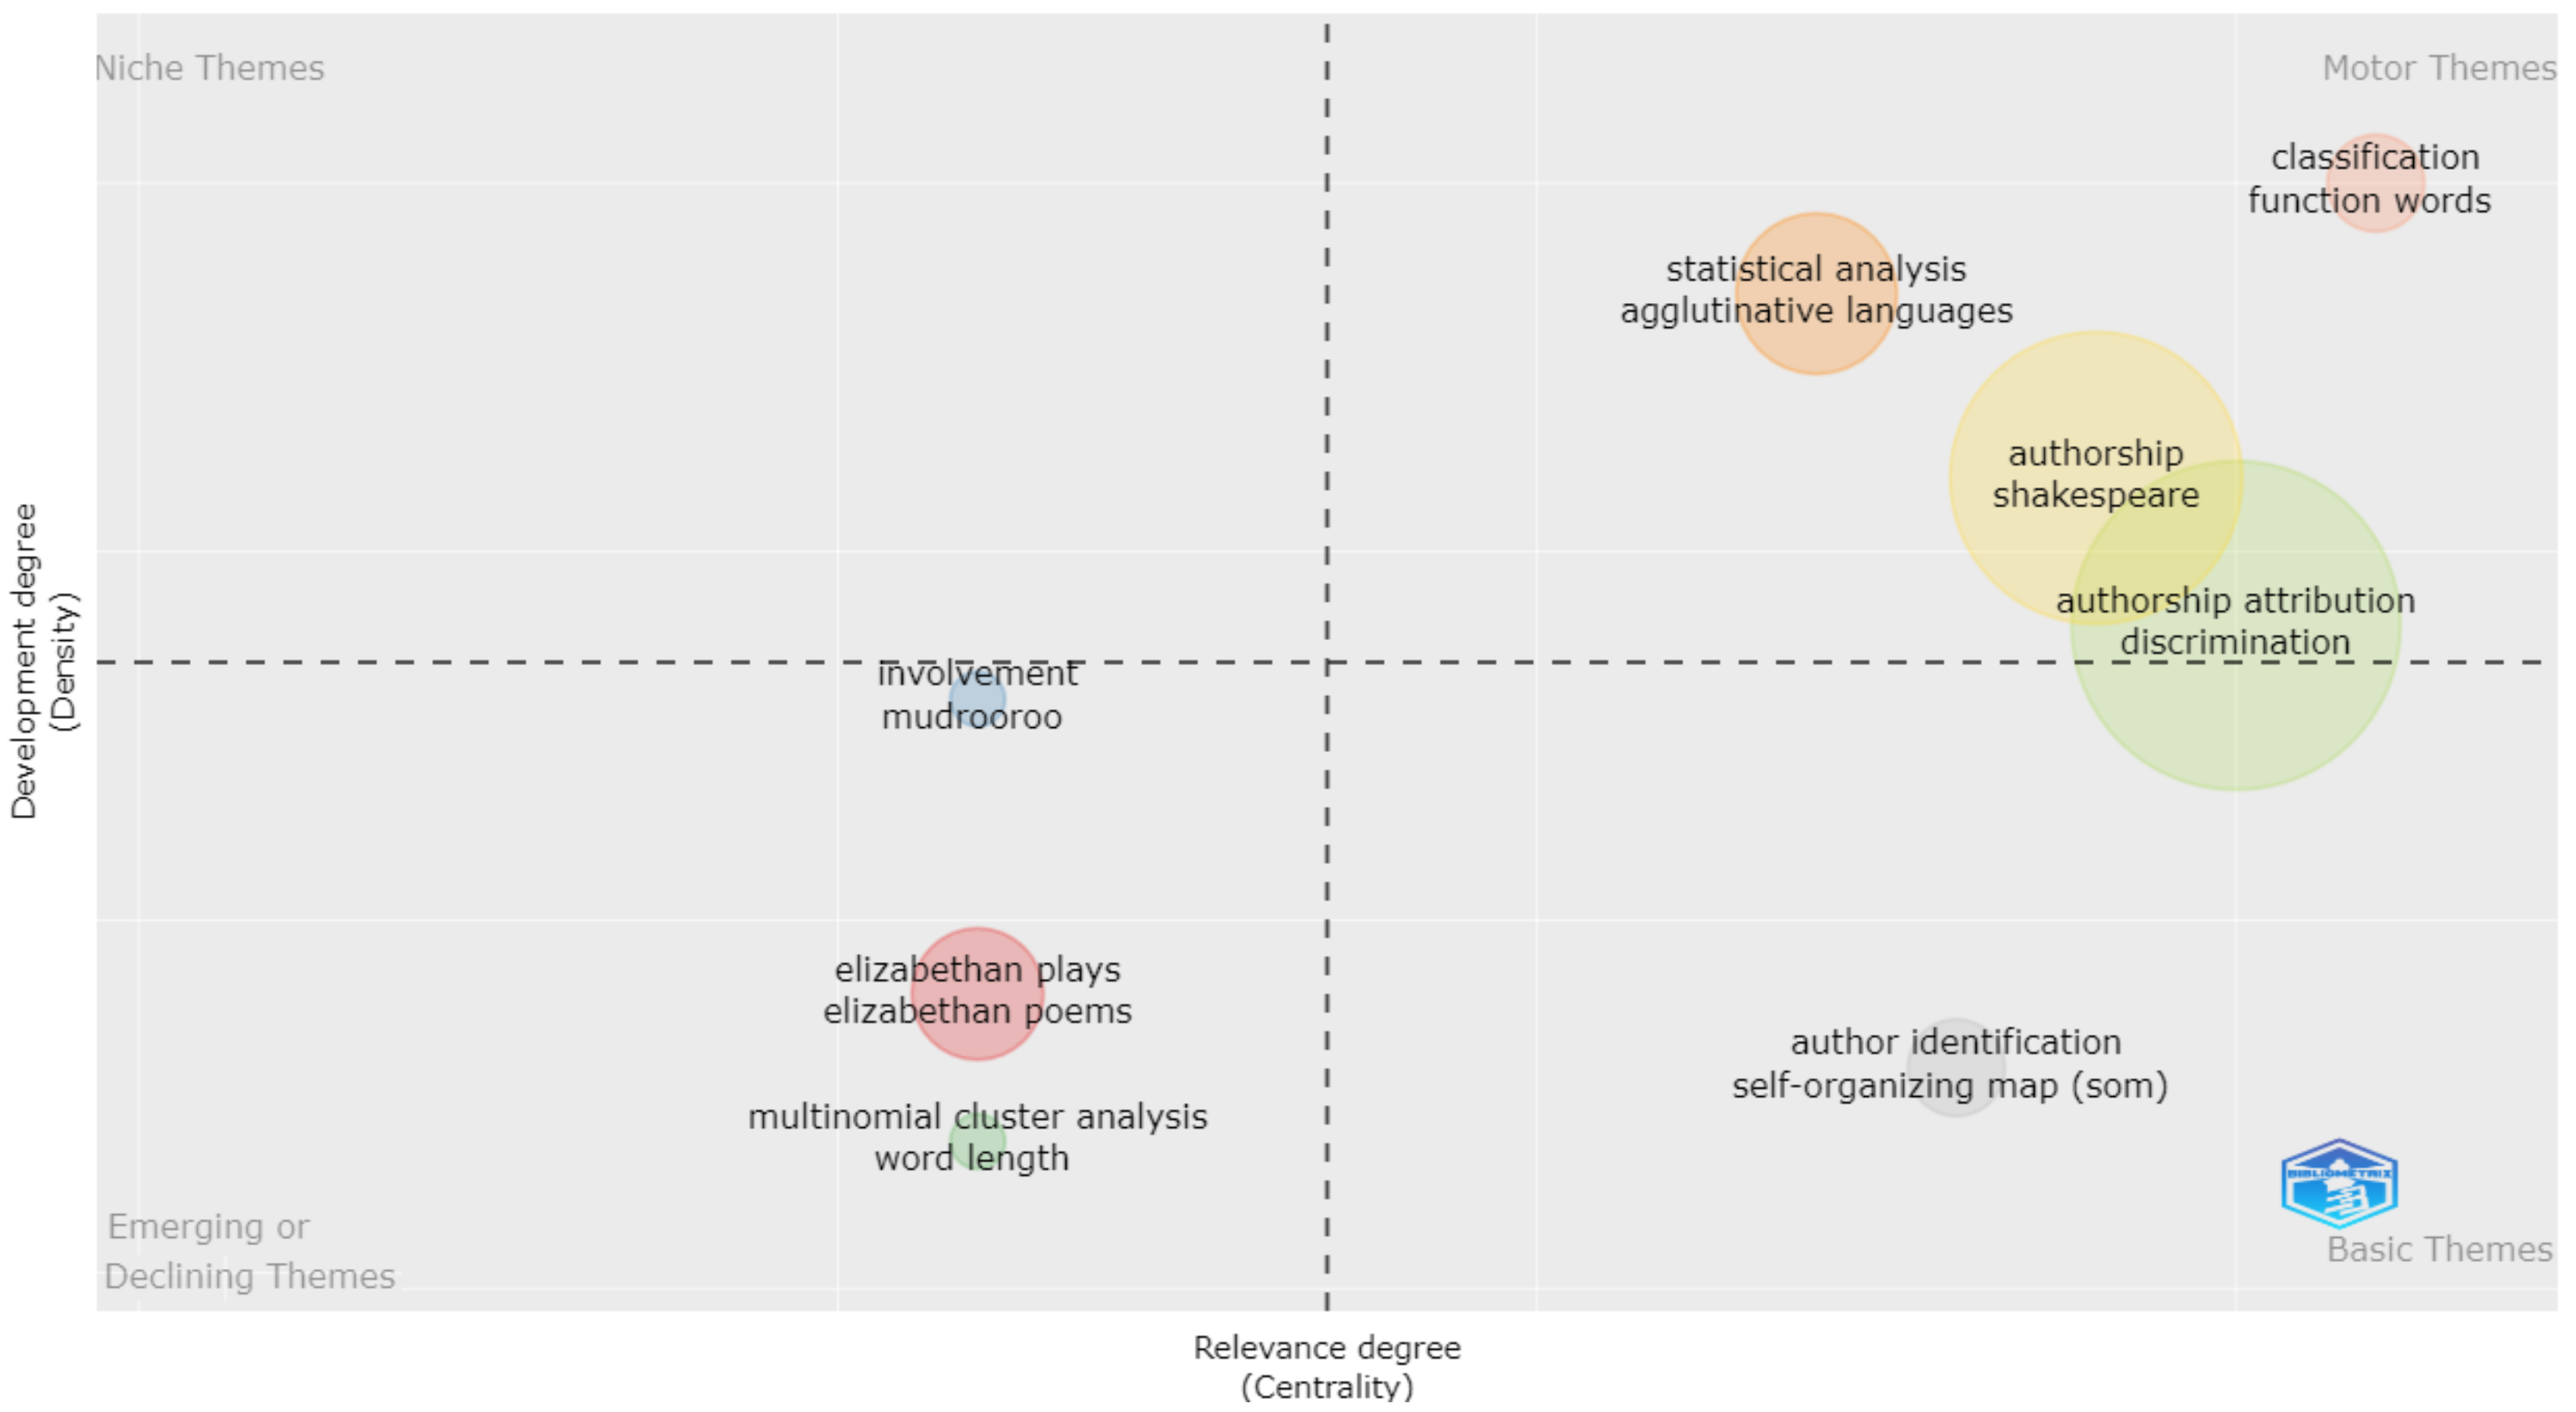
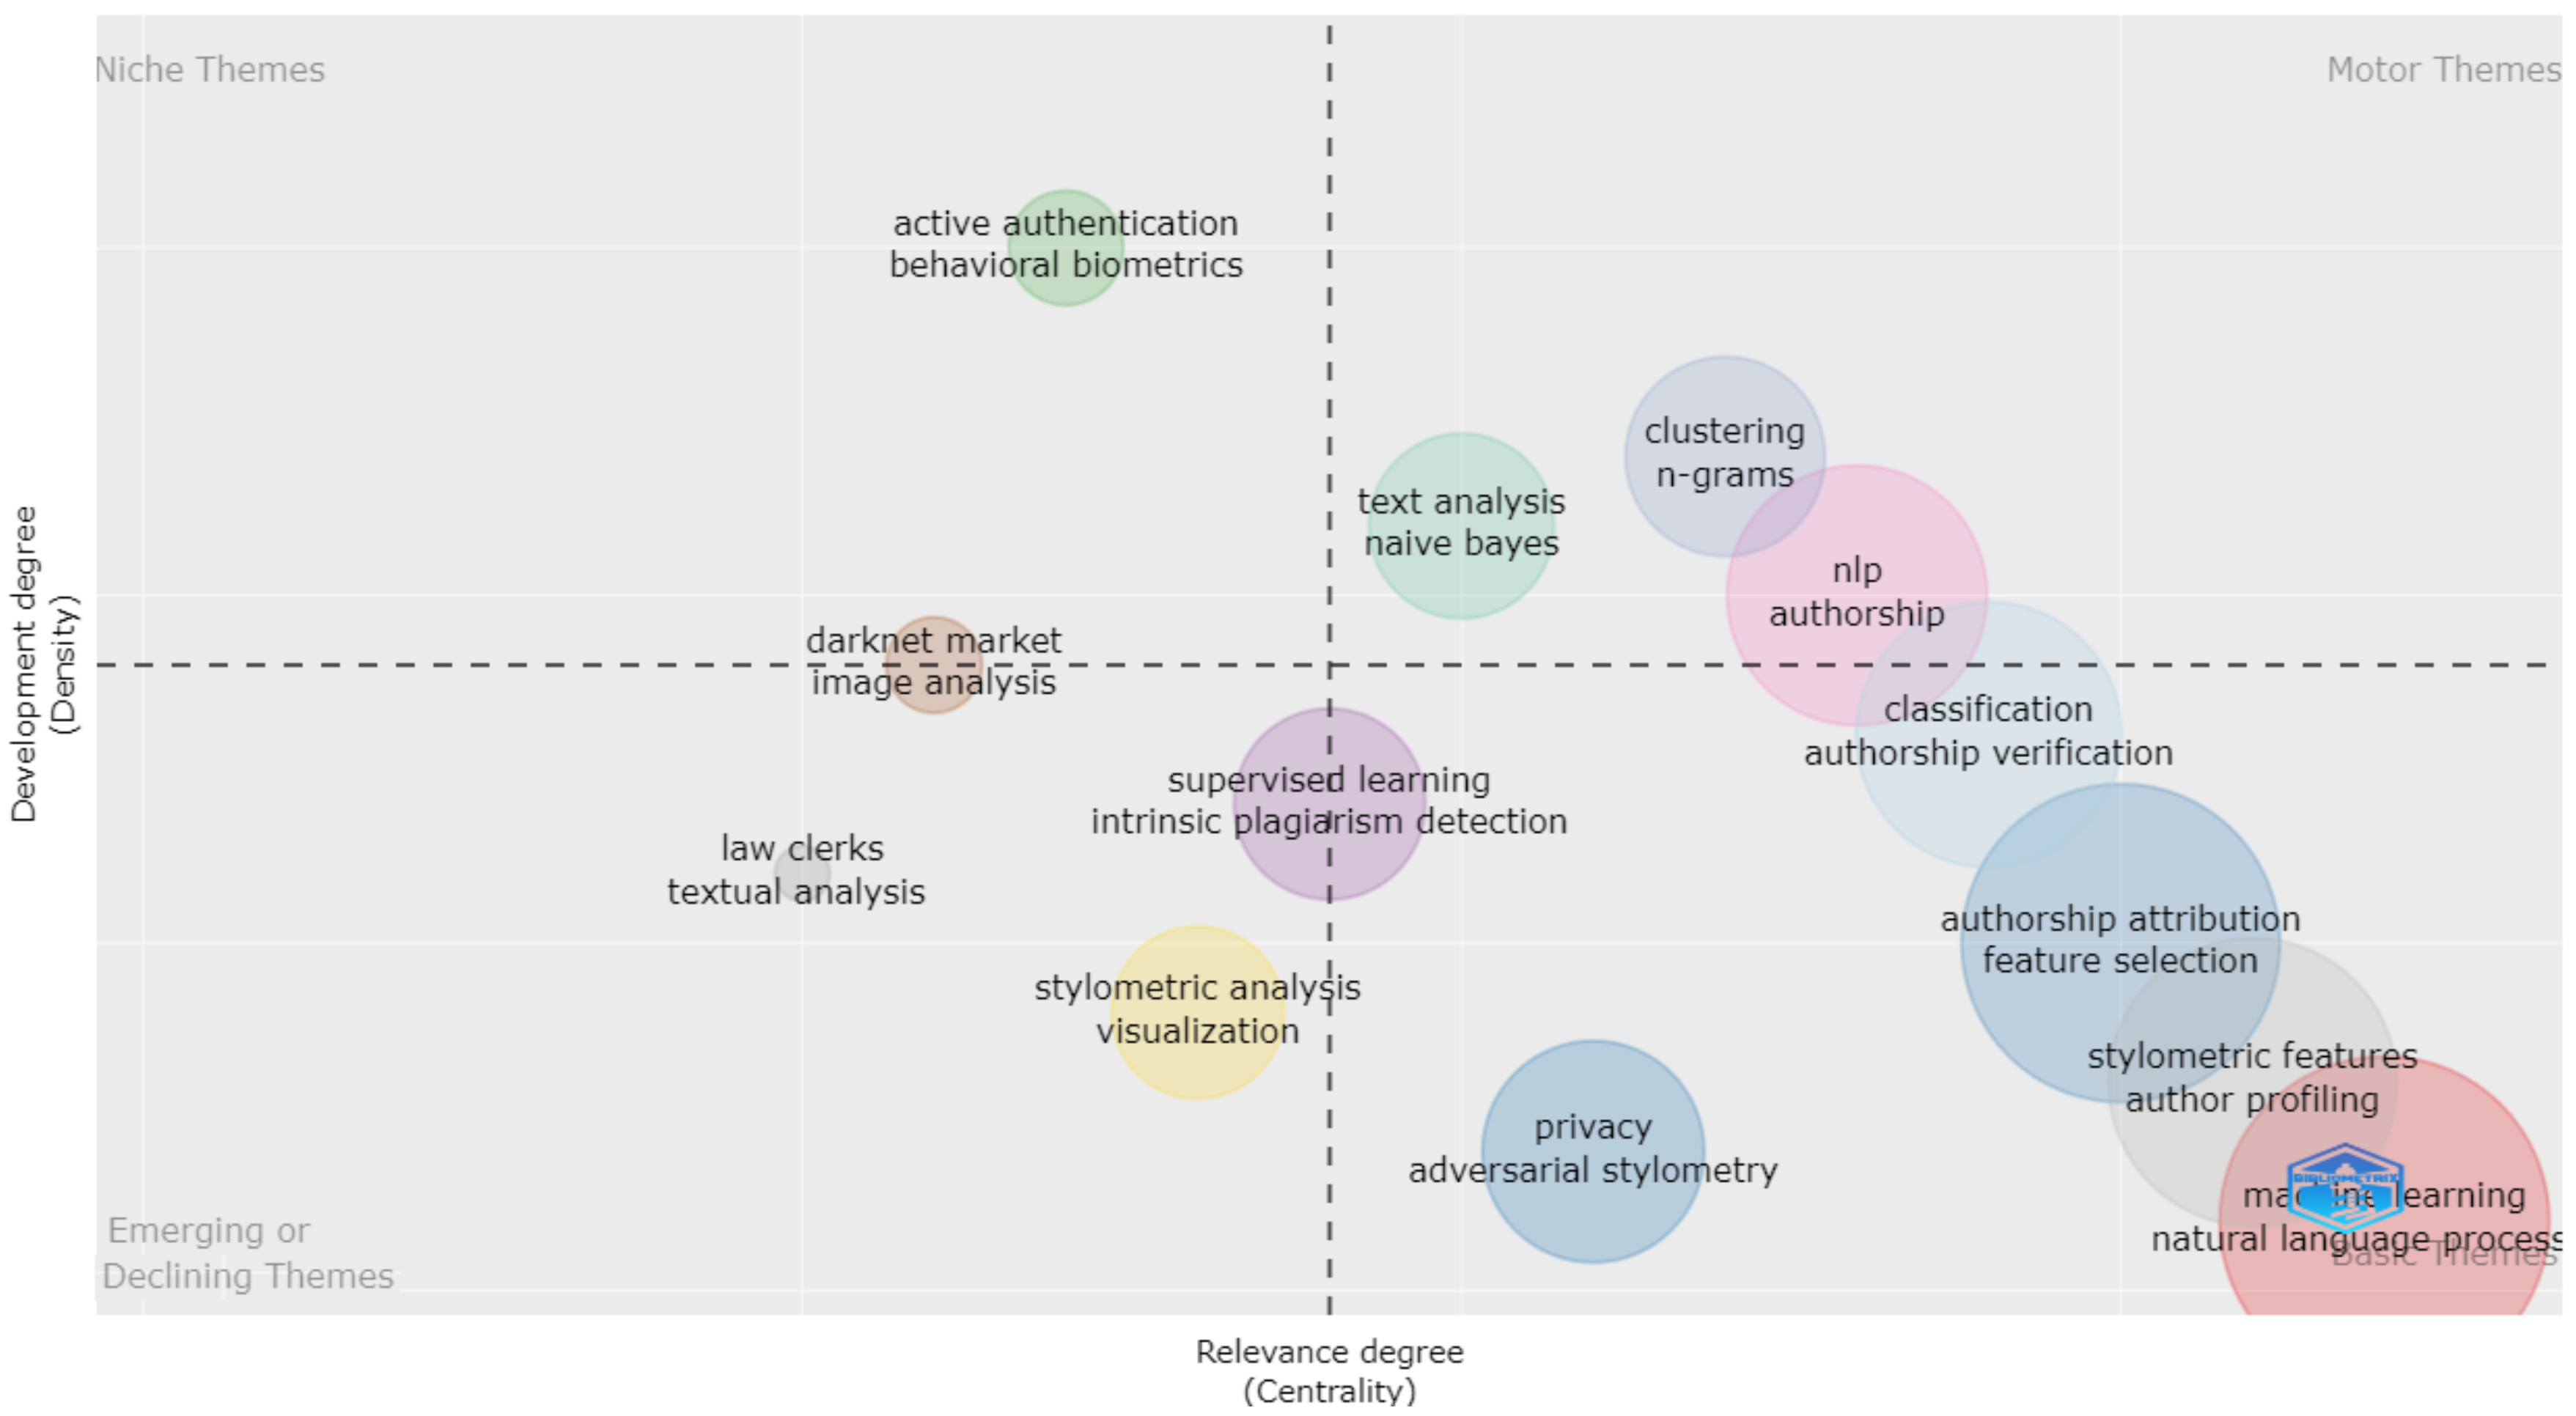
4.1. Topic and Keywords Trends

In this subsection, we present a thematic analysis to detect the main research topics of the field using a word cloud, a co-occurrence network, and thematic evolution using a thematic map. In order to avoid deviant results, keywords inserted in the search query (such as stylometry * or computational stylistic *) were removed. Figure 7 shows the word cloud for the 50 most common author keywords in the publications collected. The size of the keywords in the figure indicates the frequency of the keywords in the dataset. Based on the size of the keywords shown in Figure 7, the top 3 keywords are “authorship attribution”, “machine learning” and “natural language processing”, which occurred 133, 68 and 41 times in the dataset, respectively. The word “authorship attribution” shows that most papers focused on the authorship attribution problem, whereas the words “machine learning” and “natural language processing” indicate the use of the machine learning methods and natural language processing to address the authorship attribution problem in stylometry. As we can also see from Figure 7, the most common words determine the content of most studies in the collection. More specifically, the most frequent word “authorship attribution” is related to keywords such as “author identification”, “authorship analysis”, “authorship verification”, “author profiling”, “plagiarism”, “fake news”, “privacy”, “social media” and “authentication” based on their semantic meaning. These keywords determine a broad topic, such as the basic tasks in stylometry. On the other hand, words such as “machine learning” and “natural language processing” can be related to words such as “classification”, “feature selection”, “stylometric features”, “text mining”, “computational linguistics”, “data mining”, “deep learning”, “clustering”, “artificial neural network”, “computational stylometry”, “support vector machine”, “rough sets”, “supervised learning”, and “statistics”. These words define the methodological approaches used to address the several stylometry problems. Of course, the words that indicate the methods of machine learning appear more often than those that indicate traditional statistical methods.
To achieve a further understanding, a network of words is shown in Figure 8 based on the co-occurrence of keywords in order to discover interpretable relationships and research topics. In this figure, a node was labeled with a keyword and the edge between the two nodes represents the co-occurrence between keywords. The size of a node and label indicates the frequency of a keyword in the dataset, whereas the thickness of an edge indicates the co-occurrence frequency between keywords. A greater thickness demonstrates that the keywords are closely related to each other. The color of the node shows the cluster with which the keyword is associated. Each cluster belongs to a research theme represented by the keywords and their links. From this figure, we can see that there are four clusters which are detected by software automatically. The largest cluster is represented by a red color, and it shows that the top three keywords (such as “authorship attribution”, “machine learning” and “natural language processing”) are related to each other. This means that the majority of papers is focused on the use of machine learning methods and natural language processing to address the authorship attribution problem. Furthermore, the keyword “authorship attribution” is related to the keywords “deep learning”, “text mining”, “clustering”, “text categorization”, “neural networks”, and “support vector machine”, as well as “stylometric analysis”, and this indicates the use of alternative methods for solving the authorship attribution problem. The keyword “machine learning” is related to keywords such as “computational linguistics”, “fake news”, “privacy” and “social media”, and this shows the use of machine learning in several problems relating to stylometry. The second cluster is represented by a purple color, and it shows that keywords such as “authorship verification”, “computational stylometry”, and “author profiling” are related to the keywords “classification” and “stylometric features”. This means that the tasks of authorship verification and author profiling use artificial intelligence techniques such as text classification. The third cluster, represented by a green color, indicates that keywords such as “authorship”, “attribution”, “text analysis”, “statistics”, “shakespeare”, and “digital humanities” are related to each other, and this represents the use of statistical methods to attribute the authorship of Shakespeare plays. This cluster is referred to in the field of digital humanities as is shown by the term “digital humanities”. This is a new term that appeared in the past decade, and it includes the use of digital methods in humanities and social studies. In our case, this term concerns the use of stylometric methods in literary texts and plays. The fourth cluster, represented by a blue color, represents keywords such as “rough sets”, “decision rule”, and “decision algorithm”, and these words were referred to in the application of a rough set-based approach to the problem of the stylometric analysis of texts. Finally, from Figure 8, it can be seen that the keyword “authorship attribution” is a bridge between four clusters, and it is evident that this is a basic problem of stylometry when viewed from different perspectives. From the figure, it is also evident that the red and purple clusters are closely related to each other, and this means that most papers are focused on the several tasks of stylometry using artificial intelligence methods.
Another interesting issue to consider is the evolution of some keywords over time. Then, some representative keywords from 1988 to 2021 were selected from each cluster in Figure 8, resulting in 16 keywords which are depicted in Figure 9. The years 1968–1987 are not displayed in Figure 9 because the papers from this period lacked author keywords. From this graph, we can see the topics or keywords that are growing or declining in popularity in the research field of stylometry. More specifically, we observe that the word “authorship attribution” has been on the rise over time. This means that authorship attribution is a major problem in stylometry for most researchers. On the other hand, the words concerning methodological approaches such as machine learning”, “natural language processing”, “text mining”, “stylometric features”, “text classification”, “deep learning” and “rough sets” and the words concerning the other tasks in stylometry, such as “authorship verification”, “author profiling”, “plagiarism” and “privacy”, have been on the rise in recent years and especially after 2006. Before 2006, we see that the words “shakespeare”, “statistics” and “neural networks” were the focus of research. More specifically, in the early years (1988–2000), the papers focused on the authorship attribution of Shakespeare plays and other similar literary texts using statistical methods, whereas from about 2000 to 2006, the research started to focus on authorship attribution using neural networks. In recent years, the term “digital humanities” has also occurred frequently. Based on Figure 9, we can see that, in recent years, most researchers used artificial intelligence (i.e., machine learning) to address the authorship attribution problem, as opposed to the early years when researchers used statistical methods.
A further exploration of the thematic evolution of the field was also performed based on a thematic map within three periods using co-word analysis and the clustering of author keywords, as proposed by Cobo et al. [26]. The periods examined in this study were Period 1 (1968–1991), Period 2 (1992–2006), and Period 3 (2007–2021). These three periods were selected based on the publication distribution, as shown in Figure 1, and the evolution of keywords, as shown in Figure 9, setting two cut-off points, 1991 and 2006. For thematic evolution, some parameters were settled, such as number of words = 450 and minimum cluster frequency = 3, while keywords inserted in the search query were removed. The thematic map visualizes the themes into four different quadrants based on their centrality and density values along two axes, taking into account the number of publications, their citations, and strength of the tie with other themes. The centrality measures the importance of a theme with other themes in the map. The density measures the development of the internal links within a cluster represented by a theme. The label of the cluster chosen by the Biblioshiny software corresponds to the most frequent keywords. The size of the cluster indicates the number of occurrences of the keywords that it contains, and the position of the cluster is set according to the cluster centrality and density [26].
Figure 10 shows the thematic map for Period 1. In this map, the keywords “authorship, drama” placed in lower-right quadrant represent a basic theme that has high centrality and low density and is thus considered important and not yet developed for the research field. This theme is related to authorship or stylometric analysis in literary texts. The keyword “statistics” is also a basic theme for this period, and it concerns the use of simple statistical measures to solve the problem of authorship attribution or authorship analysis. Finally, the keywords “literary detection, shakespearean canon” are a niche theme. This theme has high density and low centrality and is considered well-researched, with marginal importance in this area.
Figure 11 depicts the thematic map for Period 2. In this period, themes that appear in the upper-right quadrant are motor themes with high centrality and density, and are thus considered well-researched and important. In this quadrant there are four clusters: the first cluster consists of the keywords “authorship attribution, discrimination”, the second consists of “authorship, shakespeare”, the third consists of “statistical analysis, agglutinative languages” and the fourth consists of “classification, function words”. These clusters are related to the authorship attribution problem in literary texts using statistical methods. Most of the clusters in this quadrant evolved from basic themes in Period 1 to motor themes in this period. In this period, a new basic theme with the keywords “author identification, self-organizing map” appeared in the lower-right quadrant. This theme is related to the authorship attribution problem using the self-organizing map. The self-organizing map is a type of neural network, and it becomes the trending method in this period. Finally, themes appearing in the lower-left quadrant are declining or emerging themes with low centrality and density and are thus considered not well-developed with marginal importance. This quadrant concerns three clusters: the first using “elizabethan plays, elizabethan poems”, the second using “multinomial cluster analysis, word length”, and the third using “involvement, mudrooroo”. These clusters focused on studies for authorship analysis on Elizabethan plays.
Figure 12 shows the thematic map for Period 3. In this period, the theme “active authentication, behavioral biometrics” appears as a niche topic with marginal importance in the research field. This topic focused on authentication on mobile devices using stylometric methods. In the upper-right quadrant, themes such as “authorship, nlp”, “clustering, n-grams”, and “text analysis, naïve bayes” appear as motor themes that are well-researched and important. This means that most studies focus on the authorship attribution problem and text analysis using advanced statistical methods such as clustering and natural language processing. Furthermore, the themes that appeared as basic are “machine learning, natural language processing”, “stylometric features, author profiling”, “authorship attribution, feature selection”, “classification, authorship verification”, “privacy, adversarial stylometry”, and “supervised learning, intrinsic plagiarism detection”. This shows that the authors use artificial intelligence methods (i.e., machine learning) and stylometric features to address the authorship attribution problem and its variants such as authorship verification, authorship profiling, authorship identification on social media, adversarial stylometry, and plagiarism detection. Finally, themes with low importance and development are “stylometric analysis, visualization”, “law clerks, textual analysis”, and “darknet market, image analysis” and are thus considered as emerging or declining themes.
From the aforementioned analysis of the three time periods, it can be seen that stylometry has evolved from authorship attribution using simple and advanced statistical methods to authorship attribution using the methods of machine learning. In addition, in recent years there have been other similar problems in stylometry apart from authorship attribution, such as authorship verification, authorship profiling, adversarial stylometry, and plagiarism detection. In general, authorship attribution and machine learning remain the research focus for most researchers.

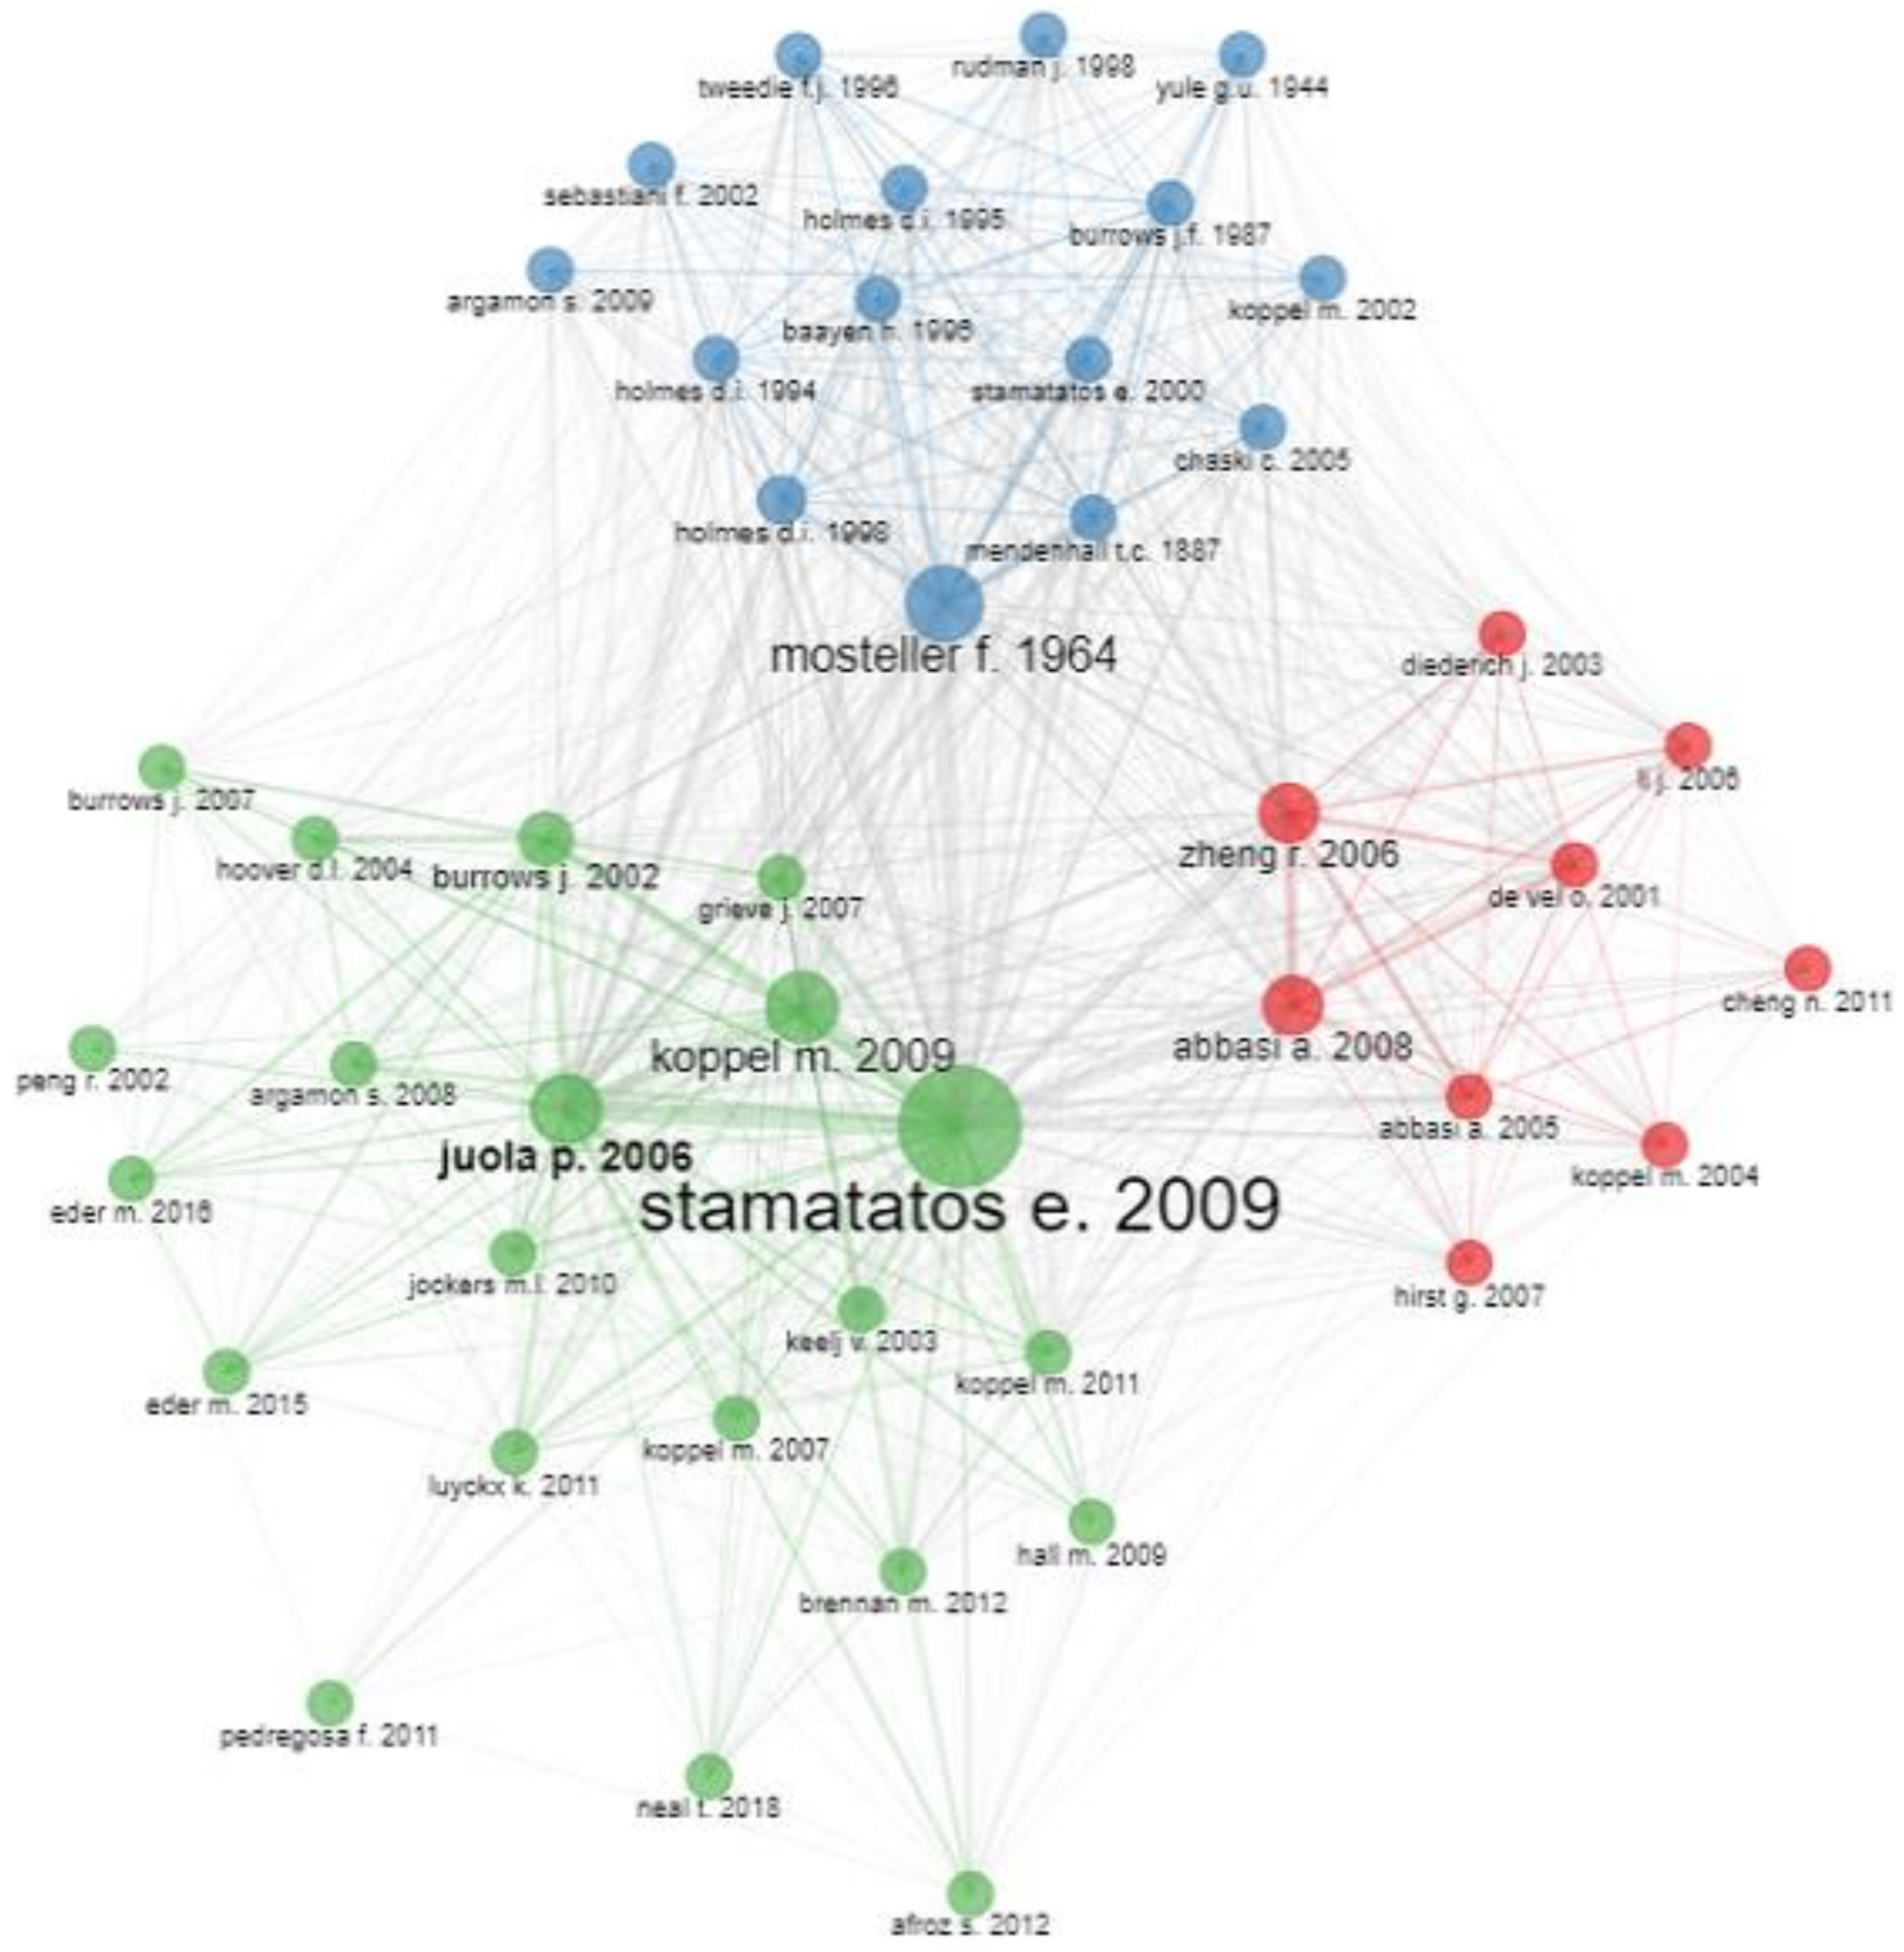
4.2. Analysis of Co-Citation

We performed a co-citation analysis on a limited set of cited references because our dataset had over 20,000 references. For this reason, we included cited references with at least 29 citations. From this limited set of citations, we visualized the co-citation network as is shown in Figure 13. This network was performed with a minimum degree of co-citation equal to two and a threshold of 45 network nodes. Each node of the network was labeled with the first author and the publication year of the paper, whereas the edges in the network represent the co-citation between two documents. The size of a node indicates the number of local citations received by the documents and the thickness of the edge represents the strength of co-citations ties. The color of the node indicates the cluster with which the paper is associated.
From the co-citation network in Figure 13, we can observe that there are three clusters of citations. The clusters were named based on the majority of references belonging to them. The first cluster, represented by a green color in Figure 13, was named authorship attribution using modern computational methods, focusing on solving the authorship attribution problem, taking advantage of modern methods such as machine learning, information retrieval, text mining, and natural language processing. This cluster is the largest and it includes 21 works. The top three most cited references in this cluster are represented by Stamatatos (2009) [27], Juola (2006) [28], and Koppel et al. (2009) [29]. The second cluster, represented by a blue color in Figure 13, referred to authorship attribution using quantitative methods, focusing on the first works of authorship analysis using classical and advanced statistical methods, and it was a major foundation of computer-assisted stylometry. This cluster consists of 15 articles, and the top three most cited references are represented by Mosteller and Wallace (1964) [30], Holmes (1998) [8], and Mendenhall (1887) [31]. The third cluster, represented by a red color in Figure 13, presented authorship analysis on cyberspace, focusing on authorship identification of digital media (such as emails, forums, web sites, etc.,) in order to decrease high levels of cybercrime. This cluster contains nine articles, and the top three most cited references are represented by Abbasi and Chen (2008) [9], Zheng et al. (2006) [32], and Abbasi and Chen (2005) [33].

4.3. Analysis of Country Collaboration

Figure 14 shows the map at the country collaboration level. In this map, the shade of countries and the thickness of lines represent the number and the proportion of their collaborations, respectively. Figure 15 shows the social network of collaboration at the country level in detail. The nodes in the network represent the countries, and the edges between two nodes represent the cooperation between countries. The size of country indicates the frequency of the cooperation from this country, and the thickness of an edge indicates the closeness of the collaboration between countries.
Six major clusters or communities (with different node colors) can be found from the network. From these figures, we can observe that the USA has the more partners because it has the most research works. More specifically, the USA cooperates with Canada, India, China, Australia, European countries (such as the UK, Spain, Germany, Poland and Czech), and Saudi Arabia. Additionally, we can see that the USA and the UK have a strong collaboration with each other. Furthermore, strong collaborations are observed between Germany and Spain, the UK and Italy, as well as Qatar and Bulgaria. Finally, it is evident that European countries (blue cluster) have high internal collaboration links.

5. Discussion

In the proposed study, an exploratory and review analysis on the research field of stylometry from bibliometric and evolutionary perspective was conducted. First, 1093 documents were collected from the Scopus database starting from 1968 until 2021. These documents also were filtered and resulted in 905 finally selected publications. These documents were preprocessed by standardizing the author names and the cited references. Then, these publications were analyzed at two levels such as performance analysis and science mapping analysis in order to answer the research questions presented in Section 1.
Our research findings show the publication and citation structure of the stylometry research. More specifically, this study revealed that stylometry research has an annual scientific production growth rate of 13.5%. Furthermore, the papers in this field received the highest number of citations in 2012. This reflects the fact that the majority of the most cited papers belong to the year 2012, as was shown in Section 3.5. In other words, 5 out of the 20 most cited research articles were identified as belonging to the year 2012. The number of publications and citations is also expected to increase further in the next few years.
Researchers from countries such as the USA, the UK, Poland, and India and their collaborative partners tend to publish papers in high-impact sources (such as Lecture Notes in Computer Science, CEUR Workshop Proceedings and Digital Scholarship in the Humanities) on the topic of stylometry. Based on the findings of the co-word analysis in Figure 8, papers are mainly published on three main research topics, such as stylometric analysis of literary texts using statistical methods (green cluster), the authorship attribution problem using machine learning methods (red cluster), and the variants of the authorship attribution problem using machine learning or classification methods (purple cluster). These research topics were confirmed by the thematic and content analysis of the top 20 most cited papers, as was shown in Section 3.5. The topic regarding the stylometric analysis of literary texts using statistics started to appear in Period 1 (1968–1991) as an important research area, as is shown in Figure 10 (lower-right quadrant), and then it was well-researched in Period 2 (1992–2006), as is shown in Figure 11 (upper-right quadrant). On the other hand, the topics regarding authorship attribution and its variants using machine learning methods correspond to Period 3 (2007–2021), as is shown in Figure 12 (lower-right quadrant). Furthermore, these three topics are closely related to the three clusters in the co-citation network, as is shown in Figure 13, since the papers cite other related works. Another interesting pattern is that the number of publications and citations seems to be related to the development of the research topics. More specifically, when the number of publications and citations increased after 2010, as is shown in Figure 1 and Figure 2, the stylometry field developed very rapidly, i.e., new research topics appeared and became important and more well-developed, as shown in Figure 12. This point is also confirmed by the fact that 12 of the top 20 most cited papers published after 2010 focused on trends of topics such as several variants of adversarial stylometry, authorship profiling, authorship verification and social media forensics. On the other hand, the number of research topics appearing before 2010 was small, as shown in Figure 10 and Figure 11, because the number of publications and citations was relatively small.

6. Conclusions

This study is useful to researchers interested in stylometry research because it provides an insightful and comprehensive overview using bibliometric methods, and could also be the basis for further research in this field. It is also evident that bibliometric analysis is a “distant reading” or macroscopic tool in order to extract useful knowledge and patterns very quickly and easily compared to systematic review analysis. However, the limitation of this current study is that our publications are from Scopus database only. Τhis is because the Biblioshiny software does not allow merging multiple files from multiple bibliographic sources such as Web of Science and Google Scholar. In this case, publications from multiple sources may give a better visualization of the knowledge and results in this field.
The results of bibliometric study can show us avenues for future research. For example, research topics such as authorship attribution using machine and deep learning methods may continue to attract the attention of many researchers. Furthermore, we can predict that topics such as plagiarism detection, fake news or propaganda detection, and visual stylometry may be further developed in future plans.

Funding

This research received no external funding.

Institutional Review Board Statement

Not applicable.

Informed Consent Statement

Not applicable.

Data Availability Statement

The data used in the analysis were collected from the Scopus database [34]. The author of this paper had access to the Scopus database through an affiliate institution’s library.

Conflicts of Interest

The author declares no conflict of interest.

References

  1. Neal, T.; Sundararajan, K.; Fatima, A.; Yan, Y.; Xiang, Y.; Woodard, D. Surveying stylometry techniques and applications. ACM Comput. Surv. 2017, 50, 1–36. [Google Scholar] [CrossRef]
  2. Donthu, N.; Kumar, S.; Mukherjee, D.; Pandey, N.; Lim, W.M. How to conduct a bibliometric analysis: An overview and guidelines. J. Bus. Res. 2021, 133, 285–296. [Google Scholar] [CrossRef]
  3. Zupic, I.; Cater, T. Bibliometric methods in management and organization. Organ. Res. Methods 2015, 18, 429–472. [Google Scholar] [CrossRef]
  4. Moral-Muñoz, J.A.; Herrera-Viedma, E.; Santisteban-Espejo, A.; Cobo, M.J. Software tools for conducting bibliometric analysis in science: An up-to-date review. Prof. Inf. 2020, 29, e290103. [Google Scholar] [CrossRef]
  5. Aria, M.; Cuccurullo, C. Bibliometrix: An R-tool for comprehensive science mapping analysis. J. Informetr. 2017, 11, 959–975. [Google Scholar] [CrossRef]
  6. Argamon, S.; Koppel, M.; Fine, J.; Shimoni, A.R. Gender, genre, and writing style in formal written texts. Text Talk 2003, 23, 321–346. [Google Scholar] [CrossRef]
  7. Feng, S.; Banerjee, R.; Choi, Y. Syntactic stylometry for deception detection. In Proceedings of the 50th Annual Meeting of the Association for Computational Linguistics, Jeju Island, Korea, 8–14 July 2012; pp. 171–175. [Google Scholar]
  8. Holmes, D.I. The evolution of stylometry in humanities scholarship. Lit. Linguist. Comput. 1998, 13, 111–117. [Google Scholar] [CrossRef]
  9. Abbasi, A.; Chen, H. Writeprints: A stylometric approach to identity-level identification and similarity detection in cyberspace. ACM Trans. Inf. Syst. 2008, 26, 1–29. [Google Scholar] [CrossRef]
  10. Stamatatos, E.; Fakotakis, N.; Kokkinakis, G. Automatic text categorization in terms of genre and author. Comput. Linguist. 2000, 26, 471–495. [Google Scholar] [CrossRef]
  11. Holmes, D.I. Authorship attribution. Comput. Humanit. 1994, 28, 87–106. [Google Scholar] [CrossRef]
  12. Narayanan, A.; Paskov, H.; Zhenqiang Gong, N.; Bethencourt, J.; Stefanov, E.; Chul Richard Shin, E.; Song, D. On the feasibility of Internet-scale author identification. In Proceedings of the IEEE Symposium on Security and Privacy, San Francisco, CA, USA, 20–23 May 2012; pp. 300–314. [Google Scholar] [CrossRef]
  13. Peersman, C.; Daelemans, W.; Vaerenbergh, L. Predicting age and gender in online social networks. In Proceedings of the 3rd International Workshop on Search and Mining User-Generated Contents, Glasgow, Scotland, UK, 28 October 2011; pp. 37–44. [Google Scholar] [CrossRef]
  14. Cheng, N.; Chandramouli, R.; Subbalakshmi, K.P. Author gender identification from text. Digit. Investig. 2011, 8, 78–88. [Google Scholar] [CrossRef]
  15. Alzahrani, S.M.; Salim, N.; Abraham, A. Understanding plagiarism linguistic patterns, textual features, and detection methods. IEEE Trans. Syst. Man Cybern. 2012, 42, 133–149. [Google Scholar] [CrossRef]
  16. Afroz, S.; Brennan, M.; Greenstadt, R. Detecting hoaxes, frauds, and deception in writing style online. In Proceedings of the IEEE Symposium on Security and Privacy, San Francisco, CA, USA, 20–23 May 2012; pp. 461–475. [Google Scholar] [CrossRef]
  17. Holmes, D.I.; Forsyth, R.S. The federalist revisited: New directions in authorship attribution. Lit. Linguist. Comput. 1995, 10, 111–127. [Google Scholar] [CrossRef]
  18. Potthast, M.; Kiesel, J.; Reinartz, K.; Bevendorff, J.; Stein, B. A stylometric inquiry into hyperpartisan and fake news. In Proceedings of the 56th Annual Meeting of the Association for Computational Linguistics, Melbourne, Australia, 15–20 July 2018; pp. 231–240. [Google Scholar] [CrossRef]
  19. Eder, E.; Rybicki, J.; Kestemont, M. Stylometry with R: A package for computational text analysis. R J. 2016, 8, 107–121. [Google Scholar] [CrossRef]
  20. Caliskan-Islam, A.; Harang, R.; Liu, A.; Narayanan, A.; Voss, C.; Yamaguchi, F.; Greenstadt, R. De-anonymizing programmers via code stylometry. In Proceedings of the 24th USENIX Security Symposium, Washington, DC, USA, 12–14 August 2015; pp. 255–270. [Google Scholar]
  21. Lyckx, K.; Daelemans, W. Authorship attribution and verification with many authors and limited data. In Proceedings of the Coling 2008—22nd International Conference on Computational Linguistics, Manchester, UK, 18–22 August 2008; pp. 513–520. [Google Scholar]
  22. Rocha, A.; Scheirer, W.J.; Forstall, C.W.; Cavalcante, T.; Theophilo, A.; Shen, B.; Carvalho, A.R.; Stamatatos, E. Authorship attribution for social media forensics. IEEE Trans. Inf. Forensics Secur. 2017, 12, 5–33. [Google Scholar] [CrossRef]
  23. Brennan, M.; Afroz, S.; Greenstadt, R. Adversarial stylometry: Circumventing authorship recognition to preserve privacy and anonymity. ACM Trans. Inf. Syst. Secur. 2012, 15, 1–22. [Google Scholar] [CrossRef]
  24. Fridman, L.; Weber, S.; Greenstadt, R.; Kam, M. Active authentication on mobile devices via stylometry, application usage, web browsing, and GPS location. IEEE Syst. J. 2017, 11, 513–521. [Google Scholar] [CrossRef]
  25. Iqbal, F.; Binsalleeh, H.; Fung, B.C.M.; Debbabi, M. Mining writeprints from anonymous e-mails for forensic investigation. Digit. Investig. 2010, 7, 56–64. [Google Scholar] [CrossRef]
  26. Cobo, M.J.; López-Herrera, A.G.; Herrera-Viedma, E.; Herrera, F. An approach for detecting, quantifying, and visualizing the evolution of a research field: A practical application to the fuzzy sets theory field. J. Informetrics. 2011, 5, 146–166. [Google Scholar] [CrossRef]
  27. Stamatatos, E. A survey of modern authorship attribution methods. J. Am. Soc. Inf. Sci. Technol. 2009, 60, 538–556. [Google Scholar] [CrossRef]
  28. Juola, P. Authorship Attribution. Found. Trends Inf. Retr. 2006, 1, 233–334. [Google Scholar] [CrossRef]
  29. Koppel, M.; Schler, J.; Argamon, S. Computational methods in authorship attribution. J. Am. Soc. Inf. Sci. Technol. 2009, 60, 9–26. [Google Scholar] [CrossRef]
  30. Mosteller, F.; Wallace, D.L. Inference and Disputed Authorship: The Federalist; Addison-Wesley: Boston, MA, USA, 1964. [Google Scholar]
  31. Mendenhall, T.C. The characteristic curves of composition. Science 1887, 11, 237–249. [Google Scholar] [CrossRef] [PubMed]
  32. Zheng, R.; Li, J.; Chen, H.; Huang, Z. A framework for authorship identification of online messages: Writing-style features and classification techniques. J. Am. Soc. Inf. Sci. Technol. 2006, 57, 378–393. [Google Scholar] [CrossRef]
  33. Abbasi, A.; Chen, H. Applying authorship analysis to extremist-group Web forum messages. IEEE Intell. Syst. 2005, 20, 67–75. [Google Scholar] [CrossRef]
  34. Scopus Database. Available online: https://www.scopus.com/ (accessed on 23 April 2022).
Figure 1. Annual scientific production from 1968 to 2021.
Informatics 09 00060 g001
Figure 2. Total citations from 1968 to 2021.
Informatics 09 00060 g002
Figure 3. Dynamics of the content related to the subject from different scientific sources.
Informatics 09 00060 g003
Figure 4. Corresponding author’s country (this chart was generated by Biblioshiny). SCP = Single Country Publications, MCP = Multi Country publications.
Informatics 09 00060 g004
Figure 5. Most cited countries.
Informatics 09 00060 g005
Figure 6. Citations per paper ratio.
Informatics 09 00060 g006
Figure 7. Word cloud based on author keywords (this word cloud was generated by Biblioshiny).
Informatics 09 00060 g007
Figure 8. Co-occurrence network (this network was generated by Biblioshiny).
Informatics 09 00060 g008
Figure 9. Author keywords dynamic view over time.
Informatics 09 00060 g009
Figure 10. Thematic map for Period 1 (1968–1991) (this map was generated by Biblioshiny).
Informatics 09 00060 g010
Figure 11. Thematic map for Period 2 (1992–2006) (this map was generated by Biblioshiny).
Informatics 09 00060 g011
Figure 12. Thematic map for Period 3 (2007–2021) (this map was generated by Biblioshiny).
Informatics 09 00060 g012
Figure 13. Co-citation network (the network was generated by Biblioshiny).
Informatics 09 00060 g013
Figure 14. Map of collaboration among countries (this map was generated by Biblioshiny).
Informatics 09 00060 g014
Figure 15. Social network of collaboration at the country level (this network was generated by Biblioshiny).
Informatics 09 00060 g015
Table 1. Main information about bibliographic data collection.
DescriptionResults
Timespan1968–2021
Documents905
Sources (Journals, Books, etc.)477
Authors1687
Author Appearances2526
Single-authored documents221
Authors per document1.86
Co-authors per documents2.79
Collaboration index2.24
Table 2. Most productive sources.
SourcesDocuments
Lecture Notes in Computer Science66
CEUR Workshop Proceedings62
Literary and Linguistic Computing43
Digital Scholarship in the Humanities30
Computers and the Humanities25
Advances in Intelligent Systems and Computing22
Procedia Computer Science15
ACM International Conference Proceedings Series13
IEEE Access9
Communications in Computer and Information Science7
Proceedings of SPIE7
Glottometrics6
Journal of Quantitative Linguistics6
International Joint Conference on Neural Networks6
Style6
Digital Humanities Quarterly5
Expert Systems with Applications5
IFIP Advances in Information and Communication Technology5
Journal of Applied Statistics5
Table 3. Top 20 of the highest-influence sources based on total citations.
Sourcesh-Indexg-Indexm-IndexTotal Citations
Literary and Linguistic Computing17320.531106
Computers and the Humanities11230.28675
Lecture Notes in Computer Science12210.71591
Proceedings-IEEE Symposium on Security and Privacy330.27392
Text110.05304
50th Annual Meeting of The Association for Computational Linguistics110.09303
Computational Linguistics220.09286
Digital Investigation330.23278
ACM Transactions on Information Systems110.07274
Digital Scholarship in the Humanities7130.88202
International Conference on Information and Knowledge Management330.20191
CEUR Workshop Proceedings7100.44183
Proceedings of the National Academy of Sciences of the USA330.23174
IEEE Transactions on Systems, Man and Cybernetics Part C220.12162
56th Annual Meeting of the Association for Computational Linguistics110.20141
Proceedings of the ACM SIGKDD International Conference on Knowledge Discovery and Data Mining220.10122
ACM Transactions on Information and System Security220.18118
R Journal110.14115
Proceedings of the 24th Usenix Security Symposium110.13108
Coling 2008—22nd International Conf. on Computational Linguistics110.07107
Table 4. Top 20 articles by total citations.
ArticleTotal CitationsTotal Citations per YearRef.
S. Argamon, M. Koppel, J. Fine and A.R. Shimoni (2003), Gender, genre, and writing style in formal written texts, Text & Talk, 23(3), 321–346.30415.2[6]
S. Feng, R. Banerjee and Y. Choi (2012), Syntactic stylometry for deception detection, Proc. Of the 50th Annual Meeting of the Association for Computational Linguistics, 171–175.30327.55[7]
D.I. Holmes (1998), The Evolution of Stylometry in Humanities Scholarship, Literary and Linguistic Computing, 13(3), 111–117.27611.04[8]
A.Abbasi and H. Chen (2008), Writeprints: A stylometric approach to identity-level identification and similarity detection in cyberspace, ACM Transactions on Information Systems, 26(2), 1–29.27418.26[9]
E. Stamatatos, N. Fakotakis and G. Kokkinakis (2000), Automatic Text Categorization in Terms of Genre and Author, Computational Linguistics, 26(4), 471–495.27311.87[10]
D.I. Holmes (1994), Authorship attribution, Computers and the Humanities, 28, 87–106.2287.86[11]
A Narayanan et al. (2012), On the Feasibility of Internet-Scale Author Identification, IEEE Symposium on Security and Privacy, 300–314.17616[12]
C. Peersman, W. Daelemans and L. Vaerenbergh (2011), Predicting age and gender in online social networks, Proc. Of the 3rd International Workshop on Search and mining user-generated contents, 37–44.17514.59[13]
N. Cheng, R. Chandramouli and K.P. Subbalakshmi (2011), Author gender identification from text, Digital Investigation, 8(1), 78–88.15613[14]
S.M. Alzahrani, N. Salim and A. Abraham (2012), Understanding Plagiarism Linguistic Patterns, Textual Features, and Detection Methods, IEEE Transactions on Systems, Man, and Cybernetics, Part C, 42(2), 133–14915414[15]
S. Afroz, M. Brennan and R. Greenstadt (2012), Detecting Hoaxes, Frauds, and Deception in Writing Style Online, IEEE Symposium on Security and Privacy, 461–47514913.55[16]
D.I. Holmes and R.S. Forsyth (1995), The Federalist Revisited: New Directions in Authorship Attribution, Literary and Linguistic Computing, 10(2), 111–127.1475.25[17]
M. Potthast, J. Kiesel, K. Reinartz, J. Bevendorff and B. Stein (2018), A Stylometric Inquiry into Hyperpartisan and Fake News, Proc. Of the 56th Annual Meeting of the Association for Computational Linguistics, 231–24014128.2[18]
M. Eder, J. Rybicki and M. Kestemont (2016), Stylometry with R: A Package for Computational Text Analysis, The R Journal, 8(1), 107–121.11516.43[19]
Caliskan-Islam et al. (2015), De-anonymizing Programmersvia Code Stylometry, Proc. Of the 24th USENIX Security Symposium, 255–27010813.5[20]
K. Lyckx and W. Daelemans (2008), Authorship attribution and verification with many authors and limited data, Proc. Of the Coling 2008–22nd International Conference on Computational Linguistics, 513–520.1077.13[21]
A. Rocha et al. (2017), Authorship Attribution for Social Media Forensics, IEEE Transactions on Information Forensics and Security, 12(1), 5–33.10217[22]
M. Brennan, S. Afroz and R. Greenstadt (2012), Adversarial stylometry: Circumventing authorship recognition to preserve privacy and anonymity, ACM Transactions on Information and System Security, 15(3), 1–22.1029.27[23]
L. Fridman, S. Weber, R. Greenstadt and M. Kam (2017), Active Authentication on Mobile Devices via Stylometry, Application Usage, Web Browsing, and GPS Location, IEEE Systems Journal, 11(2), 513–521.9716.17[24]
F. Iqbal, H. Binsalleeh, B.C.M.Fung and M. Debbabi (2010), Mining writeprints from anonymous e-mails for forensic investigation, Digital Investigation, 7(1–2), 56–64.957.30[25]
Publisher’s Note: MDPI stays neutral with regard to jurisdictional claims in published maps and institutional affiliations.

