
Automated Intracranial Hematoma Classification in Traumatic Brain Injury (TBI) Patients Using Meta-Heuristic Optimization Techniques

 , , ,
, , , 
Abstract
:1. Introduction
2. Related Work
3. Materials
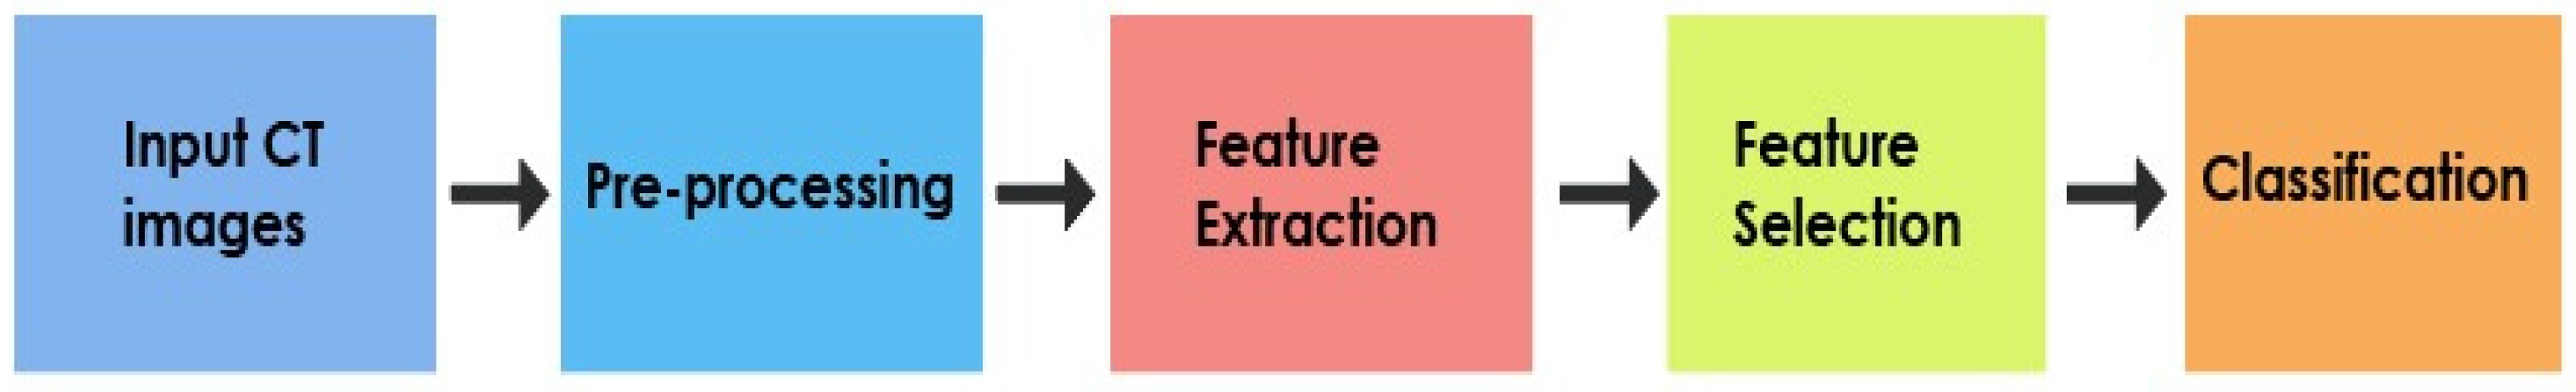
4. Proposed Research Framework
4.1. Preprocessing
4.2. Feature Extraction
4.2.1. Gray Level Co-Occurrence Matrix (GLCM)
4.2.2. Gray Level Run Length Matrix (GLRLM)
4.2.3. Hu’s Invariant Moments
4.3. Synthetic Sample Generation
4.4. Feature Optimization
4.4.1. Bat Algorithm
4.4.2. Grey Wolf Optimization
4.4.3. Whale Optimization
4.5. Classification
5. Results
6. Discussion
- Achieved a classification accuracy of 95.74% in categorizing normal versus hematoma patients.
- The features are selected using meta-heuristic algorithms, which will generate globally optimal features to improve overall performance.
- The system is highly robust, as the method is evaluated using 5-, 7-, and 10-fold cross-validation schemes.
- A relatively large dataset is used, which consists of 1831 non-axial CT images.
7. Conclusions
Author Contributions
Funding
Institutional Review Board Statement
Informed Consent Statement
Data Availability Statement
Acknowledgments
Conflicts of Interest
References
- Kim, J.J.; Gean, A.D. Imaging for the diagnosis and management of traumatic brain injury. Neurotherapeutics 2011, 8, 39–53. [Google Scholar] [CrossRef] [Green Version]
- Bramlett, H.M.; Dietrich, W.D. Long-Term Consequences of Traumatic Brain Injury: Current Status of Potential Mechanisms of Injury and Neurological Outcomes. J. Neurotrauma 2015, 32, 1834–1848. [Google Scholar] [CrossRef]
- McKee, C.; Daneshvar, D.H. The neuropathology of traumatic brain injury. Handb. Clin. Neurol. 2015, 127, 45–66. [Google Scholar]
- James, S.L.; Theadom, A.; Ellenbogen, R.G.; Bannick, M.S.; Montjoy-Venning, W.; Lucchesi, L.R.; Abbasi, N.; Abdulkader, R.; Abraha, H.N.; Adsuar, J.C.; et al. Global, regional, and national burden of traumatic brain injury and spinal cord injury, 1990–2016: A systematic analysis for the Global Burden of Disease Study 2016. Lancet Neurol. 2019, 18, 56–87. [Google Scholar] [CrossRef] [Green Version]
- Badenes, R.; Bilotta, F. Neurocritical care for intracranial haemorrhage: A systematic review of recent studies. Br. J. Anaesth. 2015, 115, 68–74. [Google Scholar] [CrossRef] [Green Version]
- Lee, B.; Newberg, A. Neuroimaging in traumatic brain imaging. NeuroRx 2005, 2, 372–383. [Google Scholar] [CrossRef]
- Strub, W.M.; Leach, J.L.; Tomsick, T.; Vagal, A. Overnight preliminary head CT interpretations provided by residents: Locations of misidentified intracranial hemorrhage. Am. J. Neuroradiol. 2007, 28, 1679–1682. [Google Scholar] [CrossRef] [Green Version]
- Lal, N.R.; Murray, U.M.; Eldevik, O.P.; Desmond, J.S. Clinical consequences of misinterpretations of neuroradiologic CT scans by on-call radiology residents. Am. J. Neuroradiol. 2000, 21, 124–129. [Google Scholar] [PubMed]
- Daunis-I-Estadella, J.; Boada, I.; Bardera, A.; Castellanos, M.; Serena, J.; Castellanos, M.D.M. Reliability of the ABC/2 method in determining acute infarct volume. J. Neuroimaging 2011, 22, 155–159. [Google Scholar]
- Webb, J.S.; Ullman, N.L.; Morgan, T.C.; Muschelli, J.; Kornbluth, J.; Awad, I.A.; Mayo, S.; Rosenblum, M.; Ziai, W.; Zuccarrello, M.; et al. Accuracy of the ABC/2 score for intracerebral hemorrhage: Systematic review and analysis of MISTIE, CLEAR-IVH, and CLEAR III. Stroke 2015, 46, 2470–2476. [Google Scholar] [CrossRef] [Green Version]
- Chan, K.T.; Carroll, T.; Linnau, K.F.; Lehnert, B. Expectations among academic clinicians of inpatient imaging turnaround time: Does it correlate with satisfaction? Acad. Radiol. 2015, 22, 1449–1456. [Google Scholar] [CrossRef] [PubMed]
- Ayaz, H.; Izzetoglu, M.; Izzetoglu, K.; Onaral, B.; Ben, B. Early diagnosis of traumatic intracranial hematomas. J. Biomed. Opt. 2021, 24, 051411. [Google Scholar] [CrossRef] [Green Version]
- Kakhandaki, N.; Kulkarni, S.B. Identifcation of normal and abnormal brain hemorrhage on magnetic resonance images. Cogn. Inform. Comput. Model. Cogn. Sci. 2020, 1, 71–91. [Google Scholar]
- Khan, M.A.; Sarfraz, M.S.; Alhaisoni, M.; Albesher, A.A.; Wang, S.; Ashraf, I. StomachNet: Optimal deep learning features fusion for stomach abnormalities classifcation. IEEE Access 2020, 8, 197969–197981. [Google Scholar] [CrossRef]
- Raghavendra, U.; Gudigar, A.; Vidhya, V.; Rao, B.N.; Sabut, S.; Wei, J.K.; Ciaccio, E.J.; Acharya, U.R. Novel and accurate non—linear index for the automated detection of haemorrhagic brain stroke using CT images. Complex Intell. Syst. 2021, 7, 929–940. [Google Scholar] [CrossRef]
- Liu, R.; Tan, C.L.; Leong, T.Y. Hemorrhage Slices Detection in Brain CT Images. In Proceedings of the 19th International Conference on Pattern Recognition, Tampa, FL, USA, 8 December 2008. [Google Scholar]
- Shahangian, B.; Pourghassem, H. Automatic brain hemorrhage segmentation and classification algorithm based on weighted grayscale histogram feature in a hierarchical classification structure. Biocybern. Biomed. Eng. 2015, 36, 217–232. [Google Scholar] [CrossRef]
- Al-AyyouB, M.; Alawad, D.; Al-Darabsah, K.; Aljarrah, I. Automatic detection and classification of brain hemorrhages. Lect. Notes Comput. Sci. 2018, 10752, 417–427. [Google Scholar]
- Xiao, C.-C.; Liao, J.; Wong, M.; Chiang, I.J. Automatic diagnosis of intracranial hematoma on brain ct using knowledge discovery techniques: Is finer resolution better? Biomed. Eng. Appl. Basis Commun. 2008, 20, 401–408. [Google Scholar] [CrossRef]
- Tong, H.; Faizal, M.; Fauzi, A.; Haw, S. Automated Hemorrhage Slices Detection for CT Brain Images. In Proceedings of the International Visual Informatics Conference, Selangor, Malaysia, 9–11 November 2011. [Google Scholar]
- Li, Y.H.; Zhang, L.; Hu, Q.M.; Li, H.W.; Jia, F.C.; Wu, J.H. Automatic subarachnoid space segmentation and hemorrhage detection in clinical head CT scans. Int. J. Comput. Assist. Radiol. Surg. 2012, 7, 507–516. [Google Scholar] [CrossRef] [PubMed]
- Yuh, E.L.; Gean, A.D.; Manley, G.T.; Callen, A.L.; Wintermark, M. Computer-aided assessment of head computed tomography (CT) studies in patients with suspected traumatic brain injury. J. Neurotrauma 2008, 1172, 1163–1172. [Google Scholar] [CrossRef]
- Diyana, W.M.; Zaki, M.F.; Fauzi, A.; Besar, R.; Ahmad, W.S.H.M.W. Abnormalities detection in serial computed tomography brain images using multi-level segmentation approach. Multimed. Tools Appl. 2011, 54, 321–340. [Google Scholar]
- Muschelli, J.; Sweeney, E.M.; Ullman, N.L.; Vespa, P.; Hanley, D.F.; Crainiceanu, C.M. PItcHPERFeCT: Primary Intracranial Hemorrhage Probability Estimation using Random Forests on CT. NeuroImage Clin. 2017, 14, 379–390. [Google Scholar] [CrossRef] [PubMed]
- Foo, Y.H.; Wong, J.H.D.; Azman, R.R.; Leong, Y.L.; Tan, L.K. Identification of acute intracranial bleed on computed tomography using computer aided detection. J. Phys. Conf. 2020, 1497, 012019. [Google Scholar] [CrossRef]
- Zhang, Y.; Chen, M.; Hu, Q.; Huang, W. Detection and quantification of intracerebral and intraventricular haemorrhage from computed tomography images with adaptive thresholding and case-based reasoning. Int. J. Comput. Assist. Radiol. Surg. 2013, 8, 917–927. [Google Scholar] [CrossRef]
- Chilamkurthy, S.; Ghosh, R.; Tanamala, S.; Biviji, M.; Campeau, N.G.; Venugopal, V.K.; Mahajan, V.; Rao, P.; Warier, P. Deep learning algorithms for detection of critical findings in head CT scans: A retrospective study. Lancet 2018, 392, 2388–2396. [Google Scholar] [CrossRef]
- Pizer, S.M.; Amburn, E.P.; Austin, J.D.; Cromarrtie, R.; Geselowitz, A.; Greer, T.; Romeny, H.; Zimmerman, J.B.; Zuiderveld, K. Adaptive histogram equalization and its variations. Comput. Vis. Graph. Image Process. 1987, 39, 355–368. [Google Scholar] [CrossRef]
- Otsu, N. A threshold selection method from gray-level histogram. IEEE Trans. Syst. Man Cybern. 1979, 9, 62–66. [Google Scholar] [CrossRef] [Green Version]
- Haralick, R.M.; Shanmugam, K.; Dinstein, I. Textural features for image classification. IEEE Trans. Syst. Man Cybern. 1973, 6, 610–621. [Google Scholar] [CrossRef] [Green Version]
- Humeau-Heurtier, A. Texture feature extraction methods: A survey. IEEE Access 2019, 7, 8975–9000. [Google Scholar] [CrossRef]
- Weszka, J.S.; Rosenfield, A. An application of texture analysis to material inspection. Pattern Recognit. 1976, 8, 195–200. [Google Scholar] [CrossRef]
- Tang, X. Texture information in run-length matrices. IEEE Trans. Image Process. 1998, 7, 1602–1609. [Google Scholar] [CrossRef] [Green Version]
- Galloway, M.M. Texture classification using gray level run length. Comput. Graph Image Proc. 1975, 4, 172–179. [Google Scholar] [CrossRef]
- Hu, M.K. Visual pattern recognition by moment invariants. IEEE Trans. Inf. Theory 1962, 8, 179–187. [Google Scholar]
- Gornale, S.S.; Patravali, P.U.; Hiremath, P.S. Automatic Detection and Classification of Knee Osteoarthritis Using Hu’s Invariant Moments. Front. Robot. AI 2020, 7, 591827. [Google Scholar] [CrossRef] [PubMed]
- He, H.; Yang, B.; Garcia, E.A.; Li, S.T. ADASYN: Adaptive synthetic sampling approach for imbalanced learning. In Proceedings of the IEEE Transactional Joint Conference on Neural Networks, Hong Kong, China, 1–6 June 2008. [Google Scholar]
- Tamimi, E.; Ebadi, H.; Kiani, A. Evaluation of different metaheuristic optimization algorithms in feature selection and parameter determination in SVM classification. Arab. J. Geosci. 2017, 10, 478. [Google Scholar] [CrossRef]
- Agrawal, P.; Abutarboush, H.F.; Ganesh, T.; Mohamed, A.W. Metaheuristic Algorithms on Feature Selection: A Survey of One Decade of Research (2009–2019). IEEE Access 2021, 9, 26766–26791. [Google Scholar] [CrossRef]
- Arora, S.; Singh, H.; Sharma, M.; Sharma, S.; Anand, P. A new hybrid algorithm based on grey wolf optimization and crow search algorithm for unconstrained function optimization and feature selection. IEEE Access 2019, 7, 26343–26361. [Google Scholar] [CrossRef]
- Yang, X.S. A new metaheuristic bat-inspired algorithm. In Proceedings of the 2010 International Workshop on Nature inspired cooperative strategies for optimization, Granada, Spain, 12–14 May 2010. [Google Scholar]
- Perwaiz, U.; Younas, I.; Anwar, A.A. Many-objective BAT algorithm. PLoS ONE 2020, 15, e0234625. [Google Scholar] [CrossRef] [PubMed]
- Mirjalili, S.; Mirjalili, S.M.; Lewis, A. Grey wolf optimizer. Adv. Eng. Softw. 2014, 69, 46–61. [Google Scholar] [CrossRef] [Green Version]
- Wang, J.S.; Li, S.X. An improved grey wolf optimizer based on differential evolution and elimination mechanism. Sci. Rep. 2019, 9, 7181. [Google Scholar] [CrossRef] [Green Version]
- Mirjalili, S.; Lewis, A. The whale optimization algorithm. Adv. Eng. Softw. 2016, 95, 51–67. [Google Scholar]
- Rana, N.; Abd Latiff, M.S.; Chiroma, H. Whale optimization algorithm: A systematic review of contemporary applications, modifications and developments. Neural Comput. Appl. 2020, 32, 1–33. [Google Scholar] [CrossRef]
- Paul, K.; Kumar, N.; Dalapati, P. Bat Algorithm for Congestion Alleviation in Power System Network. Technol. Econ. Smart Grids Sustain. 2021, 6, 1–18. [Google Scholar] [CrossRef]
- Koryshev, N.; Hodashinsky, I.; Shelupanov, A. Building a Fuzzy Classifier Based on Whale Optimization Algorithm to Detect Network Intrusions. Symmetry 2021, 13, 1211. [Google Scholar] [CrossRef]
- Larose, D.T. Discovering Knowledge in Data: An Introduction to Data Mining; Wiley-Interscience: Hoboken, NJ, USA, 2004. [Google Scholar]
- Kecman, D.V. Learning and Soft Computing: Support Vector Machines, Neural Networks, and Fuzzy Logic Models; MIT Press: Cambridge, MA, USA, 2001. [Google Scholar]


| Feature Extraction Scheme | No. of Samples before ADASYN | No. of Samples after ADASYN |
|---|---|---|
| GLRLM + statistical features | 831 | 946 |
| GLCM | 831 | 831 |
| Hu’s invariant moments | 831 | 831 |
| GLRLM+ statistical features + GLCM | 831 | 831 |
| GLRLM + statistical features + Hu’s invariant moments | 831 | 831 |
| GLCM + Hu’s invariant moments | 831 | 831 |
| GLRLM + statistical features + GLCM + Hu’s invariant moments | 831 | 831 |
| Feature Extraction Scheme | No. of Extracted Features |
|---|---|
| GLRLM + statistical features | 224 |
| GLCM | 368 |
| Hu’s invariant moments | 112 |
| GLRLM+ statistical features + GLCM | 592 |
| GLRLM + statistical features + Hu’s invariant moments | 336 |
| GLCM + Hu’s invariant moments | 480 |
| GLRLM + statistical features + GLCM + Hu invariant moments | 704 |
| Classifiers | Optimization Technique | Fold | Results | Confusion Matrix Parameters | ||||||
|---|---|---|---|---|---|---|---|---|---|---|
| Accuracy | Error Rate | Sensitivity | Specificity | tn | fp | fn | tp | |||
| Wide NN | Grey Wolf Version 1 | 10 | 90.60% | 9.40% | 90.80% | 90.40% | 904 | 96 | 87 | 859 |
| Fine KNN | Grey Wolf Version 1 | 10 | 95.07% | 4.93% | 97.57% | 92.70% | 927 | 73 | 23 | 923 |
| Weighted KNN | Grey Wolf Version 1 | 10 | 92.14% | 7.86% | 95.77% | 88.70% | 887 | 113 | 40 | 906 |
| Optimizable KNN | Grey Wolf Version 1 | 7 | 95.74% | 4.26% | 96.93% | 94.67% | 994 | 56 | 29 | 917 |
| Cubic SVM | Grey Wolf Version 1 | 10 | 92.29% | 7.71% | 92.49% | 92.10% | 921 | 79 | 71 | 875 |
| Classifiers | Optimization Technique | Fold | Results | Confusion Matrix Parameters | ||||||
|---|---|---|---|---|---|---|---|---|---|---|
| Accuracy | Error Rate | Sensitivity | Specificity | tn | fp | fn | tp | |||
| Wide NN | Bat | 10 | 90.11% | 9.89% | 89.17% | 90.90% | 909 | 91 | 90 | 741 |
| Fine KNN | Whale | 10 | 92.30% | 7.70% | 91.34% | 93.10% | 931 | 69 | 72 | 759 |
| Weighted KNN | Grey Wolf Version 2 | 10 | 88.97% | 11.03% | 84.96% | 92.30% | 923 | 77 | 125 | 706 |
| Optimizable KNN | Whale | 10 | 92.57% | 7.43% | 91.34% | 93.60% | 936 | 64 | 72 | 759 |
| Cubic SVM | Bat | 10 | 90.88% | 9.12% | 88.57% | 92.80% | 928 | 72 | 95 | 736 |
| Classifiers | Optimization Technique | Fold | Results | Confusion Matrix Parameters | ||||||
|---|---|---|---|---|---|---|---|---|---|---|
| Accuracy | Error Rate | Sensitivity | Specificity | tn | fp | fn | tp | |||
| Wide NN | Grey Wolf Version 1 | 10 | 83.23% | 16.77% | 80.99% | 85.10% | 851 | 149 | 158 | 673 |
| Fine KNN | Whale | 10 | 85.69% | 14.31% | 83.15% | 87.80% | 878 | 122 | 140 | 691 |
| Weighted KNN | Whale | 5 | 80.23% | 19.77% | 71.00% | 87.90% | 879 | 121 | 241 | 590 |
| Optimizable KNN | Whale | 10 | 89.13% | 10.87% | 87.36% | 90.60% | 906 | 94 | 105 | 726 |
| Cubic SVM | Whale | 10 | 76.84% | 23.16% | 59.69% | 91.10% | 911 | 89 | 335 | 496 |
| Classifiers | Optimization Technique | Fold | Results | Confusion Matrix Parameters | ||||||
|---|---|---|---|---|---|---|---|---|---|---|
| Accuracy | Error Rate | Sensitivity | Specificity | tn | fp | fn | tp | |||
| Wide NN | Bat | 10 | 89.46% | 10.54% | 87.97% | 90.70% | 907 | 93 | 100 | 731 |
| Fine KNN | Grey Wolf Version 2 | 10 | 93.06% | 6.94% | 91.22% | 94.60% | 946 | 54 | 73 | 758 |
| Weighted KNN | Whale | 10 | 87.55% | 12.45% | 84.24% | 91.00% | 728 | 72 | 131 | 700 |
| Optimizable KNN | Grey Wolf Version 1 | 7 | 93.77% | 6.23% | 92.18% | 95.10% | 951 | 49 | 65 | 766 |
| Cubic SVM | Grey Wolf Version 1 | 7 | 91.26% | 8.74% | 88.93% | 93.20% | 932 | 68 | 92 | 739 |
| Classifiers | Optimization Technique | Fold | Results | Confusion Matrix Parameters | ||||||
|---|---|---|---|---|---|---|---|---|---|---|
| Accuracy | Error Rate | Sensitivity | Specificity | tn | fp | fn | tp | |||
| Wide NN | Grey Wolf Version 1 | 10 | 90.61% | 9.39% | 89.65% | 91.40% | 914 | 86 | 86 | 745 |
| Fine KNN | Whale | 10 | 93.23% | 6.77% | 91.94% | 94.30% | 943 | 57 | 67 | 764 |
| Weighted KNN | Grey Wolf Version 1 | 10 | 90.39% | 9.61% | 85.68% | 94.30% | 943 | 57 | 119 | 712 |
| Optimizable KNN | Whale | 10 | 93.66% | 6.34% | 91.46% | 95.50% | 955 | 45 | 71 | 760 |
| Cubic SVM | Grey Wolf Version 1 | 10 | 91.75% | 8.25% | 89.41% | 93.70% | 937 | 63 | 88 | 743 |
| Classifiers | Optimization Technique | Fold | Results | Confusion Matrix Parameters | ||||||
|---|---|---|---|---|---|---|---|---|---|---|
| Accuracy | Error Rate | Sensitivity | Specificity | tn | fp | fn | tp | |||
| Wide NN | Grey Wolf Version 1 | 10 | 90.82% | 9.18% | 90.01% | 91.50% | 915 | 85 | 83 | 748 |
| Fine KNN | Bat | 7 | 91.26% | 8.74% | 89.17% | 93.00% | 930 | 70 | 90 | 741 |
| Weighted KNN | Bat | 10 | 89.68% | 10.32% | 84.48% | 94.00% | 940 | 60 | 129 | 702 |
| Optimizable KNN | Grey Wolf Version 1 | 7 | 92.63% | 7.37% | 91.10% | 93.90% | 939 | 61 | 74 | 757 |
| Cubic SVM | Bat | 10 | 90.72% | 9.28% | 88.09% | 92.90% | 929 | 71 | 99 | 732 |
| Classifiers. | Optimization Technique | Fold | Results | Confusion Matrix Parameters | ||||||
|---|---|---|---|---|---|---|---|---|---|---|
| Accuracy | Error Rate | Sensitivity | Specificity | tn | fp | fn | tp | |||
| Wide NN | Grey Wolf Version 2 | 10 | 90.55% | 9.45% | 88.81% | 92.00% | 920 | 80 | 93 | 738 |
| Fine KNN | Bat | 10 | 92.95% | 7.05% | 90.97% | 94.60% | 946 | 54 | 75 | 756 |
| Weighted KNN | Whale | 10 | 90.01% | 9.99% | 85.56% | 93.70% | 937 | 63 | 120 | 711 |
| Optimizable KNN | Bat | 10 | 93.56% | 6.44% | 91.82% | 95.00% | 950 | 50 | 68 | 763 |
| Cubic SVM | Whale | 10 | 91.48% | 8.52% | 89.53% | 93.10% | 931 | 69 | 87 | 744 |
| Classifiers | Feature Extraction Scheme | Optimization Technique | Fold | Results | Confusion Matrix Parameters | ||||||
|---|---|---|---|---|---|---|---|---|---|---|---|
| Accuracy | Error Rate | Sensitivity | Specificity | tn | fp | fn | tp | ||||
| Wide NN | GLCM + Hu’s invariant moments | Grey Wolf Version 1 | 10 | 90.82% | 9.18% | 90.01% | 91.50% | 915 | 85 | 83 | 748 |
| Fine KNN | GLRLM+ Statistical features | Grey Wolf Version 1 | 10 | 95.07% | 4.93% | 97.57% | 92.70% | 927 | 73 | 23 | 923 |
| Weighted KNN | GLRLM+ Statistical features | Grey Wolf Version 1 | 10 | 92.14% | 7.86% | 95.77% | 88.70% | 887 | 113 | 40 | 906 |
| Optimizable KNN | GLRLM+ Statistical features | Grey Wolf Version 1 | 7 | 95.74% | 4.26% | 96.93% | 94.67% | 994 | 56 | 29 | 917 |
| Cubic SVM | GLRLM+ Statistical features | Grey Wolf Version 1 | 10 | 92.29% | 7.71% | 92.49% | 92.10% | 921 | 79 | 71 | 875 |
| Approaches | CT Dataset | Method | Classifier | Performance |
|---|---|---|---|---|
| Raghavendra et al. [15] | 1603 | Entropy-based non-linear features | PNN | Acc: 97.37% |
| Shahangian and Pourghassem [17] | 627 | Modified Distance Regularized Level Set Evolution (MDRLSE), texture and shape features | Hierarchical structure | Acc: 94.13% |
| Al-Ayyoub et al. [18] | 76 | Region growing | Logistic | Acc: 92% |
| Xiao et al. [19] | 48 | Multi-resolution thresholding+ region growing + primary and derived features based on long and short axes | C4.5 | Acc: 0.975 |
| Tong et al. [20] | 450 | LBP texture features and histogram features | SVM | Acc: 90% |
| Li et al. [21] | 129 | Distance features based on landmark | Bayesian | Sen: 100 |
| Yuh et al. [22] | 273 | thresholding, spatial filtering, and cluster analysis and classification based on location, size, and shape of clusters | - | Sen: 98 |
| Zaki et al. [23] | 720 | FCM + multi-level thresholding + location and intensity features | - | Sen: 82.5% |
| Muschelli et al. [24] | 112 | Intensity-based predictors | Random forest classifier | DSI: 0.899 |
| Foo et al. [25] | 108 | Multiple thresholding and symmetry detection | - | Accuracy: 80.6 |
| Zhang et al. [26] | 426 | Adaptive thresholding and case-based reasoning | Genetic algorithm | Detection rate: 94.9% |
| Our approach | 1831 | GLRLM and statistical features | Optimizable KNN | Accuracy: 95.74% Sensitivity:96.93% Specificity:94.67% |
Publisher’s Note: MDPI stays neutral with regard to jurisdictional claims in published maps and institutional affiliations. |
© 2022 by the authors. Licensee MDPI, Basel, Switzerland. This article is an open access article distributed under the terms and conditions of the Creative Commons Attribution (CC BY) license (https://creativecommons.org/licenses/by/4.0/).
Share and Cite
V, V.; Raghavendra, U.; Gudigar, A.; Kasula, P.; Chakole, Y.; Hegde, A.; R, G.M.; Ooi, C.P.; Ciaccio, E.J.; Acharya, U.R. Automated Intracranial Hematoma Classification in Traumatic Brain Injury (TBI) Patients Using Meta-Heuristic Optimization Techniques. Informatics 2022, 9, 4. https://doi.org/10.3390/informatics9010004
V V, Raghavendra U, Gudigar A, Kasula P, Chakole Y, Hegde A, R GM, Ooi CP, Ciaccio EJ, Acharya UR. Automated Intracranial Hematoma Classification in Traumatic Brain Injury (TBI) Patients Using Meta-Heuristic Optimization Techniques. Informatics. 2022; 9(1):4. https://doi.org/10.3390/informatics9010004
Chicago/Turabian StyleV, Vidhya, U. Raghavendra, Anjan Gudigar, Praneet Kasula, Yashas Chakole, Ajay Hegde, Girish Menon R, Chui Ping Ooi, Edward J. Ciaccio, and U. Rajendra Acharya. 2022. "Automated Intracranial Hematoma Classification in Traumatic Brain Injury (TBI) Patients Using Meta-Heuristic Optimization Techniques" Informatics 9, no. 1: 4. https://doi.org/10.3390/informatics9010004
APA StyleV, V., Raghavendra, U., Gudigar, A., Kasula, P., Chakole, Y., Hegde, A., R, G. M., Ooi, C. P., Ciaccio, E. J., & Acharya, U. R. (2022). Automated Intracranial Hematoma Classification in Traumatic Brain Injury (TBI) Patients Using Meta-Heuristic Optimization Techniques. Informatics, 9(1), 4. https://doi.org/10.3390/informatics9010004