Article

Adaptive Information Density in Mobile Augmented Reality: A Framework for Enhancing Dual-Task Performance in Older Adults

1
Informatics Innovation Center of Excellence (IICE), School of Informatics, Walailak University, Nakhon Si Thammarat 80160, Thailand
2
Faculty of Engineering, Cambodia University of Technology and Science, Phnom Penh 121003, Cambodia
*
Author to whom correspondence should be addressed.
Informatics 2026, 13(6), 89; https://doi.org/10.3390/informatics13060089
Submission received: 2 March 2026 / Revised: 17 May 2026 / Accepted: 12 June 2026 / Published: 15 June 2026
(This article belongs to the Section Health Informatics)

Abstract

Smartphone-based augmented reality (AR) exercise systems show promise for supporting physical activity among older adults, yet the effect of presentation-layer information density on motor performance and cognitive workload in this population remains poorly understood. This study investigated how varying feedback density affects exercise correctness, error correction latency, and perceived workload in community-dwelling older adults (N = 60, aged 65–74 years) performing marching in place under three conditions: MIN, MOD, and RICH. The movement detection algorithm and binary correctness signal C ( t ) were held invariant across conditions, isolating presentation-layer density as the sole manipulated variable. One-way repeated-measures ANOVA revealed significant density effects on all three outcomes. MOD produced the highest exercise correctness (M = 74.72%), shortest error correction latency (M = 2.45 s), and lowest perceived workload (M = 41.40); RICH yielded pronounced degradation across all measures. These findings provide preliminary empirical evidence consistent with a Capacity-Relative Density Equilibrium (CRDE) perspective, a conceptual framework that proposes performance as a zone-structured function of the demand-to-capacity ratio (D/K). The framework remains tentative and requires further empirical operationalization due to the lack of a direct measure of cognitive capacity (K). From this perspective, we identify three potential design principles, actionable sufficiency, density threshold, and dual-task alignment, as practical heuristics for mobile AR systems targeting older adult populations.

1. Introduction

Smartphone-based augmented reality (AR) systems have emerged as accessible platforms for delivering real-time, personalized exercise feedback in everyday environments. By continuously tracking body joints and overlaying corrective visual cues on-screen, AR-guided applications can support physical performance without requiring specialized equipment or clinical supervision [1,2]. These characteristics make mobile AR particularly promising for health promotion among older adults, whose growing need for independent activity management presents both a societal and a design challenge [3].
A central design challenge in mobile AR exercise systems is determining the appropriate level of information density, which refers to the quantity, modality, and timing of feedback elements displayed during movement. In smartphone contexts, users must simultaneously perform motor tasks and process dynamic visual information, creating competing demands on limited cognitive resources. The degree to which presentation-layer complexity affects exercise performance, error correction, and perceived workload remains poorly understood, in part because existing AR systems rarely isolate feedback presentation from the underlying detection algorithms.
This challenge is especially pertinent for older adults. In Southeast Asia, including Thailand, the proportion of older adults is projected to exceed 20% of the total population within the current decade [3]. Age-related reductions in processing speed, working memory, and attentional resources [4] lower the cognitive bandwidth available during dual-task performance, making older adults particularly sensitive to high-density interfaces and a theoretically informative population for studying capacity-related density effects.
The practical relevance of this work spans mobile health, rehabilitation, and broader human–computer interaction. AR-guided exercise programs have demonstrated benefits for physical fitness and functional mobility among community-dwelling older adults [5,6], and the design principles derived here extend to any mobile system requiring concurrent motor and cognitive engagement.
Three theoretical frameworks bear on this problem. Cognitive Load Theory (CLT) predicts that excess interface complexity degrades performance by overwhelming working memory [7]. Motor Learning Theory (MLT) suggests that richer feedback can improve error correction and motor adaptation when calibrated appropriately [8]. Multiple-Resource Theory (MRT) predicts performance breakdown when concurrent cognitive and motor demands exceed available attentional capacity [9]. These frameworks make competing predictions about information density. MLT implies that additional feedback can be beneficial when task-relevant. CLT and MRT warn that excessive density can produce cognitive overload or resource interference.
Current interface guidelines address visual complexity and minimalism as general heuristics [10], and while adaptive approaches to information density in AR environments have been explored [11], these have not been integrated with user cognitive capacity constraints during motor task execution. Two constructs are central to this problem: a density threshold at which performance declines substantially and a dual-task alignment principle for calibrating feedback to available capacity. Neither has been systematically integrated into mobile AR design frameworks for older adults.
The main question addressed here is, therefore, not which AR interface is preferable but how presentation-layer density interacts with residual cognitive capacity under mobile dual-task conditions. Answering this requires architecturally separating the presentation layer from the detection layer and evaluating their effects independently.
To address this gap, we propose the Capacity-Relative Density Equilibrium (CRDE) framework. The CRDE treats feedback density as a tunable variable whose effects depend on the user’s residual attentional capacity. It draws from three theories: CLT’s working memory limits, MRT’s interference account, and MLT’s enrichment perspective. The framework predicts that performance is maintained up to a critical density level, beyond which it declines. The CRDE is proposed here as a framework, not a validated model. The study tests its core prediction empirically; full validation would require direct measurement of cognitive capacity, which this study does not provide. This study offers four contributions:
  • A presentation-layer isolation architecture that varies feedback density independently of detection-layer computation.
  • Empirical evidence that density and performance follow a non-monotonic pattern in older adults, with peak performance at moderate density.
  • The CRDE framework, which synthesizes CLT, MLT, and MRT into a single capacity-relative account of density effects.
  • Three design principles: actionable sufficiency, density threshold, and dual-task alignment as practical guidance for mobile AR systems.
These contributions provide actionable guidance for developers of mobile health platforms, rehabilitation technologies, and wearable computing systems, with design principles sensitive to the cognitive constraints of diverse user populations [12].
By isolating presentation-layer scaling while holding detection-layer computation constant, this study advances a framework for density–capacity interaction in real-time systems. The CRDE conceptualizes representational density as a resource allocation problem, integrating cognitive load, motor learning, and multiple-resource theories of mobile AR interaction.

2. Related Work and Theoretical Background

This section reviews the theoretical and empirical foundations that underpin the study. Four interconnected bodies of literature are examined: mobile AR feedback systems, information density and cognitive load, motor learning and feedback enrichment, and dual-task interference and capacity constraints. Together, these perspectives identify the mechanisms through which presentation-layer density may affect performance and highlight the gaps that motivate the capacity-relative modeling approach developed in this work.

2.1. Mobile AR Feedback Systems

A consistent finding across AR exercise and rehabilitation research is that the presence of AR feedback improves motor performance and user engagement relative to non-AR conditions [1,2,13]. Cavalcanti et al. [1] showed that text, image, and audio feedback channels each produced differential effects on exercise correction accuracy, suggesting that feedback modality is not interchangeable. Lohse et al. [2] confirmed through a systematic review that AR and virtual reality interventions yield positive motor outcomes across rehabilitation populations, and Sousa et al. [13] demonstrated that real-time corrective feedback in AR specifically supports movement accuracy during task execution. In older adult contexts, AR posture guidance has shown measurable improvements in functional mobility [5,6,14], and structured feedback interaction has been associated with increased intrinsic motivation [15].
However, prior studies have not clarified which feedback quantities and arrangements drive these outcomes. A critical observation is that feedback effectiveness and interface complexity have been evaluated as outcomes of AR system design, not as independent variables within it. Where modality has been varied [1,16], conditions were not mapped to cognitive demand or user processing capacity. Tatzgern et al. [11] represent the closest precedent, having examined adaptive information density in AR environments; yet their framework optimizes for perceptual clarity and display salience rather than for users’ cognitive capacity during concurrent motor execution. The collective absence of a presentation-layer isolation design means that observed performance differences in the existing literature cannot be attributed specifically to feedback density versus algorithmic detection quality, interface layout, or novelty effects.
This limitation is most consequential in older adult research. Studies consistently document physical outcome improvements [5,6,14], but the cognitive overhead of the AR interface goes unmeasured and uncontrolled in virtually all cases [12]. The field has established that AR exercise works for older adults without establishing under what interface conditions it works, and at what cognitive cost. This absence of presentation-layer analysis represents a fundamental gap in the current evidence base.

2.2. Information Density and Cognitive Load

CLT offers the most developed theoretical account of how interface density affects performance [7,17,18]. Its central insight is that cognitive load is not a property of the stimulus alone but an interaction between stimulus complexity and the learner’s available processing capacity: the same interface configuration that is informative for one user may constitute overload for another. CLT distinguishes intrinsic load (from task structure), extraneous load (from interface design), and germane load (from schema construction) and predicts that performance degrades when combined load exceeds working memory capacity [7,17]. Empirical studies in educational settings consistently confirm this pattern: excess interface complexity elevates error rates, increases response latency, and raises perceived workload [17,18].
A key limitation of this evidence base, however, is that it derives almost entirely from static, sequential information contexts. The simultaneous, motion-responsive overlays of mobile AR exercise systems represent a qualitatively different design space that CLT-based research has not directly addressed. When AR information density has been studied [11], it is treated as a display optimization problem, independent of user cognitive capacity. The capacity-relative dimension of CLT, namely, that optimal interface density shifts depending on who the user is and what concurrent demands they face, has not been operationalized in AR interface research. This gap is especially consequential for older adults; age-related reductions in working memory capacity and processing speed [4,19] lower the threshold between informative and overloading feedback density, making the CLT prediction both more practically significant and more empirically detectable in this population [12].
The implication is not that CLT is irrelevant to AR exercises but that its application necessitates an experimental framework that maintains task structure while parameterizing the presentation layer and engaging users whose processing constraints make the threshold between load and overload observable. Neither condition is representative of the existing literature.

2.3. Motor Learning and Feedback Enrichment

MLT generates predictions that directly conflict with those of CLT under high-density feedback conditions. Where CLT predicts performance degradation from excess interface elements, feedback enrichment accounts predict that additional, multimodal corrective information accelerates motor skill acquisition by enhancing error detection and proprioceptive–visual integration [8,20,21]. The knowledge of results framework [20] and bandwidth feedback paradigm [21] both indicate that the timing, frequency, and specificity of corrective information are positively related to motor adaptation, provided the information is actionable and task-relevant. These predictions would favor richer AR feedback configurations, even for users with limited cognitive capacity.
Sigrist et al. [8] synthesized evidence across visual, auditory, haptic, and multimodal feedback modalities and found that enriched, concurrent feedback generally improves motor learning when calibrated to task and learner characteristics. Burke et al. [16] further showed that optimal modality combinations are population-dependent, with performance benefits varying as a function of available sensory channels. For older adults, this raises a specific possibility that augmented visual feedback may compensate for age-related proprioceptive decline [5,6], making richer feedback configurations beneficial in precisely the population that CLT would predict to be most vulnerable to overload.
This contradiction is theoretically informative rather than merely paradoxical. It implies that feedback density has non-monotonic effects on performance; a zone of beneficial enrichment at lower density levels gives way to a zone of cognitive overload at higher levels, with the transition point varying as a function of the user’s residual processing capacity [7,17]. Crucially, this transition boundary is theoretically narrowest in older adults [4], where the range between underpowered and overloading feedback density is smallest. Studying density effects in this population is, therefore, not merely a practical choice but a theoretically informative approach for examining the enrichment-to-overload transition.

2.4. Dual-Task Interference and Capacity Constraints

MRT establishes that performance on any concurrent task pair degrades proportionally to shared resource demand. Mobile AR exercise instantiates this precisely; the motor task and visual feedback processing draw from overlapping visuospatial, attentional, and executive resources. What the dual-task literature has not addressed, however, is how the informational complexity of the secondary task modulates the degree of interference. Most dual-task paradigms treat the secondary task as a fixed cognitive load, such as an auditory tone response or verbal fluency task [9,22], rather than as a variable whose density can be systematically manipulated. This means that existing dual-task findings cannot directly predict how performance changes as AR feedback density increases.
The significance of this gap is amplified in the context of aging. Older adults do not simply perform worse under dual-task conditions; they actively reorganize resource allocation in response to competing demands [23]. Shumway-Cook et al. [22] and Yogev-Seligmann et al. [24] showed that gait performance in older adults is highly sensitive to the executive demands of concurrent cognitive tasks, with older adults often sacrificing motor accuracy to manage cognitive load. Lindenberger et al. [23] demonstrated that these compensatory costs increase systematically with age, reflecting progressively reduced capacity to sustain concurrent demands. Taken together, these findings suggest a specific risk for older adults exposed to high-density AR feedback: either disengaging from interface processing to preserve motor performance or sacrificing motor accuracy to manage the cognitive load of a dense overlay [4,19]. In neither case is the interface achieving its corrective purpose, and neither outcome would be detectable by studies that do not parameterize feedback density as an independent variable.

2.5. Research Gap

Synthesizing across these four areas reveals an integrative gap: cognitive theory has not been applied systematically to real-time, capacity-constrained motor feedback systems. CLT, MLT, and MRT each provide partial and partially conflicting accounts of density effects. CLT predicts performance degradation above a load threshold. MLT predicts enrichment benefits up to a capacity boundary. MRT predicts interference proportional to resource overlap. No existing framework specifies how enrichment transitions into overload, nor isolates presentation-layer density from detection-layer computation as an experimental variable. The one study that treated AR information density as a design variable [11] did not integrate cognitive capacity or motor task demands, leaving the intersection of density and capacity entirely unmodeled.
The CRDE framework offers one way to address this gap. It treats information density as a tunable variable whose effects depend on the user’s residual attentional capacity. Rather than positing a single optimal density level, the CRDE anticipates a non-monotonic pattern: performance is maintained up to a critical density level, beyond which it is hypothesized to decline. The threshold is expected to shift with individual capacity, which is why older adults serve as a theoretically informative population because their reduced processing capacity brings the enrichment–overload boundary into the observable range. The framework draws together CLT’s working memory model [7,17], MRT’s interference account [9], and MLT’s enrichment perspective [8,20], identifying the presentation-layer conditions under which density effects may emerge. Testing this framework across systematically isolated MIN, MOD, and RICH configurations in a capacity-constrained older adult sample provides an initial empirical examination of capacity-relative density effects in a mobile AR exercise context.

3. System Design and Development

This section describes the design and implementation of the smartphone-based AR exercise system developed for this study. The system is organized into two architecturally distinct layers: a computationally invariant detection layer responsible for real-time pose estimation and movement correctness classification and a density-manipulated presentation layer through which the resulting correctness signal is rendered to the user. This separation is the structural foundation that enables feedback density to be varied as an independent experimental variable while holding all detection-layer computation constant across conditions.

3.1. System Foundation and Prior Implementation

The AR platform builds upon a previously validated system for marching-in-place exercises in older adults [5]. That foundational work established the computational pipeline for real-time pose estimation and biomechanical correctness detection, including physiotherapist-validated movement criteria and system feasibility testing. The present study retains this detection-layer architecture without modification. The extension introduced here is the systematic manipulation of how the detection output is presented to the user, enabling empirical isolation of presentation-layer density effects from detection-layer variability. The research contribution, therefore, concerns not pose detection engineering but the modeling of how representational complexity interacts with invariant computational output under dual-task conditions.

3.2. System Architecture and Detection–Presentation Separation

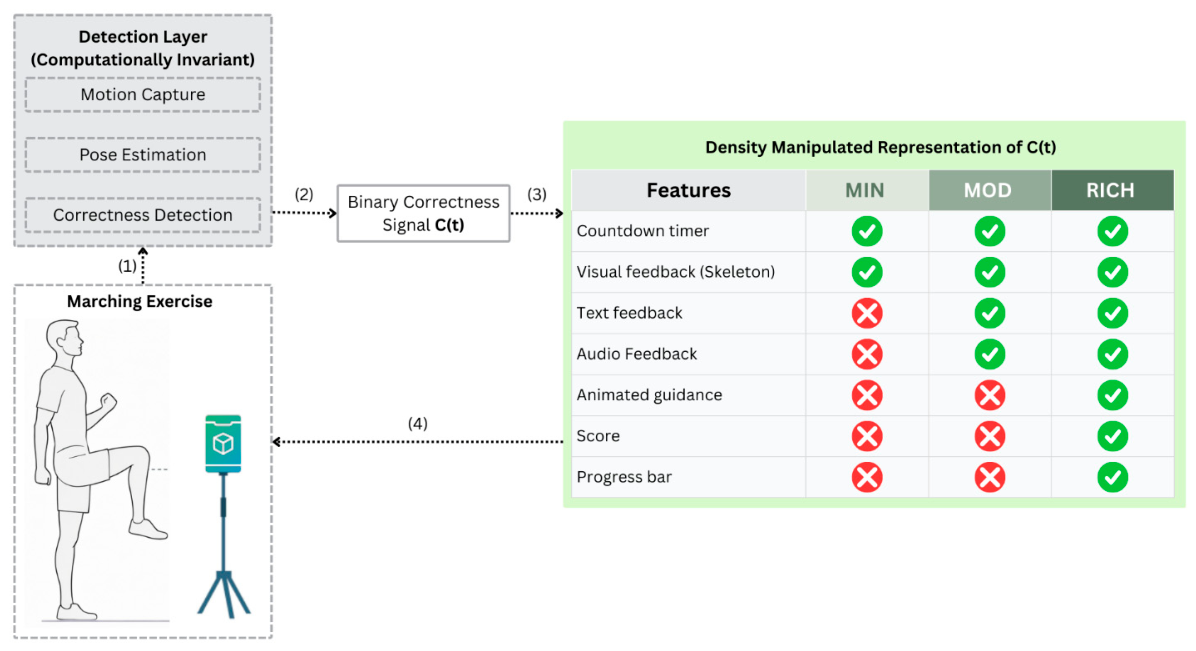
The system architecture consists of two structurally separated domains (Figure 1). The detection layer comprises three sequential real-time modules: motion capture via the smartphone camera, skeletal landmark extraction via MediaPipe Pose estimation, and biomechanical correctness evaluation. At each time point t, the correctness module evaluates the hip–knee–ankle joint configuration and generates a temporally synchronized binary correctness signal C ( t ) . This signal is defined as:
C ( t ) = 1   when biomechanical criteria for sufficient knee elevation are satisfied ; C ( t ) = 0   otherwise .
This signal equals 1 when all biomechanical criteria for adequate knee elevation are satisfied, and it is 0 otherwise. Landmark extraction, geometric computation, threshold parameters, and signal generation logic are identical across all experimental conditions, making C ( t ) a computationally invariant output. The presentation layer receives this invariant signal and maps it to one of three density-differentiated interface representations. Because the semantic content of C ( t ) is held constant, any performance differences observed across conditions reflect differences in the density of its representational rendering rather than changes in detection sensitivity or algorithmic behavior.

3.3. Correctness Signal Computation

The binary correctness signal C ( t ) was derived from the conjunctive satisfaction of three biomechanical criteria, validated in collaboration with licensed physiotherapists [5]. Criterion 1 (Knee Flexion) requires the hip–knee–ankle-included angle θknee ≥ 45°, representing the clinical threshold for effective lower-limb strengthening. Criterion 2 (Trunk Alignment) requires trunk deviation θtrunk ≤ 10° relative to gravitational vertical, ensuring postural stability and core engagement. Criterion 3 (Sagittal Plane Adherence) requires lateral knee displacement Δplane ≤ 15°, preventing compensatory hip abduction that reduces exercise efficacy. C ( t ) = 1 only when all three criteria are simultaneously satisfied; partial compliance is classified as incorrect execution. To prevent feedback oscillation from transient threshold crossings, a 2 s temporal stability filter was applied before any state transition was triggered. This detection procedure remained computationally invariant across all interface variants. The workflow is shown in Algorithm 1.
Algorithm 1 Real-time biomechanical correctness evaluation.
Input: landmarks—MediaPipe pose landmarks (33 points, 3D coordinates) t—current timestamp
Output:  C ( t ) —binary correctness signal {0, 1}
procedure COMPUTE_CORRECTNESS(landmarks, t):
  Extract key landmarks
  hip_L ← landmarks (23),   hip_R ← landmarks (24)
  knee_L ← landmarks (25),  knee_R ← landmarks (26)
  ankle_L ← landmarks (27), ankle_R ← landmarks (28)
  shoulder_L ← landmarks (11), shoulder_R ← landmarks (12)
  Criterion_1: Knee Flexion Angle (θ_knee ≥ 45°)
  thigh_vector ← knee_L − hip_L
  shin_vector ← ankle_L − knee_L
  θ_knee ← arccos(dot(thigh_vector, shin_vector)/(‖thigh_vector‖ × ‖shin_vector‖))
  criterion_1 ← (θ_knee ≥ 45°)
  Criterion_2: Trunk Alignment (|θ_trunk| ≤ 10°)
  trunk_vector ← shoulder_L − hip_L
  vertical ← (0, −1, 0)
  θ_trunk ← arccos(dot(trunk_vector, vertical)/‖trunk_vector‖)
  criterion_2 ← (|θ_trunk| ≤ 10°)
  Criterion_3: Sagittal Plane Constraint (Δ_plane ≤ 15°)
  displacement ← |knee_L.x − hip_L.x|
  Δ_plane ← arctan(displacement/‖thigh_vector‖)
  criterion_3 ← (Δ_plane ≤ 15°)
  Binary correctness with 2-s stability filter
  correct_instant ← Criterion_1 AND Criterion_2 AND Criterion_3
  if correct_instant AND stable_for(2 s) then
    return C ( t ) ← 1 //Correct movement
  else
    return C ( t ) ← 0 //Incorrect movement
  end if
end procedure

3.4. Presentation-Layer Information Density

All three interface variants were implemented as responsive progressive web applications accessible via smartphone browsers (iOS 17+, Android 11+). Screen dimensions ranged from 5.5 to 6.7 inches (1080 × 2340 to 1284 × 2778 pixels). Participants viewed interfaces from a 3.0 m distance with smartphones mounted at a 1.5 m height [5]. Each interface variant adhered to established mobile HCI design principles: MIN followed minimalist design [24], MOD implemented multimodal redundancy [15], and RICH incorporated gamification mechanics [2,16]. Design quality was held equivalent within density tiers through consistent color coding (green #4CAF50 for correct, orange #FF9800 for incorrect), typography (sans-serif, minimum 36 pt), and contrast ratios (≥7:1) [12,13,24].
Each variant rendered the same invariant C ( t ) signal at a different level of representational complexity, defined across three dimensions: element cardinality (number of simultaneous feedback components), modality richness (visual-only versus visual and auditory), and temporal dynamics (discrete state transitions versus continuous animation). Color coding conventions (orange for C ( t ) = 0 and green for C ( t ) = 1), typography, and contrast ratios were held consistent across conditions to control for design quality within each density tier. The details of the quantitative density classification are shown in Table 1.

3.4.1. Minimal Density Implementation

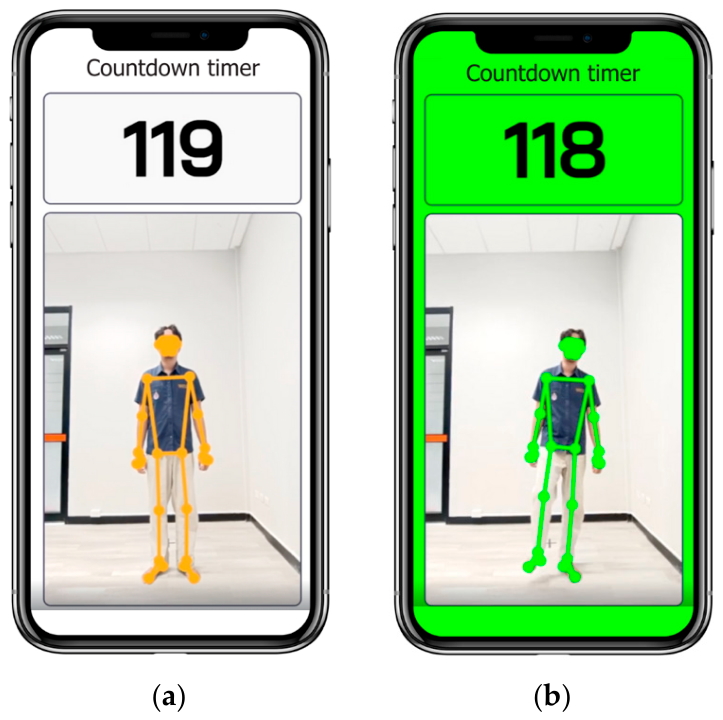
The minimal (MIN) condition was rendered C ( t ) through skeletal overlay and binary color coding only, supplemented by a countdown timer. No textual, auditory, or animated elements were introduced. All feedback remained visually static apart from color transitions directly triggered by C ( t ) state changes, instantiating low element cardinality, unimodal feedback, and discrete temporal dynamics, as shown in Figure 2.

3.4.2. Moderate Density Implementation

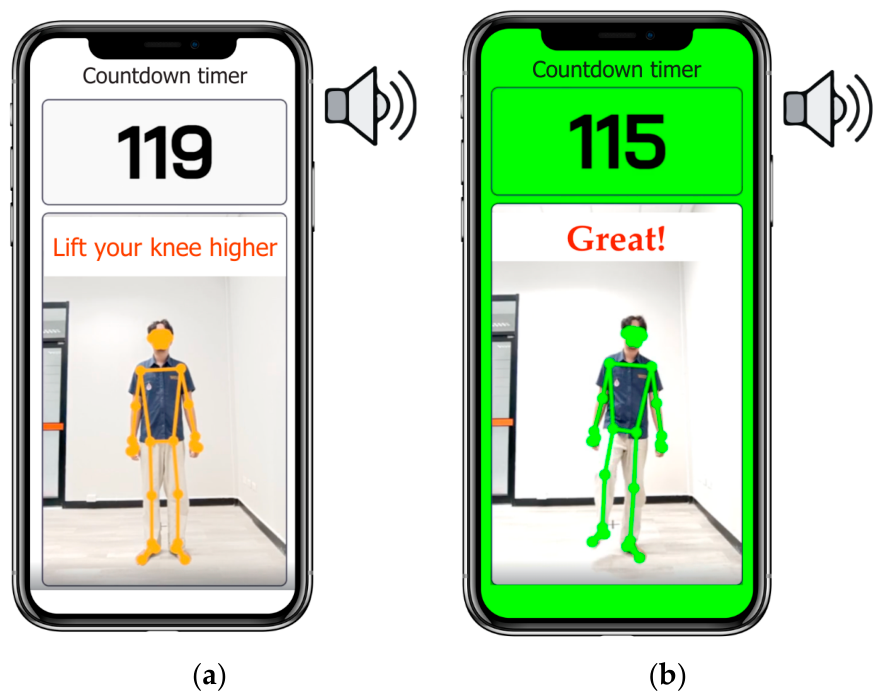
The moderate (MOD) condition added textual prompts and discrete auditory cues to the skeletal and color coding base, increasing modality richness and concurrent feedback elements relative to MIN. These additions expanded the representational mapping of C ( t ) without altering its semantic content and without introducing continuous animation, instantiating intermediate density, as shown in Figure 3.

3.4.3. Rich Density Implementation

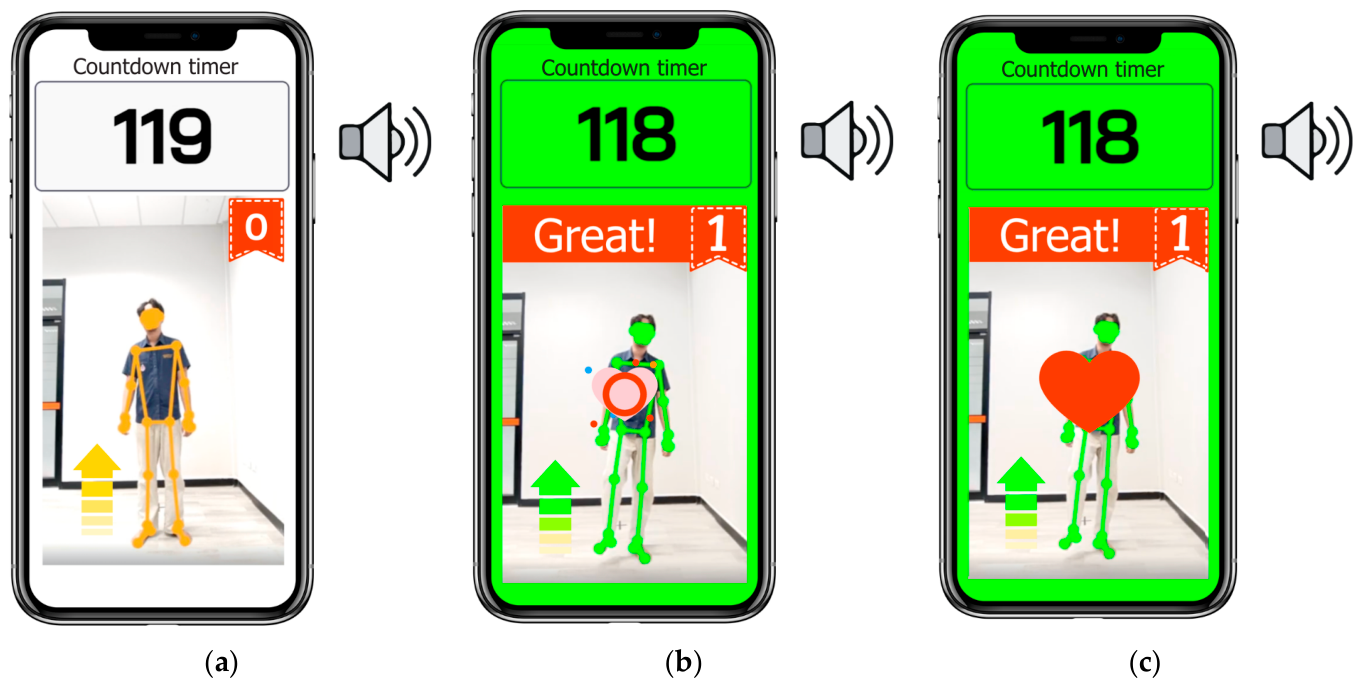
The rich (RICH) condition incorporated animated corrective guidance, real-time scoring indicators, progress visualization, and multimodal auditory reinforcement responding to C ( t ) . Unlike MIN and MOD, RICH introduced continuous temporal dynamics through animated elements that updated in synchrony with C ( t ) , reaching a maximum of eight simultaneous on-screen elements and occupying approximately 45% of the viewport (Figure 4). Gamification mechanics in RICH, including scoring and animated reinforcement, were incorporated as high-density representational elements rather than as isolated motivational interventions [15]. This design reflects the ecological reality of high-density AR interfaces, in which motivational augmentation and informational complexity are architecturally inseparable. The RICH condition, therefore, operationalizes high representational density exclusively through presentation-layer expansion while holding C ( t ) invariant.

4. Research Methodology

The experimental design was structured to isolate the causal impact of presentation-layer information density while holding all detection-layer computation constant. Because the binary correctness signal C ( t ) remained computationally invariant across all conditions, all performance variation can be attributed exclusively to differences in representational mapping rather than detection sensitivity. A within-subject repeated-measures design was adopted to minimize inter-individual variability in motor ability, perceptual capacity, and baseline coordination. Sample size was determined through a priori power analysis (G*Power 3.1) for repeated-measures ANOVA with three conditions, assuming a medium effect size f = 0.25, α = 0.05, power (1 − β) = 0.90, and conservative correlation among repeated measures (r = 0.30), yielding a minimum of n = 54. Sixty participants were recruited to account for potential attrition. All participants completed all conditions with no withdrawals.

4.1. Participants

Sixty community-dwelling older adults (aged 65–74 years, M = 68.6, SD = 2.5; 39 females, 21 males) were recruited from Thasala Senior Clubs in Nakhon Si Thammarat province, Thailand, through community-based outreach programs. Eligibility criteria required participants to be able to stand independently and perform marching-in-place movements without assistive devices. Individuals with severe musculoskeletal, neurological, or cardiovascular conditions that could interfere with task execution were excluded. Formal cognitive screening (e.g., MoCA or MMSE) was not administered; participants were drawn from active senior club members who had been independently engaged in community programs, suggesting functional cognitive status.
Baseline lower-body strength and functional capacity were assessed using the 30 s chair stand test (M = 12.3 repetitions, SD = 2.0), a validated measure of physical function in older adults [25]. Participant demographics and baseline characteristics are presented in Table 2. All participants provided written informed consent prior to enrollment. The research protocol received ethical approval from the Human Research Ethics Committee of Walailak University (approval code WUEC-24-114-01; approval date 5 June 2024), ensuring adherence to the Declaration of Helsinki guidelines.

4.2. Experimental Procedure

Each participant completed three 2 min (120 s) marching-in-place trials, one under each presentation-layer condition (MIN, MOD, RICH). Presentation order was counterbalanced using a Latin square arrangement with three sequence groups (Group A: MIN→MOD→RICH; Group B: MOD→RICH→MIN; Group C: RICH→MIN→MOD; n = 20 per group), ensuring each condition appeared equally in each ordinal position across participants.
Sessions were conducted individually in a controlled indoor environment and lasted approximately 90 min. Participants first received verbal task instructions and observed a researcher demonstration, followed by a 5 min familiarization period without system feedback to establish basic task comprehension. They also practiced completing the NASA-TLX questionnaire before experimental trials began.
During each trial, participants stood 3.0 m from a smartphone mounted on a tripod at 1.5 m elevation [5]. The task required concurrent marching-in-place execution and processing of real-time AR feedback displayed on the smartphone screen, instantiating the dual-task context central to the study’s theoretical framing. No verbal coaching or corrective instruction was provided during trials. All detection-layer parameters, including biomechanical thresholds, temporal stability filtering, sampling frequency (10 Hz), and signal generation logic, remained identical across all conditions. Following each trial, participants immediately completed the NASA-TLX. Ten-minute seated rest periods were provided between trials.

4.3. Outcome Measures

Movement and questionnaire data were processed and analyzed to evaluate the effects of interface information density on exercise performance and perceived cognitive workload. All analyses were conducted at the participant level using trial-level aggregates derived from the raw time-series data. Note that cognitive load in this study is operationalized through self-report (NASA-TLX) and behavioral indicators (correctness, error correction latency). It is inferred rather than directly measured.

4.3.1. Exercise Correctness

Raw movement data were recorded continuously during each two-minute trial at a sampling rate of 10 Hz, producing 1200 frames per trial. For each frame, the system generated a binary correctness signal C ( t ) { 0 ,   1 } based on the physiotherapist-validated criteria described in Section 3.1 and Section 3.4. Exercise correctness for each trial was calculated as the proportion of frames classified as correct relative to the total number of frames:
Correctness = t = 1 T C t T × 100
where C ( t ) denotes the binary correctness signal at time t and T represents the total number of frames in a trial. This aggregation yields a single correctness score per participant per interface condition.

4.3.2. Error Correction Latency

Error correction latency was computed by identifying error episodes within each trial, defined as transitions of the correctness signal from C ( t ) = 1 to C ( t ) = 0 , followed by a return to C ( t ) = 1 . For each error episode, latency was calculated as the elapsed time between error onset and subsequent correction. Because trials contained variable numbers of error episodes and occasional prolonged pauses, per-participant per-condition latency was computed as the mean of episode-level latencies, yielding a single trial-level value per condition for entry into the repeated-measures ANOVA. Inspection of episode-level distributions confirmed approximately normal within-condition shape with no extreme values from the condition mean. Trials in which no error episodes occurred were assigned a latency value of zero and retained in the analysis.

4.3.3. Cognitive Load

NASA-TLX responses were scored following the Raw TLX procedure. For each trial, sub-scale ratings were recorded on a 0–100 scale. Performance sub-scale ratings were reverse-coded so that higher values consistently indicated greater perceived workload. Overall cognitive load was calculated as the unweighted mean of the six sub-scale scores. Sub-scale scores were retained for secondary analyses to examine differential workload dimensions across interface conditions.

4.3.4. Movement Detection Stability

Two auxiliary measures were computed to verify that observed performance differences reflected presentation-layer density effects rather than detection-layer variability. Tracking lost frames were defined as frames in which the pose estimation pipeline failed to extract complete skeletal landmarks, reported as a per-trial count. The number of errors was defined as the count of error episodes per trial, where an error episode corresponds to a transition C ( t ) = 1 C ( t ) = 0 followed by a return to C ( t ) = 1 . These measures function as detection-layer invariance checks. If interface conditions differ on either variable, the detection-layer assumption is violated.

5. Results

This section evaluates whether performance and workload measures vary systematically as a function of presentation-layer information density under invariant detection conditions. Because C ( t ) and its computational thresholds remained unchanged across all interface configurations, observed behavioral differences can be attributed to representational density rather than algorithmic variation. Three outcome domains are examined: sustained biomechanical compliance (exercise correctness), corrective response dynamics (error correction latency), and perceived cognitive workload (NASA-TLX total score).

5.1. Statistical Analysis Approach

Prior to inferential testing, data distributions were inspected for normality using the Shapiro–Wilk test and for sphericity using Mauchly’s test. Mauchly’s test confirmed that the sphericity assumption was satisfied for all three outcomes (correctness: W = 0.96, p = 0.344; latency: W = 0.91, p = 0.061; NASA-TLX: W = 0.99, p = 0.746), and Greenhouse–Geisser corrections were, therefore, not required. Shapiro–Wilk tests indicated approximate normality across most conditions, with minor deviations observed in selected conditions given the within-subject design, moderate sample size (n = 60), and the known robustness of repeated-measures ANOVA to mild non-normality. The parametric approach was retained and verified against Friedman tests, which yielded identical patterns of significance (correctness: χ2(2) = 32.23, p < 0.001; latency: χ2(2) = 112.23, p < 0.001; NASA-TLX: χ2(2) = 90.53, p < 0.001). One-way repeated-measures ANOVA was used to examine the main effect of interface condition (MIN, MOD, RICH) on each outcome, with significant main effects followed by Bonferroni-corrected pairwise comparisons (α = 0.0167) to control familywise error. Effect sizes are reported as partial eta-squared (η2p) [26,27], and mean differences are accompanied by 95% confidence intervals. All tests were two-tailed at α = 0.05.

5.2. Exercise Correctness

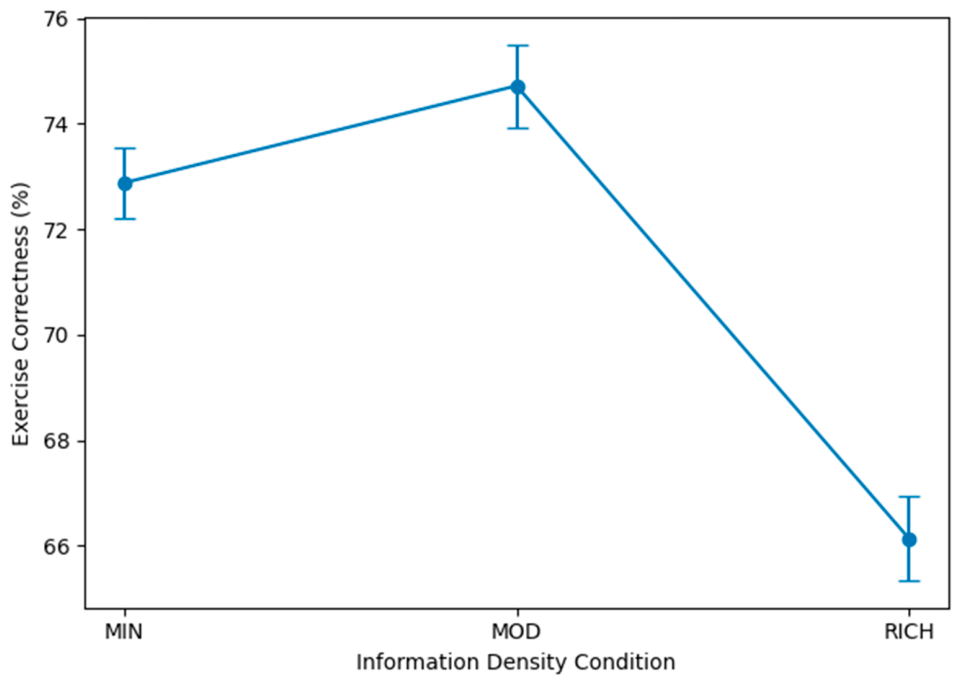
Exercise correctness differed significantly across density conditions, with F(2, 118) = 35.92, p < 0.001, and η2p = 0.378, indicating a large effect of presentation-layer density on sustained biomechanical compliance. The MOD condition yielded the highest mean correctness (M = 74.72%, SD = 6.50), followed by MIN (M = 72.88%, SD = 5.45), with RICH producing the lowest performance (M = 66.13%, SD = 6.43), as shown in Figure 5.
Bonferroni-adjusted post hoc comparisons showed that correctness in the RICH condition was significantly lower than both MIN (p < 0.001) and MOD (p < 0.001). The difference between MIN and MOD did not reach statistical significance (p = 0.216). This pattern does not reflect monotonic improvement with increasing density. Instead, correctness exhibited a non-linear response: moderate density maintained performance relative to minimal representation, whereas high density produced marked degradation. As C ( t ) and its thresholds remained invariant, the performance decline under RICH cannot be attributed to detection sensitivity but rather to representational overload under dual-task constraints.

5.3. Error Correction Latency

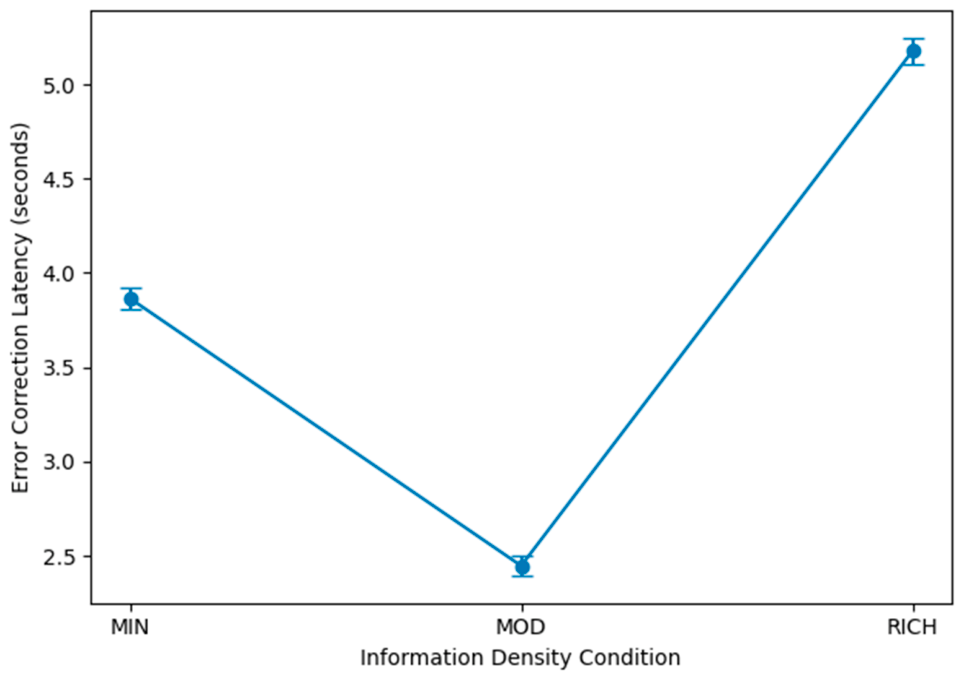
Error correction latency differed substantially across conditions, with F(2, 118) = 489.93, p < 0.001, and η2p = 0.893, with density accounting for nearly 89% of within-subject variance in corrective response time. The MOD condition produced the shortest mean latency (M = 2.45 s, SD = 0.33), followed by MIN (M = 3.87 s, SD = 0.44), with RICH yielding the longest recovery intervals (M = 5.18 s, SD = 0.63), as shown in Figure 6.
All pairwise comparisons were statistically significant after Bonferroni correction (all p < 0.001). Unlike correctness, which peaked under MOD and declined under RICH, latency demonstrated a monotonic scaling pattern: corrective recovery improved progressively from RICH to MIN to MOD. The exceptionally large effect size reflects the within-subject design, automated signal-based measurement, and substantial absolute mean differences relative to within-condition dispersion. Because detection logic remained invariant, the latency shifts indicate that representational overload impairs the temporal efficiency of motor correction independent of detection sensitivity.

5.4. Cognitive Load

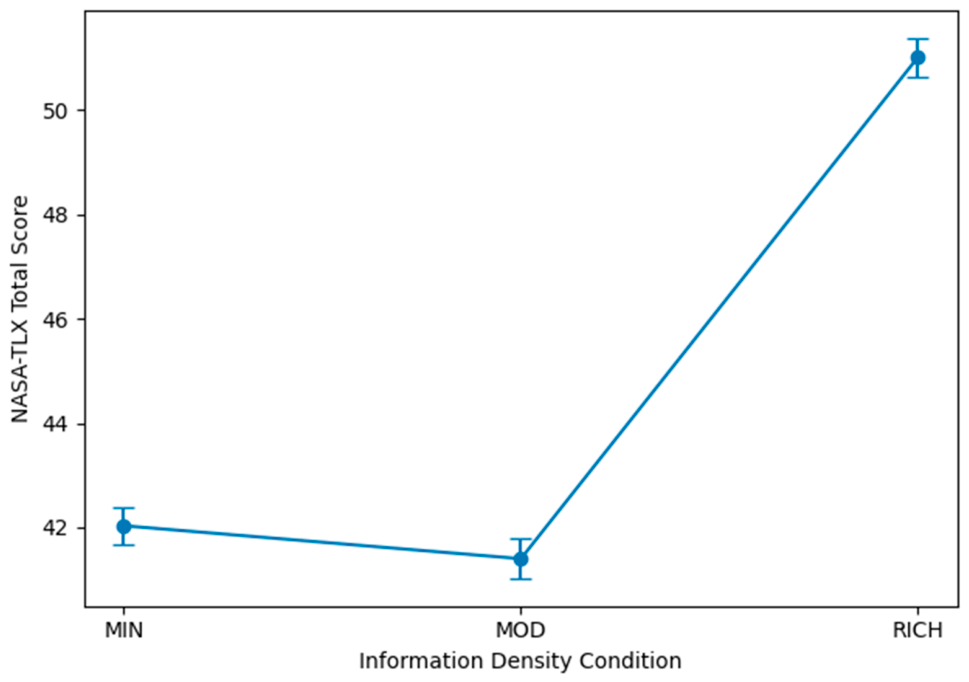
Perceived workload differed significantly across conditions, with F(2, 118) = 210.13, p < 0.001, and η2p = 0.781, with density accounting for approximately 78% of within-subject variance in NASA-TLX scores. Perceived workload was lowest in MOD (M = 41.40, SD = 2.90), marginally higher in MIN (M = 42.03, SD = 2.83), and substantially elevated in RICH (M = 51.01, SD = 3.02), as shown in Figure 7.
Bonferroni-adjusted comparisons revealed no significant difference between MIN and MOD (p = 0.708), whereas RICH produced significantly higher workload than both MIN and MOD (both p < 0.001). Perceived workload thus showed a monotonic escalation with density, diverging from the non-monotonic correctness pattern: moderate enrichment maintained performance without increasing subjective burden, whereas high-density representation simultaneously elevated cognitive demand and disrupted motor execution.
Sub-scale analyses in Table 3 revealed a clear dissociation. Physical workload did not differ significantly across conditions, whereas all five cognitive sub-scales, Mental, Temporal, Performance, Effort, and Frustration, showed a significant effect of density. This dissociation between invariant physical workload and substantial cognitive sub-scale effects is consistent with the interpretation that observed performance differences reflect cognitive rather than physical load.

5.5. Movement Detection Stability and Error Production

Two auxiliary measures were analyzed to verify that observed performance differences reflected presentation-layer density effects rather than detection-layer variability or differential error production. As shown in Table 4, neither tracking lost frames nor the number of error episodes per trial differed significantly across conditions, confirming that pose estimation reliability remained invariant under all interface configurations and that density manipulations did not change how often participants entered an error state.
These results carry an important mechanistic implication: density did not increase error production, but it altered the temporal efficiency of error recovery. Combined with the latency findings reported in Section 5.3, the data are consistent with the interpretation that representational density affects corrective response dynamics rather than initial error generation. This pattern also supports the validity of the presentation-layer isolation architecture; differences across conditions arise from how the correctness signal is rendered, not from differences in detection accuracy or error generation rate.

5.6. Integrated Performance Profile

Across all three measures in Table 5, MOD produced the best integrated performance profile; it had the highest correctness, shortest latency, and lowest perceived workload. RICH produced marked degradation across all domains, while MIN yielded intermediate outcomes. Critically, the three measures did not scale identically with density. Exercise correctness exhibited a non-linear response, peaking under MOD before declining sharply under RICH. Latency and workload, by contrast, demonstrated monotonic escalation patterns. This divergence indicates that sustained biomechanical compliance and corrective responsiveness are differentially sensitive to representational scaling, even as subjective workload increases progressively.
Because detection-layer computation and C ( t ) remained invariant, the observed shifts are unlikely to reflect changes in detection sensitivity and are more consistent with presentation-layer effects under conditions of increased representational load. The transition from MOD to RICH involved a marked, not strictly gradual, change in performance across all three outcomes. The substantial proportions of within-subject variance accounted for by density across latency (η2p = 0.893) and workload (η2p = 0.781) point to representational scaling as a salient determinant of behavioral and subjective response in this paradigm. Collectively, these results are consistent with the CRDE framework’s expectation that moderate informational enrichment preserves performance within a functional range, whereas density that exceeds available processing capacity is associated with substantial performance and workload costs.

6. Discussion

The present study shows that presentation-layer information density operates as an influential parameter in mobile AR systems operating under dual-task conditions. By maintaining computational invariance in motion detection, biomechanical thresholds, and the binary correctness signal C ( t ) , the findings isolate representational density as the sole manipulated variable. The resulting performance shifts are, therefore, unlikely to reflect algorithmic sensitivity and are more consistent with presentation-layer effects under conditions of increased representational load.
Across objective and subjective metrics, density exerted systematic effects. Moderate informational enrichment was associated with sustained biomechanical compliance, shorter correction latency, and stable workload. In contrast, high-density representation produced simultaneous degradation in correctness and recovery efficiency alongside substantial increases in perceived cognitive demand. The divergence between non-monotonic performance scaling and monotonic workload escalation suggests that representational complexity interacts with motor execution through partially dissociable response patterns. From a systems perspective, these findings imply that information density should be conceptualized as an allocatable resource rather than an additive feature set. Interface augmentation increases representational bandwidth, but excessive augmentation is associated with processing competition that disrupts motor performance.

6.1. Theoretical Framework Evaluation

The present findings inform a comparison among the three competing theoretical frameworks introduced in Section 1. Table 6 summarizes each framework’s core prediction against the observed empirical pattern.
Strict CLT predicts monotonic degradation yet cannot account for the functional equilibrium range within which moderate enrichment does not impose measurable performance cost. MLT predicts corrective benefit from richer feedback, a prediction that aligns with the data within capacity but not beyond it. MRT most closely resembles the performance decline observed under RICH but does not specify density conditions under which enrichment transitions from facilitative to disruptive, nor does it explain the stable performance observed in the moderate-density range. The CRDE framework presented in the next section draws these partial correspondences together into a synthesis-oriented account of capacity-relative density effects, treating equilibrium, transition, and decline as observed patterns rather than confirmed mechanisms.

6.2. CRDE Framework

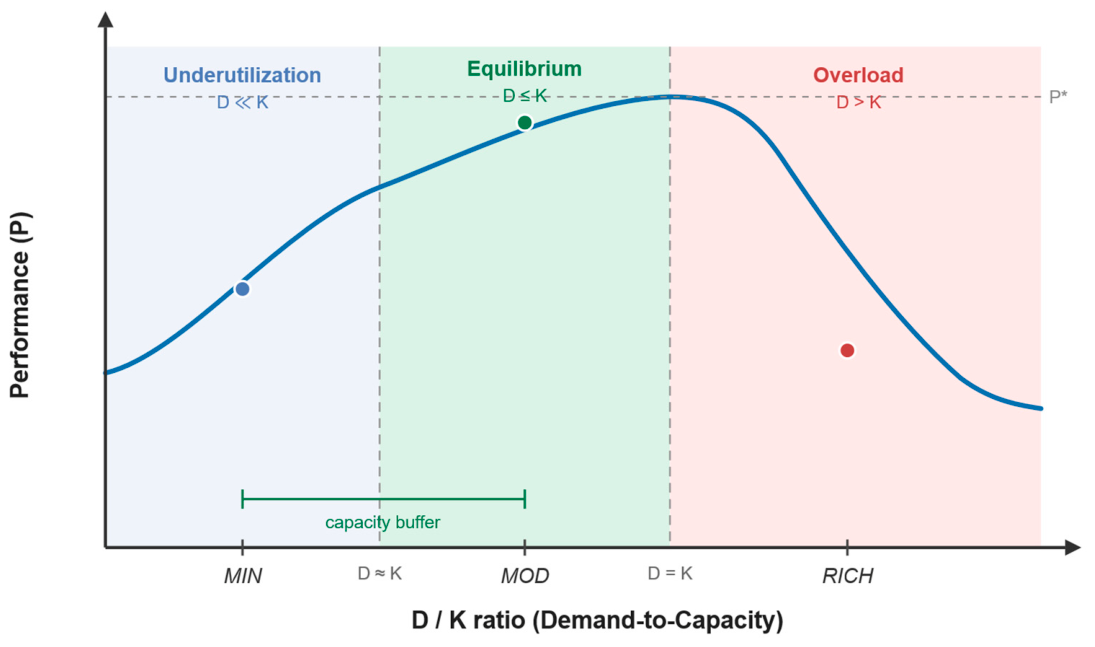
The CRDE framework offers a synthesis-oriented account anchored in CLT, MLT, and MRT. Representational density (D) is defined as the cardinality, modality richness, and temporal dynamics of feedback elements within a constrained attentional window; available cognitive–motor integration capacity (K) denotes bounded processing resources during concurrent motor execution. Performance (P) is hypothesized to behave as a zone-structured function of the D/K ratio. The CRDE proposes three interpretive zones (Figure 8). The framework is presented as a conceptual scaffold for organizing empirical observations and generating testable predictions; it is not a validated explanatory model, as K was not directly measured in this study (see also Section 6.4 and Section 7).
In the underutilization zone (D ≪ K), demand is conceptualized as well below available capacity; the feedback signal is detectable but lacks the modality richness and temporal specificity required for effective error correction. Cognitive burden is expected to be low, yet corrective efficacy is hypothesized to be constrained by insufficient salience rather than resource competition. The MIN condition plausibly corresponds to this zone in the present sample, providing only a binary color-coded skeleton with no additional corrective channel. In the equilibrium zone (D ≤ K), demand is conceptualized as rising to a level that is sufficient to support corrective action while remaining within available resources. The key distinction from the underutilization zone is that enrichment now adds diagnostic value; the feedback carries enough modality diversity and specificity to guide motor adjustment without substantially taxing the remaining attentional budget. MOD plausibly corresponds to this zone in the present sample, pairing the skeletal overlay with text and auditory cues that provide corrective salience without introducing continuous temporal demands. In the overload zone (D > K), representational demand is hypothesized to exceed available integration resources, with the framework anticipating a marked rather than gradual decline in performance. RICH plausibly corresponds to this zone in the present sample, where continuous directional arrows, animated elements, and a score badge impose persistent monitoring demands that, within this framework, are expected to compete with motor execution.
Within the equilibrium zone, the capacity buffer is conceptualized as the subregion where D approaches but does not exceed K (i.e., D ≈ K). In this near-saturation region, the framework hypothesizes that the system provides sufficient feedback salience while remaining within the available processing range, preserving a residual margin of available resources. The buffer is not a fixed quantity; it represents the conceptual attentional slack between a given density level and the user’s residual processing capacity. A wider buffer is proposed to indicate greater tolerance for additional enrichment, while a narrow buffer is proposed to imply proximity to the boundary of the equilibrium zone, where further increases in D would be expected to induce overload within this framework.
The empirical pattern is consistent with this proposed structure. Within the framework, both MIN and MOD plausibly correspond to the equilibrium zone, with MOD interpreted as positioned closer to K (i.e., operating within the capacity buffer) and MIN interpreted as further below, in the lower portion of the zone. This interpretation is consistent with why MOD outperformed MIN on correctness and latency; the framework hypothesizes that MOD’s higher density provided greater corrective salience while remaining within the available processing range. Notably, the MIN-to-MOD shift produced no significant degradation in correctness (p = 0.216) or workload (p = 0.708), a pattern consistent with the framework’s expectation that both conditions remain within the same zone, with their differences reflecting position within it. By contrast, the MOD-to-RICH shift yielded marked deterioration across all three measures, a pattern that the framework interprets as RICH exceeding the range associated with the equilibrium zone in the present sample. The framework hypothesizes that K is population-dependent; under this assumption, both the width of the equilibrium zone and the extent of the capacity buffer would be expected to shift with individual and contextual factors. The pronounced effects observed in this older adult sample are consistent with the framework’s expectation of a narrower buffer in capacity-constrained populations, although direct empirical estimation of K is required to confirm this interpretation.

6.3. Design Principles

The CRDE framework suggests three design principles for presentation-layer scaling in mobile AR systems serving capacity-constrained users such as older adults. These principles are derived from the framework and the present empirical pattern; they are offered as practical guidance and as testable propositions for future studies.
Actionable sufficiency proposes that feedback elements should provide diagnostically complete corrective information without exceeding the minimum channel count necessary for effective motor guidance. The MOD condition illustrates this principle in the present study; text and auditory cues convey corrective direction without introducing continuous temporal dynamics, and they yielded the highest correctness and lowest latency while maintaining workload stability comparable to MIN.
The density threshold principle proposes that representational complexity should remain within the equilibrium range hypothesized by the CRDE framework, which is conceptualized as bounded by user-specific capacity K. Augmentation beyond this range is hypothesized to produce representational competition rather than corrective benefit. The marked performance decline observed under RICH across all three outcome measures motivates this principle and is consistent with the framework’s expectation, although direct empirical estimation of K remains a target for future work. Interface designers should treat density as a bounded parameter, not an accumulative one, and calibrate feedback to the attentional budget of the target population.
Dual-task alignment recommends that feedback timing, modality selection, and simultaneity be calibrated to residual attentional capacity available during concurrent motor execution rather than optimized for informational completeness in isolation. Designs that do not account for motor task demands are likely to overestimate the density that users can productively process. Taken together, these three principles offer a capacity-relative perspective on interface density that may inform AR systems serving capacity-constrained users; their generalization to other user populations and task domains, such as rehabilitation, sports training, and occupational guidance, requires further empirical evaluation.

6.4. Limitations

Several limitations should be acknowledged. First, cognitive capacity (K) was not directly measured. Although K is central to the CRDE framework as the denominator of the D/K ratio, no formal cognitive screening (e.g., MoCA, MMSE) or capacity-specific assessment (e.g., working memory span, dual-task cost) was administered. The framework, therefore, remains a conceptual scaffold rather than an empirically estimated model, and the zone-based interpretation of MIN, MOD, and RICH should be understood as inference from convergent behavioral and subjective patterns, not direct verification of capacity-relative dynamics. Future work that operationalizes K through validated cognitive measures is required to test the framework’s predictions and to estimate zone boundaries empirically.
Second, the CRDE framework represents a synthesis of CLT, MLT, and MRT rather than an independent theoretical construct. Its contribution lies in proposing a capacity-relative organizational structure for partially conflicting predictions from these established frameworks, not in introducing fundamentally new theoretical constructs. The novelty of the CRDE should accordingly be understood as a conceptual organization rather than a theoretical reformulation.
Third, cognitive workload was inferred from self-report (NASA-TLX) and behavioral indicators (correctness, error correction latency) rather than being directly measured. Although the dissociation between invariant physical sub-scale scores and substantial cognitive sub-scale effects (Section 5.4) is consistent with a cognitive locus of the density effect, this conclusion remains an inference. Future work should incorporate objective physiological measures such as pupillometry, EEG-derived workload indices, or heart rate variability to provide convergent validation.
Fourth, only three density conditions (MIN, MOD, RICH) were tested. Although this design isolates presentation-layer density and produces clearly differentiated patterns, three discrete levels cannot delineate the underlying density–performance function in fine detail. Studies sampling additional density levels are needed to characterize the shape and width of the proposed equilibrium zone, the location of the transition into the overload region, and the inter-individual variability around these boundaries.
Fifth, the effect sizes observed for latency (η2p = 0.893) and workload (η2p = 0.781) are large by behavioral-research standards and should be interpreted in the context of the within-subject design, the automated signal-based measurement of latency, and the relatively homogeneous community-dwelling sample. These conditions reduce measurement noise and inter-individual variability and are likely to inflate effect-size estimates relative to between-subject designs or to more heterogeneous populations. The magnitudes reported here should not be treated as population-level estimates, and replication in broader samples with between-subject components is necessary to evaluate external generalizability.
Sixth, the sample comprised community-dwelling older adults from a single province in Thailand who were capable of independent standing and marching, thereby excluding individuals with more severe functional impairment. Generalizability to other cultural contexts, younger adults, clinical rehabilitation settings, or populations with different technology familiarity remains to be established.
Seventh, education level and biological sex were not analyzed as covariates despite meaningful distributional variation within the sample. Given established associations between education, technology literacy, and dual-task capacity, as well as documented sex differences in spatial processing among older adults, future studies should examine whether these variables moderate density–performance relationships.
Eighth, each trial was limited to two minutes, which may not reflect steady-state performance under prolonged exposure. Novelty and adaptation effects during initial task engagement may have influenced outcomes, particularly in the RICH condition. Relatedly, gamification mechanics in RICH were treated as components of high-density representation rather than as independent motivational interventions; factorial designs manipulating density and gamification independently would enable cleaner attribution of effects.

7. Conclusions

Among sixty community-dwelling older adults performing marching in place under three presentation-layer density conditions, moderate enrichment (MOD) yielded the highest exercise correctness (M = 74.72%), shortest error correction latency (M = 2.45 s), and lowest perceived workload (M = 41.40), while high-density presentation (RICH) produced significant degradation across all three measures. Because detection-layer computation and the binary correctness signal C ( t ) remained invariant across conditions, these differences are unlikely to reflect changes in detection sensitivity and are more consistent with presentation-layer effects on the bounded cognitive resources of older adults. Age-related changes in attentional capacity make older adults a theoretically informative population for examining the region in which beneficial feedback enrichment is hypothesized to transition into cognitive competition; direct empirical estimation of cognitive capacity, however, was not undertaken in the present study.
These findings are interpreted within the proposed CRDE framework, which organizes density-dependent performance patterns within a capacity-relative conceptual structure rather than a validated explanatory model. The observed pattern of stable performance in MIN and MOD, contrasted with significant deterioration under RICH, is consistent with a marked rather than gradual change as density approaches and exceeds capacity-relative limits, a pattern that the framework would expect to be more pronounced in capacity-constrained groups, such as older adults. For developers of mobile health and AR rehabilitation systems serving older adults, these findings suggest treating interface density as a bounded, population-sensitive parameter rather than an accumulative feature target. This interpretative framework proposes three design principles, actionable sufficiency, density threshold, and dual-task alignment, as testable propositions. Priority future work includes direct empirical operationalization of K through validated cognitive measures, sampling additional density levels to delineate the proposed equilibrium and overload regions, and extending CRDE evaluation to diverse populations and task contexts.

Author Contributions

Conceptualization, C.K. (Charlee Kaewrat) and C.K. (Chaowanan Khundam); methodology, C.K. (Charlee Kaewrat) and C.K. (Chaowanan Khundam); software, C.K. (Charlee Kaewrat) and M.T.; validation, C.K. (Charlee Kaewrat); formal analysis, C.K. (Charlee Kaewrat), C.K. (Chaowanan Khundam), and M.T.; investigation, C.K. (Charlee Kaewrat) and C.K. (Chaowanan Khundam); resources, C.K. (Charlee Kaewrat) and M.T.; data curation, C.K. (Charlee Kaewrat) and C.K. (Chaowanan Khundam); writing—original draft preparation, C.K. (Charlee Kaewrat) and C.K. (Chaowanan Khundam); writing—review and editing, C.K. (Charlee Kaewrat), C.K. (Chaowanan Khundam), and M.T.; visualization, C.K. (Charlee Kaewrat) and C.K. (Chaowanan Khundam); supervision, C.K. (Charlee Kaewrat); project administration, C.K. (Charlee Kaewrat); funding acquisition, C.K. (Charlee Kaewrat). All authors have read and agreed to the published version of the manuscript.

Funding

This research received no external funding.

Institutional Review Board Statement

The study was conducted in accordance with the Declaration of Helsinki and was approved by the Human Research Ethics Committee of Walailak University (approval code WUEC-24-114-01; approval date 5 June 2024).

Informed Consent Statement

Informed consent was obtained from all subjects involved in the study.

Data Availability Statement

The data that support the findings of this study are available from the corresponding author upon reasonable request.

Acknowledgments

During the preparation of this manuscript, the authors used Gemini 3.5 Flash and Claude Opus 4.7 for the purposes of refining sentences, image generation, and formatting according to journal standards. The authors have reviewed and edited the output and take full responsibility for the content of this publication.

Conflicts of Interest

The authors declare no conflicts of interest.

References

  1. Cavalcanti, V.C.; Ferreira, M.I.d.S.; Teichrieb, V.; Barioni, R.R.; Correia, W.F.M.; Da Gama, A.E.F. Usability and effects of text, image and audio feedback on exercise correction during augmented reality based motor rehabilitation. Comput. Graph. 2019, 85, 100–110. [Google Scholar] [CrossRef] [Scilit]
  2. Lohse, K.R.; Hilderman, C.G.E.; Cheung, K.L.; Tatla, S.; Van Der Loos, H.F.M. Virtual reality therapy for adults post-stroke: A systematic review and meta-analysis exploring virtual environments and commercial games in therapy. PLoS ONE 2014, 9, e93318. [Google Scholar] [CrossRef] [Scilit] [PubMed]
  3. Guillemot, J.R.; Zhang, X.; Warner, M.E. Population aging and decline will happen sooner than we think. Soc. Sci. 2024, 13, 190. [Google Scholar] [CrossRef] [Scilit]
  4. Park, D.C.; Lautenschlager, G.; Hedden, T.; Davidson, N.S.; Smith, A.D.; Smith, P.K. Models of visuospatial and verbal memory across the adult life span. Psychol. Aging 2002, 17, 299–320. [Google Scholar] [CrossRef]
  5. Kaewrat, C.; Haruehansapong, K.; Sriwilai, T.; Chuchuai, P.; Efendi, M.A.; Sahoh, B. Engineered science design and evaluation of an augmented reality posture guidance system for marching exercises in older adults: A pilot study. Eng. Sci. 2025, 35, 1536. [Google Scholar] [CrossRef] [Scilit]
  6. Kato, Y.; Islam, M.M.; Koizumi, D.; Rogers, M.E.; Takeshima, N. Effects of a 12-week marching in place and chair rise daily exercise intervention on ADL and functional mobility in frail older adults. J. Phys. Ther. Sci. 2018, 30, 549–554. [Google Scholar] [CrossRef] [Scilit] [PubMed]
  7. Sweller, J. Cognitive load during problem solving: Effects on learning. Cogn. Sci. 1988, 12, 257–285. [Google Scholar] [CrossRef] [Scilit]
  8. Sigrist, R.; Rauter, G.; Riener, R.; Wolf, P. Augmented visual, auditory, haptic, and multimodal feedback in motor learning: A review. Psychon. Bull. Rev. 2013, 20, 21–53. [Google Scholar] [CrossRef] [Scilit] [PubMed]
  9. Wickens, C.D. Multiple resources and performance prediction. Theor. Issues Ergon. Sci. 2002, 3, 159–177. [Google Scholar] [CrossRef] [Scilit]
  10. Nielsen, J. Designing Web Usability; New Riders Publishing: Indianapolis, IN, USA, 2000. [Google Scholar]
  11. Tatzgern, M.; Orso, V.; Kalkofen, D.; Jacucci, G.; Gamberini, L.; Schmalstieg, D. Adaptive information density for augmented reality displays. In Proceedings of the IEEE Virtual Reality Conference, Greenville, SC, USA, 19–23 March 2016; pp. 83–92. [Google Scholar] [CrossRef] [Scilit]
  12. Liu, N.; Yin, J.; Tan, S.S.L.; Ngiam, K.Y.; Teo, H.H. Mobile health applications for older adults: A systematic review of interface and persuasive feature design. J. Am. Med. Inform. Assoc. 2021, 28, 2483–2501. [Google Scholar] [CrossRef] [Scilit] [PubMed]
  13. Sousa, M.; Vieira, J.; Medeiros, D.; Arsénio, A.; Jorge, J. SleeveAR: Augmented reality for rehabilitation using realtime feedback. In Proceedings of the 21st International Conference on Intelligent User Interfaces, Sonoma, CA, USA, 7–10 March 2016; pp. 175–185. [Google Scholar] [CrossRef] [Scilit]
  14. Kimura, Y.; Hisatomi, M.; Ikegami, T.; Ohki, K.; Shimada, M.; Hongu, N. Effects of marching in place and chair rise exercises on functioning in community-dwelling older adults. Med. Sci. Sports Exerc. 2022, 54, 532. [Google Scholar] [CrossRef] [Scilit]
  15. Mekler, E.D.; Brühlmann, F.; Tuch, A.N.; Opwis, K. Towards understanding the effects of individual gamification elements on intrinsic motivation and performance. Comput. Hum. Behav. 2017, 71, 525–534. [Google Scholar] [CrossRef] [Scilit]
  16. Burke, J.L.; Prewett, M.S.; Elliott, L.R.; Coovert, M.D. Comparing the effects of visual-auditory and visual-tactile feedback on user performance: A meta-analysis. In Proceedings of the 8th International Conference on Multimodal Interfaces, Banff, AB, Canada, 2–4 November 2006; pp. 108–117. [Google Scholar] [CrossRef] [Scilit]
  17. Chandler, P.; Sweller, J. Cognitive load theory and the format of instruction. Cogn. Instr. 1991, 8, 293–332. [Google Scholar] [CrossRef] [Scilit] [PubMed]
  18. Sweller, J.; Van Merrienboer, J.J.G.; Paas, F.G.W.C. Cognitive architecture and instructional design. Educ. Psychol. Rev. 1998, 10, 251–296. [Google Scholar] [CrossRef] [Scilit]
  19. Bopp, K.L.; Verhaeghen, P. Aging and verbal memory span: A meta-analysis. J. Gerontol. Ser. B 2005, 60, P223–P233. [Google Scholar] [CrossRef] [Scilit] [PubMed]
  20. Salmoni, A.W.; Schmidt, R.A.; Walter, C.B. Knowledge of results and motor learning: A review and critical reappraisal. Psychol. Bull. 1984, 95, 355–386. [Google Scholar] [CrossRef]
  21. Sherwood, D.E. Effect of bandwidth knowledge of results on movement consistency. Percept. Mot. Ski. 1988, 66, 535–542. [Google Scholar] [CrossRef] [Scilit] [PubMed]
  22. Shumway-Cook, A.; Brauer, S.; Woollacott, M. Predicting the probability for falls in community-dwelling older adults using the Timed Up & Go Test. Phys. Ther. 2000, 80, 896–903. [Google Scholar] [CrossRef] [Scilit]
  23. Lindenberger, U.; Marsiske, M.; Baltes, P.B. Memorizing while walking: Increase in dual-task costs from young adulthood to old age. Psychol. Aging 2000, 15, 417–436. [Google Scholar] [CrossRef] [Scilit] [PubMed]
  24. Yogev-Seligmann, G.; Hausdorff, J.M.; Giladi, N. The role of executive function and attention in gait. Mov. Disord. 2008, 23, 329–342. [Google Scholar] [CrossRef] [Scilit] [PubMed]
  25. Rikli, R.E.; Jones, C.J. Development and validation of a functional fitness test for community-residing older adults. J. Aging Phys. Act. 1999, 7, 129–161. [Google Scholar] [CrossRef] [Scilit]
  26. Bakeman, R. Recommended effect size statistics for repeated measures designs. Behav. Res. Methods 2005, 37, 379–384. [Google Scholar] [CrossRef] [Scilit] [PubMed]
  27. Lakens, D. Calculating and reporting effect sizes to facilitate cumulative science: A practical primer for t-tests and ANOVAs. Front. Psychol. 2013, 4, 863. [Google Scholar] [CrossRef] [Scilit] [PubMed]
Figure 1. System architecture illustrating detection-layer invariance and presentation-layer density manipulation. The computationally invariant detection layer (motion capture, pose estimation, and correctness detection) generates a temporally synchronized binary correctness signal C ( t ) . This invariant signal is transmitted to the presentation layer, where it is rendered through density-manipulated interface variants (MIN, MOD, and RICH). While C ( t ) remains identical across conditions, its representational complexity varies, enabling isolation of information density effects under dual-task constraints.
Informatics 13 00089 g001
Figure 2. MIN interface showing minimal density representation. (a) Incorrect state C ( t ) = 0: orange skeleton, black timer border. (b) Correct state C ( t ) = 1: green skeleton, green border frame. No additional modalities or animated elements.
Informatics 13 00089 g002
Figure 3. MOD interface showing moderate density with multimodal elements. (a) Incorrect state: adds text “Lift your knee higher” with audio. (b) Correct state: displays “Great!” with audio confirmation. No animated elements.
Informatics 13 00089 g003
Figure 4. RICH interface maximum density configuration with annotated elements. (a) Incorrect state C ( t ) = 0: timer black border, orange skeleton, orange continuous arrow, score badge, text guidance. (b) Correct state transition: green timer border, green skeleton, green arrow, text “Great!” + audio, score incremented. (c) Sustained correct state: pulsing heart animation at the chest, maximum simultaneity = 8 elements, 45% screen occupancy, information streams. All elements render an identical invariant C ( t ) signal.
Informatics 13 00089 g004
Figure 5. Mean exercise correctness (%) across presentation-layer density conditions. Error bars represent within-subject corrected standard errors. MOD produced the highest sustained correctness, whereas RICH resulted in pronounced performance degradation.
Informatics 13 00089 g005
Figure 6. Mean error correction latency (seconds) across density conditions. Error bars represent within-subject corrected standard errors. Latency demonstrated strong density-dependent scaling, with substantially prolonged recovery intervals under the RICH configuration.
Informatics 13 00089 g006
Figure 7. Mean NASA-TLX total scores across presentation-layer density conditions. Error bars represent within-subject corrected standard errors. Perceived workload increased monotonically with representational density, diverging from the non-monotonic performance pattern observed in exercise correctness.
Informatics 13 00089 g007
Figure 8. Conceptual diagram of the CRDE framework. The figure illustrates the framework’s proposed three-zone structure as a function of the D/K ratio and is not derived from empirical estimation of K, which was not measured in the present study. Within this conceptualization, performance (P) is hypothesized to be preserved within the equilibrium zone (D ≤ K). P* denotes the theoretical performance ceiling under optimal demand–capacity alignment. Colored markers indicate the schematic positions of each experimental condition within the framework: the blue marker represents MIN (underutilization zone), the green marker represents MOD (equilibrium zone, within the capacity buffer), and the red marker represents RICH (overload zone). The shaded region indicates the proposed capacity buffer; the positions of MIN, MOD, and RICH along the D/K axis are schematic, not empirically estimated.
Informatics 13 00089 g008
Table 1. The quantitative density classification across the three interface conditions, confirming monotonic ordering across all structural dimensions.
DimensionMINMODRICHOrderingDesign Quality Control
ELEMENT CARDINALITY
Core feedback
elements
247MIN < MOD < RICHAll follow appropriate HCI principles for their density tier [10,15,16]
Maximum
simultaneous (with timer)
358MIN < MOD < RICHEquivalent contrast ratios (≥7:1) across conditions [12]
MODALITY RICHNESS
Sensory
channels
1 (visual)2 (visual + auditory)2 (visual + auditory)MIN < MOD = RICHMultimodal redundancy design [16]
Color coding conventionGreen/orangeGreen/orangeGreen/orangeInvariantAR rehabilitation conventions [24]
TEMPORAL DYNAMICS
Continuous
elements
001 (arrow)MIN = MOD < RICHAppropriate to density philosophy
State
transitions
DiscreteDiscreteMixed
Animation
presence
NoneNoneContinuous (arrow) + Discrete (heart)MIN = MOD < RICH
SCREEN OCCUPANCY METRICS
Viewport area occupied (%)~15%~25%~45%MIN < MOD < RICHAge-appropriate sizing [10,12]
Information stream count124MIN < MOD < RICHVisual hierarchy maintained
BIOMECHANICAL DETECTION (Invariant)
Correctness
criteria
3 (knee, trunk, plane)3 (knee, trunk, plane)3 (knee, trunk, plane)InvariantPhysiotherapist-validated [5]
Detection
accuracy
±3–5°±3–5°±3–5°InvariantConsistent measurement
Temporal
stability filter
2.0 s2.0 s2.0 sInvariantSame algorithm (Section 3.3)
Sampling
frequency
10 Hz10 Hz10 HzInvariantIdentical signal C ( t )
Note: Element cardinality excludes the universal countdown timer present in all conditions. Detection-layer parameters remained computationally invariant across all interface conditions.
Table 2. Participant demographics and baseline characteristics.
CharacteristicResult (N = 60)
Age (Years)
 Mean (SD)68.6 (2.5)
 Range65–74
Sex, n (%)
 Female39 (65.0%)
 Male21 (35.0%)
Education Level, n (%)
 Primary12 (20.0%)
 Secondary16 (26.7%)
 Diploma/Vocational12 (20.0%)
 Bachelor’s Degree12 (20.0%)
 Graduate Degree8 (13.3%)
Physical Performance, M (SD)
 30-Second Chair Stand (Repetitions)12.3 (2.0)
Note: All participants completed all experimental conditions with no withdrawals. Participants were randomly assigned to three counterbalanced sequence groups (n = 20 per group).
Table 3. NASA-TLX sub-scale results across density conditions.
Sub-ScaleMINMODRICHF(2, 118)pη2p
Mental29.21 (7.33)28.72 (8.18)45.40 (7.01)93.47<0.0010.613
Physical44.95 (6.58)43.80 (7.04)46.92 (8.30)2.890.060.047
Temporal34.18 (7.53)32.58 (6.43)49.91 (7.35)116.09<0.0010.663
Performance25.57 (6.50)22.30 (6.04)39.41 (6.92)106.26<0.0010.643
Effort40.71 (7.10)37.88 (6.36)53.70 (6.79)82.58<0.0010.583
Frustration28.68 (7.23)27.67 (6.69)49.51 (6.57)210.66<0.0010.781
Note: Values are M (SD). NASA-TLX sub-scales range from 0 to 100; higher scores indicate greater perceived workload demand. η2p = partial eta-squared. Pairwise comparisons used Bonferroni correction (α = 0.0167). = denotes no significant difference. Performance is reverse-scored on the NASA-TLX; higher values reflect poorer self-rated performance.
Table 4. Auxiliary measures across density conditions.
MeasureMINMODRICHF(2, 118)pη2p
Tracking lost frames8.98 (4.80)8.93 (4.90)9.85 (5.15)0.60.5480.01
Number of errors10.88 (3.92)11.62 (3.94)10.25 (4.07)1.810.1680.03
Note: Values are M (SD). η2p = partial eta-squared. Tracking lost frames = number of frames per 2 min trial in which the pose estimation pipeline failed to extract complete skeletal landmarks. Number of errors = count of error episodes per trial. All tests are one-way repeated-measures ANOVA with df = (2, 118). Both effects are non-significant (p > 0.05).
Table 5. Descriptive statistics and repeated-measures ANOVA results by density condition.
Outcome MeasureMINMODRICHF(2, 118)η2p
Exercise Correctness (%)72.88 (5.45)74.72 (6.50)66.13 (6.43)35.92 ***0.378
Error Correction Latency (s)3.87 (0.44)2.45 (0.33)5.18 (0.63)489.93 ***0.893
NASA-TLX Total Score42.03 (2.83)41.40 (2.90)51.01 (3.02)210.13 ***0.781
Note: Values are M (SD). *** p < 0.001. Bonferroni post hoc: RICH was significantly worse than both MIN and MOD on all three measures (all p < 0.001). MIN vs. MOD: non-significant for correctness (p = 0.216) and workload (p = 0.708); significant for latency (p < 0.001).
Table 6. Comparison of theoretical predictions and empirical results across density conditions.
FrameworkCore PredictionEmpirical ResultCorrespondence
Cognitive Load Theory (CLT)Monotonic degradation with increasing density; MIN should outperform MOD and RICHMIN ≈ MOD (p = 0.216); RICH collapses across all measuresPartial correspondence
direction of high-density impairment corrects, but equilibrium range unaccounted for
Motor Learning Theory (MLT)Richer feedback enhances corrective efficiency; RICH should outperform MIN and MODRICH produced lowest correctness and longest latencyLimited correspondence under high-density conditions—enrichment benefit appears bounded by capacity
Multiple Resource Theory (MRT)Performance disruption when concurrent demands exceed attentional capacityMarked performance decline under RICH across all three measuresStrong correspondence—but MRT does not specify the equilibrium range observed under moderate density
Note. The CRDE framework discussed in Section 6.2 draws together the partial correspondences of all three frameworks. “Correspondence” indicates the degree to which observed empirical patterns align with each framework’s core prediction; it does not represent statistical confirmation or refutation.
Disclaimer/Publisher’s Note: The statements, opinions and data contained in all publications are solely those of the individual author(s) and contributor(s) and not of MDPI and/or the editor(s). MDPI and/or the editor(s) disclaim responsibility for any injury to people or property resulting from any ideas, methods, instructions or products referred to in the content.