


Abstract
The rapid advancement of digital and mobile technologies has reshaped the educational landscape, fostering the adoption of interactive and learner-centered methodologies. Among these, immersive technologies such as Augmented Reality (AR), when coupled with next-generation wireless communication systems, hold the potential to revolutionize knowledge acquisition and student engagement. In this paper, we present the design and development of an AR-based educational tool specifically oriented to teaching concepts of fifth-generation (5G) mobile networks. The tool provides a real-time interactive visualization of 3D network components on mobile devices, enabling learners to explore 5G NSA/SA architectures in an accessible manner with real-world environments through mobile devices and their integrated cameras. The application was developed using Blender for 3D modeling and Unity as the rendering engine, incorporating the Vuforia SDK for marker-based AR tracking, and it was deployed on the Android operating system. Unlike traditional static approaches, the proposed solution enables learners to explore complex network architectures and key functionalities of 5G in an interactive and accessible manner. To assess its perceived effectiveness, quantitative surveys were conducted with both university and high school students, focusing on usability, engagement, and perceived learning outcomes. Results indicate that the tool is user-friendly, enhances motivation, and supports conceptual understanding as perceived by participants of 5G technologies. These findings highlight the potential of AR, supported by advanced wireless networks, as a pedagogical strategy to improve STEM education and foster technological literacy in the era of digital transformation.
1. Introduction
The fifth generation of mobile networks (5G) has generated high expectations worldwide due to its unprecedented capabilities in terms of data rates, spectrum efficiency, and service flexibility. Unlike fourth-generation (4G) networks, 5G is designed to achieve extremely high transmission and reception speeds, ultra-low latency, and massive device connectivity, enabling a broad spectrum of new applications and business models [1].
The digital transformation enabled by 5G, driven by the large-scale interconnection of electronic devices, has introduced ground-breaking technological innovations such as wider frequency bands, massive Multiple-Input Multiple-Output (MIMO) antenna arrays, beamforming, and advanced access technologies [2,3,4]. Consequently, 5G architectures have evolved into two primary deployment modes: Non-Standalone (NSA) and Standalone (SA). NSA facilitates early roll-outs by leveraging existing 4G infrastructures, thereby ensuring greater connection stability and a smoother transition, whereas SA provides fully independent 5G cores, enabling higher uplink and downlink speeds, lower transmission delays, and advanced capabilities such as network slicing, virtualization, and software-defined networking. These features open the door to high value-added services, including Virtual Reality (VR), Augmented Reality (AR), and immersive environments, firmly establishing 5G as a fundamental enabler of next-generation digital connectivity [5,6,7].
In parallel, AR technologies have advanced significantly, allowing the seamless overlay of digital information onto real-world environments through devices equipped with cameras and specialized software [7,8,9]. AR applications generate high-value multimedia content that has been increasingly applied in education due to their capacity to stimulate cognitive development, foster interaction, and improve student engagement [10,11,12]. By integrating real and virtual objects, AR enables learners to manipulate and explore complex information that can be added, combined, or transformed in real time [13,14,15].
AR has emerged as a promising technology in engineering education, enabling the visualization of complex physical phenomena and enhancing student engagement. Its application spans multiple domains, including laboratories, industrial training, and interactive learning environments. However, despite its demonstrated potential, AR adoption in university engineering curricula remains limited due to challenges related to integration, scalability, and pedagogical alignment [16].
Recent studies highlight both the advantages and challenges of AR in education, noting its potential to foster active learning, while also stressing the need for pedagogically sound scenarios tailored to specific domains [17,18]. According to Dewey’s experiential learning theory, meaningful education arises from associating prior and new knowledge in interactive environments, which is a principle that AR can effectively support by promoting active student participation rather than passive information reception [19,20,21]. Moreover, AR and mixed reality technologies have gained heightened importance during and after the COVID-19 pandemic, when global education systems faced abrupt transitions to online learning [22,23]. While these solutions offered continuity, technical disciplines requiring laboratory practices were particularly affected, highlighting the urgent need for interactive, practical, and remote educational tools.
Beyond general AR applications in education, recent research has emphasized the importance of integrating structured pedagogical and assessment mechanisms within AR-based learning environments. For instance, Ibáñez et al. [24] demonstrate that AR environments enable the design of interactive and performance-based assessment tasks, allowing the capture of learners’ problem-solving processes and providing richer evaluation data compared to traditional methods. Similarly, structured frameworks have been proposed to guide the development of AR-supported learning experiences, incorporating elements such as context, content, learner interaction, and evaluation mechanisms to ensure alignment with learning objectives [11]. These approaches highlight that the effectiveness of AR in education depends not only on visualization capabilities but also on the integration of pedagogical design and assessment strategies.
In this context, several AR-based applications have been developed to support immersive learning experiences in STEM education, including physics simulations, anatomy exploration, and architectural design [17,24]. A recent systematic review reports that AR in higher education is predominantly implemented within STEM disciplines—particularly in health and medical education—while its application in other engineering domains remains comparatively limited. Furthermore, most AR tools are described as teacher-centered and primarily focused on content delivery with fewer studies exploring interactive or exploratory learning approaches [25].
In engineering contexts, AR has also been widely adopted in industrial and technical domains to support complex system visualization, training, and operational guidance. Applications in areas such as manufacturing, maintenance, and assembly demonstrate that AR can enhance spatial understanding, reduce cognitive load, and improve task performance by providing contextual and real-time information [26]. These characteristics are particularly relevant for domains involving highly structured and interconnected systems, such as telecommunication networks, where traditional teaching methods often struggle to convey system-level interactions and architecture dynamics.
Despite these advances, a critical gap remains in the development of AR applications explicitly dedicated to the teaching of advanced communication technologies such as 5G. In this direction, the authors in [27] propose an AR-based practical course for teaching 5G SA systems, where students follow a step-by-step procedure to deploy and operate real network components within a laboratory environment. While this approach demonstrates the feasibility of integrating AR into hands-on training for advanced communication systems, it is primarily focused on procedural guidance and task execution rather than on conceptual understanding or an interactive exploration of network architectures. Moreover, it does not explicitly incorporate a structured pedagogical modeling framework or a clear mapping between AR interaction and learning outcomes.
Overall, current initiatives tend to emphasize either generic AR learning experiences or procedural training scenarios, but they do not adequately address the conceptual and structural complexity of modern mobile networks. As 5G deployment accelerates worldwide and begins to expand in regions such as Latin America, it becomes increasingly important to provide accessible tools that can bridge the knowledge gap between technical advancements and student understanding, preparing future professionals and society at large for the digital era.
To address this gap, this paper proposes the design and implementation of an Augmented Reality-based educational application that allows users to visualize, explore, and interact with the fundamental components and topologies of 5G networks. The system employs established AR development platforms (Blender for 3D modeling, Unity for rendering, and the Vuforia SDK for marker-based AR) and is deployed on Android devices to ensure portability and accessibility. By providing interactive visualization, the application supports students in identifying network elements, distinguishing between NSA and SA deployments, and understanding the functional building blocks of 5G infrastructures in a more intuitive manner. In addition, the tool is designed to enhance the teaching and learning process by fostering the active participation and deeper conceptual comprehension of next-generation mobile technologies.
With this in mind, and based on the aforementioned discussion, the main contributions of this work are outlined below:
- The design of a domain-specific AR learning environment tailored to the teaching of 5G NSA and SA architectures;
- The development of a structured pedagogical representation pipeline (abstraction, component selection, and progressive scene composition) to translate the 5G architectures into interactive AR learning objects;
- The facilitation of student understanding of 5G architectures, including NSA and SA deployments through structured interactive visualization;
- The promotion of interactive and exploratory learning experiences in engineering education, moving beyond predominantly teacher-centered AR implementations reported in the literature [25].
The remainder of this paper is organized as follows. Section 2 introduces the key technical foundations of 5G networks and explains the two main deployment modes: Non-Standalone (NSA) and Standalone (SA). Section 3 presents the system architecture and development workflow, covering (i) the NSA/SA reference topologies to be visualized in the RA application (Section 3.1), (ii) 3D asset creation in Blender (Section 3.2), (iii) rendering, animation, and scene composition in Unity (Section 3.3), and (iv) marker-based AR integration with Vuforia (Section 3.5). Section 5 reports the classroom evaluation protocol and survey outcomes at UDLA and UNACH, analyzing the usability, clarity, interactivity, and perceived educational value achieved with the AR tool. Finally, Section 6 summarizes key findings, discusses limitations, and outlines directions for future work.
2. Preliminaries and Contextualization
To properly frame the proposed application, this section introduces the key technical foundations of 5G networks and explains the two main deployment modes: Non-Standalone (NSA) and Standalone (SA). These concepts are essential to understanding the educational scenarios addressed in this paper.
2.1. 5G Networks: Key Technical Aspects
The 3rd Generation Partnership Project (3GPP) defines the standards governing 5G technology, ranging from communication protocols to network architectures [28,29]. Beyond enabling novel services, 5G introduces innovations such as wide frequency bands in the millimeter-wave spectrum (24–300 GHz), which provide large transmission capacity but also suffer from higher free-space path loss and diffraction effects [30,31,32,33]. To overcome these challenges, 5G relies on advanced antenna systems, including MIMO and beamforming, which improve spectral efficiency and spatial coverage [34]. These features form the technological backbone for both NSA and SA deployments and enable high-bandwidth, low-latency services such as robotics, immersive media, and AR applications.
2.2. Non-Standalone (NSA) Deployment
NSA deployment represents the initial phase of 5G adoption, strategically leveraging existing LTE infrastructure. In this hybrid configuration, the 5G New Radio (NR) is introduced, while the control plane remains anchored to the 4G LTE core. This allows operators to accelerate roll-out at lower cost, reusing antennas and base stations [35]. Users gain improved data rates and coverage compared to 4G, but performance is limited by reliance on the 4G core: latency remains higher, network slicing is restricted, and massive connectivity is constrained [36]. Thus, NSA is primarily suited for early deployments where stability and efficiency take priority over advanced features.
2.3. Standalone (SA) Deployment
SA deployment introduces a fully independent 5G network with both control and user planes operating on a native 5G Core (5GC). This architecture unlocks the full potential of 5G by supporting ultra-reliable low-latency communications (URLLC), massive machine-type communications (mMTC), and enhanced mobile broadband (eMBB). It also enables network slicing, virtualization, and Software-Defined Networking (SDN) for highly customized services [37]. Compared to NSA, SA achieves lower latency, higher throughput, and superior spectral efficiency, making it essential for advanced use cases such as autonomous driving, telemedicine, industrial automation, and large-scale IoT deployments [38]. Although it requires greater investment, SA represents the definitive configuration for long-term 5G innovation.
2.4. Pedagogical Relevance
From a pedagogical standpoint, understanding the clear distinction between NSA and SA is fundamental for students and professionals in telecommunications and related engineering fields. While NSA demonstrates the principle of technology convergence and adaptation of legacy systems, SA illustrates the paradigm shift toward fully virtualized, low-latency, and highly scalable networks. These concepts are often challenging to convey through traditional lecture-based methods, as they involve abstract architectural differences and intricate functional features. AR offers a robust solution to this educational bottleneck, providing learners with an immersive, visual, and interactive means to grasp the functional components and logical topologies of 5G networks. By integrating accurate representations of NSA and SA into an AR-based educational tool, this paper addresses a critical gap in teaching complex mobile communication concepts in an accessible and engaging manner.
2.5. Related Work on AR in Higher Education
Augmented Reality (AR) has been widely investigated as an educational technology in higher education, particularly within STEM-related disciplines. A recent systematic review [25] reports sustained growth in AR-supported instruction from 2000 to 2023 with engineering and health sciences representing the most common application domains. The review highlights that most of the AR implementations rely on scan-based interaction using mobile devices and are primarily designed to enhance visualization and content delivery.
Earlier reviews [39,40] similarly emphasize that AR applications frequently improve learner engagement and conceptual understanding, especially for spatially complex or abstract content. Moreover, these studies also indicate that many AR systems remain focused on visualization support rather than interactive and a deeper integration of specific domains or collaborative learning strategies.
In addition, several studies have highlighted the need to incorporate explicit assessment mechanisms within AR-based learning environments. For example, Ibáñez et al. [24] propose the integration of assessment tasks directly into AR interactions, enabling the evaluation of students’ performance through their manipulation of virtual and physical elements. This approach supports more authentic and performance-based evaluation compared to conventional assessment methods.
Furthermore, framework-based approaches have been proposed to structure AR learning experiences, emphasizing the alignment between content, context, and learner interaction. Mendoza et al. [11] introduce a framework for AR-supported learning that integrates content delivery, user interaction, and evaluation components, demonstrating improved learner motivation and engagement. These works suggest that the effectiveness of AR in education is strongly dependent on the integration of pedagogical design and evaluation strategies rather than visualization alone.
Within engineering education, AR has been applied to domains such as physics, civil engineering, architecture, and medical training, demonstrating its value for visualizing complex structures and processes that are difficult to convey through traditional lecture-based methods. To the best of our knowledge, AR-based educational applications explicitly dedicated to the comparative visualization of 5G Non-Standalone (NSA) and Standalone (SA) deployments remain limited. While telecommunications education commonly relies on simulations and virtual labs, the interactive and spatial representation of 5G components through mobile AR remains still underexplored [25,39,40].
In addition to higher education settings, Augmented Reality (AR) has also been increasingly investigated in adult training, vocational education, and professional upskilling contexts [41,42,43]. Recent evidence shows that AR is frequently adopted in task-oriented learning environments where learners must acquire procedural knowledge, operational skills, or equipment-handling competencies. For example, AR-based training has been reported in vocational maintenance scenarios, apprenticeship support, and engineering workshop activities, where the technology is used to provide contextual guidance, step-by-step assistance, and situated practice. Systematic evidence also indicates that AR has demonstrated value across education and training settings, including vocational and professional learning environments, particularly when practical interaction and experiential engagement are central to the instructional process [44,45,46].
However, these adult-training and professional-learning applications are predominantly focused on procedural execution, operational assistance, or skills rehearsal. In contrast, this paper is not designed as a task-guidance system for equipment operation or laboratory procedure execution. Instead, it addresses the conceptual and structural understanding of advanced telecommunication systems, specifically the comparative comprehension of 5G NSA and SA architectures. The proposed contribution therefore differs in three main ways: first, it emphasizes conceptual abstraction rather than procedural instruction; second, it employs a structured pedagogical modeling pipeline to transform complex network architectures into AR learning objects; and third, it supports a progressive learning pathway aligned with explicit learning outcomes, moving from component recognition to architecture-level comparison and message-flow interpretation.
While these approaches provide valuable insights into AR-based learning and assessment, their application to highly complex and abstract engineering systems—such as 5G network architectures—remains limited, particularly in terms of supporting conceptual understanding and system-level reasoning.
3. System Architecture and Development Tools
This section presents the technical foundation and workflow adopted for the design of the proposed AR-based educational tool. First, the NSA and SA topologies are described in detail, highlighting their nodes, interfaces, and protocols, as these architectures serve as the reference scenarios for the application. Next, the development environment is introduced, including Blender for the creation of 3D models, Unity for rendering and animation, and Vuforia for augmented reality integration. The combination of these elements provides a complete architecture that enables the interactive visualization of 5G concepts in an accessible and pedagogical manner.
3.1. Pedagogical Modeling of 5G Network Topologies for AR Visualization
To ensure coherence between the technical background and the objectives of the proposed Augmented Reality (AR) tool, this subsection does not aim to provide an exhaustive description of 5G standards. Instead, it identifies and defines the specific architectural elements that were selected, simplified, and modeled for interactive visualization within the educational application.
The purpose of modeling NSA and SA topologies in the AR environment is to enable students to understand the structural differences between hybrid and fully native 5G deployments through spatial and visual interaction. Therefore, only those components that are pedagogically relevant and visually represented in the application are described in detail.
To further formalize the proposed approach, the development of the AR learning environment can be interpreted as a pedagogical modeling pipeline consisting of four main stages:
- Component identification and pedagogical filtering, where relevant 5G elements are selected based on instructional value;
- Conceptual abstraction, where complex technical details are simplified to reduce cognitive load;
- Spatial and contextual mapping, where abstract components are translated into 3D objects embedded in realistic environments; and
- Interaction design, where user-driven exploration, architecture assembly, and dynamic message-flow visualization are defined.
This structured pipeline highlights that the contribution of this paper lies not only in visualization but also in the systematic transformation of complex engineering systems into interactive learning representations, which can be generalized to other domains.
3.1.1. Non-Standalone (NSA) Topology: Educational Representation
The Non-Standalone (NSA) architecture represents the initial phase of 5G deployment, where the 5G New Radio (NR) is introduced while maintaining control-plane anchoring in the legacy LTE infrastructure, as can be seen in the Figure 1. In this configuration, the 4G eNodeB (eNB) acts as the master node, and the 5G gNodeB (gNB) operates as a secondary node [36].
Figure 1.
The 5G NSA network topology.
From an educational perspective, the AR-based learning application models NSA with emphasis on three key conceptual aspects:
- Coexistence of 4G and 5G nodes, illustrating the transitional nature of NSA deployments.
- Control-plane anchoring in LTE, demonstrating that signaling remains dependent on the EPC.
- Separation of control and user planes represented through animated message flows.
While entities such as the MME and Serving Gateway (S-GW) are described conceptually to maintain architectural accuracy, they are not individually modeled at full protocol-level detail in order to avoid unnecessary cognitive overload for introductory learners. Instead, the AR visualization focuses on illustrating node interaction and signaling flow in an intuitive manner.
This approach allows students to visually observe how LTE infrastructure supports 5G expansion, reinforcing their understanding of backward compatibility and transitional deployment strategies.
3.1.2. Standalone (SA) Topology: Educational Representation
Figure 2 illustrates the 5G Standalone (SA) network topology. This architecture represents a fully independent 5G deployment, where both control and user planes operate on a native 5G Core (5GC). In this configuration, gNodeBs connect directly to the 5G Core via NG interfaces, enabling ultra-low latency, network slicing, and full virtualization capabilities [37].
Figure 2.
The 5G SA network topology.
Within the AR-based learning application, the SA topology is modeled to highlight four factors:
- Independence from LTE infrastructure, emphasizing the absence of 4G anchoring.
- Direct connection between gNodeBs and the 5G Core, illustrating architectural simplification.
- Logical separation of core functions, conceptually representing entities such as the Access and Mobility Management Function (AMF), Session Management Function (SMF), and User Plane Function (UPF).
- Control-plane and user-plane message routing visualized through dynamic packet animations.
Although the 5G Core comprises multiple functional entities defined by 3GPP, the AR-based learning application represents these components at a conceptual level rather than full specification depth. This decision prioritizes conceptual clarity and comparative understanding over exhaustive protocol-level detail.
Through a side-by-side exploration of NSA and SA scenarios, students can visually compare the following:
- Hybrid versus native deployment structures.
- LTE anchoring versus full 5G independence.
- Architectural implications for latency and service flexibility.
By integrating these simplified yet structurally accurate models into the AR environment, the application bridges abstract architectural diagrams with tangible, three-dimensional representations. This pedagogical modeling ensures that technical fidelity is preserved while maintaining accessibility for undergraduate learners [38].
3.2. Design Methodology for AR Based Representation of 5G Components
The development of the Augmented Reality (AR) educational tool followed a structured methodology aimed at translating complex 5G architectural concepts into pedagogically meaningful digital representations. Rather than focusing on describing the capabilities of the software tools used, this section presents the conceptual approach adopted to ensure consistency between technical fidelity, cognitive accessibility, and visual interactivity.
The design approach was guided by three main principles:
- Pedagogical relevance—only those 5G components essential for understanding NSA and SA differences were modeled.
- Conceptual abstraction—technical elements were simplified to emphasize structural relationships instead of protocol-level details.
- Contextual realism—digital objects were embedded within urban deployment scenarios to bridge theoretical concepts and real-world infrastructure.
Finally, the implementation workflow combined three main technological environments:
- Blender was used for the 3D modeling of infrastructure components.
- Unity served as the integration and scene composition platform.
- Vuforia was employed for marker-based tracking and AR anchoring.
Each tool was selected according to its functional role within the overall pedagogical modeling pipeline. This structured approach ensures that the AR environment functions as an educational representation system rather than a purely technical visualization.
3.2.1. Conceptual Abstraction and Component Selection
Before creating any digital asset, each 5G architectural element was analyzed from a pedagogical perspective to determine its instructional value. The objective was not to reproduce the entire 3GPP specification but to select components that clearly illustrate the structural and functional differences between NSA and SA deployments.
The selected core components include 4G eNodeB (for LTE anchoring in NSA), 5G gNodeB (for NR access in both NSA and SA), data center, core infrastructure, small cells, and urban deployment elements (buildings, poles, vehicles). These elements were chosen because they allow students to visually distinguish the following:
- Hybrid NSA coexistence of 4G and 5G nodes;
- Fully independent SA architecture;
- Control-plane anchoring vs. native 5G core operation;
- Infrastructure densification in urban environments.
Although additional internal functions such as MME, AMF, SMF, and UPF are conceptually described in Section 3.1, their visualization was intentionally simplified to prevent cognitive overload and maintain clarity for undergraduate learners.
3.2.2. 3D Asset Modeling Using Blender
Blender is a cross-platform Free and Open-Source Software (FOSS) used for the creation and animation of three-dimensional (3D) objects (https://www.blender.org/, accessed on 2 March 2026). In this paper, Blender’s features were used to design realistic digital representations of infrastructure elements commonly found in physical 5G deployment environments. This approach supports the pedagogical objective of translating abstract network concepts into tangible visual elements within Augmented Reality (AR) for learning scenarios.
Through 3D modeling, elements such as streetlight poles, antennas, buildings, and urban infrastructure were recreated to simulate real-world telecommunication environments. These elements help students to visualize how 5G network components (macro base stations in NSA, gNBs in SA, and small cells) are physically integrated into urban infrastructure under both Non-Standalone (NSA) and Standalone (SA) deployment models. For instance, streetlight poles can serve as hosting structures for small cells or mmWave antennas, which are critical for 5G densification.
The modeling process consists of creating basic geometric structures and applying textures and lighting properties to produce visually coherent objects that resemble real infrastructure. These assets are subsequently imported into Unity and Vuforia, where they are integrated into AR scenes representing NSA and SA deployment scenarios. In NSA mode, the models illustrate the coexistence of 4G eNodeBs and 5G gNodeBs, while in SA mode, they emphasize fully 5G-based deployments.
The modeled assets were not arbitrary; they were selected to represent key elements of real-world 5G environments. These include antennas, data centers, urban spaces, and supporting infrastructure, which together enable the visualization of heterogeneous network components within realistic scenarios.
Figure 3 shows several of the 3D designed models. For example, a car (a) and a park (b) represent dynamic urban elements where mobile users and IoT devices generate traffic. The 4G antenna (c) is included to illustrate NSA operation, where LTE eNodeBs support control-plane signaling, while the 5G antenna (e) represents gNodeBs used in both NSA and SA cases to deliver high data rates. The Data Center (d) highlights the importance of cloud infrastructure for network slicing and edge computing, and buildings (f) provide realistic urban density conditions, which are critical for small-cell deployment.
Figure 3.
Blender software screenshot of several designed 3D objects. (a) Car. (b) Park. (c) 4G antenna. (d) Data center. (e) 5G antenna. (f) Buildings.
Together, these objects allow the AR-based learning application to present coherent and realistic visualizations of NSA and SA 5G topologies, showing how heterogeneous infrastructure components interact within real-world environments. This contextual embedding supports experiential learning by allowing students to associate theoretical network diagrams with tangible urban infrastructure.
3.3. Scene Composition and Interaction Design in Unity
Unity (https://unity.com/, accessed on 2 March 2026) is a cross-platform development environment widely used for immersive applications such as Augmented Reality (AR). For this paper, Unity serves as the main platform for integrating the previously developed 3D models into interactive educational scenarios. Its compatibility with modeling tools enables the incorporation of infrastructure elements such as antennas, buildings, vehicles, and urban fixtures into simulated 5G deployment environments.
In this paper, the previous 3D modeled objects are rendered into AR scenes that represent 5G deployment environments under NSA and SA topologies. The AR environment was designed to support progressive exploration. In NSA scenarios, imported objects help visualize how existing 4G infrastructure (e.g., eNodeBs) coexists with new 5G gNodeBs, while in SA scenarios, Unity is used to simulate deployments relying exclusively on 5G base stations and small cells.
The light pole model was enhanced with a spotlight component to emulate real-world illumination and illustrate key 5G concepts.
Similarly, each of the 3D objects previously modeled in Blender were imported into Unity to build complete network scenarios. Once integrated, Unity provides the capability to animate the flow of data packets across the infrastructure, visually representing traffic exchange within both NSA and SA architectures [47]. These animations are based on frame-by-frame updates of object positions, allowing users to observe how data traverse antennas, data centers, and user devices in real time. This feature enhances the pedagogical value of the AR-based learning application by linking abstract networking concepts with interactive visualizations.
Figure 4 illustrates the main elements of the simulated environment. Subfigure (a) shows a 4G antenna array, which is fundamental for NSA operation where the LTE eNodeB provides control-plane signaling. Subfigure (b) presents the 5G antenna array (gNodeB), which is responsible for the user-plane connection in NSA and the sole access point in SA deployments. Subfigure (c) depicts the data center, highlighting the importance of cloud and edge infrastructure for processing and network slicing in 5G. Subfigure (d) shows the assembled NSA topology, where 4G and 5G nodes coexist to ensure backward compatibility, while (e) displays the SA topology, in which only 5G nodes operate, reflecting a fully standalone deployment.
Figure 4.
Unity software screenshot. (a) 4G antenna array. (b) 5G antenna array. (c) Data center. (d) NSA topology. (e) SA topology.
Through these visualizations, the AR-based learning application enables students to directly compare NSA and SA architectures, identify their differences, and understand how heterogeneous infrastructure components interact in real deployment scenarios. The interaction logic was structured to allow for the visualization of individual network components, the progressive assembly of architectures, the activation of animated control-plane and user-plane flows, and a comparative exploration between NSA and SA scenarios.
3.4. Marker-Based Anchoring and AR Integration Using Vuforia
Vuforia is an AR software development kit designed used to create mobile AR applications (https://developer.vuforia.com/, accessed on 2 March 2026). In this paper, Vuforia is employed to generate QR code-based markers that serve as anchors for the 3D models representing the network infrastructure. Using the designed application, once the learner scans the QR code with a mobile device, a corresponding virtual object appears, such as antennas, data centers, or user equipment. This allows the AR-based learning application to map virtual elements into real-world contexts, facilitating the understanding of NSA and SA deployment scenarios.
Marker images are uploaded to the Vuforia platform, which generates a database later integrated in the AR application. Figure 5 shows an example of a QR pointer associated with the 4G antenna model, enabling students to explore how legacy LTE infrastructure supports NSA deployments alongside 5G gNodeBs.
Figure 5.
Vuforia 4G antenna pointer based on QR code.
Within the AR environment, each marker is linked to a corresponding 3D object, ensuring that when the marker is detected by the mobile device, the appropriate component is rendered. This mechanism enables the visualization of NSA and SA topologies through a dynamic association between QR-based physical markers and their virtual infrastructure elements.
This rendering mechanism maps virtual objects onto a real surface through a mobile device interface. Within the proposed framework, these objects are later combined with 4G and 5G antennas, data centers, and buildings to construct complete NSA and SA topologies. In this way, the AR-based learning application serves as an educational tool, helping students connect virtual models with real-world 5G deployment scenarios. By assigning independent markers, the system guarantees accurate and non-overlapping visualization between objects, which can later be combined into complete NSA and SA scenarios.
Figure 6 illustrates this process as observed from a smartphone. The upper images show the activation of individual objects—a 4G/5G antenna array and a data center—each anchored to its respective QR marker. The lower images present more complex AR scenes, where urban buildings and streets are combined with network elements to simulate full deployment environments. These interactive visualizations allow students to explore the heterogeneous infrastructure that supports both NSA and SA topologies, reinforcing the conceptual understanding of 5G architectures.
Figure 6.
Smartphone view of the AR-based learning application displaying network components (antennas, data center) and integrated NSA/SA topologies.
In other words, these figures show the hierarchical organization of AR elements and the projection of digital infrastructure onto real surfaces. This modular anchoring approach prevents object overlap and ensures consistent visualization across different devices.
Rather than merely functioning as technical triggers, these markers serve an instructional role:
- They allow incremental exploration.
- They reinforce the relationship between physical infrastructure and digital representation.
- They support the structured classroom activities described in Section 4.
Finally, within the application, it is possible to control navigation in different scenes. Through this interface, users can intuitively access the main modules of the learning tool, including 5G network elements, NSA and SA architectures, technical vocabulary, and credits, as shown in Figure 7. The main menu organizes these modules into four submenus, offering a structured pathway to explore the educational content. This design ensures that students can easily switch between conceptual explanations, AR visualizations, and reference material, thereby reinforcing the interactive and didactic purpose of the application. The user interface is presented in Spanish, as the application was developed primarily for Latin American students.
Figure 7.
(a) Application main menu screenshot. (b) Application submenu screenshot to display 5G network elements. (Translation of Figure 7a: Title: “Learning Tool—5G Mobile Networks”. Buttons: “5G Network Elements”, “5G Architectures”, “Vocabulary”, “Credits”. Instructions: “Requirements for using the application: Click the following button to access the lab guide. Click the following button to access the AR pointers.” Footer message: “Ready! Have fun and learn about 5G mobile networks.”).
As shown in Figure 7a, the first two options of the main menu provide access to the AR modules, where users can interact with virtual objects and visualize NSA and SA topologies. The third option contains a glossary with the meanings of the main technical terms related to the application, reinforcing the educational purpose of the tool. Finally, the fourth option presents the project credits and contributors.
Figure 7b illustrates the submenu dedicated to 5G network elements. It presents different categories of infrastructure, including data networks, data centers, 4G antennas, 5G antennas, and small cells, which are each represented with an interactive icon. When selecting an element, descriptive information is displayed—in this case, the role of 4G antennas, which highlights their capacity to support up to 150 Mbps and their importance in enabling services such as video streaming, music, and online gaming. This submenu allows students to link technical specifications with visual representations, facilitating a clearer understanding of the different components that make up NSA and SA deployments in 5G. (Translation of Figure 7: Title: “5G Network Elements”. Subtitle: “4G Antennas”. Text: “The fourth generation, successor to 2G and 3G, is characterized by its ability to reach speeds of 150 Mbps on mobile devices, unattainable for 3G technology. It enables complex services such as video streaming, music, and online gaming to be used on mobile networks.”). This structured navigation reinforces the pedagogical objective of transitioning from isolated components to full architectural comprehension.
A video presentation demonstrating the application and its features, including augmented reality examples, is provided at the following link: https://1drv.ms/f/c/b82fe927f91b10ca/EtM7lHApM81FtuD7666W5YABKF_f7NuNU2v_N2aDJxAVNg?e=yqJ2zx (accessed on 2 March 2026).
3.5. User Interaction Workflow
To clarify how users engage with the AR-based learning application, this subsection describes the interaction process from installation to architectural exploration.
The interaction sequence follows five main stages:
- 1. Application InitializationUpon launching the application, users access the main menu interface (see Figure 7), where options are organized into 5G elements, architecture modes (NSA and SA), glossary, and credits. This modular interface ensures structured navigation.
- 2. Marker Scanning and Object ActivationUsers select a specific component and scan its associated QR marker (Figure 5). Once the marker is recognized, the corresponding 3D model is projected onto the real-world surface.
- 3. Object ManipulationAfter projection, users can physically move around the object to observe it from different angles, adjust viewing distance for detailed inspection, and explore spatial relationships between components when multiple markers are activated.
- 4. Architecture AssemblyBy scanning multiple markers sequentially, users progressively construct NSA or SA architectures (Figure 4). This modular activation enables incremental learning and structural comparison.
- 5. Dynamic Message Flow VisualizationWhen architecture mode is activated, animated packet flows illustrate control-plane and user-plane communication (Figure 6). This dynamic visualization transforms static network diagrams into operational processes.
This structured interaction workflow allows users to transition from isolated component recognition to full architectural comprehension, reinforcing conceptual understanding through active exploration.
3.6. Implementation and Runtime Characteristics
To improve transparency and reproducibility, this subsection reports baseline deployment and runtime characteristics observed during the classroom sessions. The AR-based learning application was installed and executed on Android smartphones from commonly available device families, including Samsung, Xiaomi, and Redmi devices, running Android 14 and 15. The application package (APK) size is approximately 580 MB, which may affect download and installation time under limited connectivity conditions, as also reflected in the usability-related survey responses.
During the guided laboratory sessions, the application operated reliably on the tested devices under typical classroom lighting conditions. In particular, QR-marker recognition was consistently achieved, and the AR scenes, including 3D objects and animations, were rendered in real time during normal instructional use. These observations should be interpreted as baseline practical deployment characteristics in a real classroom environment rather than as the result of a formal benchmarking campaign.
A comprehensive technical performance evaluation, including objective frame-rate measurements, latency analysis, memory consumption, battery usage, and compatibility testing across a wider range of device models, is beyond the scope of this classroom-based educational pilot and is therefore identified as an important direction for future work.
4. System Usage Model in Educational Environments
4.1. Educational Scenario and Student Role
The proposed AR-based learning application was designed for integration into undergraduate courses in Mobile Communications or Wireless Networks within Telecommunications Engineering. This section explicitly describes how the system is used in the classroom, clearly differentiating the pedagogical model from the technical development process presented in Section 3.
The application is typically implemented as a guided laboratory session of approximately one hour under the supervision of the instructor. Throughout the semester, the system is used three times, following a structured pedagogical progression.
Beyond its role as a usage description, the proposed educational model can be interpreted as a structured pedagogical interaction framework. The AR-based learning process is organized into progressive stages that guide students from initial component recognition toward higher-level architectural understanding. This framework integrates (i) a guided exploration of individual network elements, (ii) an analytical association between physical infrastructure and logical functions, and (iii) a comparative and dynamic analysis of complete NSA and SA architectures.
This staged interaction design promotes active knowledge construction through incremental engagement rather than passive content consumption. Accordingly, this section not only describes how the system is used but also formalizes how AR-based interaction is pedagogically structured to support the understanding, analysis, and application of complex 5G concepts.
4.1.1. First Session: Installation and Familiarization
During the first session, students download and install the application on their Android mobile devices. The instructor explains the tool’s general operation. Students learn to use QR codes to activate 3D models. An initial exploration of the network’s individual components (4G antennas, 5G antennas, small cells, data centers, etc.) is conducted. At this stage, the student’s role is primarily exploratory: observing and manipulating 3D objects while associating each physical component with its function within the network.
4.1.2. Second Session: Device and Infrastructure Analysis
In the second session, each network device is analyzed in greater detail. Students examine the basic technical characteristics of each component. The function of each node within a mobile network architecture is analyzed. Guided questions connect the physical equipment with the logical functions (control plane, user plane, core network). Through AR visualization, students gain a better understanding of how the real infrastructure is integrated into an urban deployment scenario and how each element fulfills a specific network function.
4.1.3. Third Session: NSA and SA Architecture Analysis
In the third session, non-standalone (NSA) and standalone (SA) 5G architectures are presented. Students activate complete network scenarios in augmented reality (AR). Animated packet flows illustrate message transmission and traffic exchange. Students analyze how and where control and data messages travel. The structural differences between NSA and SA are compared. At this stage, students move beyond isolated components and explore complete network architectures. This allows them to identify node interaction mechanisms, understand 4G anchoring in NSA versus the native operation of the 5G core in SA, and dynamically visualize message routing and signaling separation. The AR-based learning application facilitates the transition from abstract two-dimensional diagrams to spatial and interactive representations, significantly improving conceptual clarity.
4.1.4. Instructor Role
The instructor acts as a facilitator through introducing theoretical concepts, proposing guiding questions, encouraging comparisons between architectural scenarios, and leading post-activity discussions. The AR-based learning application does not replace theoretical instruction but rather complements it by reinforcing the principles of experiential learning.
4.1.5. Learning Outcomes and Pedagogical Alignment
The AR-based learning application was designed to support measurable learning outcomes aligned with the course objectives. After completing the three structured sessions described above, students are expected to be able to achieve the following:
- Identify the main physical components of a 5G network (4G antennas, gNodeB, small cells, core network) within an urban deployment scenario.
- Describe the functional role of each component within NSA and SA architectures.
- Differentiate structurally between Non-Standalone and Standalone deployments.
- Explain the path of control-plane and user-plane messages in both architectures.
- Relate physical infrastructure to logical network functions.
These outcomes align with intermediate levels of Bloom’s Taxonomy, particularly understanding, application, and analysis. The tool does not replace formal course assessment; rather, it provides an interactive environment that strengthens conceptual understanding prior to written examinations or technical evaluations.
In addition to this alignment, the AR-based activities are explicitly designed to support progressive cognitive engagement. During the first session, students operate at the remembering and understanding levels by identifying and recognizing network components through visual interaction. In the second session, the association between physical infrastructure and logical network functions promotes understanding and application. Finally, in the third session, the exploration of NSA and SA architectures, together with the visualization of control- and user-plane message flows, supports higher cognitive processes such as analysis and conceptual differentiation.
This progression demonstrates that the AR environment is not limited to visualization but rather functions as a structured learning mechanism that facilitates the transition from basic recognition to a deeper analytical understanding of complex communication systems. Although this study does not include a controlled pre/post evaluation, this explicit mapping between AR-based activities and cognitive processes provides a structured foundation for a future objective assessment of learning outcomes.
Figure 8 illustrates the structured pedagogical workflow followed during implementation. The process begins with the theoretical introduction and setup, progresses through component exploration and architectural comparison, and concludes with a reflective discussion and a structured evaluation based on the Technology Acceptance Model (TAM), which is a widely validated framework in educational technology research.
Figure 8.
Methodological flowchart of the educational intervention.
This design reinforces that the AR-based learning application functions not only as a visualization system but also as a pedagogically structured intervention that supports progressive learning and conceptual consolidation.
To further operationalize the instructional design, Table 1 maps each AR-based learning activity performed across the three sessions to the corresponding learning outcomes (LO1–LO5) and the targeted cognitive levels according to Bloom’s taxonomy. This alignment clarifies how the AR interaction supports a progressive learning pathway from component identification to architecture comparison and message-flow tracing.
Table 1.
Alignment between AR-based learning activities, learning outcomes (LOs), and Bloom’s taxonomy levels.
Formative checks. During each guided laboratory session, the instructor applies brief formative checks based on the lab guide to monitor understanding in real time. These checks include (i) the correct identification of the activated network components, (ii) an accurate association between physical infrastructure and logical functions (control plane, user plane, core network), and (iii) the correct differentiation between NSA and SA architectures through message-flow tracing using the animated visualization.
4.2. System Usage for Academic Outreach
In addition to the formal implementation of courses, the tool was also designed as an academic outreach resource for telecommunications programs. During institutional events, academic fairs, or visits to high schools, the application functions as an interactive demonstrator. Visitors scan QR codes, after which 3D antennas, data centers, and complete network architectures are projected in AR. The operation of mobile networks is explained in an intuitive and accessible way. This application has two main objectives: to reduce the gap between complex technical concepts and the understanding of the general public and to motivate prospective students to pursue studies in mobile communications. The three-dimensional visualization allows people without prior knowledge to understand how 5G networks are physically deployed and how they are evolving from 4G to advanced autonomous architectures.
5. Results and Discussion
5.1. Evaluation Methodology
The proposed AR-based learning application was evaluated in academic environments at two Ecuadorian universities. Specifically, it was tested in three Telecommunication Engineering courses at the Universidad de Las Américas (UDLA), in Quito, Ecuador, and in two courses at the Universidad Nacional de Chimborazo (UNACH), in Riobamba, Ecuador. The evaluation process consisted of an anonymous survey, which was carried out under a simple informed consent protocol. The consent clarified that the collected data would be used exclusively for academic purposes and to evaluate the perceived effectiveness of the application as a pedagogical tool to support the comprehension of complex concepts in 5G networks.
5.1.1. Experimental Procedure
The experimental validation of the proposed augmented reality (AR) application was conducted within undergraduate Telecommunications Engineering courses from the two universities, which are focused on mobile network architectures. The study took place in a controlled laboratory classroom environment as part of the regular academic curriculum.
The intervention consisted of three structured sessions of approximately 60 min each, which were distributed over a three-week period. Each session followed a standardized instructional sequence to ensure methodological consistency: a theoretical recap of 5G NSA and SA architectures delivered by the instructor; guided interaction with the AR-based learning application; collaborative discussion and analytical reflection.
During the AR interaction phase, students were required to complete predefined tasks, including the following: the identification and visualization of 5G core and radio access network components; the modular assembly of NSA and SA deployment architectures using AR markers; the exploration of signaling and data flow paths across network elements; and a comparative analysis of architectural differences between deployment modes.
Instructor guidance was standardized across sessions to maintain consistency while allowing controlled exploratory interaction.
Although the AR-based learning application was pedagogically aligned with defined learning outcomes, as described in Section 4.1.5, the present empirical study focused primarily on usability and technology acceptance evaluation. The impact on measurable learning gains was not assessed through a controlled pre- and post-test experimental design. Instead, the objective was to examine the feasibility, perceived educational value, and integration within the instructional process, establishing a foundation for future controlled learning-effectiveness studies.
Data collection was conducted immediately after the final session through a structured questionnaire grounded in the Technology Acceptance Model (TAM). The instrument included Likert-scale items measuring Perceived Ease of Use, Perceived Usefulness, Behavioral Intention to Use, and Perceived Educational Value.
This structured procedure ensures reproducibility and provides a transparent framework for future controlled experimental studies.
5.1.2. Participants and Study Context
A total of 41 undergraduate students participated in the in-class evaluation, and all of them completed the questionnaire immediately after the session (response rate: 100%, 41/41). The evaluation was conducted in a guided laboratory setting (≈1 h), and it was aligned with the usage model described in Section 4, where students progressively explored network components and compared NSA vs. SA architectures across three sessions during the semester. The questionnaire did not collect gender information, as the primary objective was to evaluate the AR-based learning application itself (i.e., its usability and perceived educational value). The participants were undergraduate students typically enrolled in the sixth or seventh semester with an approximate age range of 20–22 years.
This paper is intended to be a pilot classroom evaluation within a single group of courses from the two universities mentioned above; future work will extend the validation to multiple cohorts and institutions.
5.2. Questionnaire Design
The questionnaire used to evaluate the proposed AR-based learning application was initially designed to assess the usability, educational usefulness, and user acceptance in academic environments. Following reviewers’ suggestions, the questionnaire was analyzed in relation to constructs from the Technology Acceptance Model (TAM), which is a widely adopted framework for evaluating user acceptance of technological systems [48]. This alignment reveals that the survey items correspond to key TAM constructs, including Perceived Ease of Use (PEOU), Perceived Usefulness (PU), and Behavioral Intention (BI), thereby enhancing the interpretability of results within an established theoretical framework.
Based on this alignment, the survey questions were grouped according to TAM constructs as follows:
- Perceived Ease of Use (PEOU): Questions 1, 2, and 4 evaluate the simplicity of the application download and installation, the ease of handling the application interface, and the ease of interaction with AR-based pointers.
- Perceived Usefulness (PU): Questions 3, 5, 6, 9, and 10 assess the clarity of educational information, the application’s interactivity, and the perceived effectiveness of instructional explanations.
- Behavioral Intention to Use (BI): Questions 7 and 8 measure students’ willingness to reuse and recommend the application as a learning tool.
- Qualitative Feedback: Question 11 collected open-ended responses that allowed participants to suggest improvements and provide additional insights regarding their experience.
The survey items and their complete mapping to their respective TAM constructs are detailed in Table 2. The survey consisted of multiple items rated using a five-point Likert scale with explicitly defined verbal anchors: 1 = Very Poor, 2 = Poor, 3 = Acceptable, 4 = Good, and 5 = Very Good.
Table 2.
Questionnaire items for user acceptance evaluation categorized by Technology Acceptance Model (TAM) constructs and complemented with qualitative feedback.
5.3. Results and Discussion
This section presents the results obtained from each questionnaire item, which were followed by an interpretation of the findings in relation to user acceptance and perceived educational value. The results are grouped according to the constructs of the Technology Acceptance Model (TAM): namely, Perceived Ease of Use (PEOU), Perceived Usefulness (PU), and Behavioral Intention to Use (BI). Table 3 reports the corresponding descriptive statistics, while Figure 9 summarizes the response distributions for all survey items and illustrates the patterns underlying the reported means, particularly highlighting the greater variability observed in PEOU-related items compared to the consistently high ratings in PU.
Table 3.
Distribution of responses, means, standard deviation and TAM construct indicators (VP = Very Poor, P = Poor, A = Acceptable, G = Good, VG = Very Good).
Figure 9.
Distribution of survey responses for Items Q1 to Q10 across a 5-point Likert scale (Very Poor to Very Good).
All statistical analyses were conducted using responses from participants. The descriptive statistics for each Technology Acceptance Model (TAM) construct are summarized below. For each indicator, the mean (M), standard deviation (), and 95% confidence intervals () were calculated, following the methodology described by Field [49]. Confidence intervals were determined using the t-distribution to account for the sample size.
5.3.1. Descriptive Results and TAM Indicators
- Perceived Ease of Use (PEOU): Results for Perceived Ease of Use (Q1, Q2, Q4) indicate a moderate overall level of usability (, , ). While the internal interface design was highly rated (Q2: M = 4.37, = 0.77), significant barriers were identified during the deployment phase. Specifically, participants reported difficulties with download and installation (Q1: M = 2.44, = 1.40) and AR marker handling (Q4: M = 2.71, = 1.33). These results indicate that although the internal design and navigation are perceived as easy to use, the overall user experience is influenced by external factors such as application size, connectivity, and device camera quality under real deployment conditions. These limitations are primarily associated with practical constraints, including application size affecting download performance and device-related factors such as camera autofocus during QR-code scanning.
- Perceived Usefulness (PU): Results for Perceived Usefulness (Q3, Q5, Q6, Q9, Q10) indicate a strong positive evaluation of the application as a learning tool (, , ). A large majority of students rated the clarity of the information as high (Q3: M = 4.20, = 0.75) and perceived the application as highly interactive (Q5: M = 4.34, = 0.76). Furthermore, the presenters’ explanations (Q6: M = 4.39, = 0.70) received positive evaluations, reinforcing the role of the instructional context in supporting the AR experience. This indicates that the AR-based learning application complements guided instruction rather than replacing it, supporting its integration into structured learning environments.In terms of pedagogical impact, students reported that the tool was effective for understanding 5G network concepts (Q9: M = 4.24, = 0.70) with all participants agreeing that the AR methodology facilitated their comprehension (Q10: M = 5.00, = 0.00). Overall, these results highlight the high perceived educational value of the AR-based approach, particularly for visualizing complex and abstract network architectures.
- Behavioral Intention (BI): Results for Behavioral Intention (Q7, Q8) reflect a moderate-to-positive inclination toward future use and recommendation (M = 3.52, = 1.16, ). Despite the technical installation challenges identified in the PEOU section, a majority of students expressed a willingness to reuse the application (Q7: M = 3.54, = 1.16) and a relatively high probability of sharing it with peers (Q8: M = 3.51, = 1.19).
In addition to the quantitative results, qualitative feedback (Q11) further supported the findings, highlighting practical deployment limitations related to application size, QR-code usability, watermark removal from pointers, and interface elements such as background contrast and control placement optimization. These observations are consistent with the issues identified in the PEOU analysis and reflect real deployment constraints. Several of these aspects were addressed during subsequent refinements of the application, confirming the iterative and user-informed nature of the development process.
5.3.2. Reliability Analysis
To validate the internal consistency of the questionnaire, Cronbach’s alpha () was calculated for each TAM construct. As shown in Table 4, the alpha coefficients for Perceived Ease of Use (PEOU) and Behavioral Intention (BI) were 0.91 and 0.89, respectively, both exceeding the widely accepted threshold of 0.70 [50]. For the Perceived Usefulness (PU) construct, Item Q10 was excluded from the reliability calculation because it exhibited zero variance ( = 0.0), as all participants provided the maximum rating. This exclusion is a standard psychometric procedure when items lack the variability necessary for calculating internal consistency coefficients [50]. After excluding Q10, the remaining items for PU (Q3, Q5, Q6, Q9) yielded an alpha of 0.94. These results confirm that the scales used in this study are reliable and internally consistent for measuring the intended constructs.
Table 4.
Reliability analysis of the TAM constructs based on Cronbach’s alpha.
5.3.3. Relationship Between TAM Constructs
The interactions between the TAM constructs were evaluated using Spearman’s rank correlation analysis, as summarized in Table 5. This non-parametric approach was selected due to the ordinal nature of the Likert scale and the non-normal distribution of responses (e.g., ceiling effect in Q10) [49]. Composite scores for each construct were computed by averaging the corresponding items within their respective groups [50].
Table 5.
Spearman’s rank correlation matrix between TAM constructs.
The results reveal strong and highly significant positive correlations across all TAM constructs ( for all relationships). A strong positive relationship was found between Perceived Ease of Use (PEOU) and Perceived Usefulness (PU) (), suggesting that the technical usability of the AR interface directly supported the students’ ability to perceive the educational value of the 5G network content. Furthermore, both PEOU and PU showed similarly strong correlations with Behavioral Intention (BI) (), indicating that the students’ willingness to adopt and recommend the AR-based learning application is equally driven by its ease of use and its perceived pedagogical effectiveness.
These relationships are consistent with the theoretical assumptions of the Technology Acceptance Model (TAM), where Perceived Ease of Use (PEOU) is expected to influence Perceived Usefulness (PU), and both constructs contribute to Behavioral Intention to Use [48]. While no causal inference is established due to the cross-sectional and observational design, the statistically significant correlations provide empirical support for the internal coherence of the evaluation framework. These findings should be interpreted within the context of a classroom-based pilot study conducted under real instructional conditions. The evaluation reflects students’ perceptions after guided interaction with the AR-based learning application as part of regular coursework rather than controlled experimental measurements. Therefore, the results provide insight into the feasibility, acceptance, and perceived educational value of the application, establishing a basis for future studies with more rigorous experimental designs.
5.4. Future Improvements and Technological Extensions
While the proposed AR-based learning tool demonstrated high levels of perceived usefulness and educational value, the experimental deployment also revealed several interface-level limitations that open opportunities for technological improvement.
One of the main constraints identified during the classroom sessions is the reliance on marker-based AR, specifically QR-code anchoring. Although this approach ensures stability, accessibility, and low computational requirements, it introduces certain usability challenges. As reported in the evaluation results, some students experienced difficulties related to camera autofocus, marker detection conditions, and interaction fluidity. These limitations are not intrinsic to the pedagogical design but rather to the underlying AR tracking method.
In this context, an important direction for system enhancement involves the adoption of marker-less AR techniques. Unlike marker-based approaches, marker-less AR leverages real-time environment understanding, plane detection, and spatial mapping to anchor virtual objects directly onto physical surfaces without requiring predefined visual markers. This paradigm can significantly improve the user experience by enabling more natural interaction, reducing dependency on printed materials, and enhancing immersion.
However, the transition toward marker-less AR also introduces new technical challenges. These include increased computational demands, variability in performance across mobile devices, sensitivity to environmental conditions, and potential instability in object anchoring. Therefore, while marker-less AR represents a promising evolution of the current system, its integration must be carefully evaluated to balance usability, accessibility, and deployment feasibility in educational contexts.
From a pedagogical perspective, the integration of more advanced AR interaction paradigms could further strengthen experiential learning by allowing students to interact more freely with virtual network components in real-world scenarios. This would support deeper cognitive engagement and facilitate a more intuitive understanding of complex 5G architectures.
Overall, this discussion highlights that the current marker-based implementation represents a deliberate design trade-off between robustness and accessibility. Future iterations of the system may progressively incorporate marker-less AR and hybrid interaction models to enhance usability while maintaining the perceived pedagogical effectiveness observed in this paper.
6. Conclusions
In this paper, we developed an Augmented Reality (AR)-based learning application to support students’ understanding of 5G mobile network architectures. The proposed application enables the interactive visualization of key network components and the two main deployment architectures, Non-Standalone (NSA) and Standalone (SA), allowing learners to explore complex wireless concepts in an intuitive, interactive, and accessible manner. By scanning QR code-based markers with mobile devices, students can observe and interact with three-dimensional representations of network elements from different perspectives, facilitating the understanding of 5G architectures and their operational differences.
The main contribution of this paper lies in the domain-specific educational design and pedagogical modeling strategy adopted to translate abstract 5G architectural concepts into an interactive AR experience. In particular, the tool supports a structured learning progression—moving from component-level exploration to architecture-level comparison—while incorporating animated message-flow visualization to illustrate how control-plane and user-plane communications differ between NSA and SA deployments.
The tool was evaluated in classroom settings at two Ecuadorian universities through an anonymous survey. The results indicate a positive reception in terms of usability, interactivity, and perceived educational value. Following a TAM-grounded analysis, students reported high perceived ease of use and perceived usefulness, and expressed willingness to reuse and recommend the application.
Limitations. While the present evaluation focuses on user acceptance and perceived educational value, the proposed system should be understood as a structured pedagogical framework for an AR-based representation of complex communication systems. The results provide initial evidence of its feasibility and educational potential in real classroom settings. However, an objective assessment of learning outcomes through controlled experimental designs (e.g., pre/post-tests and control groups) is beyond the scope of this paper and remains an important direction for future research. This paper is presented as an exploratory classroom-based educational pilot and therefore focuses on usability, acceptance, and perceived educational value rather than objective learning gains. The current implementation depends on mobile-device constraints (e.g., hardware variability, Android operating system compatibility, and resource permissions) and marker-based AR, which may be affected by camera quality and environmental conditions such as lighting and autofocus. In addition, the APK size (≈580 MB) may influence download and installation under limited connectivity conditions. Furthermore, scalability aspects—such as extending the asset library, supporting richer interaction, enabling multi-user collaborative modes, and integrating learning analytics—remain outside the scope of this paper and are identified as future work. Finally, the tool does not require a live 5G connection to operate, as it uses 5G architectures as learning content; therefore, network-dependent latency characterization is left for future extensions.
7. Future Work
Future developments may include expanding the library of 3D elements to incorporate emerging 6G concepts, such as reconfigurable intelligent surfaces (RIS) or terahertz communications. The system could also be improved by incorporating interactive simulations to complement static visualization, allowing users observe dynamic processes, such as data flows or handovers in real time.
Furthermore, the development of multi-user capabilities would foster collaborative learning experiences in shared AR environments [25]. In particular, feasible extensions include shared multi-user AR sessions in which students collaboratively visualize the same topology from different devices as well as role-based topology assembly activities where each participant is responsible for configuring specific network components (e.g., core network, gNodeBs, small cells). Such collaborative scenarios would support peer interaction, problem-based learning, and collective decision making, thereby moving beyond individual visualization toward a more constructivist and learner-centered educational experience.
In addition, future research will focus on the design and implementation of controlled experimental studies to rigorously assess learning outcomes. This includes the use of pre- and post-test evaluations aligned with the defined learning objectives (LO1–LO5) as well as the incorporation of control and experimental groups to enable comparative analysis with traditional teaching methods. Quantitative assessment will be complemented with statistical analysis of learning gains, allowing the evaluation of the instructional effectiveness of the AR-based approach in supporting different cognitive levels defined by Bloom’s taxonomy. This direction will provide objective evidence of the pedagogical impact of the proposed system beyond perceived usefulness and usability.
Finally, extending the tool to additional areas of telecommunications education could broaden its pedagogical impact. In summary, the proposed AR-based application provides an engaging and accessible approach to teaching 5G concepts while establishing a foundation for scalable, interactive, and immersive educational resources aligned with the evolution of future wireless communication systems.
Author Contributions
Conceptualization, N.O.G., H.C.M., J.V.-S. and R.S.A.; methodology, N.O.G., A.G., D.H. and P.P.; software, N.O.G., A.G., D.H. and P.P.; validation, N.O.G., A.G., D.H., P.P. and P.V.-N.; formal analysis, N.O.G.; investigation, N.O.G., A.G., D.H. and P.P.; resources, N.O.G.; writing—original draft preparation, N.O.G., A.G., D.H., P.P., H.C.M., J.V.-S. and R.S.A.; writing—review and editing, N.O.G., H.C.M., J.V.-S., R.S.A. and P.V.-N.; project administration, N.O.G. All authors have read and agreed to the published version of the manuscript.
Funding
This paper was supported in part by the Universidad de Las Américas (UDLA) under Project 577.A.XVII.25; in part by the Universidad San Francisco de Quito USFQ through the Poli-Grants Program with Grant Number 41991; and in part by the research project registered under code 49-5084-PVN at the National University of Chimborazo (UNACH).
Institutional Review Board Statement
The results presented in this paper are part of a research proposal approved by the Research, Outreach, and Graduate Commission of UNACH through Resolution No. 194-CIV-30-11-2022, as well as by the Ethics Committee for Research Involving Human Subjects (CEISH-UNACH) under Form No. 49-CEISH-UNACH.
Data Availability Statement
The original contributions presented in this paper are included in the article. Further inquiries can be directed to the corresponding author.
Acknowledgments
The authors are non-native English speakers, and ChatGPT-5.3 was used to improve the English language of the manuscript.
Conflicts of Interest
The authors declare no conflicts of interest.
References
- Sevilla, A.B. Realidad Aumentada en Educación; Technical report; UPM: Madrid, Spain, 2017. [Google Scholar]
- Castañer, M.S.; Aller, C.F. Análisis del Impacto del 5G en la Sociedad; Fundación Alternativas: Madrid, Spain, 2021. [Google Scholar]
- Mora, H.R.C.; Garzón, N.V.O.; García, F.D.A.; Sánchez, J.D.V.; López, O.L.A. Secure Transmission for Uplink SCMA Systems Over κ-μ Fading Channels. IEEE Trans. Veh. Technol. 2024, 73, 754–770. [Google Scholar] [CrossRef] [Scilit]
- Gomes, E.G.; Mora, H.R.C.; Olivo, E.E.B. Performance of STAR-RIS-Aided RSMA Networks: Impact of Correlated Fading Channels and SIC Imperfections. IEEE Access 2025, 13, 39826–39839. [Google Scholar] [CrossRef] [Scilit]
- GSMA. 5G, the Internet of Things (IoT) and Wearable Devices. Online, 2017. Available online: https://www.gsma.com/solutions-and-impact/connectivity-for-good/public-policy/gsma_resources/5g-internet-things-iot-wearable-devices/ (accessed on 2 March 2026).
- Yousefpour, A.; Fung, C.; Nguyen, T.; Kadiyala, K.; Jalali, F.; Niakanlahiji, A.; Kong, J.; Jue, J.P. All one needs to know about fog computing and related edge computing paradigms: A complete survey. J. Syst. Archit. 2019, 98, 289–330. [Google Scholar] [CrossRef] [Scilit]
- Hinojosa, C.J.T.; Cabrera, J.J.F.; Mora, H.R.C.; Garzón, N.V.O. An Augmented Reality based E-Learning Tool for Engineering. In Proceedings of the 2021 IEEE Colombian Conference on Communications and Computing (COLCOM), Virtual, 26–28 May 2021; pp. 1–6. [Google Scholar]
- Billinghurst, M.; Dünser, A. Augmented reality in the classroom. Computer 2012, 45, 56–63. [Google Scholar] [CrossRef] [Scilit]
- Carrasco, B.; Guamán, V.; Delgado, J.; Ruiz, F. ARTOUR: Augmented reality for tourism-a case study in Riobamba, Ecuador. In Proceedings of the 2019 International Conference on Information Systems and Computer Science (INCISCOS), Quito, Ecuador, 20–22 November 2019; pp. 116–123. [Google Scholar]
- Chen, P.; Liu, X.; Cheng, W.; Huang, R. A review of using augmented reality in education from 2011 to 2016. In Innovations in Smart Learning, Lecture Notes in Educational Technology; Springer: Singapore, 2017; pp. 13–18. [Google Scholar]
- Mendoza, R.; Cabarcas, A.; Fabregat, R.; Baldiris, S. Implementation of the Framework to Heritage Education Supported in Augmented Reality. In Proceedings of the 2019 International Conference on Virtual Reality and Visualization (ICVRV), Hong Kong, China, 18–19 November 2019; pp. 154–157. [Google Scholar] [CrossRef] [Scilit]
- Kaviyaraj, R.; Uma, M. Augmented Reality Application in Classroom: An Immersive Taxonomy. In Proceedings of the 2022 4th International Conference on Smart Systems and Inventive Technology (ICSSIT), Tirunelveli, India, 20–22 January 2022; pp. 1221–1226. [Google Scholar] [CrossRef] [Scilit]
- Lara, L.H.; Benítez, J.L.V. La realidad aumentada: Una tecnología en espera de usuarios. Rev. Digit. Univ. UNAM 2004, 5, 1–9. [Google Scholar]
- Nugroho, A.; Permanasari, A.E.; Hantono, B.S. Augmented Reality Implementation for Human Anatomy Learning in Medical Education: A Review. In Proceedings of the 2022 8th International Conference on Education and Technology (ICET), Malang, Indonesia, 15–16 October 2022; pp. 256–260. [Google Scholar] [CrossRef] [Scilit]
- Berki, B.; Sudár, A. Virtual and Augmented Reality in Education Based on CogInfoCom and cVR Conference Insights. In Proceedings of the 2024 IEEE 15th International Conference on Cognitive Infocommunications (CogInfoCom), Tokyo, Japan, 16–18 September 2024; pp. 000115–000120. [Google Scholar] [CrossRef] [Scilit]
- Takrouri, K.; Causton, E.; Simpson, B. AR Technologies in Engineering Education: Applications, Potential, and Limitations. Digital 2022, 2, 171–190. [Google Scholar] [CrossRef] [Scilit]
- Elmqaddem, N. Augmented reality and virtual reality in education. Myth or reality? Int. J. Emerg. Technol. Learn. (iJET) 2019, 14, 234–242. [Google Scholar] [CrossRef] [Scilit]
- Rakshit, S.M.; Banerjee, S.; Hempel, M.; Sharif, H. Fusion of VR and teleoperation for innovative near-presence laboratory experience in engineering education. In Proceedings of the 2017 IEEE International Conference on Electro Information Technology (EIT), Lincoln, NE, USA, 14–17 May 2017; pp. 376–381. [Google Scholar] [CrossRef] [Scilit]
- Dewey, J. Experience and Education. Educ. Forum 2008, 50, 242–252. [Google Scholar]
- Liu, D.; Dede, C.; Huang, R.; Richards, J. (Eds.) Virtual, Augmented, and Mixed Realities in Education, 1st ed.; Smart Computing and Intelligence; Springer: Singapore, 2017. [Google Scholar]
- Soni, L.; Taneja, A. Optimizing AR/VR video transmission with 5G networks. In Proceedings of the 2025 7th International Conference on Energy, Power and Environment (ICEPE), Meghalaya, India, 9–11 May 2025; pp. 1–6. [Google Scholar]
- Ali, A.A.; Dafoulas, G.A.; Augusto, J.C. Collaborative educational environments incorporating mixed reality technologies: A systematic mapping study. IEEE Trans. Learn. Technol. 2019, 12, 321–332. [Google Scholar] [CrossRef] [Scilit]
- Ordorika, I. Pandemia y educación superior. Rev. Educ. Super. 2020, 49, 1–8. [Google Scholar]
- Ibanez, M.B.; Villaran, D.; Delgado-Kloos, C. Integrating assessment into augmented reality-based learning environments. In Proceedings of the 2015 IEEE 15th International Conference on Advanced Learning Technologies (ICALT 2015), Hualien, Taiwan, 6–9 July 2015; pp. 218–222. [Google Scholar]
- Li, G.; Luo, H.; Chen, D.; Wang, P.; Yin, X.; Zhang, J. Augmented Reality in Higher Education: A Systematic Review and Meta-Analysis of the Literature from 2000 to 2023. Educ. Sci. 2025, 15, 678. [Google Scholar] [CrossRef] [Scilit]
- Gonzalez-Argote, D.; Alejandro Vitón-Castillo, A.; Gonzalez-Argote, J. Application of augmented reality in automotive industry. EAI Endorsed Trans. Internet Things 2024, 10, 1. [Google Scholar] [CrossRef] [Scilit]
- Baross, M.T.; Németh, A.; Szatmári, B.G.; Ágoston, T.; Varga, P.J. Implemented University Practical Course for 5G Stand Alone System with Augmented Reality. In Proceedings of the 2024 IEEE 18th International Symposium on Applied Computational Intelligence and Informatics (SACI), Siófok, Hungary, 23–25 May 2024; pp. 000371–000376. [Google Scholar] [CrossRef] [Scilit]
- Liu, G.; Huang, Y.; Chen, Z.; Liu, L.; Wang, Q.; Li, N. 5G Deployment: Standalone vs. Non-Standalone from the Operator Perspective. IEEE Commun. Mag. 2020, 20, 83–89. [Google Scholar] [CrossRef] [Scilit]
- Lin, X. The bridge toward 6G: 5G-Advanced evolution in 3GPP Release I9. IEEE Commun. Stand. Mag. 2025, 9, 28–35. [Google Scholar] [CrossRef] [Scilit]
- Yu, H.; Lee, H.; Jeon, H. What is 5G? Emerging 5G Mobile Services and Network Requirements. Sustainability 2017, 9, 1848. [Google Scholar] [CrossRef] [Scilit]
- Fezeu, R.A.K.; Fiandrino, C.; Ramadan, E.; Carpenter, J.; de Freitas, L.C.; Bilal, F.; Ye, W.; Widmer, J.; Qian, F.; Zhang, Z.-L. Unveiling the 5G mid-band landscape: From network deployment to performance and application QoE. In Proceedings of the ACM SIGCOMM 2024 Conference, Sydney, Australia, 4–8 August 2024; pp. 358–372. [Google Scholar]
- Delmade, A.; Barry, L.P.; Dass, D.; Browning, C. Multi-frequency 5G NR millimeter-wave signal generation over analog RoF link using optical frequency combs. Opt. Commun. 2023, 545, 129681. [Google Scholar] [CrossRef] [Scilit]
- Yáñez-Casas, G.A.; Couder-Castañeda, C.; Hernández-Gómez, J.J.; Enciso-Aguilar, M.A. Scattering and Attenuation in 5G Electromagnetic Propagation (5 GHz and 25 GHz) in the Presence of Rainfall: A Numerical Study. Mathematics 2023, 11, 4074. [Google Scholar] [CrossRef] [Scilit]
- Dolente, F.; Garroppo, R.G.; Pagano, M. A vulnerability assessment of open-source implementations of fifth-generation core network functions. Future Internet 2023, 16, 1. [Google Scholar] [CrossRef] [Scilit]
- Berisha, D. 5G SA and NSA Solutions. Bachelor Thesis, University for Business and Technology (UBT), Prishtine, Kosovo, 2021. (In English) [Google Scholar]
- Zhao, X.; Chen, J.; Li, P.; Li, Z.; Hu, C.; Xie, W. 5G NSA Radio Access Network Sharing for Mobile Operators: Design, realization and field trial. In Proceedings of the IEEE 20th International Conference on Communication Technology, Nanning, China, 28–31 October 2020. [Google Scholar]
- Gupta, A.; Jha, R.K. A survey of 5G network: Architecture and emerging technologies. IEEE Access 2015, 3, 1206–1232. [Google Scholar] [CrossRef] [Scilit]
- Rostami, A. Private 5G Networks for Vertical Industries: Deployment and Operation Models. In Proceedings of the 2019 IEEE 2nd 5G World Forum (5GWF 2019), Dresden, Germany, 30 September–2 October 2019. [Google Scholar]
- Radu, I. Augmented reality in education: A meta-review and cross-media analysis. Pers. Ubiquitous Comput. 2014, 18, 1533–1543. [Google Scholar] [CrossRef] [Scilit]
- Akçayır, H.; Akçayır, M. Advantages and challenges associated with augmented reality for education: A systematic review of the literature. Educ. Res. Rev. 2017, 20, 1–11. [Google Scholar] [CrossRef] [Scilit]
- Pathak, J.P. Role of augmented reality in vocational education and training: A PRISMA-compliant systematic literature review. In Transforming Vocational Education and Training Using AI; IGI Global: Hershey, PA, USA, 2025; p. 38. [Google Scholar] [CrossRef] [Scilit]
- Chiang, F.K.; Shang, X.; Qiao, L. Augmented reality in vocational training: A systematic review of research and applications. Comput. Hum. Behav. 2022, 129, 107125. [Google Scholar] [CrossRef] [Scilit]
- Iyer, R.; Maralapalle, V.C.; Mahesh, P. Virtual Reality (VR) and Augmented Reality (AR) in vocational training. In Transforming Vocational Education and Training Using AI; IGI Global: Hershey, PA, USA, 2025; pp. 73–92. [Google Scholar] [CrossRef] [Scilit]
- Zhang, J.; Chang, K.E. Applying augmented reality to improve the outcomes of procedural knowledge acquisition. In Proceedings of the 2019 IEEE 19th International Conference on Advanced Learning Technologies (ICALT); IEEE: Maceió, Brazil, 2019; pp. 340–343. [Google Scholar] [CrossRef] [Scilit]
- Singh, G.; Ahmad, F. An interactive augmented reality framework to enhance the user experience and operational skills in electronics laboratories. Smart Learn. Environ. 2024, 11, 5. [Google Scholar] [CrossRef] [Scilit]
- Kamaruzaman, F.M.; Peng, C.Y.; Omar, M. Evaluating the Role of Augmented Reality in Enhancing Engagement and Learning in TVET Education: A Scoping Review. J. Appl. Sci. Eng. Technol. Educ. 2025, 7, 377–391. [Google Scholar] [CrossRef] [Scilit]
- Kostadimas, D.; Kasapakis, V.; Kotis, K. A systematic review on the combination of VR, IoT and AI technologies, and their integration in applications. Future Internet 2025, 17, 163. [Google Scholar] [CrossRef] [Scilit]
- Davis, F.D. Perceived Usefulness, Perceived Ease of Use, and User Acceptance of Information Technology. MIS Q. 1989, 13, 319–340. [Google Scholar] [CrossRef] [Scilit]
- Field, A. Discovering Statistics Using IBM SPSS Statistics, 4th ed.; SAGE Publications: London, UK, 2013. [Google Scholar]
- Nunnally, J.C.; Bernstein, I.H. Psychometric Theory, 3rd ed.; McGraw-Hill: New York, NY, USA, 1994. [Google Scholar]
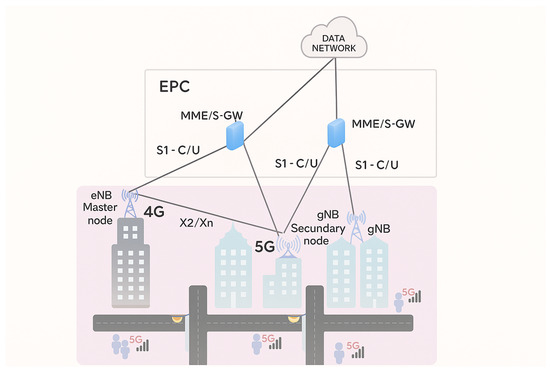
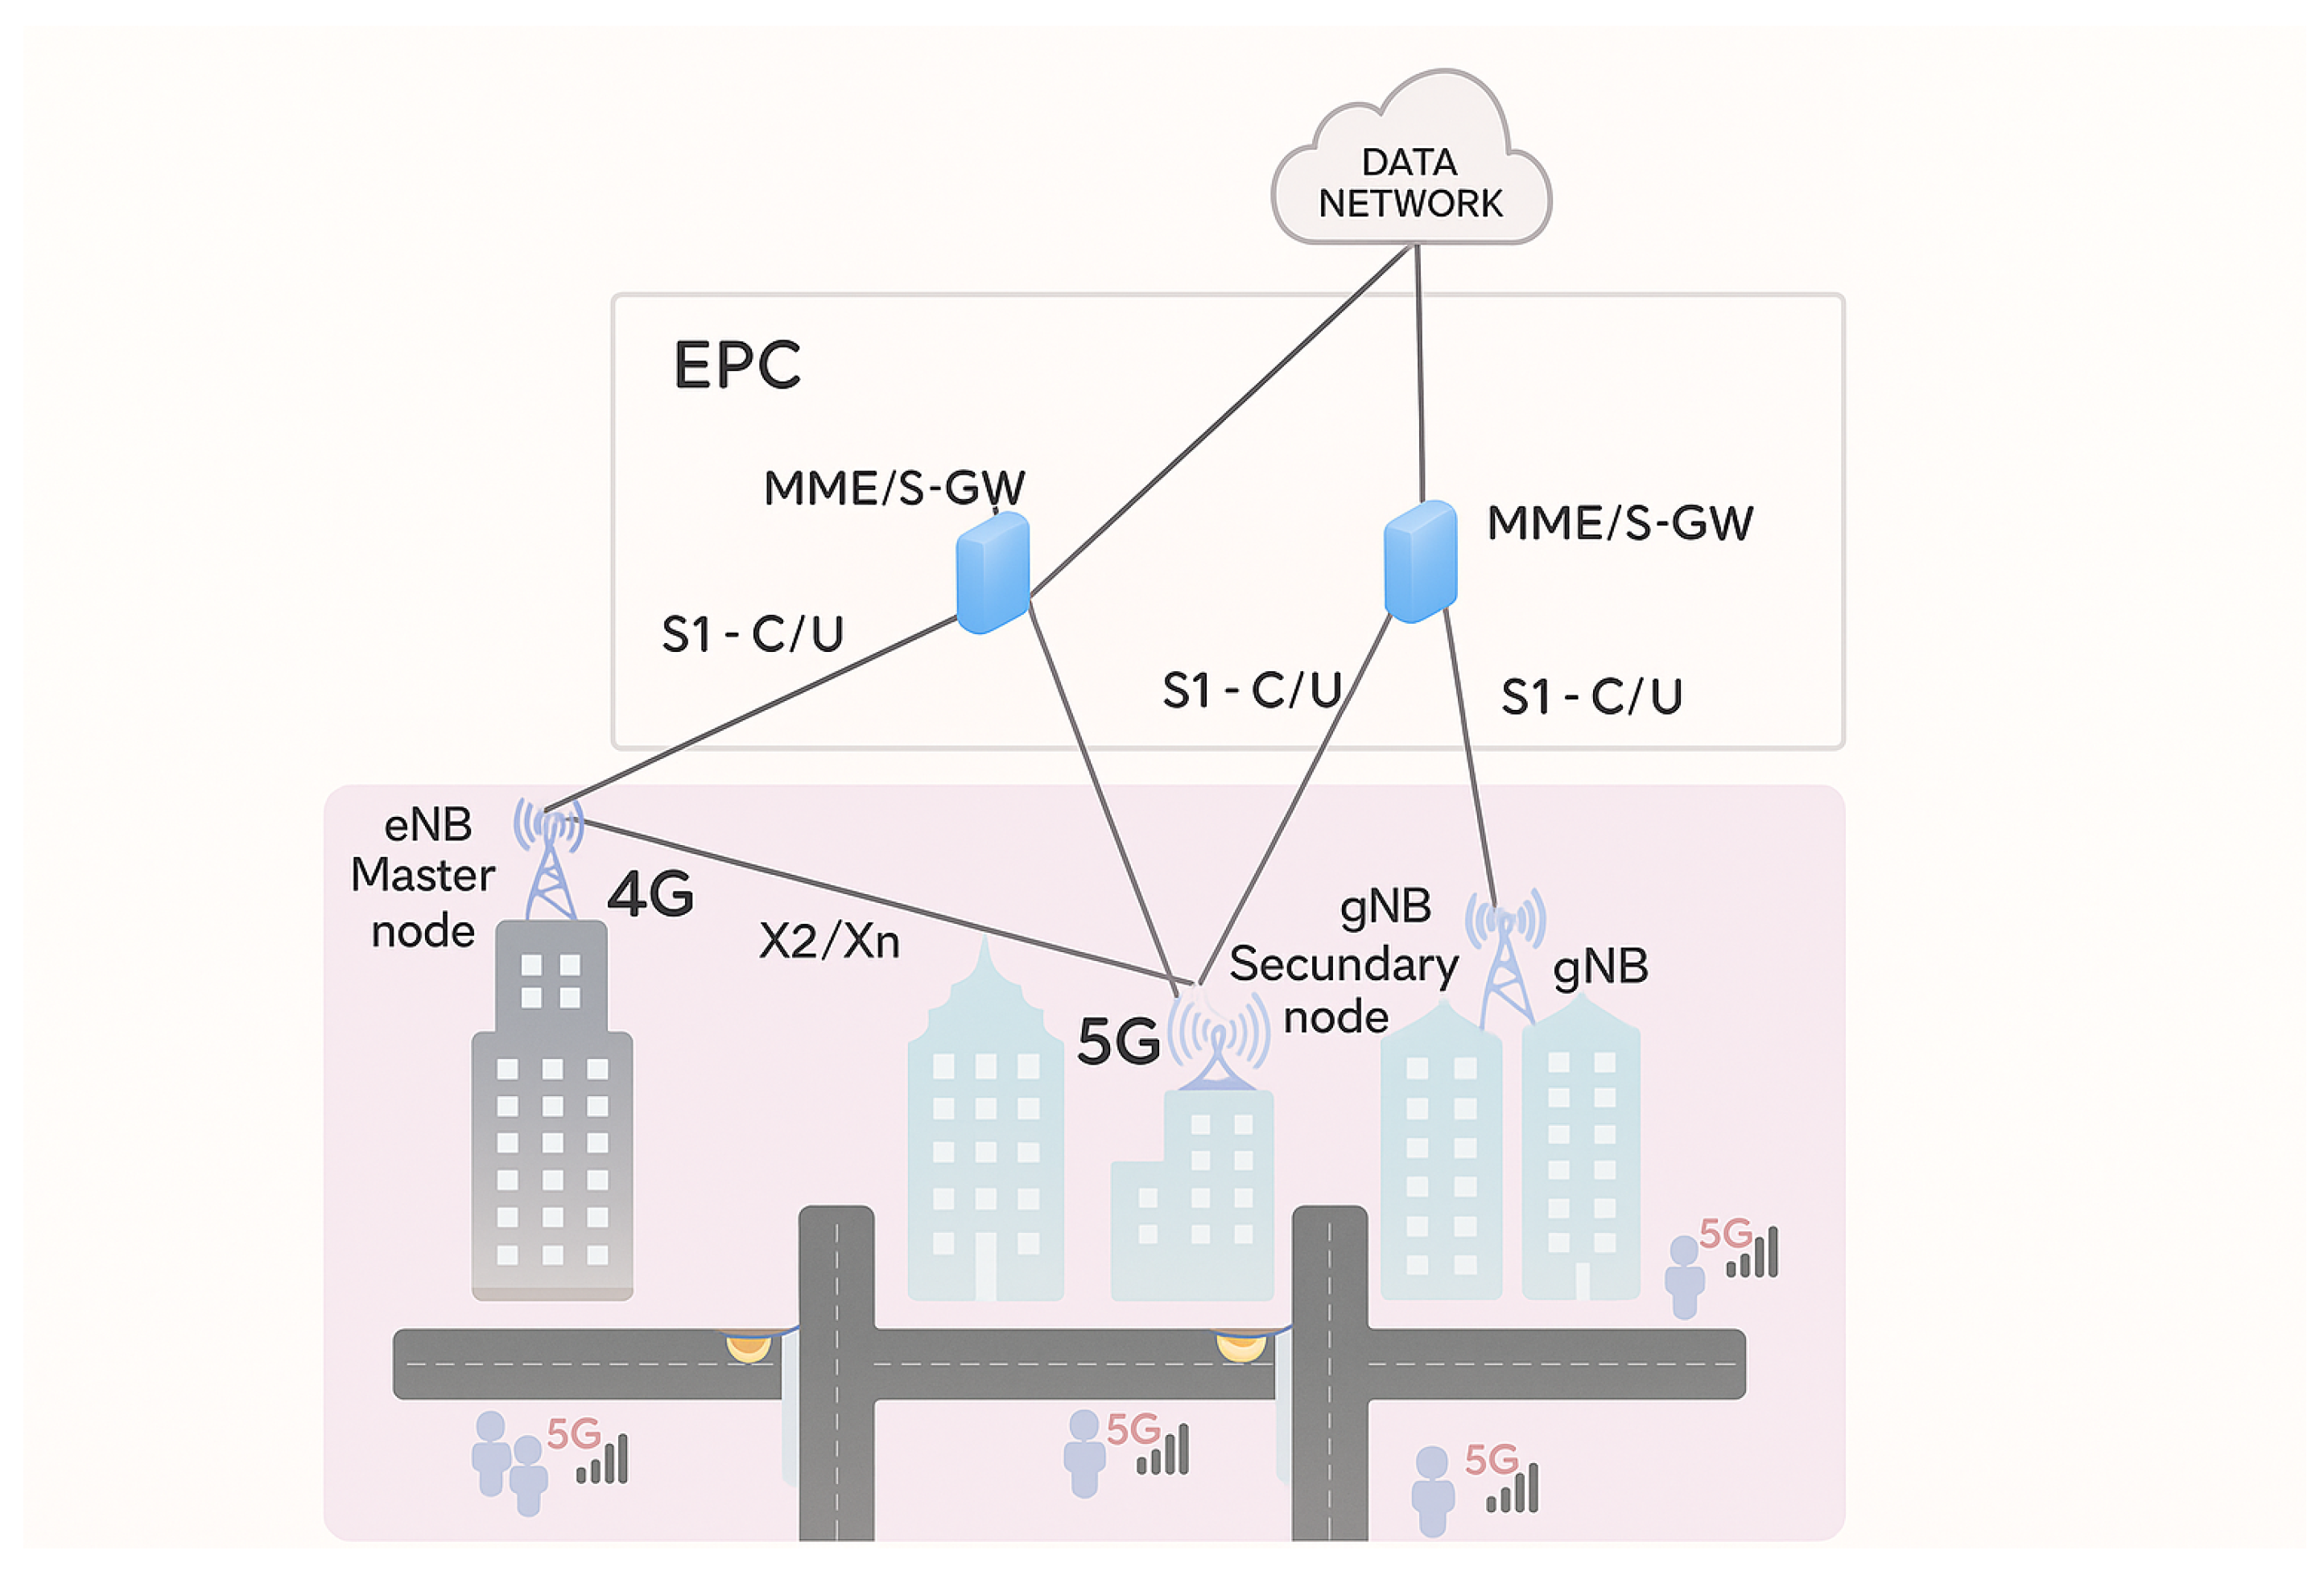
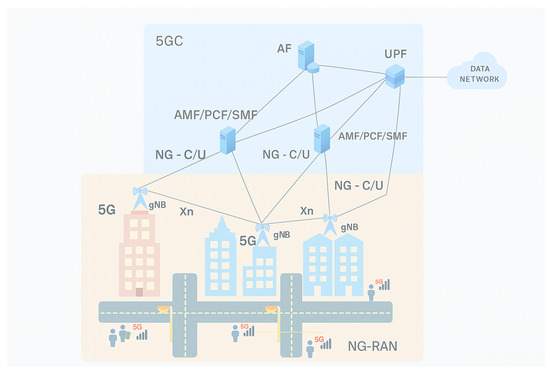
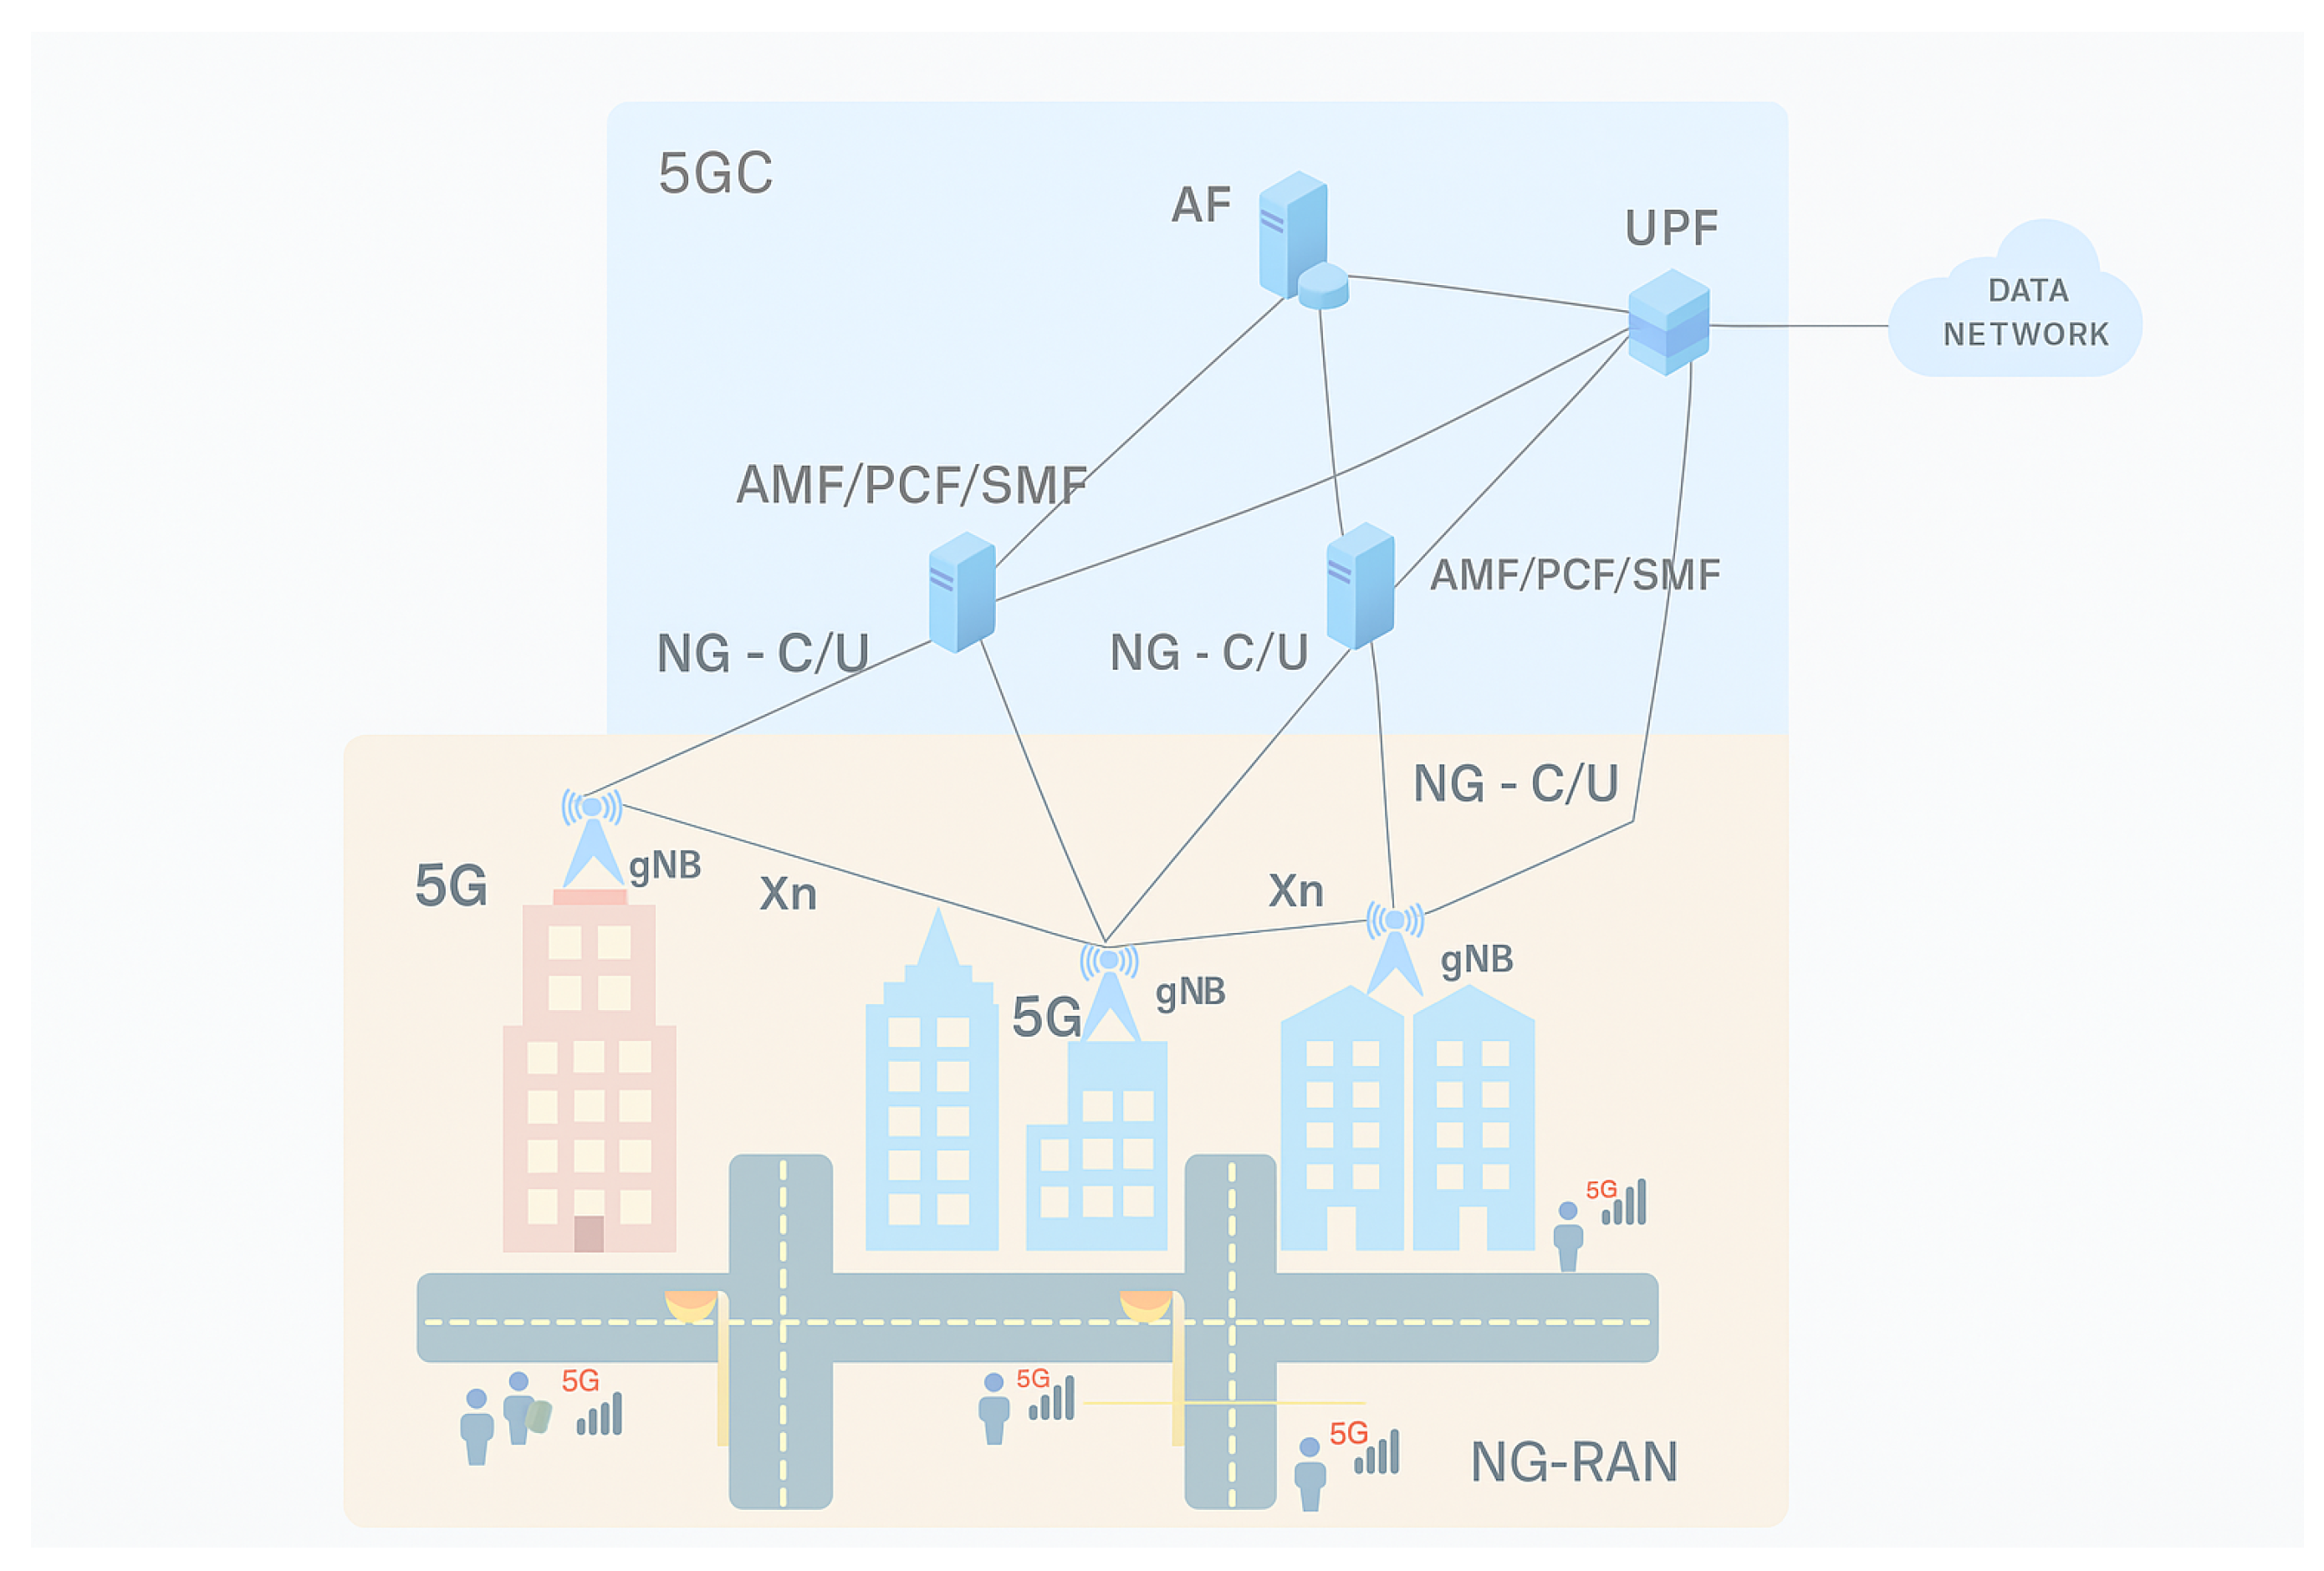
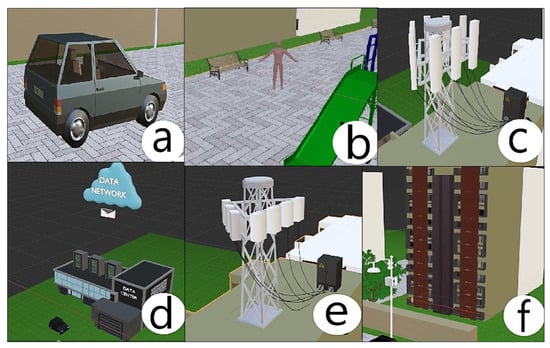
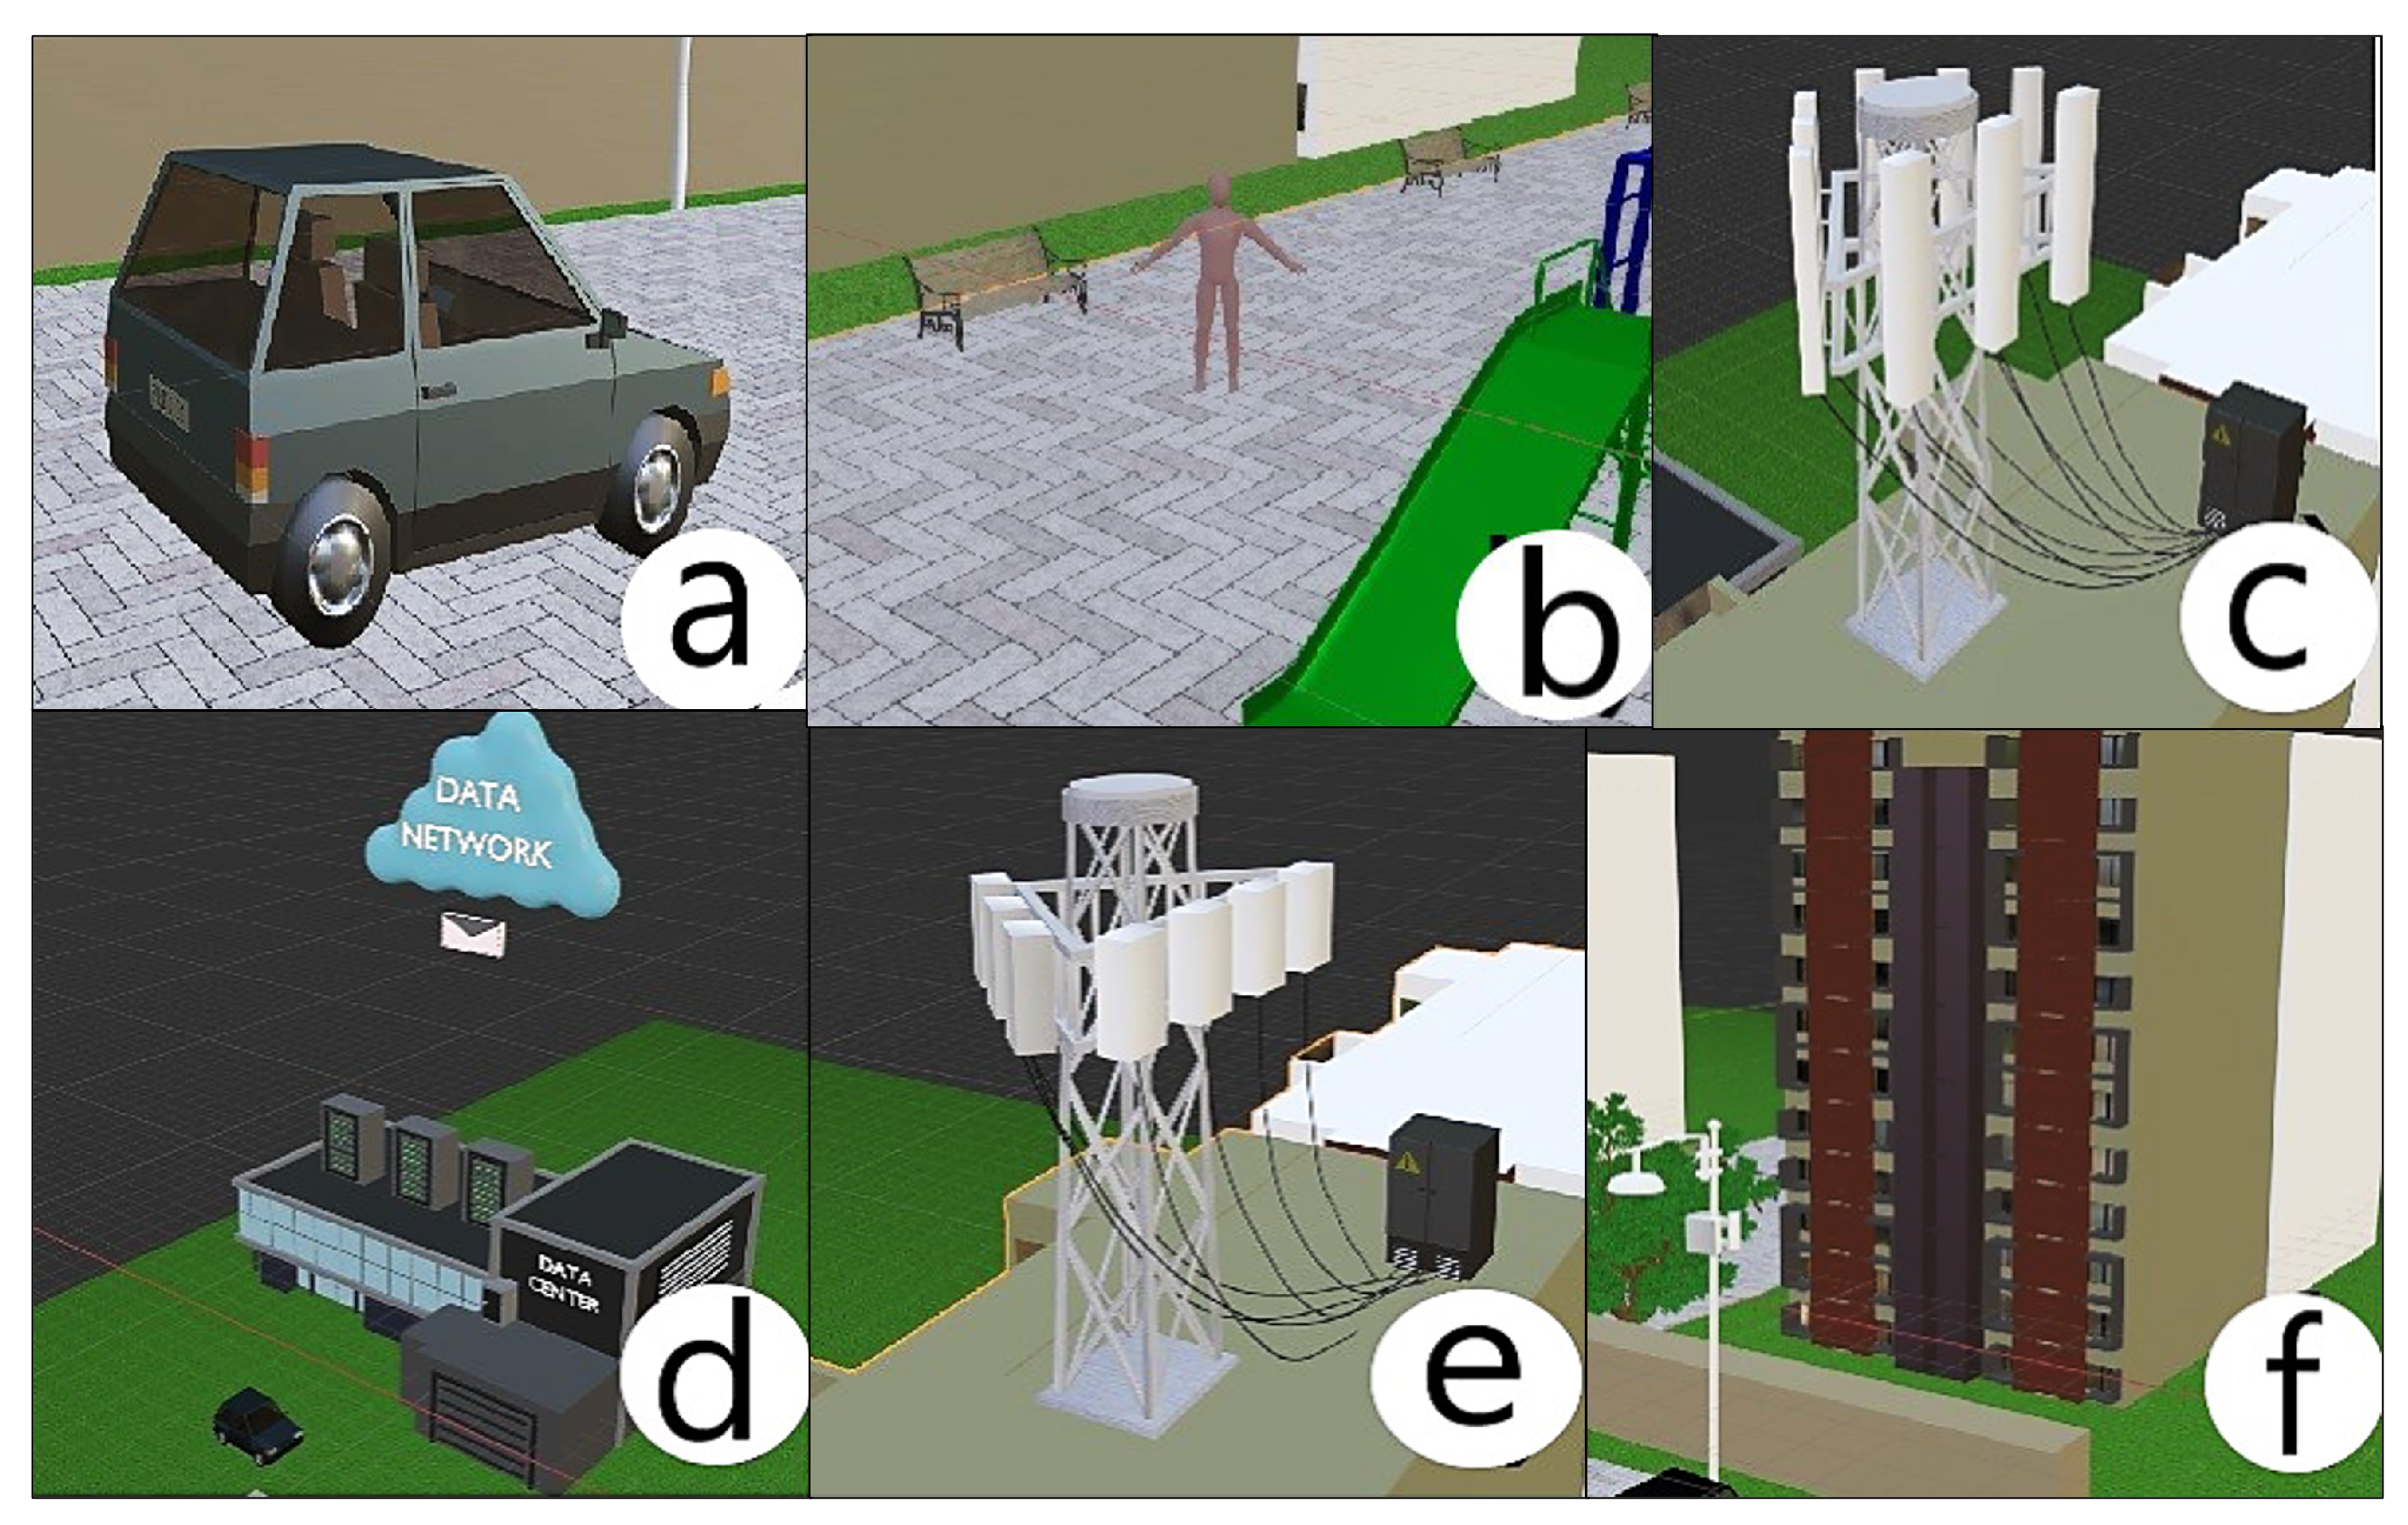
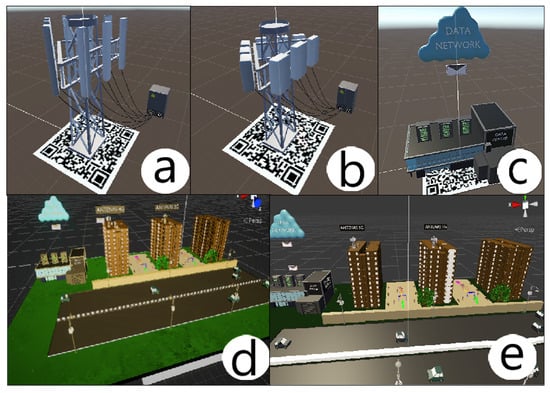
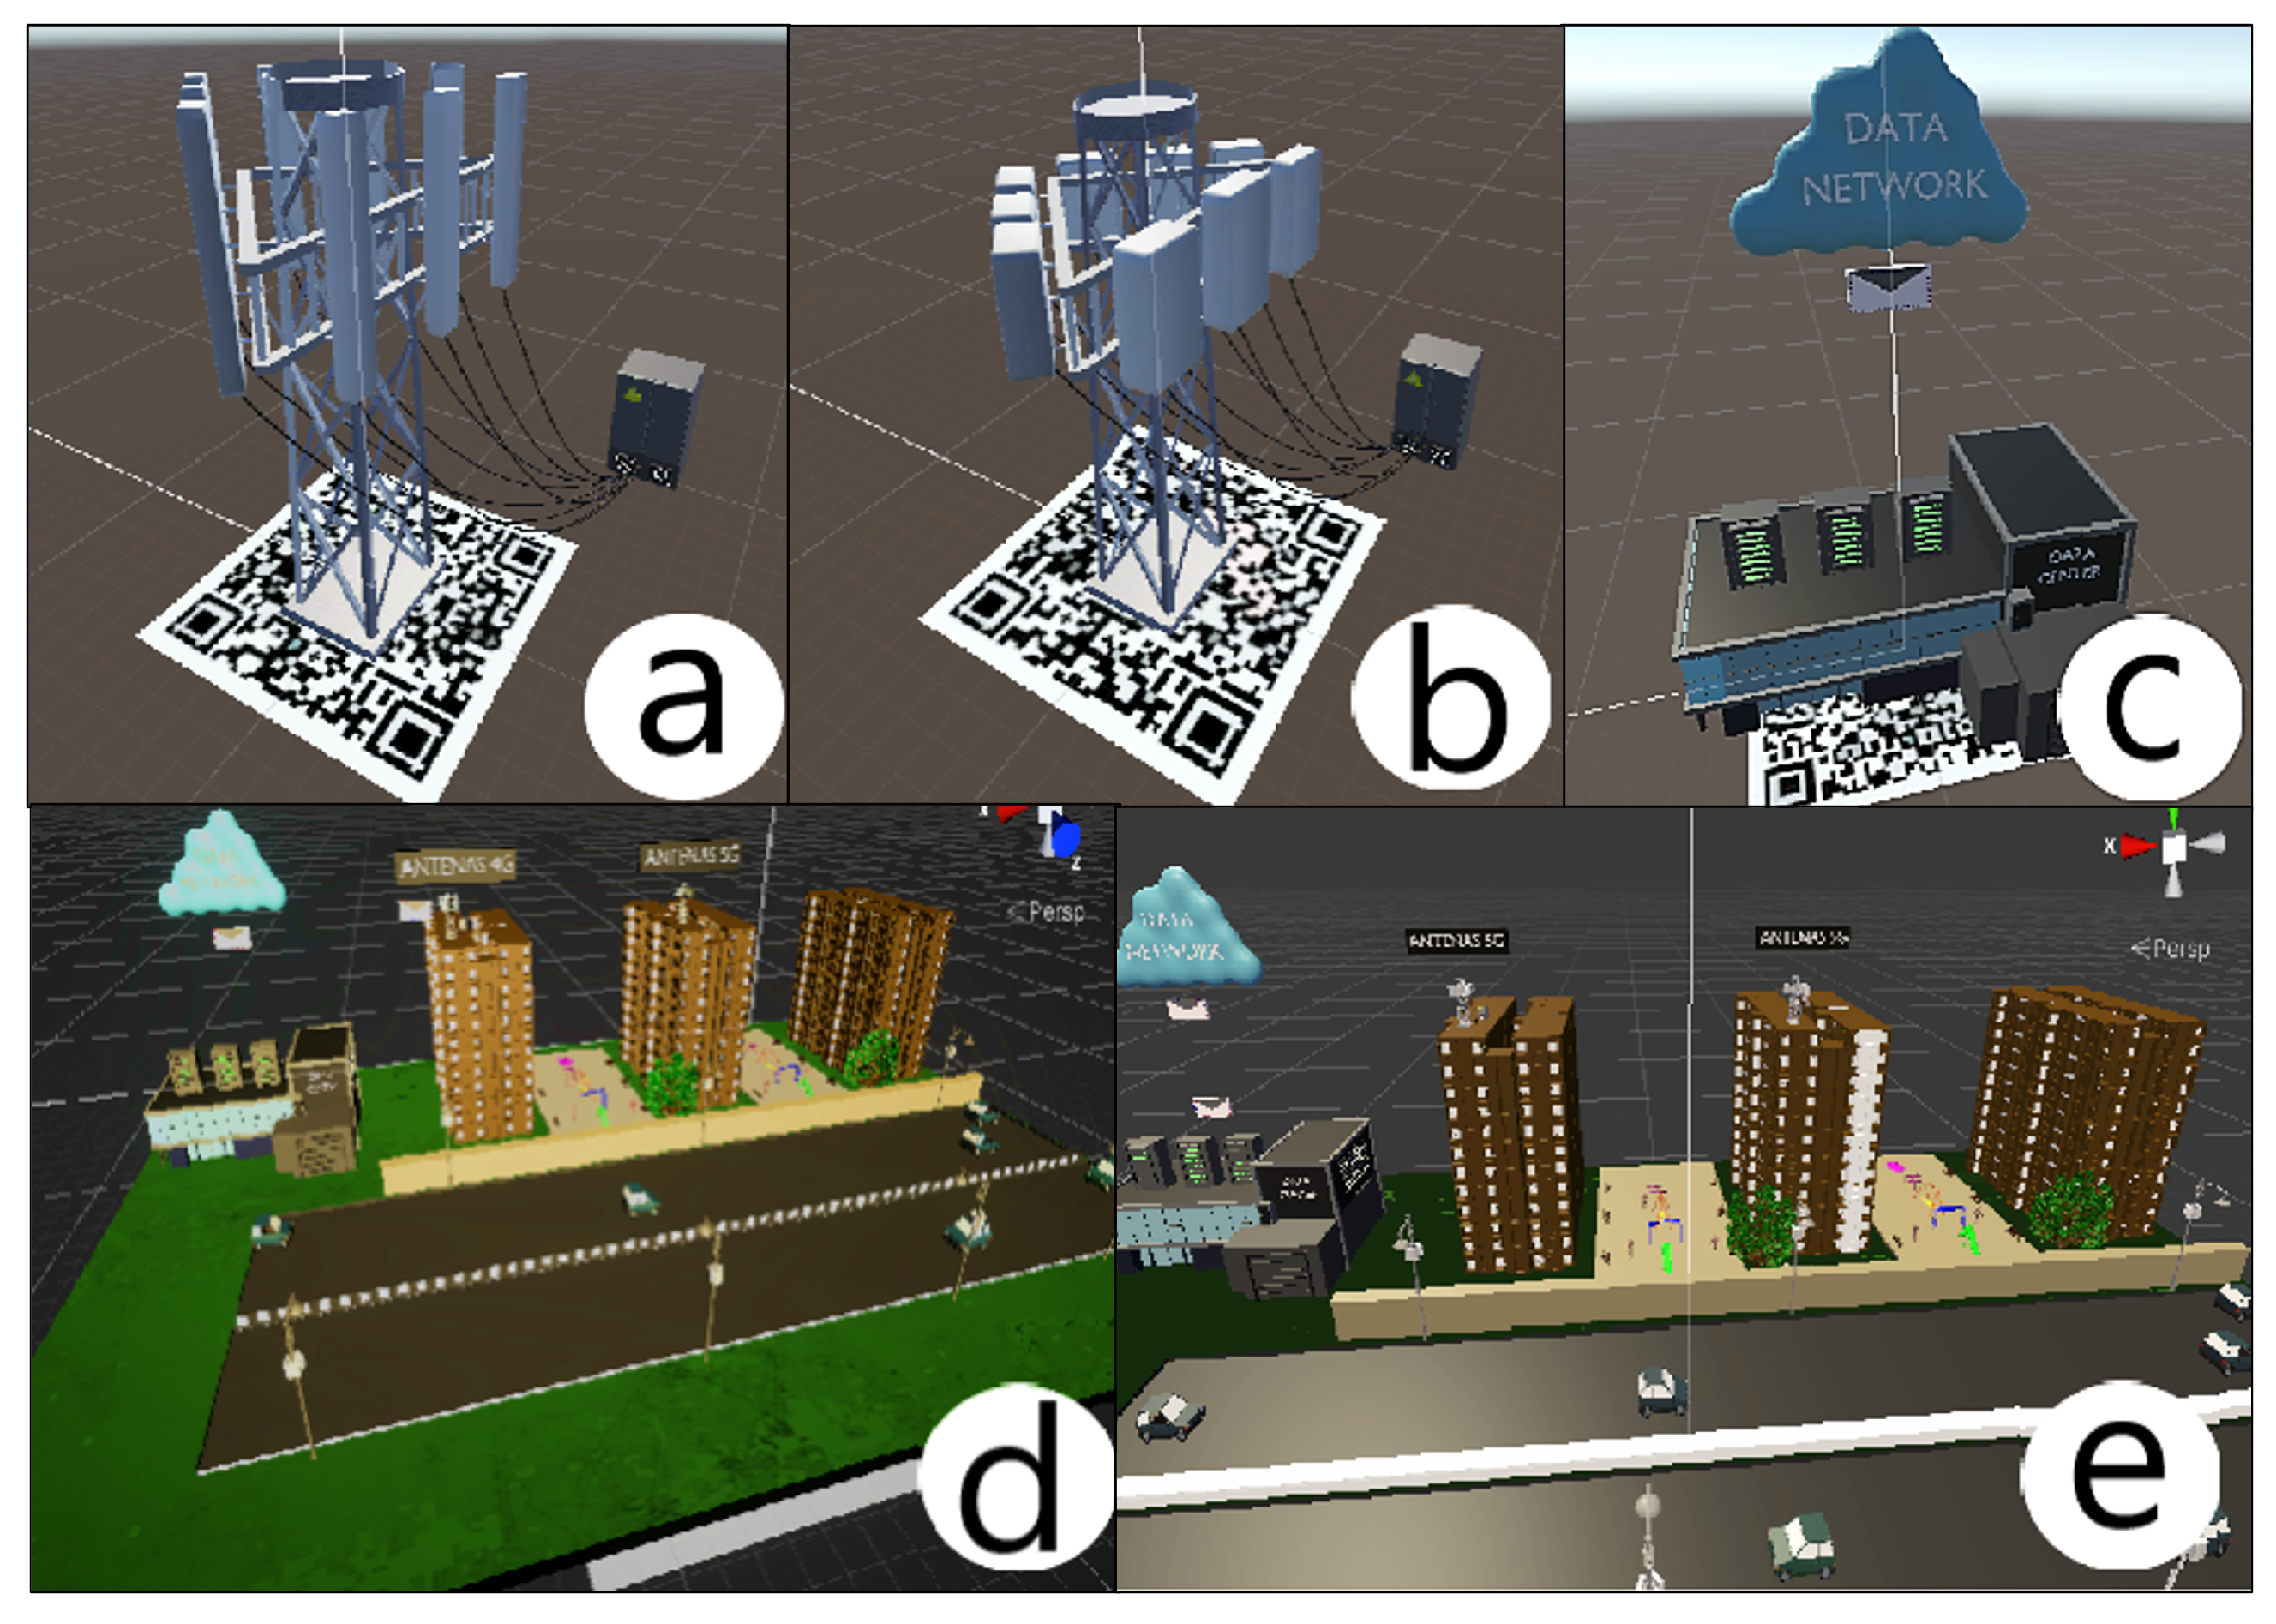

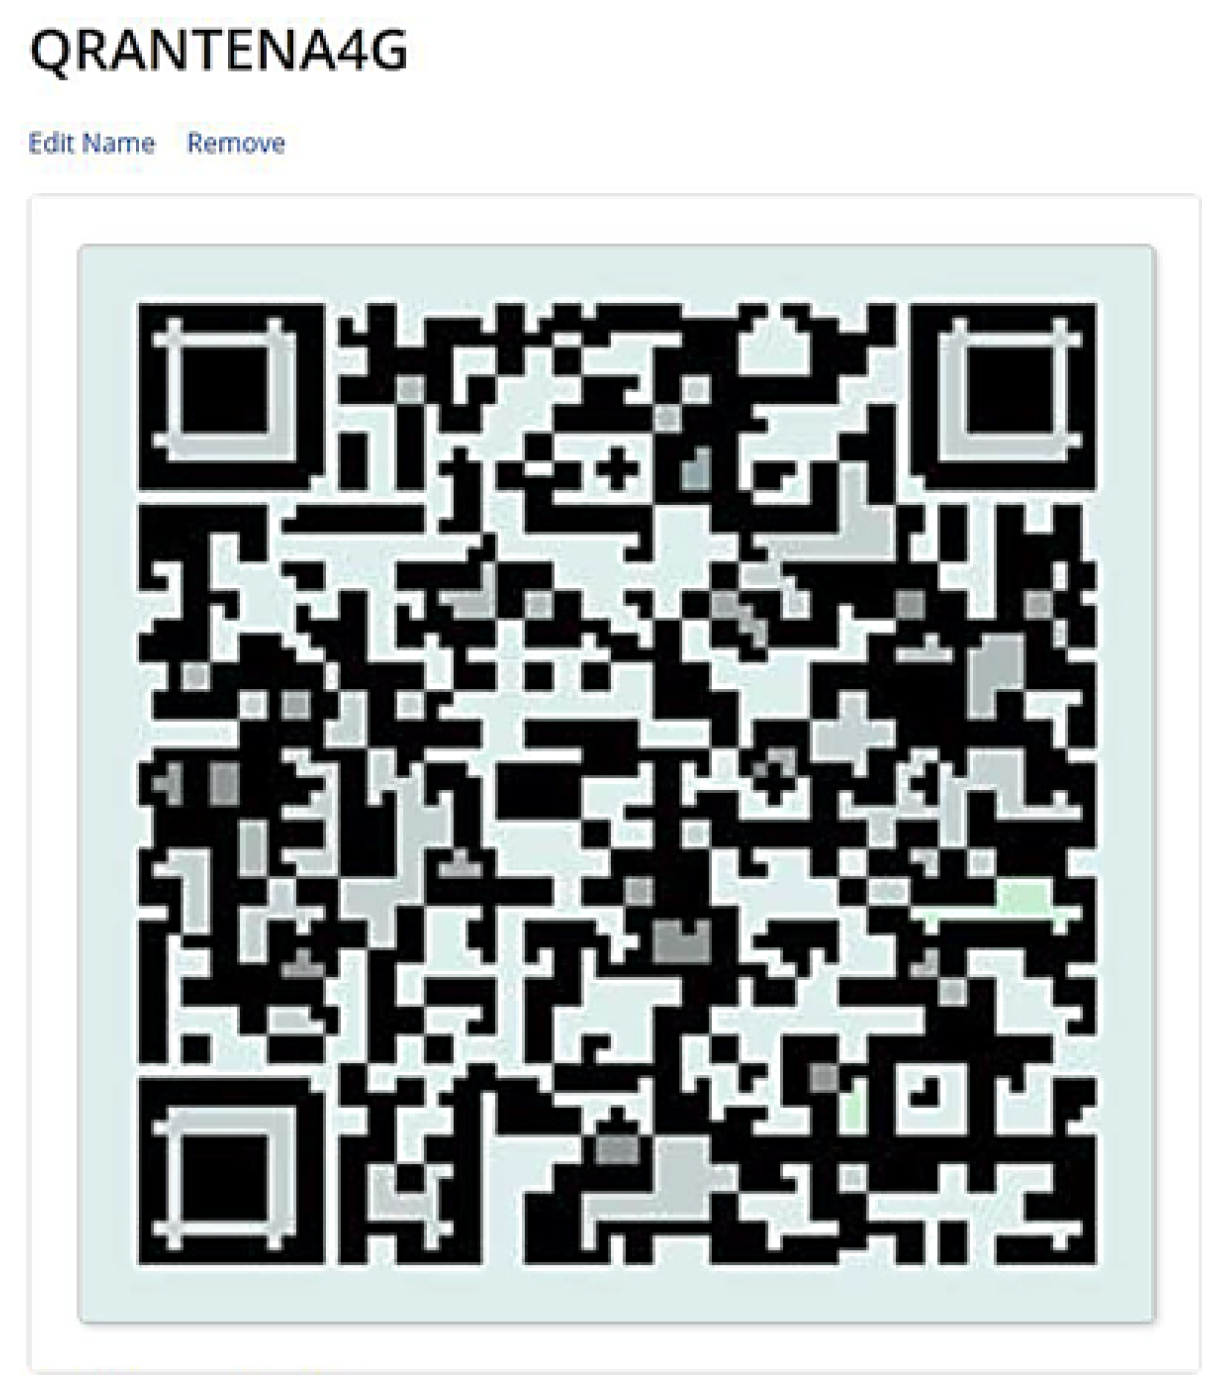
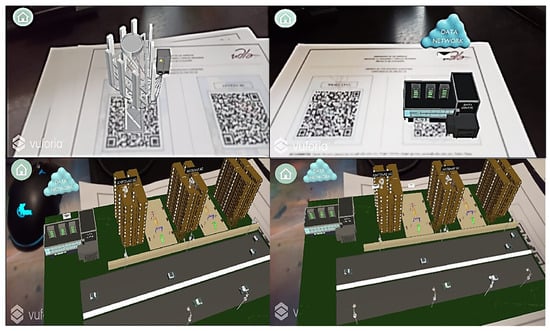
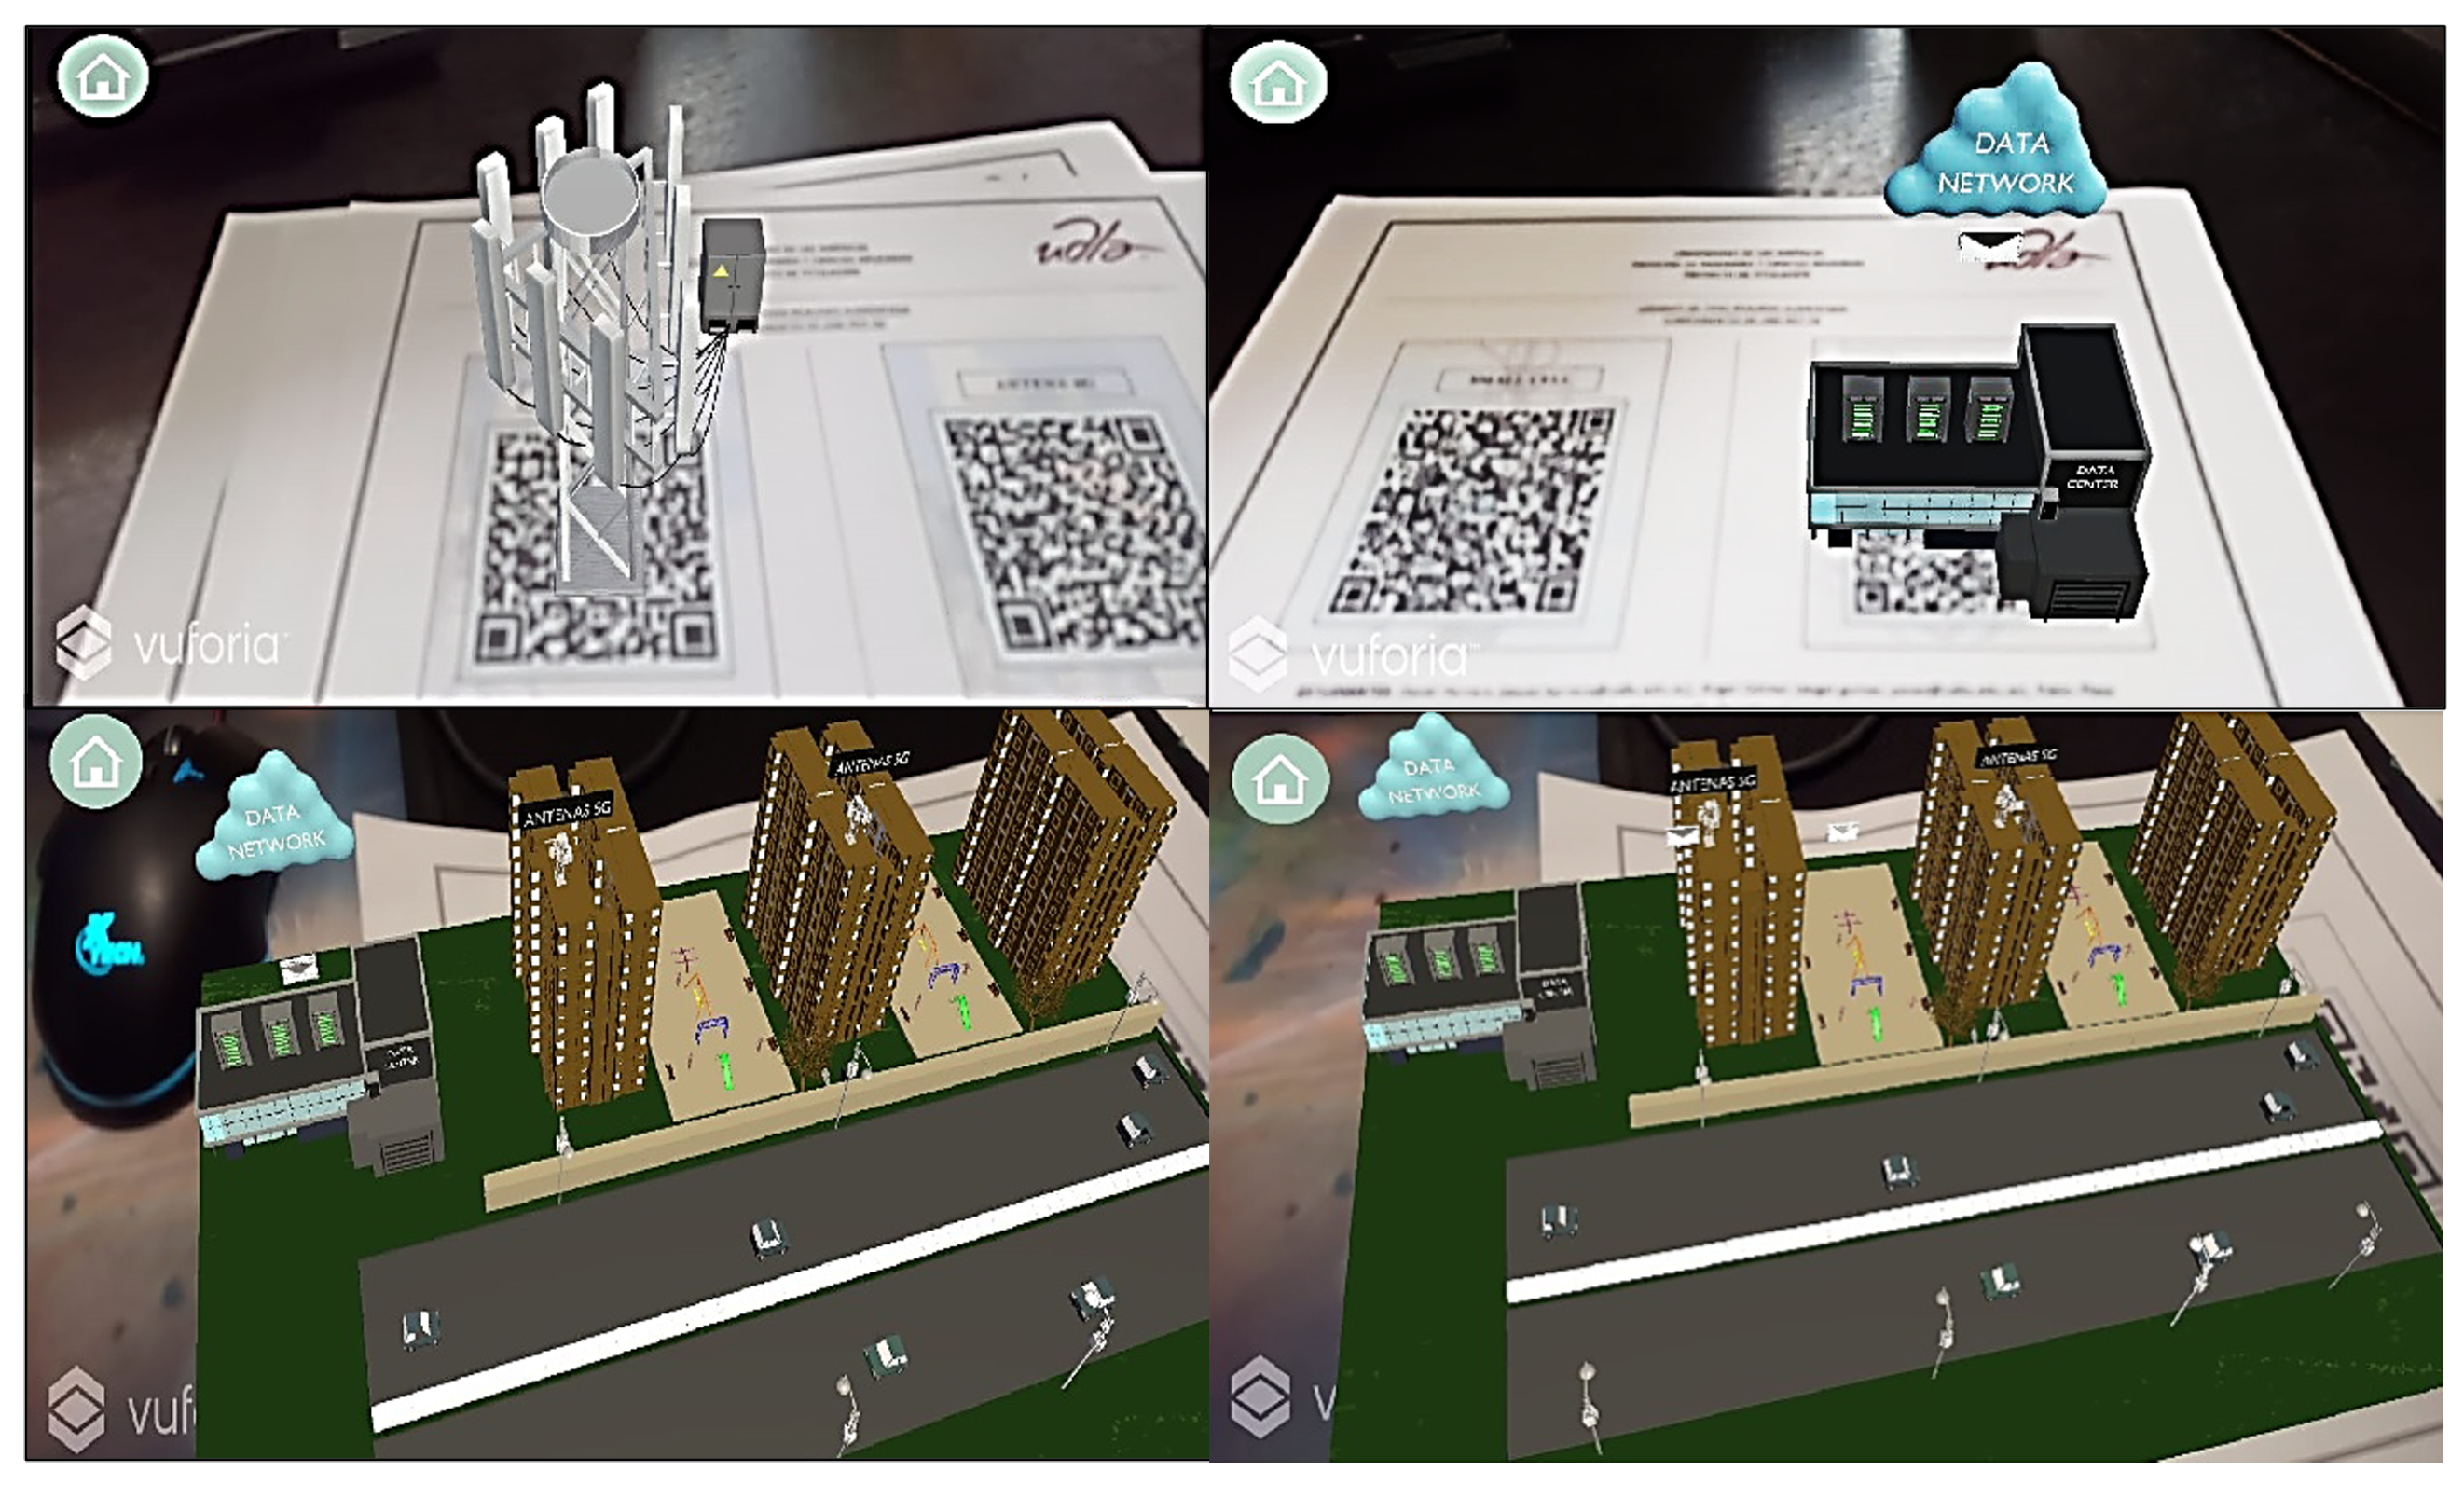
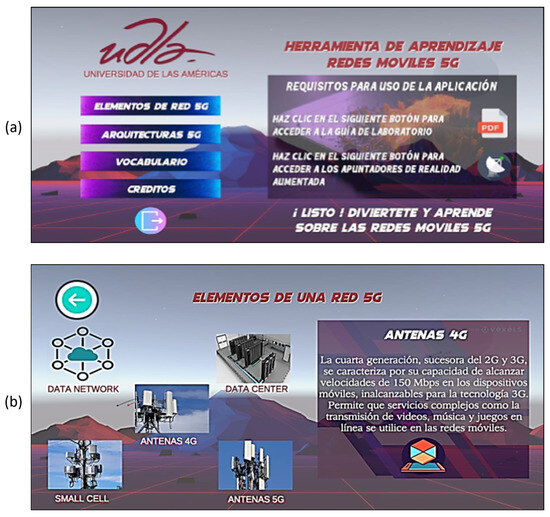
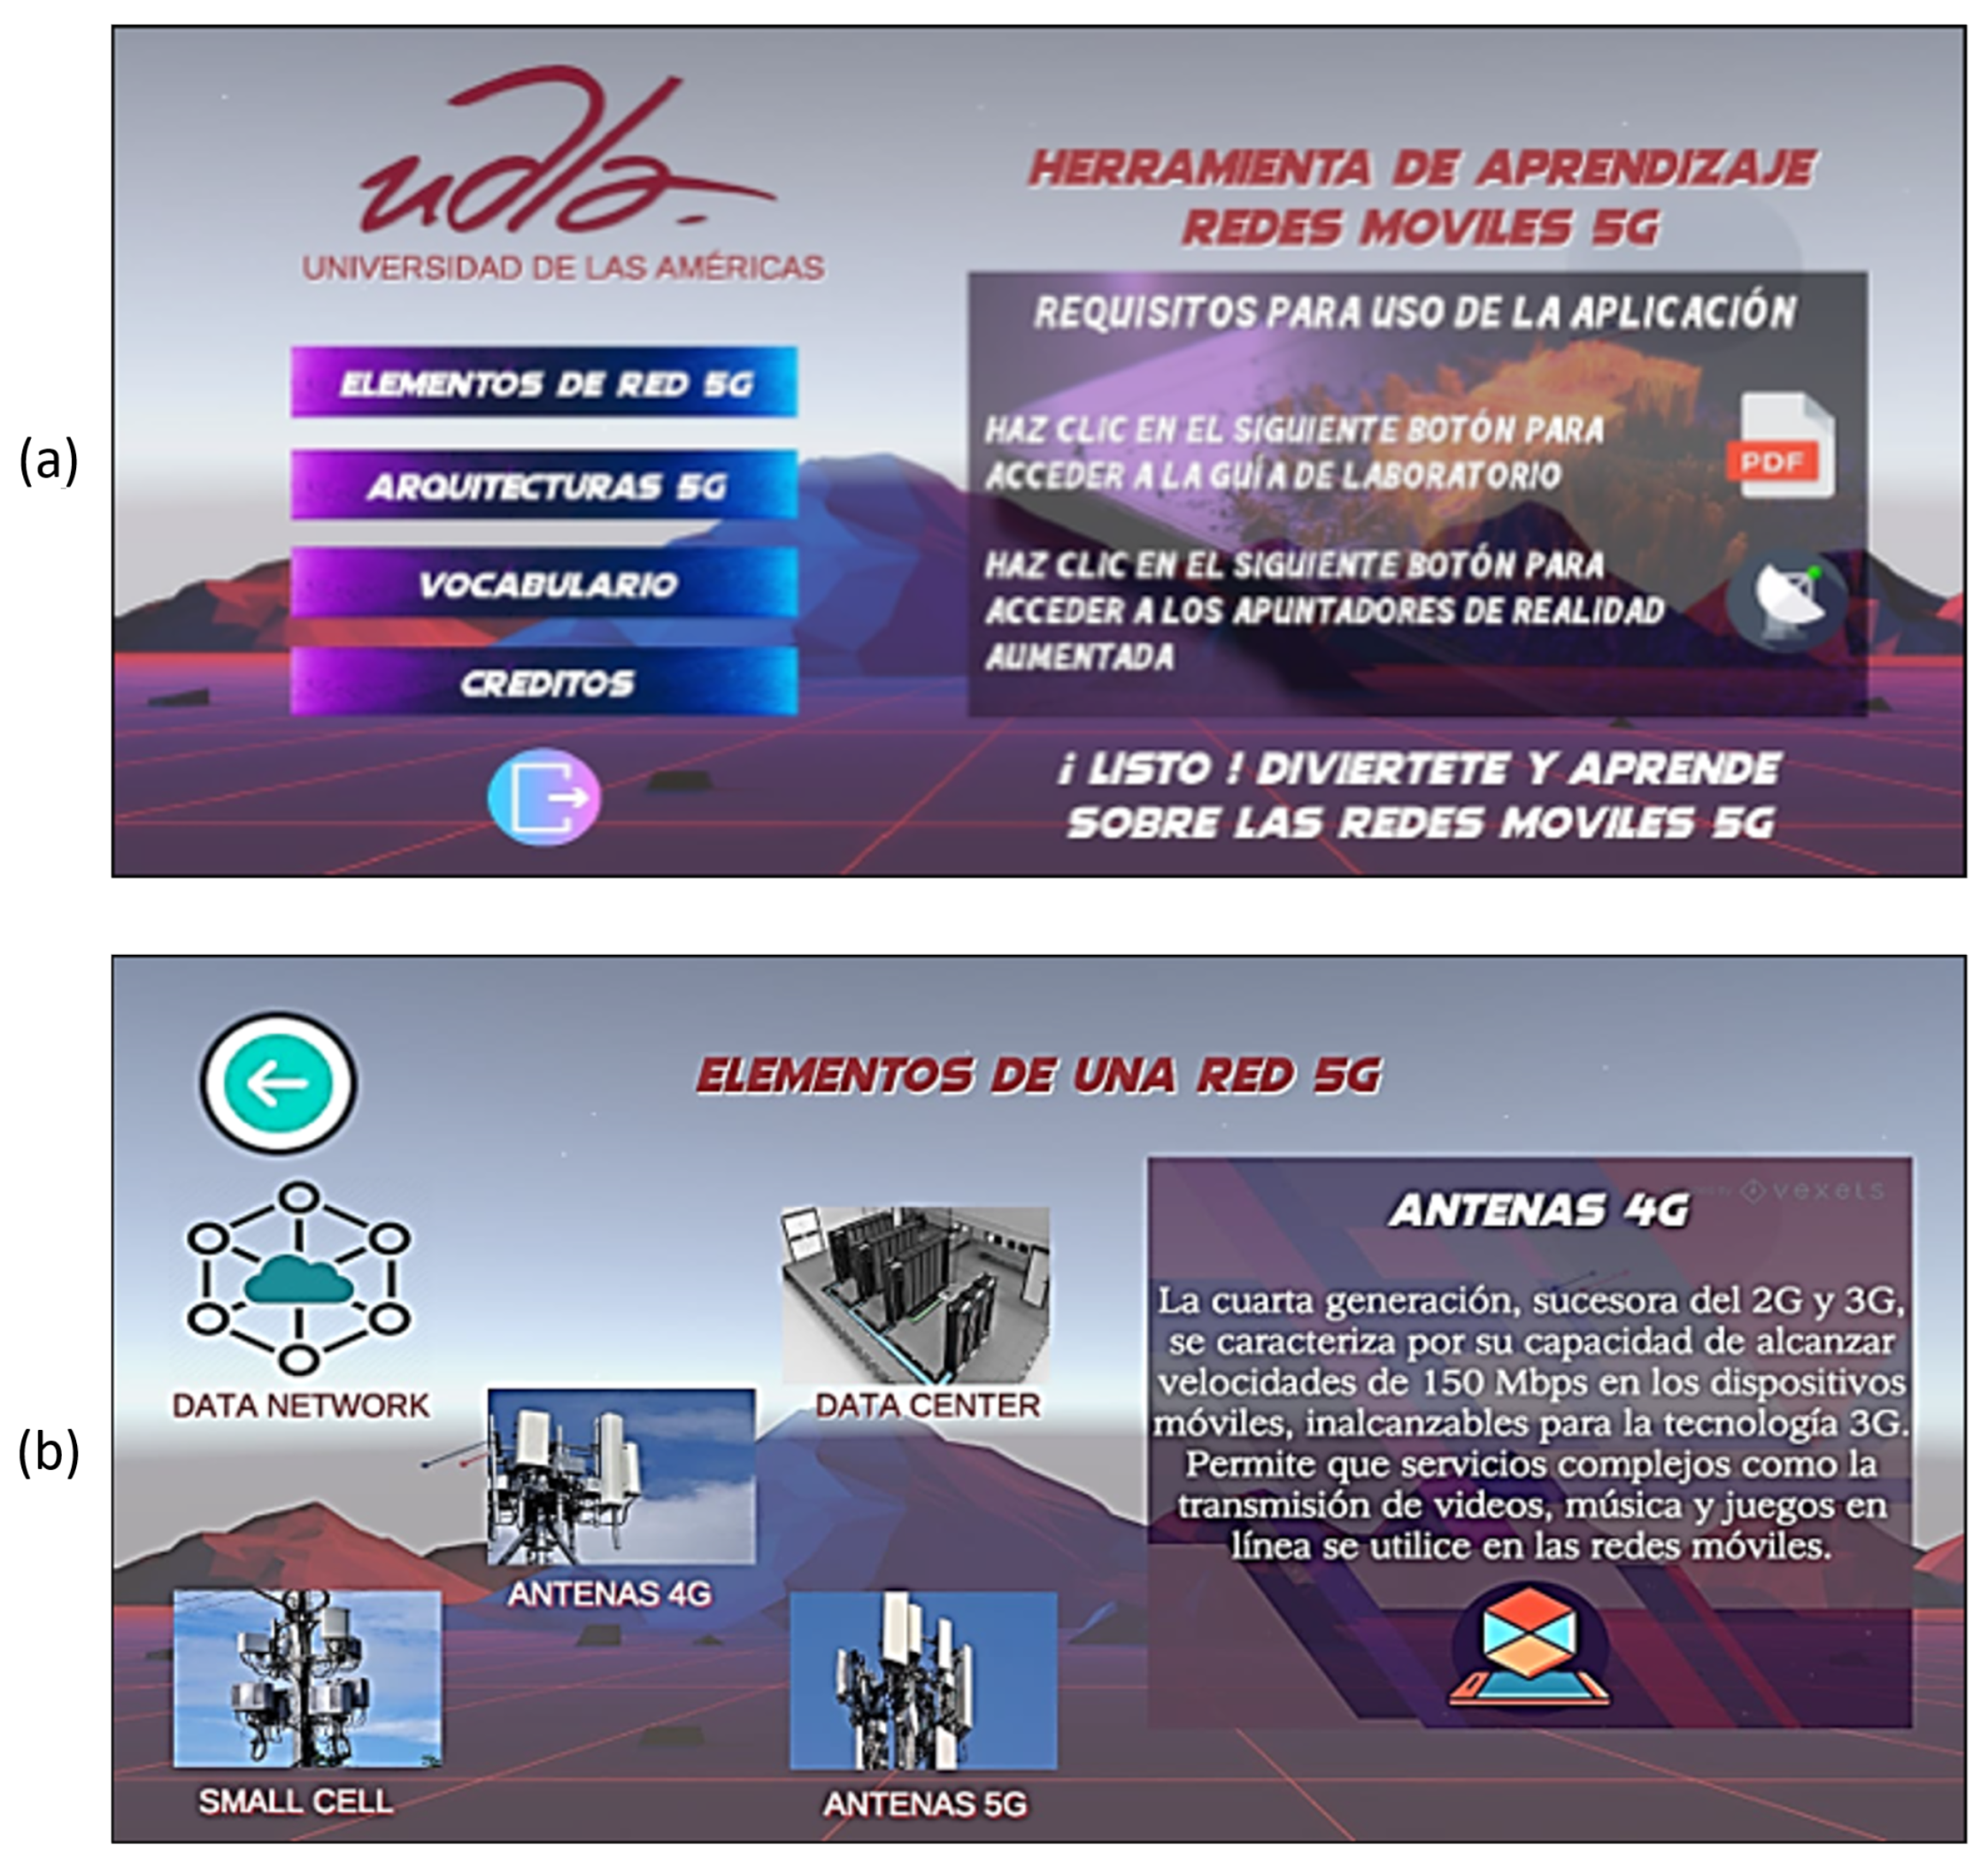
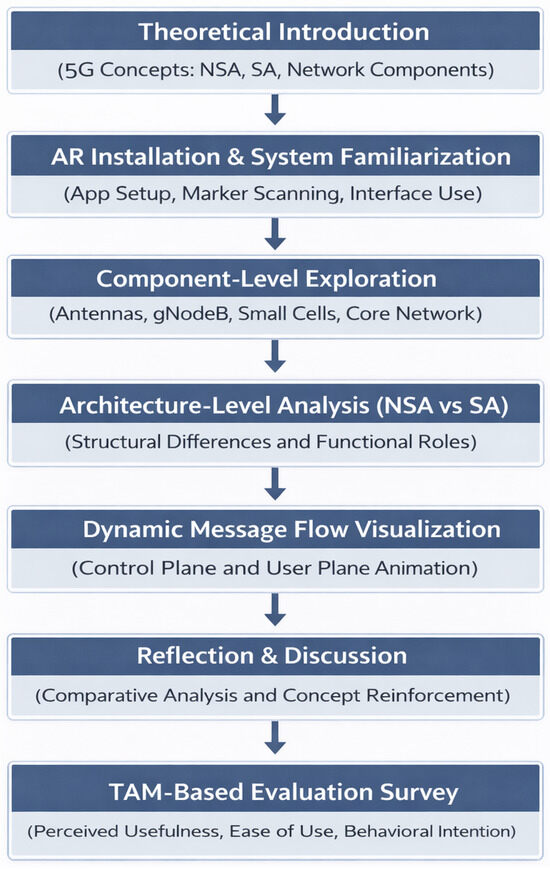
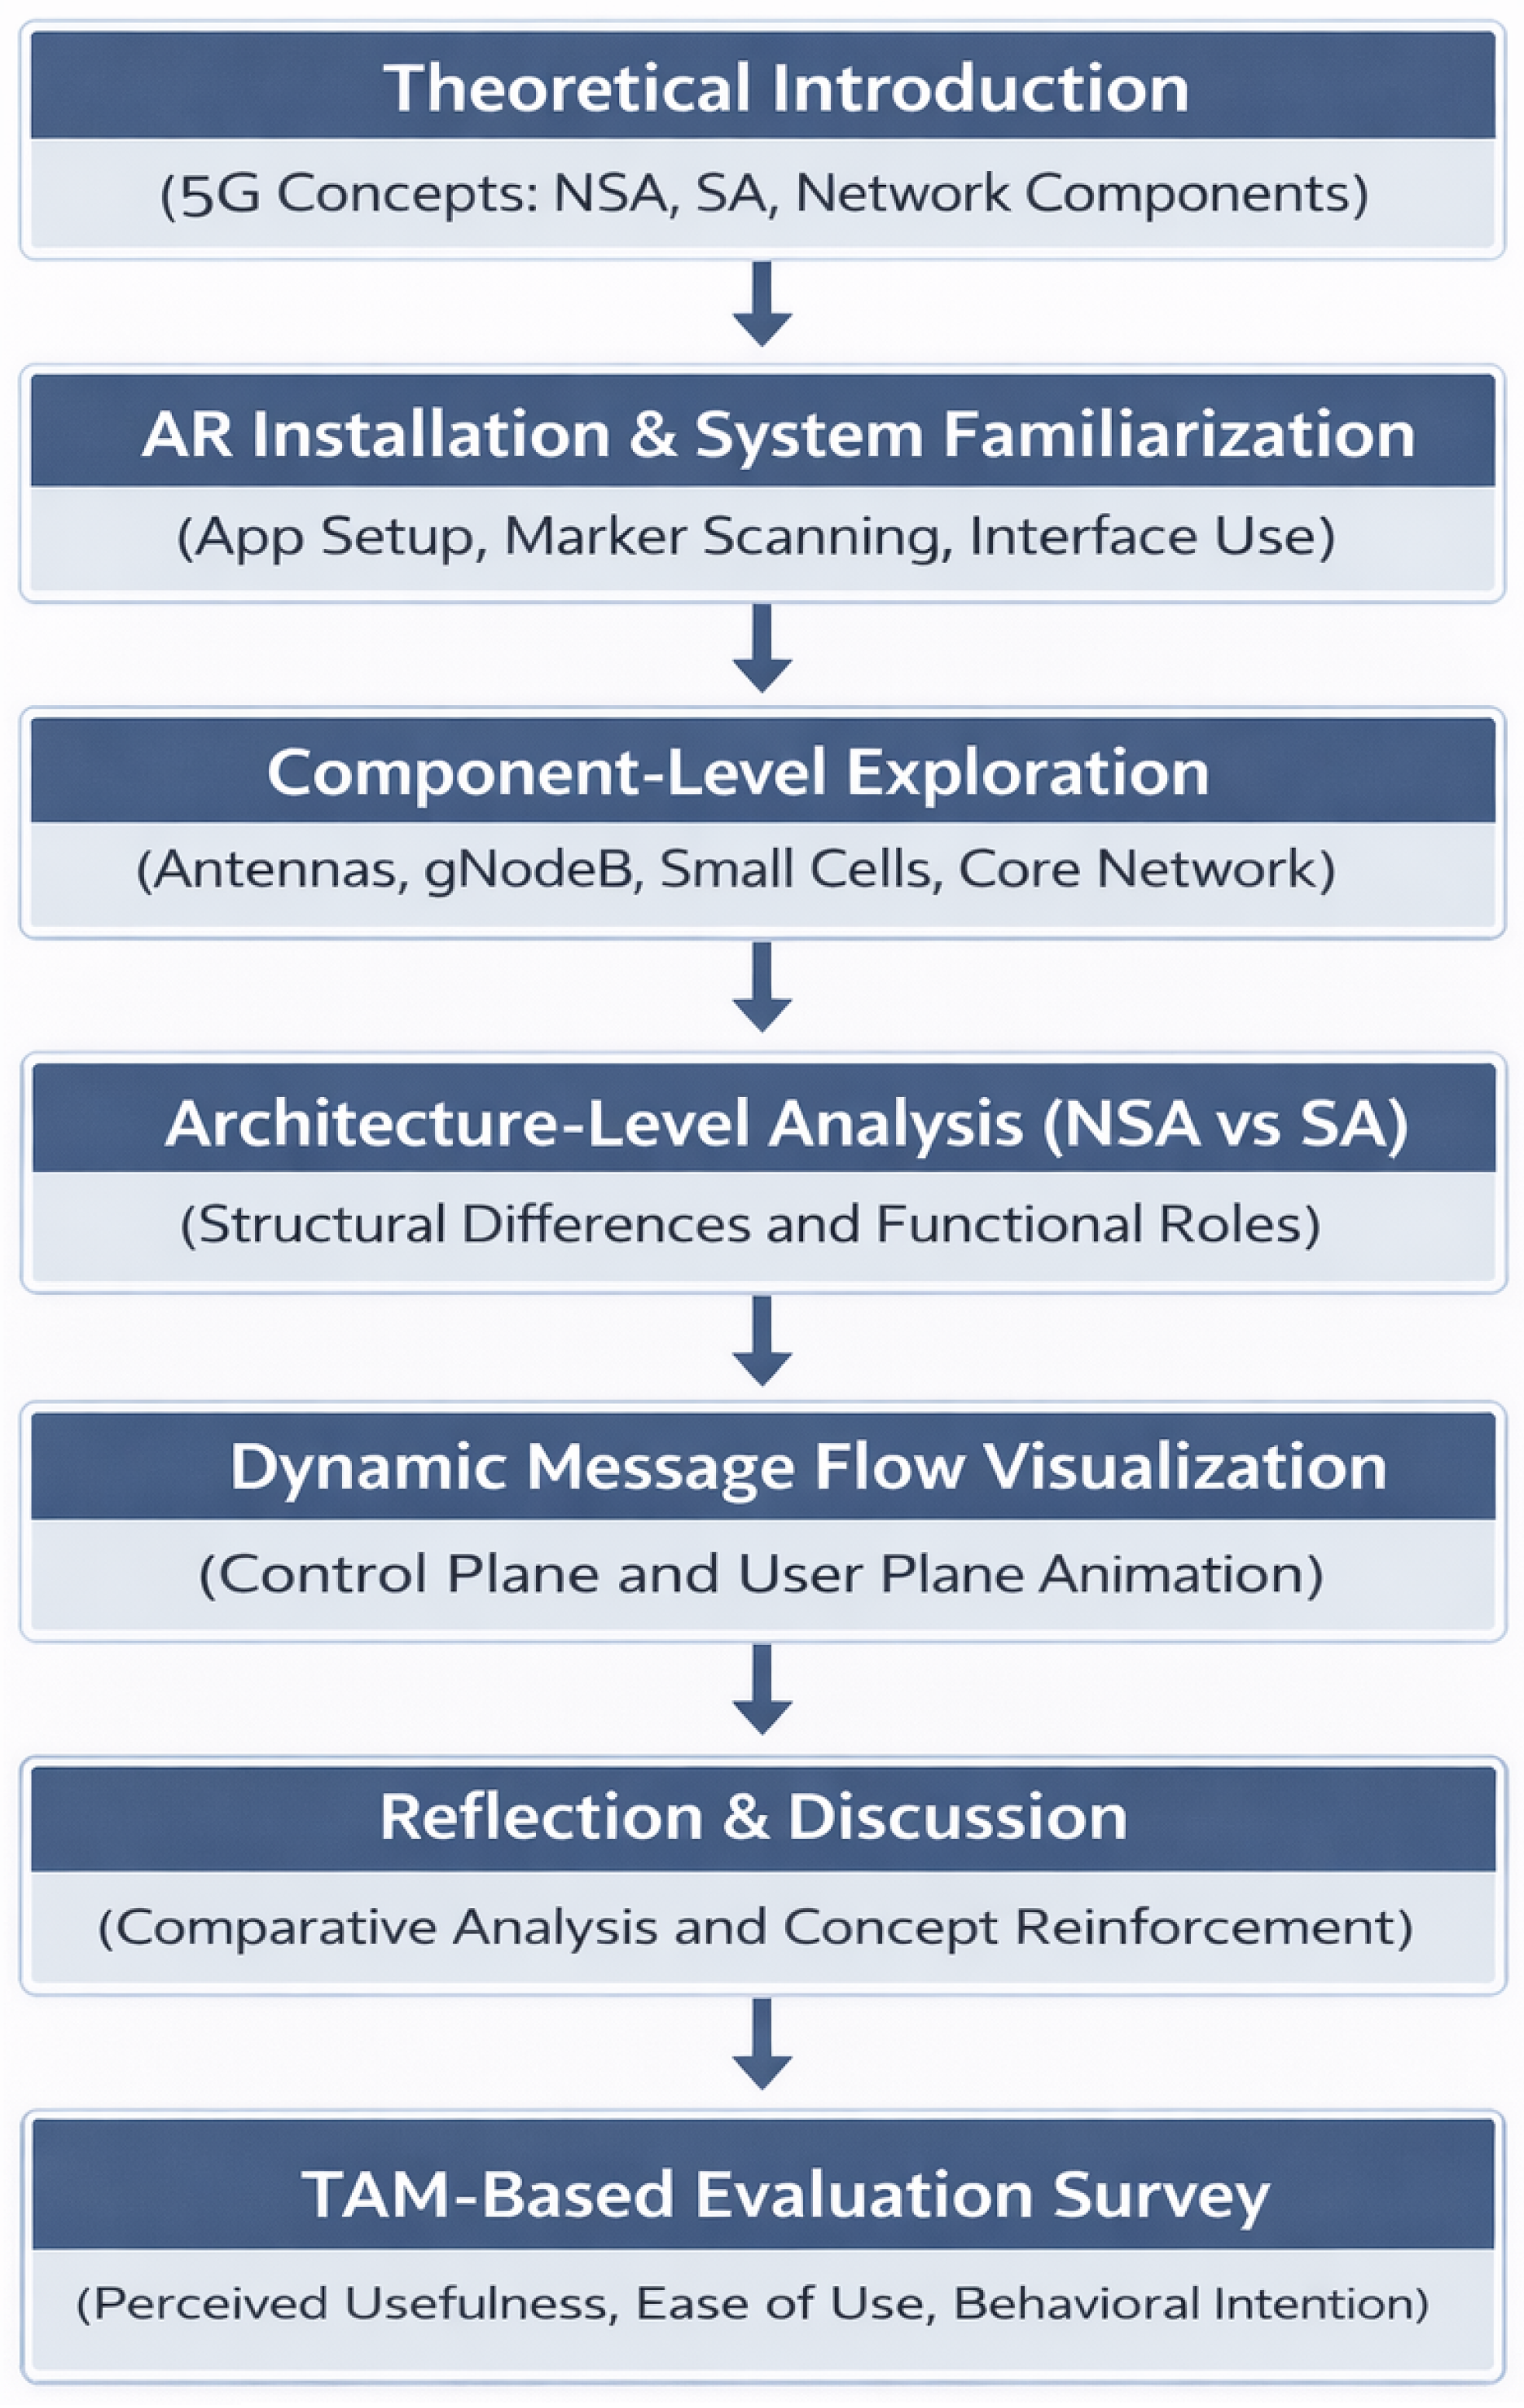
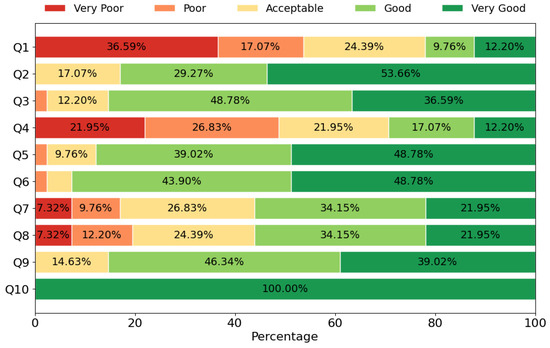
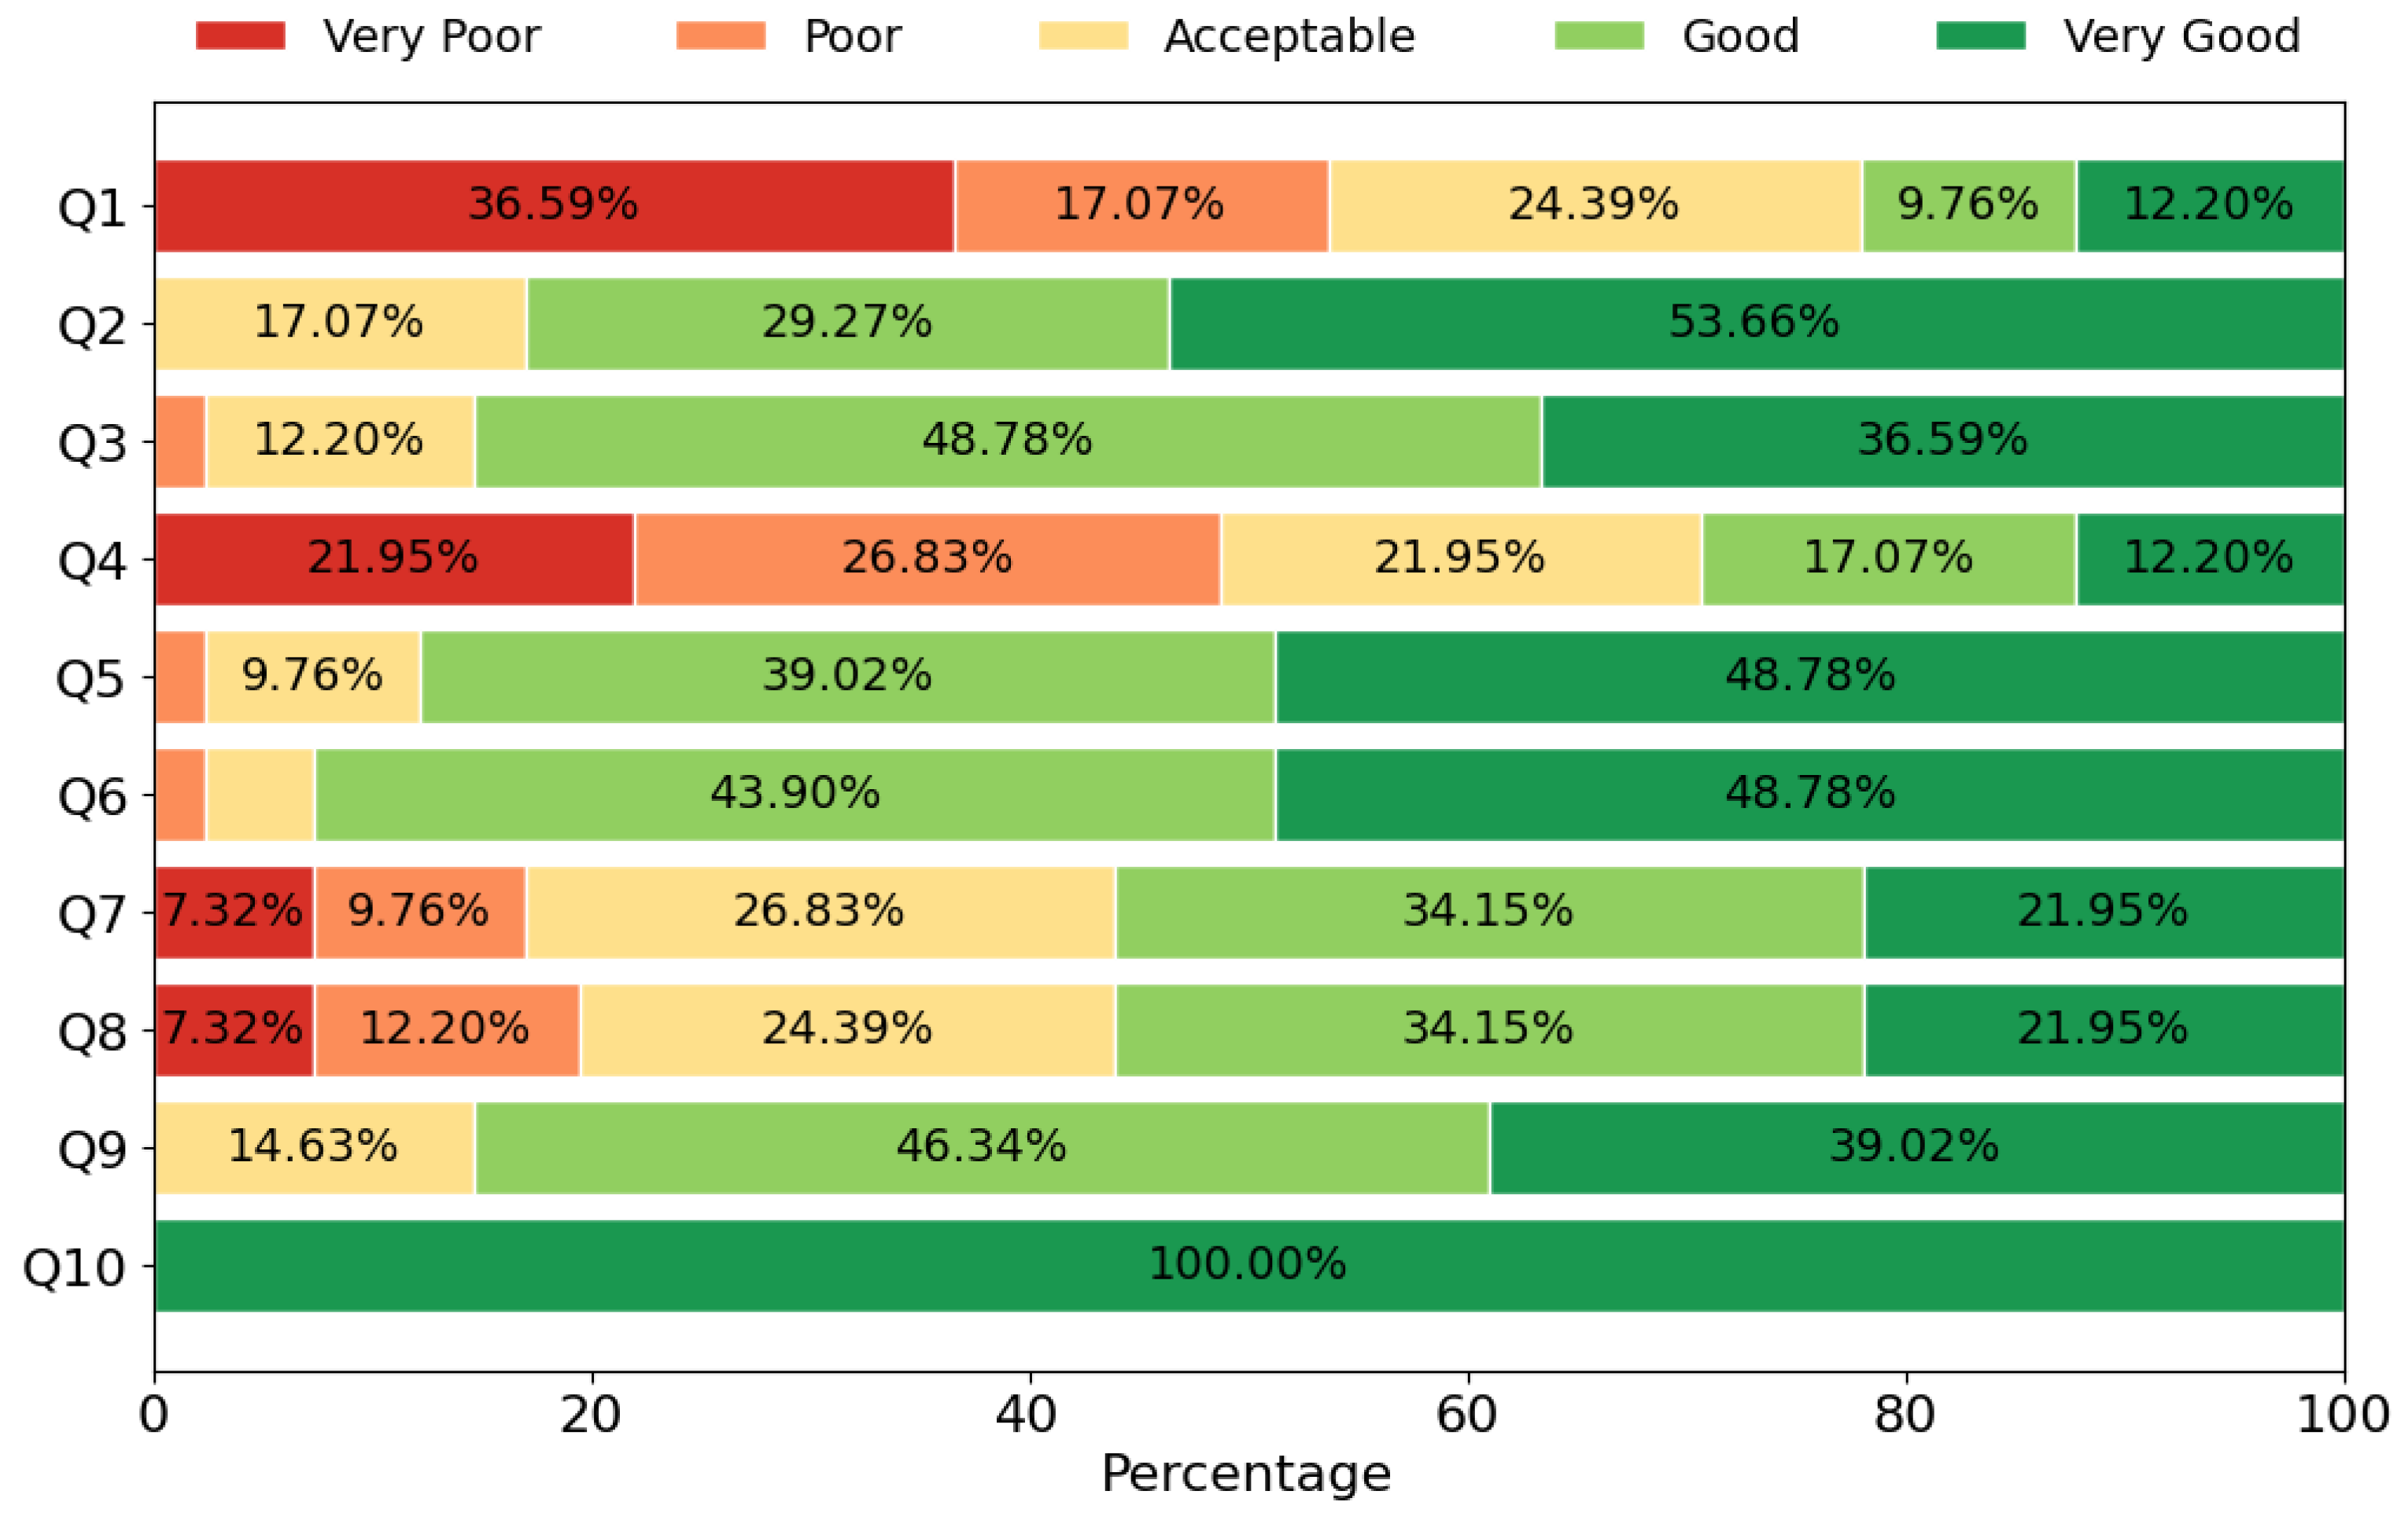

Disclaimer/Publisher’s Note: The statements, opinions and data contained in all publications are solely those of the individual author(s) and contributor(s) and not of MDPI and/or the editor(s). MDPI and/or the editor(s) disclaim responsibility for any injury to people or property resulting from any ideas, methods, instructions or products referred to in the content. |
© 2026 by the authors. Licensee MDPI, Basel, Switzerland. This article is an open access article distributed under the terms and conditions of the Creative Commons Attribution (CC BY) license.