1. Introduction
International financial integration in emerging Asia is neither uniform nor constant. Periods of calm reveal modest co-movement, but stress episodes, whether sparked by macro policy turns, funding shocks, or geopolitical ruptures, produce abrupt, system-wide synchronisation of risks. A large literature converges on two regularities: (i) connectedness is time-varying and intensifies in crises, and (ii) transmission is hierarchical, flowing from global benchmarks and macro-uncertainty toward smaller, more open markets (
Diebold and Yılmaz 2014;
Antonakakis and Gabauer 2017;
Baruník and Křehlík 2018;
Naeem et al. 2023). These patterns are especially salient for ASEAN economies, where trade openness, foreign investor participation, and policy sensitivity render local markets highly receptive to external shocks (
International Monetary Fund 2016;
Lien et al. 2018). Recent empirical work and regional surveillance reports show that ASEAN equity and bond markets react strongly to shifts in global risk appetite and US monetary policy, with episodes such as the 2008 global financial crisis, the 2013 taper tantrum, and the COVID-19 shock generating disproportionately large spillovers into ASEAN asset prices and capital flows (
International Monetary Fund 2016;
Lien et al. 2018;
Naeem et al. 2023). Taken together, these features suggest that ASEAN financial integration is state-dependent, tightening when global uncertainty rises and risk sentiment deteriorates.
Methodologically, connectedness measured via generalized forecast-error variance decompositions (GFEVD) maps a system’s shock-sharing architecture into intuitive indices such as the Total Connectedness Index (TCI), directional TO and FROM, and NET spillovers, without relying on arbitrary shock orderings (
Diebold and Yılmaz 2014). Allowing parameters to evolve through time-varying-parameter VARs (TVP–VARs) captures regime shifts that rolling windows tend to blur (
Antonakakis and Gabauer 2017;
Gabauer 2021). Frequency-domain refinements further show that crisis-era surges are disproportionately low frequency (long horizon), consistent with slow-moving forces knitting markets together precisely when conditions deteriorate (
Baruník and Křehlík 2018). Within this framework, two top-down channels are particularly relevant for emerging Asia. Economic Policy Uncertainty (EPU) rises around salient fiscal, monetary, and regulatory events and is empirically linked to higher volatility and tighter co-movement (
Baker et al. 2016). Geopolitical Risk (GPR) transmits stress globally through trade, energy, and sanction channels, again elevating market-wide risk sharing (
Caldara and Iacoviello 2022). In emerging Asia, both indices are reliable barometers of outside-in propagation from global to regional markets (
Naeem et al. 2023;
Youssef et al. 2021).
A complementary bottom-up mechanism is investor attention. Investors are attention-constrained and shift focus toward salient risks in times of stress, and modern search behaviour therefore provides a real-time, non-price proxy for information demand (
Kahneman 1973;
Sims 2003). Spikes in the Google Search Volume Index (GSVI) anticipate higher turnover and volatility and help explain short-horizon co-movement (
Da et al. 2011;
Vlastakis and Markellos 2012;
Choi and Varian 2012;
Preis et al. 2013). At longer horizons, GARCH–MIDAS models link a slow-moving component of volatility to macro-financial drivers. When the slow driver is an attention or sentiment factor, volatility persistence and its economic share (VR%) remain sizable and interpretable (
Engle et al. 2013;
Ghysels et al. 2016;
Brogaard and Detzel 2015). However, relatively few studies provide a unified framework that jointly models time-varying spillovers, macro-uncertainty, and investor attention for ASEAN markets.
This paper integrates these perspectives in an ASEAN-focused setting. First, we assemble a regional investor-sentiment (IS) measure from country-level GSVI across five macro policy topics (stock market, inflation, crisis, politics, economy) using principal component analysis, yielding a parsimonious behavioural state variable that preserves local information search while aggregating across the ASEAN-5. Second, we estimate a TVP–VAR connectedness system that includes ASEAN equities, global benchmarks (MSCI EM, S&P 500), and macro-uncertainty nodes (EPU, GPR), enabling a time-resolved map of TCI, TO/FROM, and NET roles. Third, we link the long-run volatility of each market to IS with a GARCH–MIDAS specification and stress-test this channel by estimating an alternative EPU-based MIDAS model, which replaces IS with EPU as the slow driver, in order to gauge complementarity rather than redundancy (
Baker et al. 2016;
Engle et al. 2013).
Our approach brings together two angles that are often analysed separately. On the network side, we document a persistent core–periphery topology: macro-uncertainty and global equity benchmarks act as net transmitters, while ASEAN equities act as net receivers, with state dependence that tightens in crises (
Diebold and Yılmaz 2014;
Antonakakis and Gabauer 2017). On the volatility side, we show that a regional, Google-based sentiment factor is a material, negative driver of the slow component of volatility, even after controlling for global uncertainty, which is consistent with an attention-based view of risk that complements top-down uncertainty shocks (
Da et al. 2015;
Ghysels et al. 2016). Incorporating gold and clean-energy equities clarifies the role of defensive and thematic assets: gold behaves as a mild net receiver (hedge and safe haven), while clean energy is regime-dependent, sometimes transmitting around policy or transition news and sometimes absorbing shocks when commodity and funding conditions dominate (
Baur and Lucey 2010;
Baur and McDermott 2010).
We contribute to the literature in four ways. First, we provide a unified, time-resolved map of ASEAN spillovers that links when integration tightens to why it does so, by relating spikes in uncertainty and shifts in attention to changes in connectedness. Second, we introduce a region-specific, PCA-based IS measure that captures local narratives without sacrificing cross-market comparability. Third, we quantify the economic share of the slow volatility component (VR%) attributable to attention and show its robustness to replacing attention with EPU in MIDAS. Fourth, we place green and safe-haven assets inside the same network to explain why diversification compresses, but does not vanish, in crises. The combined evidence speaks to (i) investors who require regime-aware hedging and budgeting, (ii) policymakers whose communication and regional backstops can dampen outside-in propagation, and (iii) issuers, especially in green finance, whose issuance costs are time-varying with integration and uncertainty (
International Monetary Fund 2016;
Lien et al. 2018;
Baker et al. 2016;
Caldara and Iacoviello 2022).
Finally, our design is deliberately parsimonious and transparent. We treat EPU and GPR as background transmitters in the TVP–VAR network, and we use EPU only as a robustness add-on in the GARCH–MIDAS block, reserving the core slow driver for local attention to preserve a regional behavioural interpretation. In doing so, we align with a growing consensus: integration is state-dependent, uncertainty and attention are complementary channels of contagion, and diversification compresses most when it is most valuable (
Diebold and Yılmaz 2014;
Baruník and Křehlík 2018;
Baker et al. 2016;
Da et al. 2015).
The remainder of the paper is organised as follows.
Section 2 develops the theoretical framework and states testable hypotheses, combining a time-varying connectedness view of market integration with an attention-based account of volatility.
Section 3 describes the data and the construction of the ASEAN investor-sentiment index from Google searches.
Section 4 details the econometric design, TVP–VAR connectedness and GARCH–MIDAS volatility, along with estimation choices and identification.
Section 5 presents the dynamic connectedness results.
Section 6 reports the GARCH–MIDAS estimates and variance-share diagnostics, linking the slow component of volatility to investor attention.
Section 7 provides robustness checks and extensions.
Section 8 discusses implications for investors, policymakers, and issuers.
Section 9 concludes with limitations and directions for future research.
2. Theoretical Framework and Hypotheses
2.1. Market Integration and Crisis Transmission
International market integration can be understood as the degree to which demand and supply shocks arising in one market are transmitted to other markets because investors price common risks, rebalance portfolios jointly, and face correlated funding and policy constraints. Decades of evidence show that this integration is time-varying, not fixed: transmission tightens in stress and loosens in calm periods (
Bekaert and Harvey 1995;
Bekaert et al. 2005). Modern connectedness approaches make this idea operational by tracking, over time, how much of each market’s forecast uncertainty is attributable to other markets’ shocks rather than its own. The resulting Total Connectedness Index (TCI) rises when common shocks intensify or when propagation mechanisms strengthen; conversely, it falls when markets decouple. Allowing model parameters to evolve (TVP–VARs) captures these regime shifts more faithfully than fixed-coefficient or long rolling-window designs (
Diebold and Yılmaz 2014;
Antonakakis and Gabauer 2017;
Gabauer 2021).
Crisis transmission follows from three well-documented forces. First, large common shocks global risk, policy surprises, and geopolitical events simultaneously elevate conditional volatility across markets and increase the fraction of fluctuations explained by external disturbances, pushing the TCI up. Second, financial intermediation constraints tighten in stress (margin spirals, liquidity spirals), steepening cross-market propagation as balance-sheet capacity shrinks (
Brunnermeier and Pedersen 2009;
Adrian and Shin 2010). Third, correlations are state-dependent; they rise in down markets, so co-movement intensifies when risk aversion and uncertainty surge (
Longin and Solnik 2001;
Forbes and Rigobon 2002). In network terms, the system tilts toward a core–periphery topology: large benchmarks and macro-uncertainty nodes sit at the core with high outward influence, while smaller, more open markets occupy the periphery and absorb incoming shocks (
Billio et al. 2012;
Diebold and Yılmaz 2014).
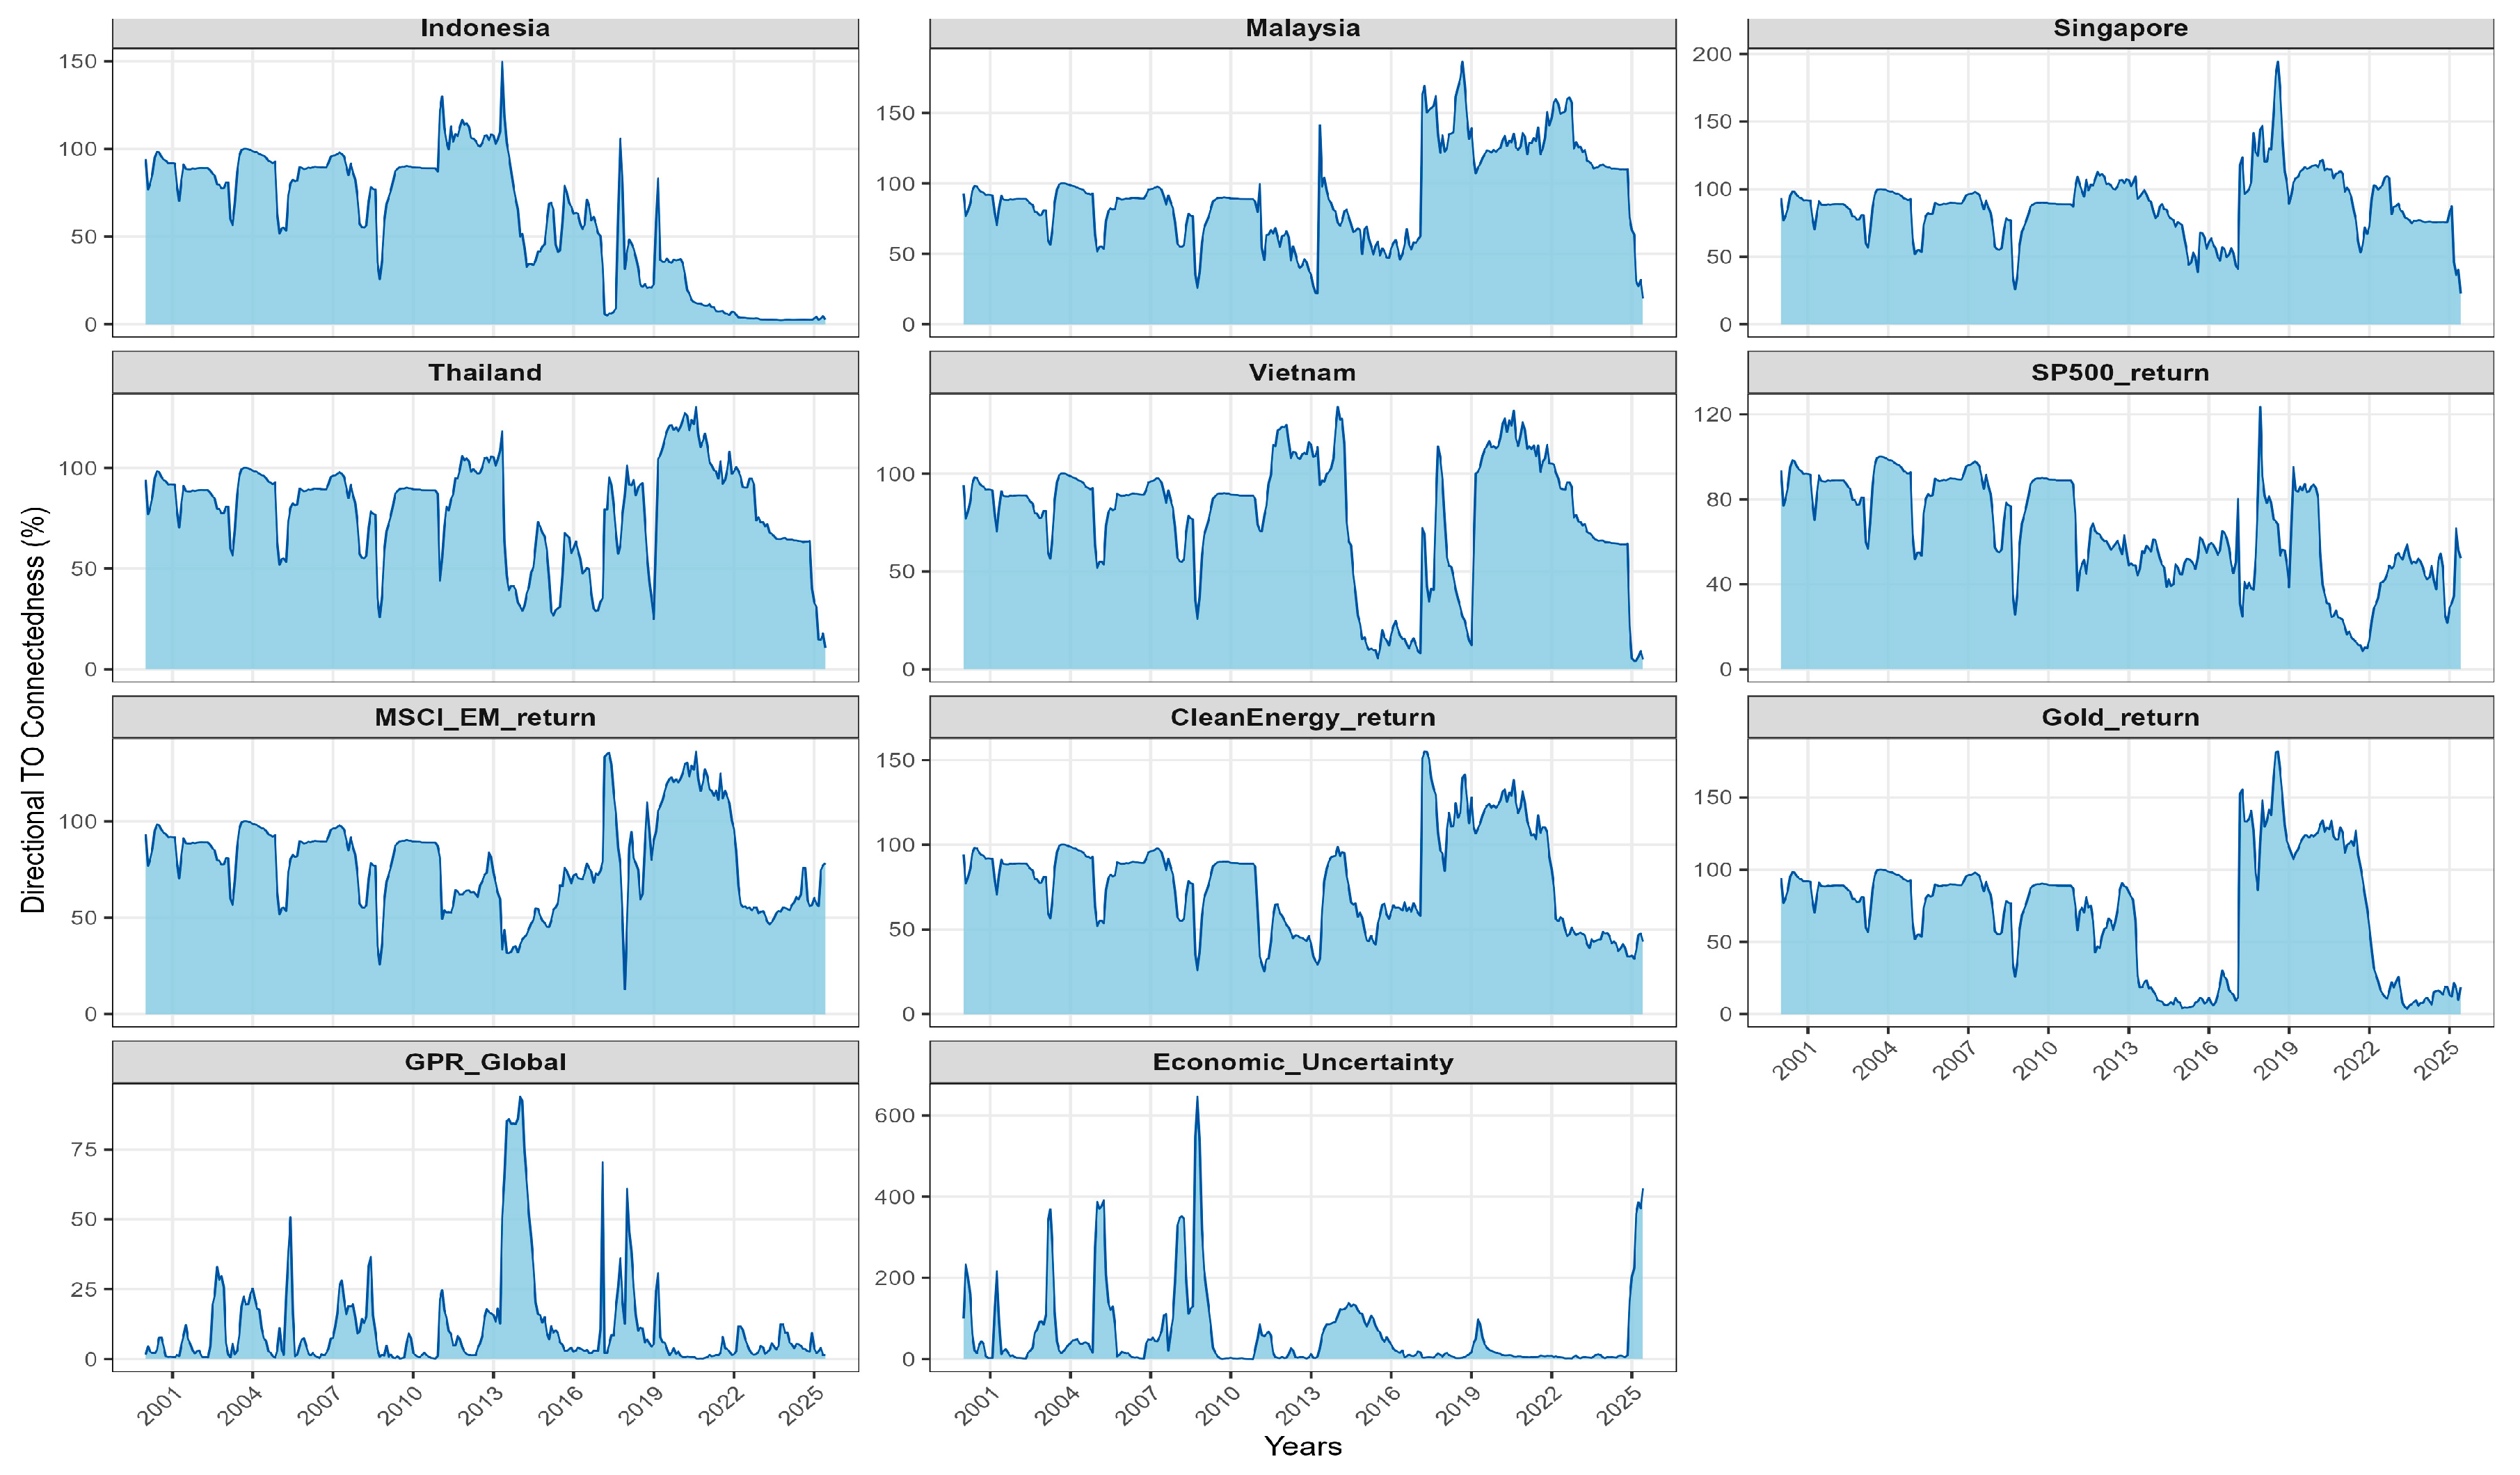
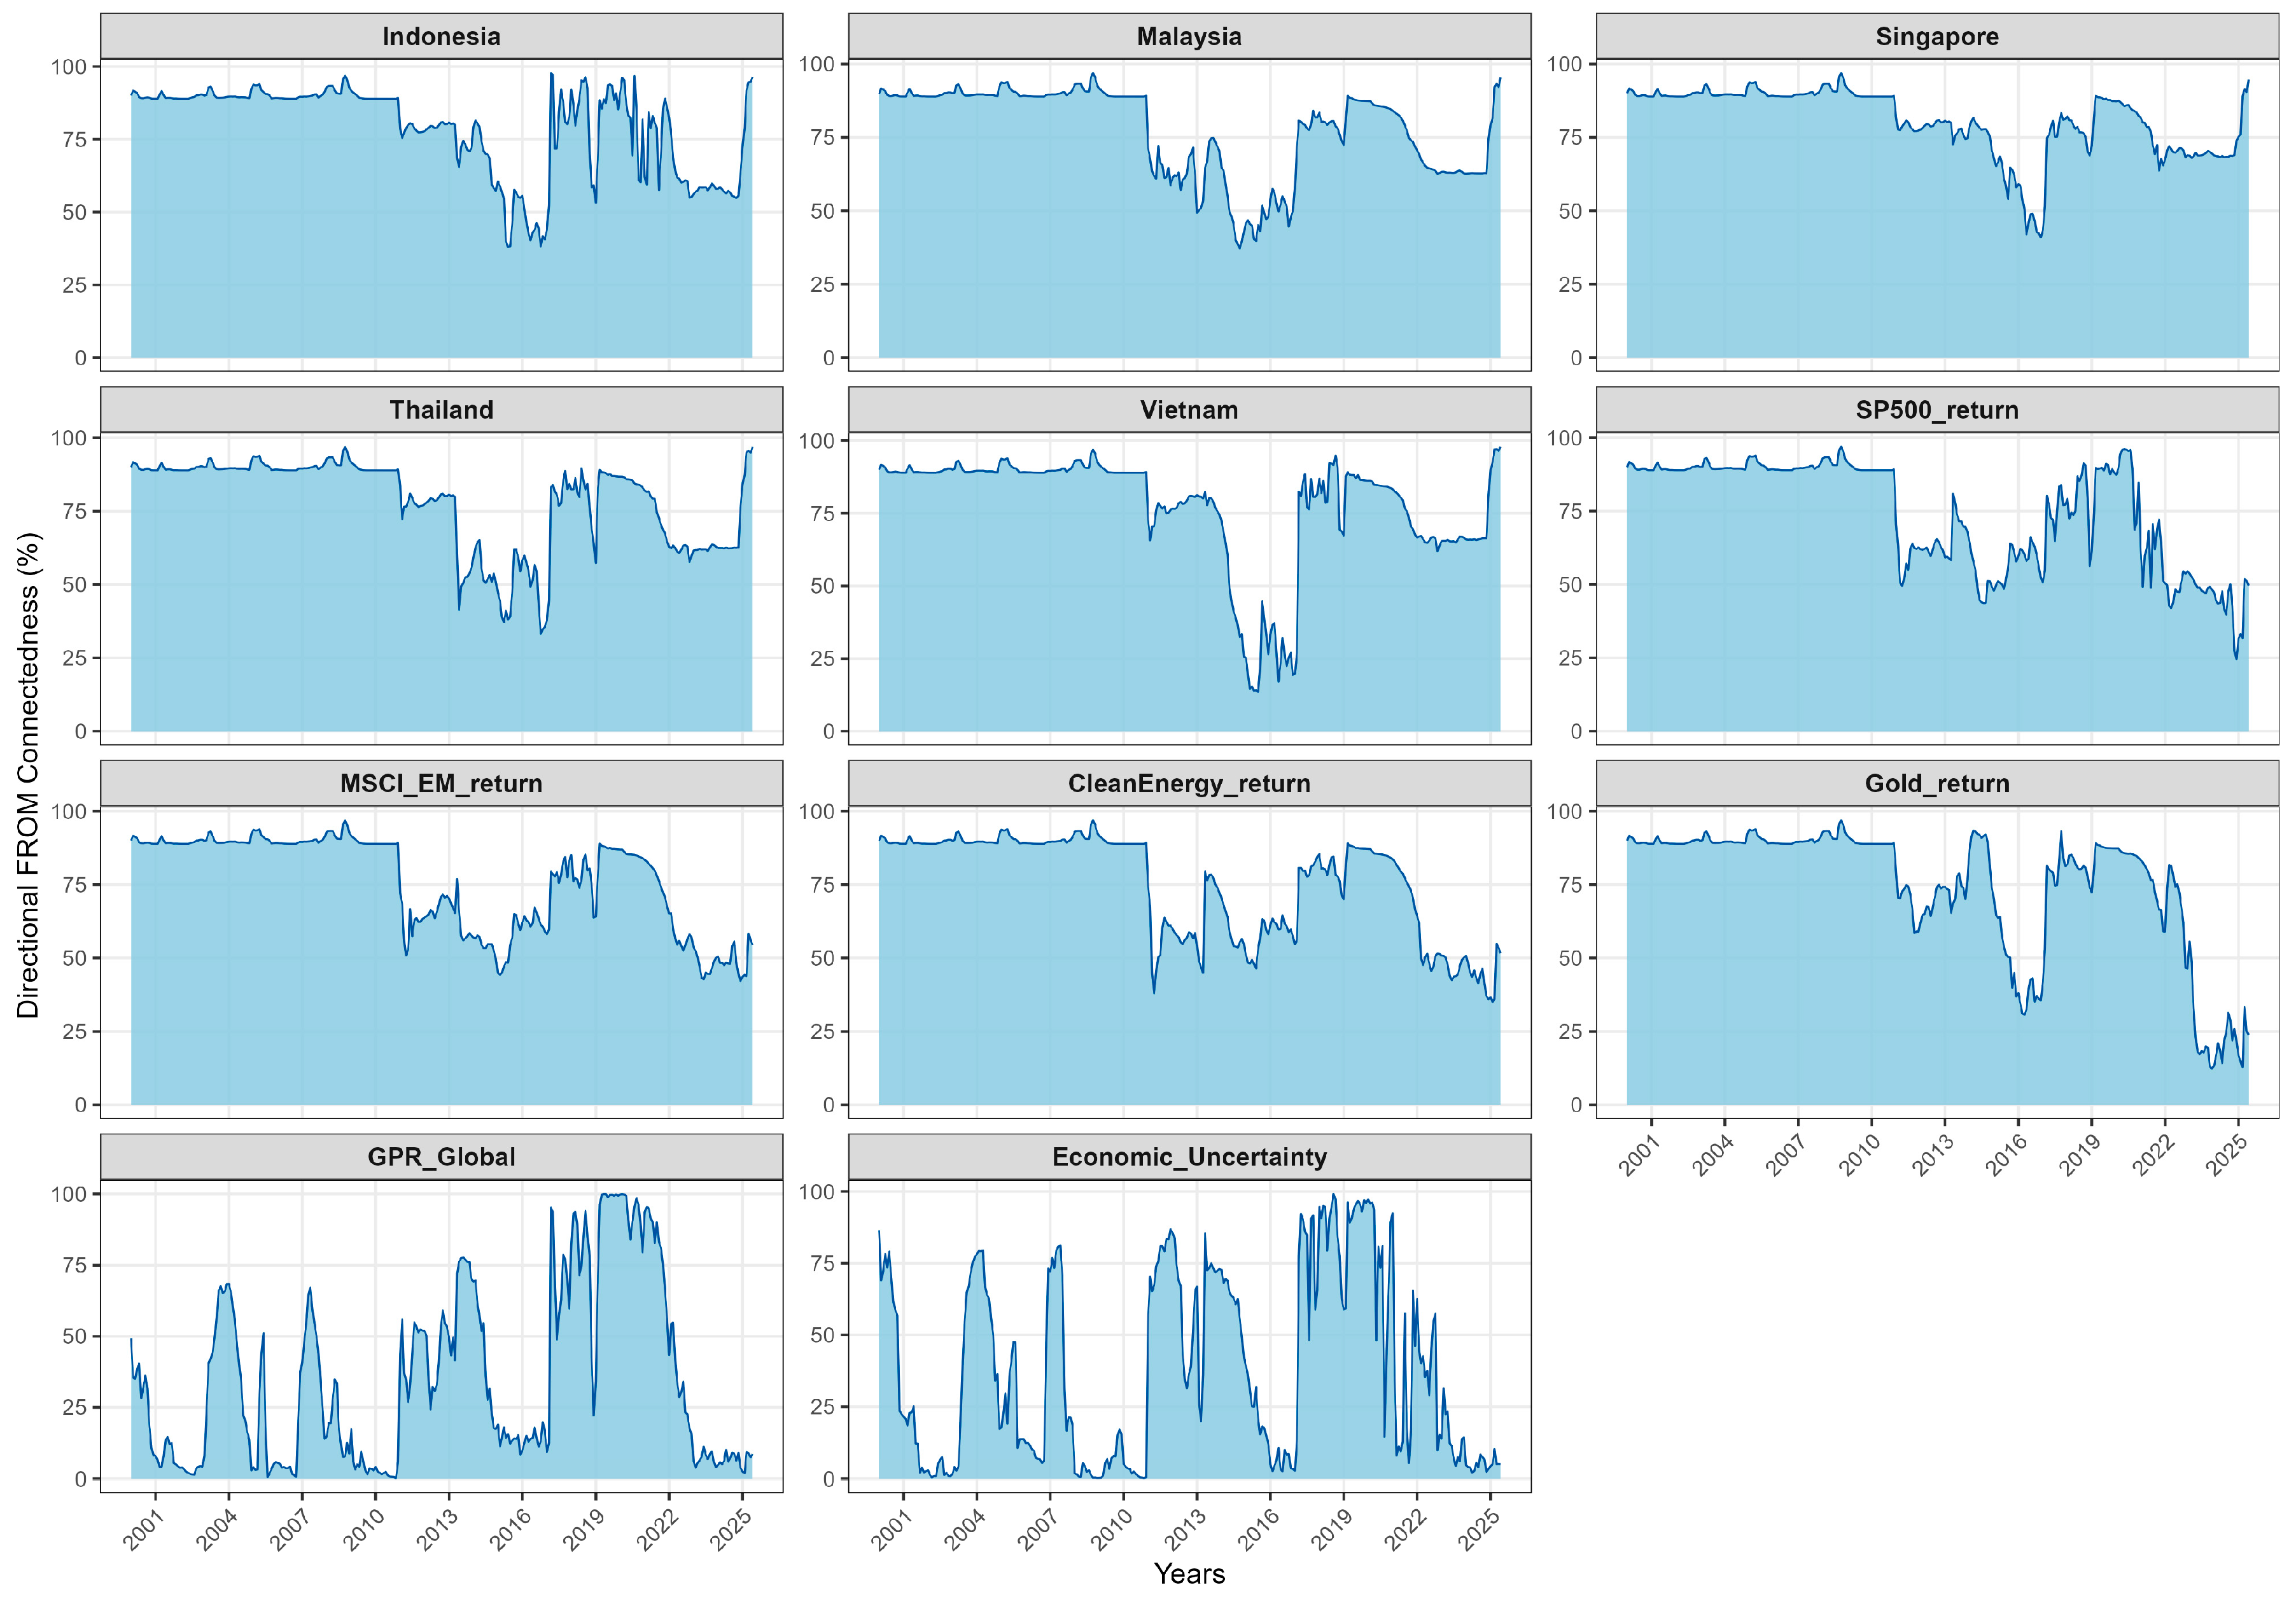
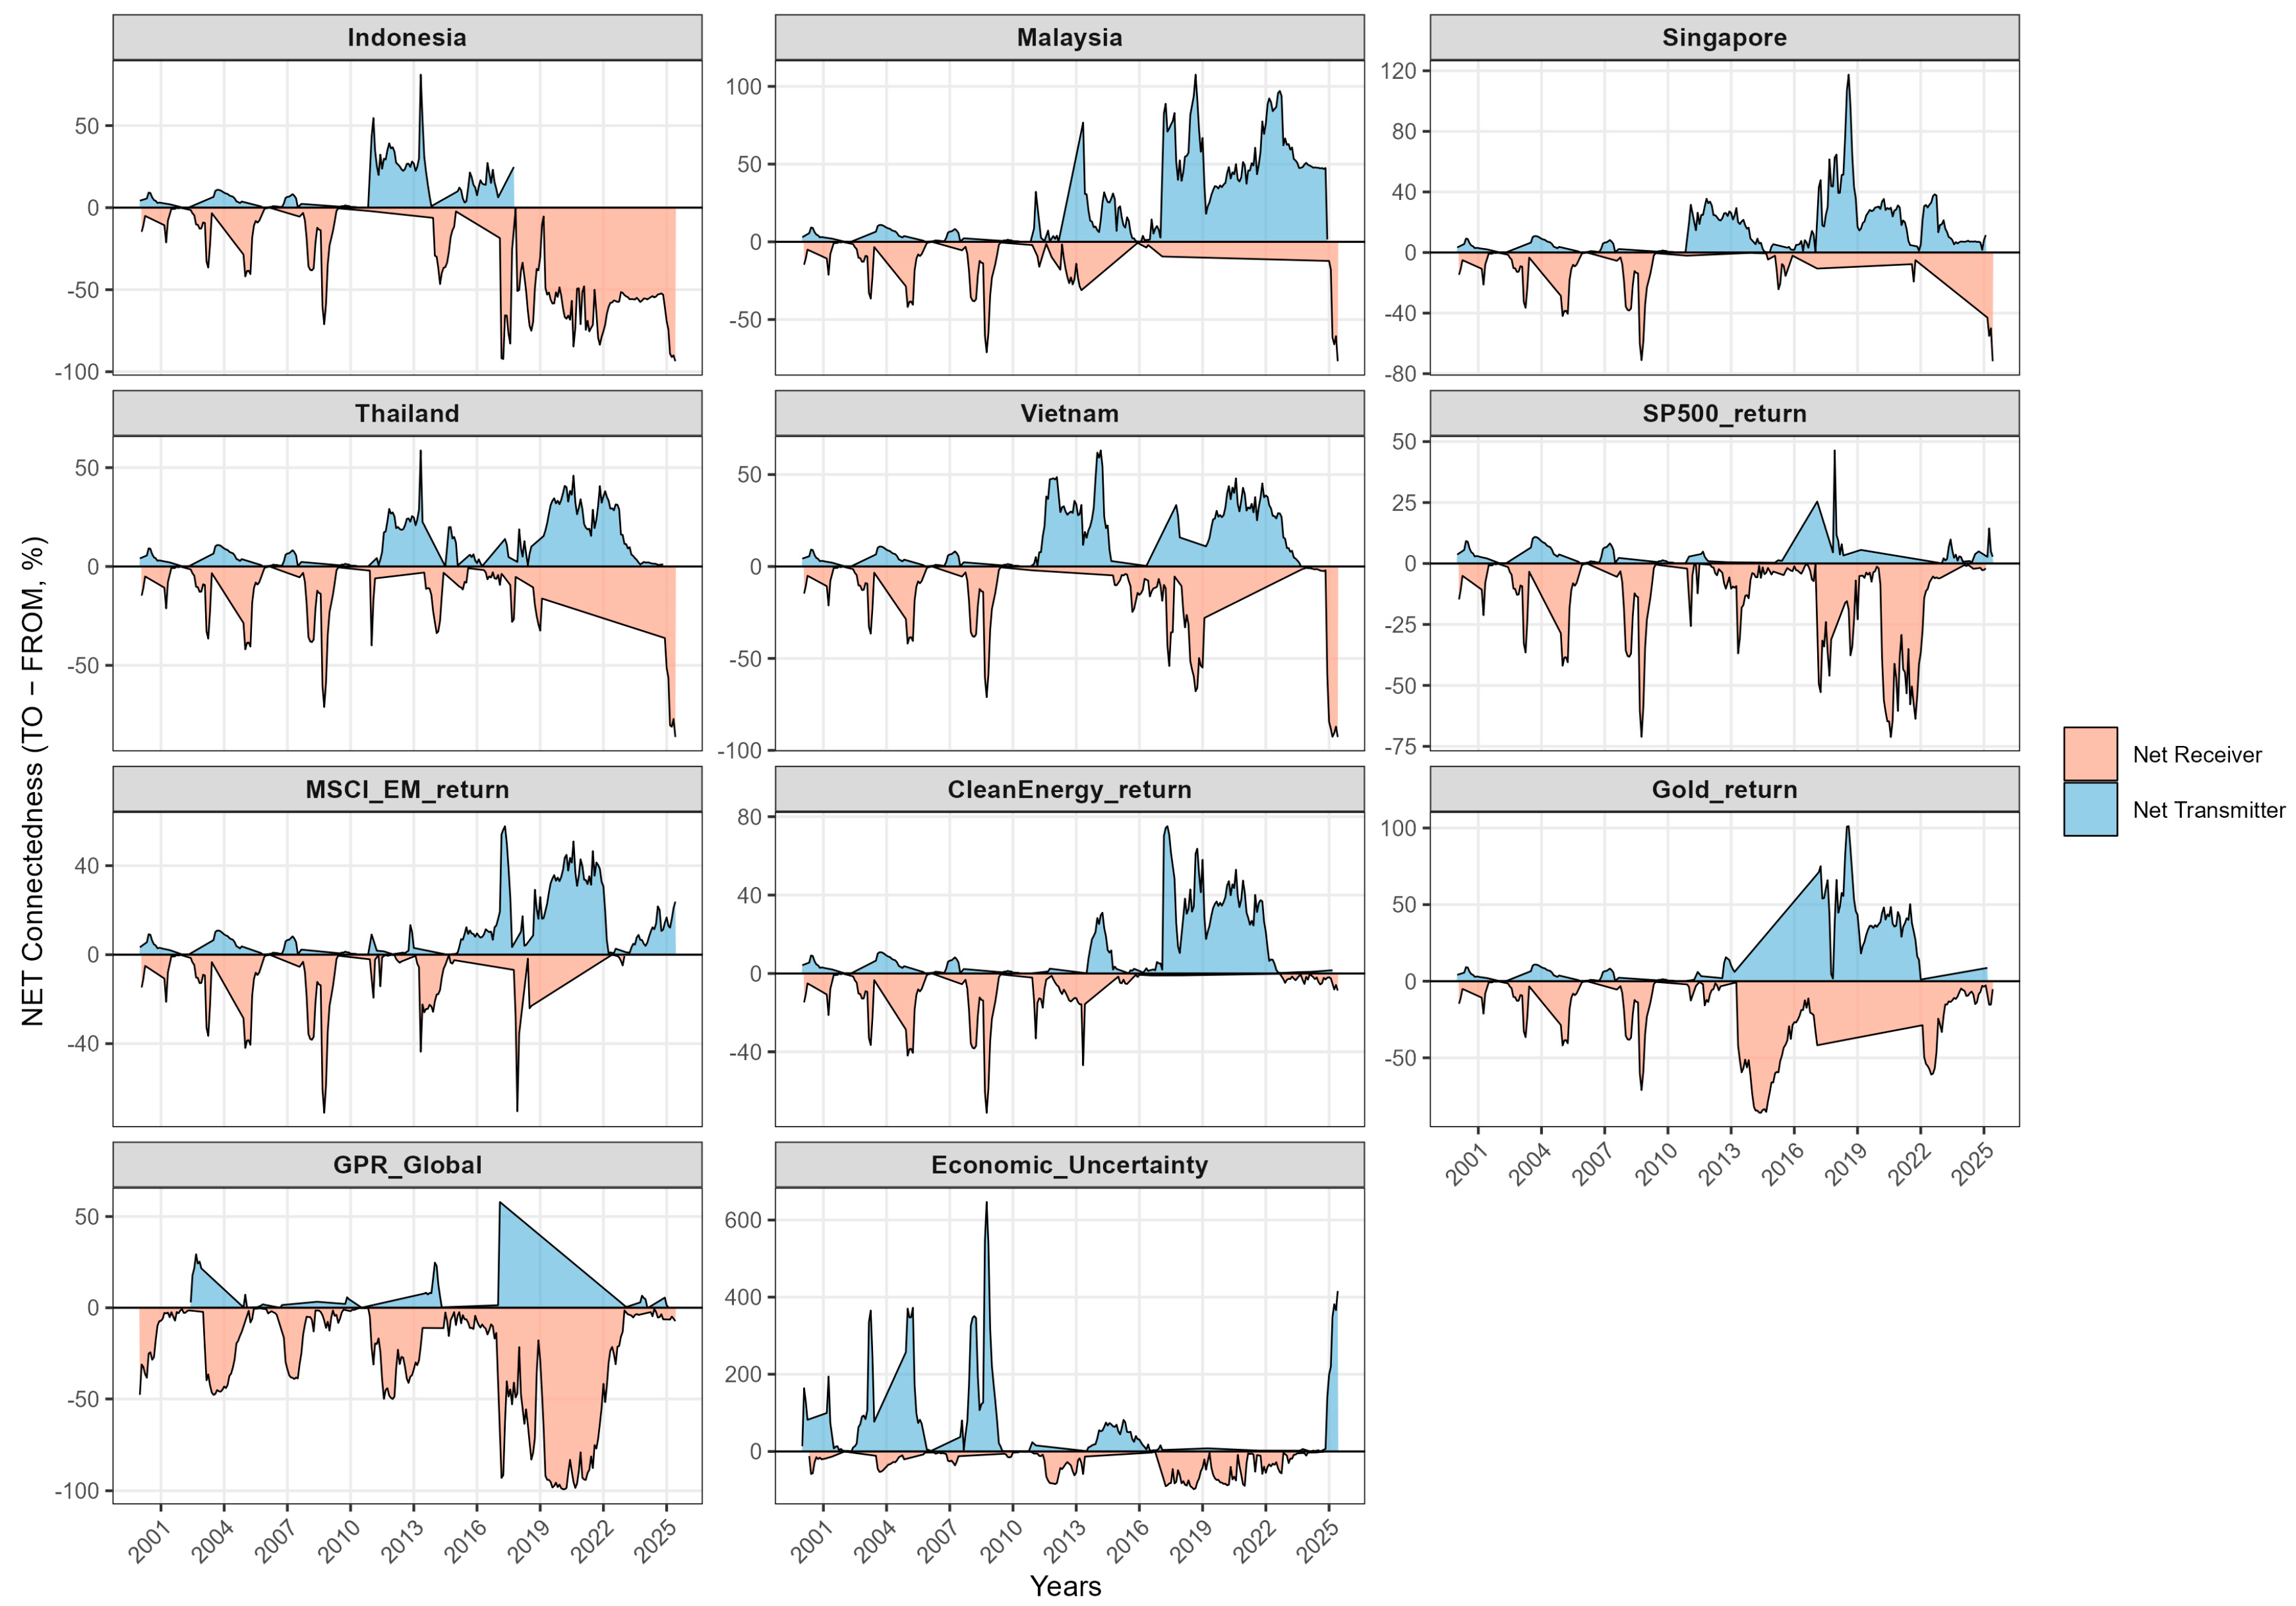
Within this framework, directional spillovers map theory to empirical roles. “TO” captures how much a market transmits to others; “FROM” captures how much it receives; their difference, “NET,” classifies persistent transmitters (positive NET) and receivers (negative NET). A robust empirical finding especially in emerging Asia is that global benchmarks (e.g., MSCI EM, S&P 500) and macro-uncertainty factors act as net transmitters, while local equity markets are net receivers, particularly in turmoil (
International Monetary Fund 2016;
Lien et al. 2018;
Naeem et al. 2023). Frequency-domain connectedness further shows that crisis-era surges are disproportionately low-frequency (long-horizon), consistent with slow-moving forces knitting markets together when conditions worsen (
Baruník and Křehlík 2018).
Two information channels help explain why TCI and directional spillovers behave this way. Economic Policy Uncertainty (EPU) and Geopolitical Risk (GPR) news-based indices that spike around salient events are systematically associated with higher volatility and tighter co-movement, thereby amplifying outward transmission from global to regional markets (
Baker et al. 2016;
Caldara and Iacoviello 2022). In parallel, investor attention, proxied by Google search intensity, surges in crises and is tightly linked to trading and volatility, supplying a behavioral conduit through which uncertainty shocks propagate across venues (
Da et al. 2011,
2015). Together, these channels rationalize TCI spikes and the asymmetric transmitter/receiver pattern observed in stress.
2.2. Attention-Based View of Volatility
A large behavioural and information-economics literature argues that investors are attention-constrained: they selectively process news and reallocate focus toward salient risks, especially in times of stress (
Kahneman 1973;
Sims 2003). In liquid markets, attention shocks manifest as synchronised information demand, order imbalances, and belief revisions that raise trading activity and volatility (
Barber and Odean 2008;
Tetlock 2007). Early work using news counts and media tone shows that negative or high-volume coverage increases trading and risk premia (
Tetlock 2007;
Engelberg and Parsons 2011), while later studies document similar effects using television, newspapers, and online platforms as attention proxies (
Yuan 2015;
Fang and Peress 2009).
Because modern search engines are a primary channel for information acquisition, local information search captured by the Google Search Volume Index (GSVI) provides a timely, non-price proxy for shifts in investor focus. Empirically, spikes in search intensity anticipate higher turnover and volatility and help explain short-horizon co-movement (
Da et al. 2011;
Vlastakis and Markellos 2012;
Preis et al. 2013;
Choi and Varian 2012). This line of work complements earlier evidence based on media and message-board activity (
Barber and Odean 2008;
Antweiler and Frank 2004): across proxies, heightened attention is associated with stronger price impact, greater trading volume, and fatter tails in return distributions. A second strand of studies focuses directly on volatility, showing that attention measures help explain volatility clustering and volatility risk premia beyond traditional macro or financial variables (
Brogaard and Detzel 2015;
Andrei and Hasler 2015).
In a regional setting, attention is both global and local. Global events raise baseline attention everywhere, but country-specific searches capture domestic narratives, language, and policy signals that do not immediately appear in prices or macro indices. Aggregating topic-specific GSVI series across the ASEAN-5 therefore isolates a regional attention factor that tracks slow-moving swings in information demand tied to market, macro, and policy themes. When attention concentrates on risk-laden topics (e.g., crisis, inflation, politics), investors update more frequently, and market makers demand higher compensation for inventory risk, pushing conditional volatility higher. Because principal-component analysis (PCA) yields factors with arbitrary sign, we fix the orientation ex ante so that an increase in IS reflects stronger risk-related search intensity across ASEAN languages. Higher values of IS indicate stronger public information demand, without taking a stand on optimism versus pessimism. Accordingly, the MIDAS coefficient on IS is interpreted as the effect of attention on the long-run volatility component, irrespective of sentiment direction
This attention-based view complements the uncertainty channel. Episodes of elevated Economic Policy Uncertainty (EPU) or Geopolitical Risk (GPR) typically coincide with surges in local search and media coverage, producing a behavioural amplifier of volatility and spillovers: information demand focuses on common risks, cross-sectional attention becomes more correlated, and connectedness rises as markets process the same narratives (
Baker et al. 2016;
Caldara and Iacoviello 2022;
Da et al. 2011). In network terms, heightened attention strengthens the out-degree of macro and global nodes and the in-degree of smaller open markets, tilting the system toward a core–periphery pattern in crises, exactly the topology observed in time-varying connectedness (
Diebold and Yılmaz 2014;
Antonakakis and Gabauer 2017)
2.3. Macro Uncertainty as Background
We treat macro-uncertainty gauges, Economic Policy Uncertainty (EPU) and Geopolitical Risk (GPR), as background barometers that sharpen our reading of short-run spillovers rather than as the core low-frequency driver in the volatility model. Conceptually, these indices spike around policy reversals, geopolitical ruptures, and demand scares, registering shocks that ripple quickly through portfolios. In the connectedness block, they are ideal transmitters: they map top-down news into the network and help explain the directional asymmetry observed when global stress rises (
Baker et al. 2016;
Caldara and Iacoviello 2022).
Accordingly, we include EPU and GPR in the TVP–VAR to capture near-term transmission and to label episodes in which the Total Connectedness Index (TCI) surges. By contrast, our core MIDAS input is the region-specific attention factor constructed from local Google searches (
Section 2.2). EPU and GPR are global, news-indexed measures at monthly frequency; they excel at timing event clusters but are less suited to representing the slow-moving, country-specific information demand that we seek to capture for ASEAN. Elevating them to the role of primary MIDAS driver would blur channels, risk double-counting event-driven variation already absorbed by the connectedness block, and dilute the local information-search signal that anchors our behavioural interpretation (
Engle et al. 2013;
Da et al. 2015;
Ghysels et al. 2016).
We therefore use only the Economic Policy Uncertainty (EPU) index and the Google-based investor-sentiment (IS) index in the GARCH–MIDAS robustness analysis with
. EPU serves as a robustness add-on: it is either substituted for IS or combined with it to verify that the long-run loading on the slow component remains negative and statistically significant, and that the variance share (VR%) attributable to the slow component stays economically meaningful. In line with the literature, we expect similar signs and magnitudes but limited incremental explanatory power, consistent with the view that uncertainty operates as top-down news while investor attention reflects bottom-up information demand rather than a redundant signal (
Baker et al. 2016;
Caldara and Iacoviello 2022;
Engle et al. 2013;
Da et al. 2015).
In short, the Economic Policy Uncertainty (EPU) index provides both the contextual benchmark and the robustness test: it helps trace and validate short-run transmission in the TVP–VAR network and serves to stress-test the volatility results. Meanwhile, the ASEAN PCA-based investor-sentiment (IS) index remains the parsimonious, region-specific slow driver that links local information search to the long-run component of volatility. This division of labour preserves parsimony and interpretability and aligns with the empirical evidence that policy-uncertainty indices act as powerful transmitters during crises, whereas attention-based measures better explain the background drift in volatility against which such crises unfold.
2.4. Hypotheses
In integrated but open financial systems, crises do not merely raise volatility; they also reshape transmission channels. Theory and evidence on time-varying connectedness show that common shocks—whether triggered by macroeconomic uncertainty, policy change, or global funding stress—raise both conditional volatilities and cross-series loadings, producing a core–periphery topology in which large global benchmarks export risk and smaller, more open markets absorb it (
Diebold and Yılmaz 2014;
Antonakakis and Gabauer 2017;
Baruník and Křehlík 2018;
Naeem et al. 2023). In such settings, the strength and direction of spillovers are state-contingent, tightening precisely when diversification is most needed, an empirical regularity observed across major crises from the Global Financial Crisis to COVID-19 (
Youssef et al. 2021). Global equity indices and macro-uncertainty measures such as EPU and GPR typically act as core transmitters, while emerging markets play the role of receivers (
International Monetary Fund 2016;
Lien et al. 2018;
Baker et al. 2016).
On this basis, our first hypothesis focuses on the behaviour of the connectedness network in stress regimes:
Hypothesis 1. In stress regimes, dynamic connectedness between the ASEAN-5 equity markets and global benchmarks intensifies: the Total Connectedness Index (TCI) rises sharply, and global indices and macro-uncertainty factors (MSCI EM, S&P 500, EPU, and GPR) act as net transmitters of volatility, while ASEAN markets function as net receivers.
While global shocks set the stage, investor attention provides a behavioural conduit that determines how long volatility persists and how strongly it propagates. The attention-based view of volatility holds that investors’ limited information-processing capacity leads them to focus on salient topics, which amplifies market reactions and risk transmission (
Kahneman 1973;
Sims 2003;
Barber and Odean 2008;
Tetlock 2007). Local information search, captured by Google Search Volume Index (GSVI) data, offers a real-time proxy for shifts in investor focus and for the diffusion of sentiment across markets (
Da et al. 2011;
Vlastakis and Markellos 2012;
Choi and Varian 2012). When search activity concentrates on risk-laden terms (e.g., crisis, inflation, politics), market participants update more frequently and demand greater risk compensation, raising long-run volatility; when attention focuses on more benign or opportunity-related terms (e.g., stock market, economy), long-run volatility tends to decline (
Engle et al. 2013;
Ghysels et al. 2016;
Brogaard and Detzel 2015). Recent work also suggests that attention shocks and macro-uncertainty shocks act as complementary, rather than purely substitutable, drivers of market risk (
Da et al. 2015;
Baker et al. 2016).
In line with this view, our second hypothesis concerns the long-run component of volatility in the GARCH–MIDAS block:
Hypothesis 2. The ASEAN regional, Google-based investor-sentiment (IS) index has a statistically and economically significant loading on the long-run component of volatility across the ASEAN-5, even after controlling for global policy uncertainty (EPU); shifts in risk-oriented search intensity are associated with persistent changes in the slow volatility component.
Taken together, Hypothesis 1 and Hypothesis 2 capture our core theoretical view: ASEAN financial integration is state-dependent and primarily shaped by global uncertainty at the network level, while the regional IS index channels investor attention into the persistence and magnitude of long-run volatility at the market level.
3. Data Description and Preliminary Analysis
This study employs a comprehensive dataset covering the period from January 2000 to December 2024 for the ASEAN-5 economies Indonesia, Malaysia, Singapore, Thailand, and Vietnam together with several global benchmarks. All series are aligned on a common trading calendar and adjusted for local holidays and time zone differences.
3.1. Financial Market Data
Daily equity market data for the ASEAN-5 economies (Indonesia, Malaysia, Singapore, Thailand, and Vietnam) and the main global reference indices S&P 500, MSCI Emerging Markets, Clean Energy, and Gold are obtained from the Refinitiv Terminal. All price series are converted into daily log returns to eliminate scale differences and ensure stationarity. The full sample covers 25 years (2000–2024), providing on average more than 6000 daily observations per market.
Table A1 in
Appendix A summarises all variables used in the analysis, including their definitions, transformations (returns vs. levels), roles in the empirical framework (regional market, global benchmark, safe haven, or uncertainty driver), and data sources. All price series are converted into daily log-returns, while uncertainty indicators enter in levels.
We focus on the ASEAN-5 rather than the full ASEAN group for three reasons. First, these five markets provide long and relatively continuous daily equity index series over 2000–2024, which is essential for the time-varying connectedness analysis. Second, they are among the largest and most liquid equity markets in the region, so that spillover patterns are economically meaningful and less affected by microstructure noise. Third, consistent Google Trends coverage for the selected macro-policy topics is available for these countries over our sample, which is required to construct a homogeneous regional investor-sentiment (IS) index.
The inclusion of both regional and global markets allows the model to capture cross border and cross asset transmission channels. The S&P 500 and MSCI EM indices represent global benchmarks, while Clean Energy and Gold serve, respectively, as environmental and safe haven assets. This data structure supports the joint investigation of dynamic connectedness (TVP–VAR) and long run volatility components (GARCH–MIDAS).
3.2. Economic Policy and Geopolitical Uncertainty
Both indices are monthly and serve as exogenous low frequency measures of global macro policy and geopolitical shocks. They are used in the GARCH–MIDAS specification to capture the top down drivers of long term volatility, complementing the behavioral attention factor introduced below.
3.3. Investor Attention (GSVI Based Index)
To incorporate the behavioral dimension, a regional investor attention index (IS) is constructed using Google search data. Five macro financial topics stock market, inflation, crisis, politics, and economy are selected for each ASEAN-5 country. The corresponding Google Search Volume Index (GSVI) series are collected from the Google Trends platform (
https://trends.google.com/trends, accessed on 10 October 2025) via the official Google search interface.
Each series is standardized to zero mean and unit variance to ensure comparability across topics and countries. Following
Jolliffe (
2002) and
Kaiser (
1960), a Principal Component Analysis (PCA) is applied to the standardized panel to extract a common factor of regional information demand. The first two principal components with eigenvalues greater than 1 are retained and combined using eigenvalue weights to form the composite investor attention index (IS).
The constructed IS captures the intensity of investors’ information searches in the ASEAN-5 region, representing attention rather than the direction of sentiment. Higher IS values therefore indicate periods of heightened public focus on financial and macro policy topics, which may influence the persistence of volatility in the GARCH–MIDAS framework.
Table A1 summarizes the variables, their definitions, frequency, and sources used in this study. Detailed metadata including ticker codes, construction notes, and sample coverage for each variable are provided in
Appendix A.
3.4. Descriptive Statistics and Correlation Analysis
To provide preliminary insights into the characteristics of the data,
Table 1 reports the descriptive statistics of the ASEAN-5 equity markets, global benchmarks (S&P 500, MSCI EM, Clean Energy, and Gold), and the two uncertainty indices (EPU and GPR) over the period 2000–2024. All return series are expressed in daily logarithmic differences, whereas uncertainty indices enter in levels.
Table 1 shows that all variables exhibit some degree of skewness and kurtosis, indicating deviations from a normal distribution. Most return series are slightly asymmetric and leptokurtic, reflecting the typical behaviour of financial data characterised by fat tails and volatility clustering (
Antonakakis and Gabauer 2017). Among the ASEAN-5 equity markets, Singapore and Malaysia record the highest average returns with moderate variability, whereas Thailand displays a slightly negative mean return coupled with high kurtosis, suggesting episodic but pronounced fluctuations. Vietnam and Indonesia exhibit positive skewness, consistent with the higher growth potential and risk return profile typical of emerging markets (
Assaf et al. 2021).
Turning to the global series, the S&P 500 and MSCI EM indices show comparable variance and excess kurtosis, confirming their exposure to global macro financial shocks and their role as major transmitters of volatility within the international network. The Clean Energy index presents particularly large dispersion, mirroring its sensitivity to policy transitions, technological cycles, and commodity price volatility. By contrast, Gold remains comparatively stable, with near zero skewness and mild kurtosis, underscoring its safe haven behaviour and low tail risk (
Assaf et al. 2021).
The uncertainty indices Global Geopolitical Risk (GPR) and Economic Policy Uncertainty (EPU) display extreme kurtosis values, suggesting a high likelihood of outliers and episodic surges in uncertainty. The Jarque–Bera statistics confirm significant departures from normality across all variables. Variances are broadly similar across equity returns (approximately 1 by construction), while the uncertainty measures have wider ranges owing to their level based scaling. This pattern aligns with the post 2008 global environment described by
Baker et al. (
2016), where heightened geopolitical tensions, inflationary pressures, and monetary tightening contributed to persistent volatility in macro financial risk indicators. Overall, the results underline the informational richness of our dataset and provide a robust empirical foundation for analysing time varying connectedness and volatility transmission across ASEAN-5 and global markets.
Building on the distributional evidence reported in
Table 1, which highlights the non normality and volatility characteristics of the series,
Table 2 examines the pairwise correlations among the ASEAN-5 equity markets, global financial factors, and uncertainty indices over the period 2000–2024. The results reveal moderate and positive co movements within the ASEAN-5 (approximately 0.41–0.50), suggesting a meaningful degree of regional financial integration and a potential channel for shock transmission across neighbouring markets (
Antonakakis and Gabauer 2017). The magnitude of these correlations reflects a balance between local fundamentals and shared exposure to global conditions, confirming that ASEAN markets are regionally connected but not fully synchronised, an important feature for diversification strategies (
Assaf et al. 2021).
The global factors exhibit strong positive associations with regional returns: MSCI EM and Clean Energy show the highest correlations with the ASEAN-5, while the S&P 500 maintains a slightly lower yet significant linkage. These findings indicate that international risk cycles and global macro financial shocks are transmitted to ASEAN markets, particularly during stress episodes such as the 2008 Global Financial Crisis and the 2020 COVID-19 pandemic. Conversely, Gold remains weakly or even negatively correlated with equities, underscoring its persistent role as a defensive and hedging asset, consistent with earlier evidence in the energy–uncertainty literature (
Assaf et al. 2021).
The uncertainty proxies (EPU and GPR) display low and often negative correlations with market returns, implying that they convey orthogonal information about global risk sentiment rather than overlapping with traditional market factors. This weak contemporaneous association reinforces their usefulness in capturing macroeconomic and geopolitical shocks that operate mainly through volatility channels rather than immediate price co movements (
Baker et al. 2016). Importantly, the variance inflation factors (VIFs) remain low (≤3.2), confirming that the variables are not collinear and that the TVP–VAR estimation is statistically well conditioned.
Overall, the correlation structure described in
Table 2 complements the distributional findings of
Table 1 by revealing an integrated yet diversifiable ASEAN–global system, which justifies the use of time varying connectedness measures to capture its evolving interdependence (
Antonakakis and Gabauer 2017;
Assaf et al. 2021).
To complement the distributional and correlation results discussed in
Table 1 and
Table 2,
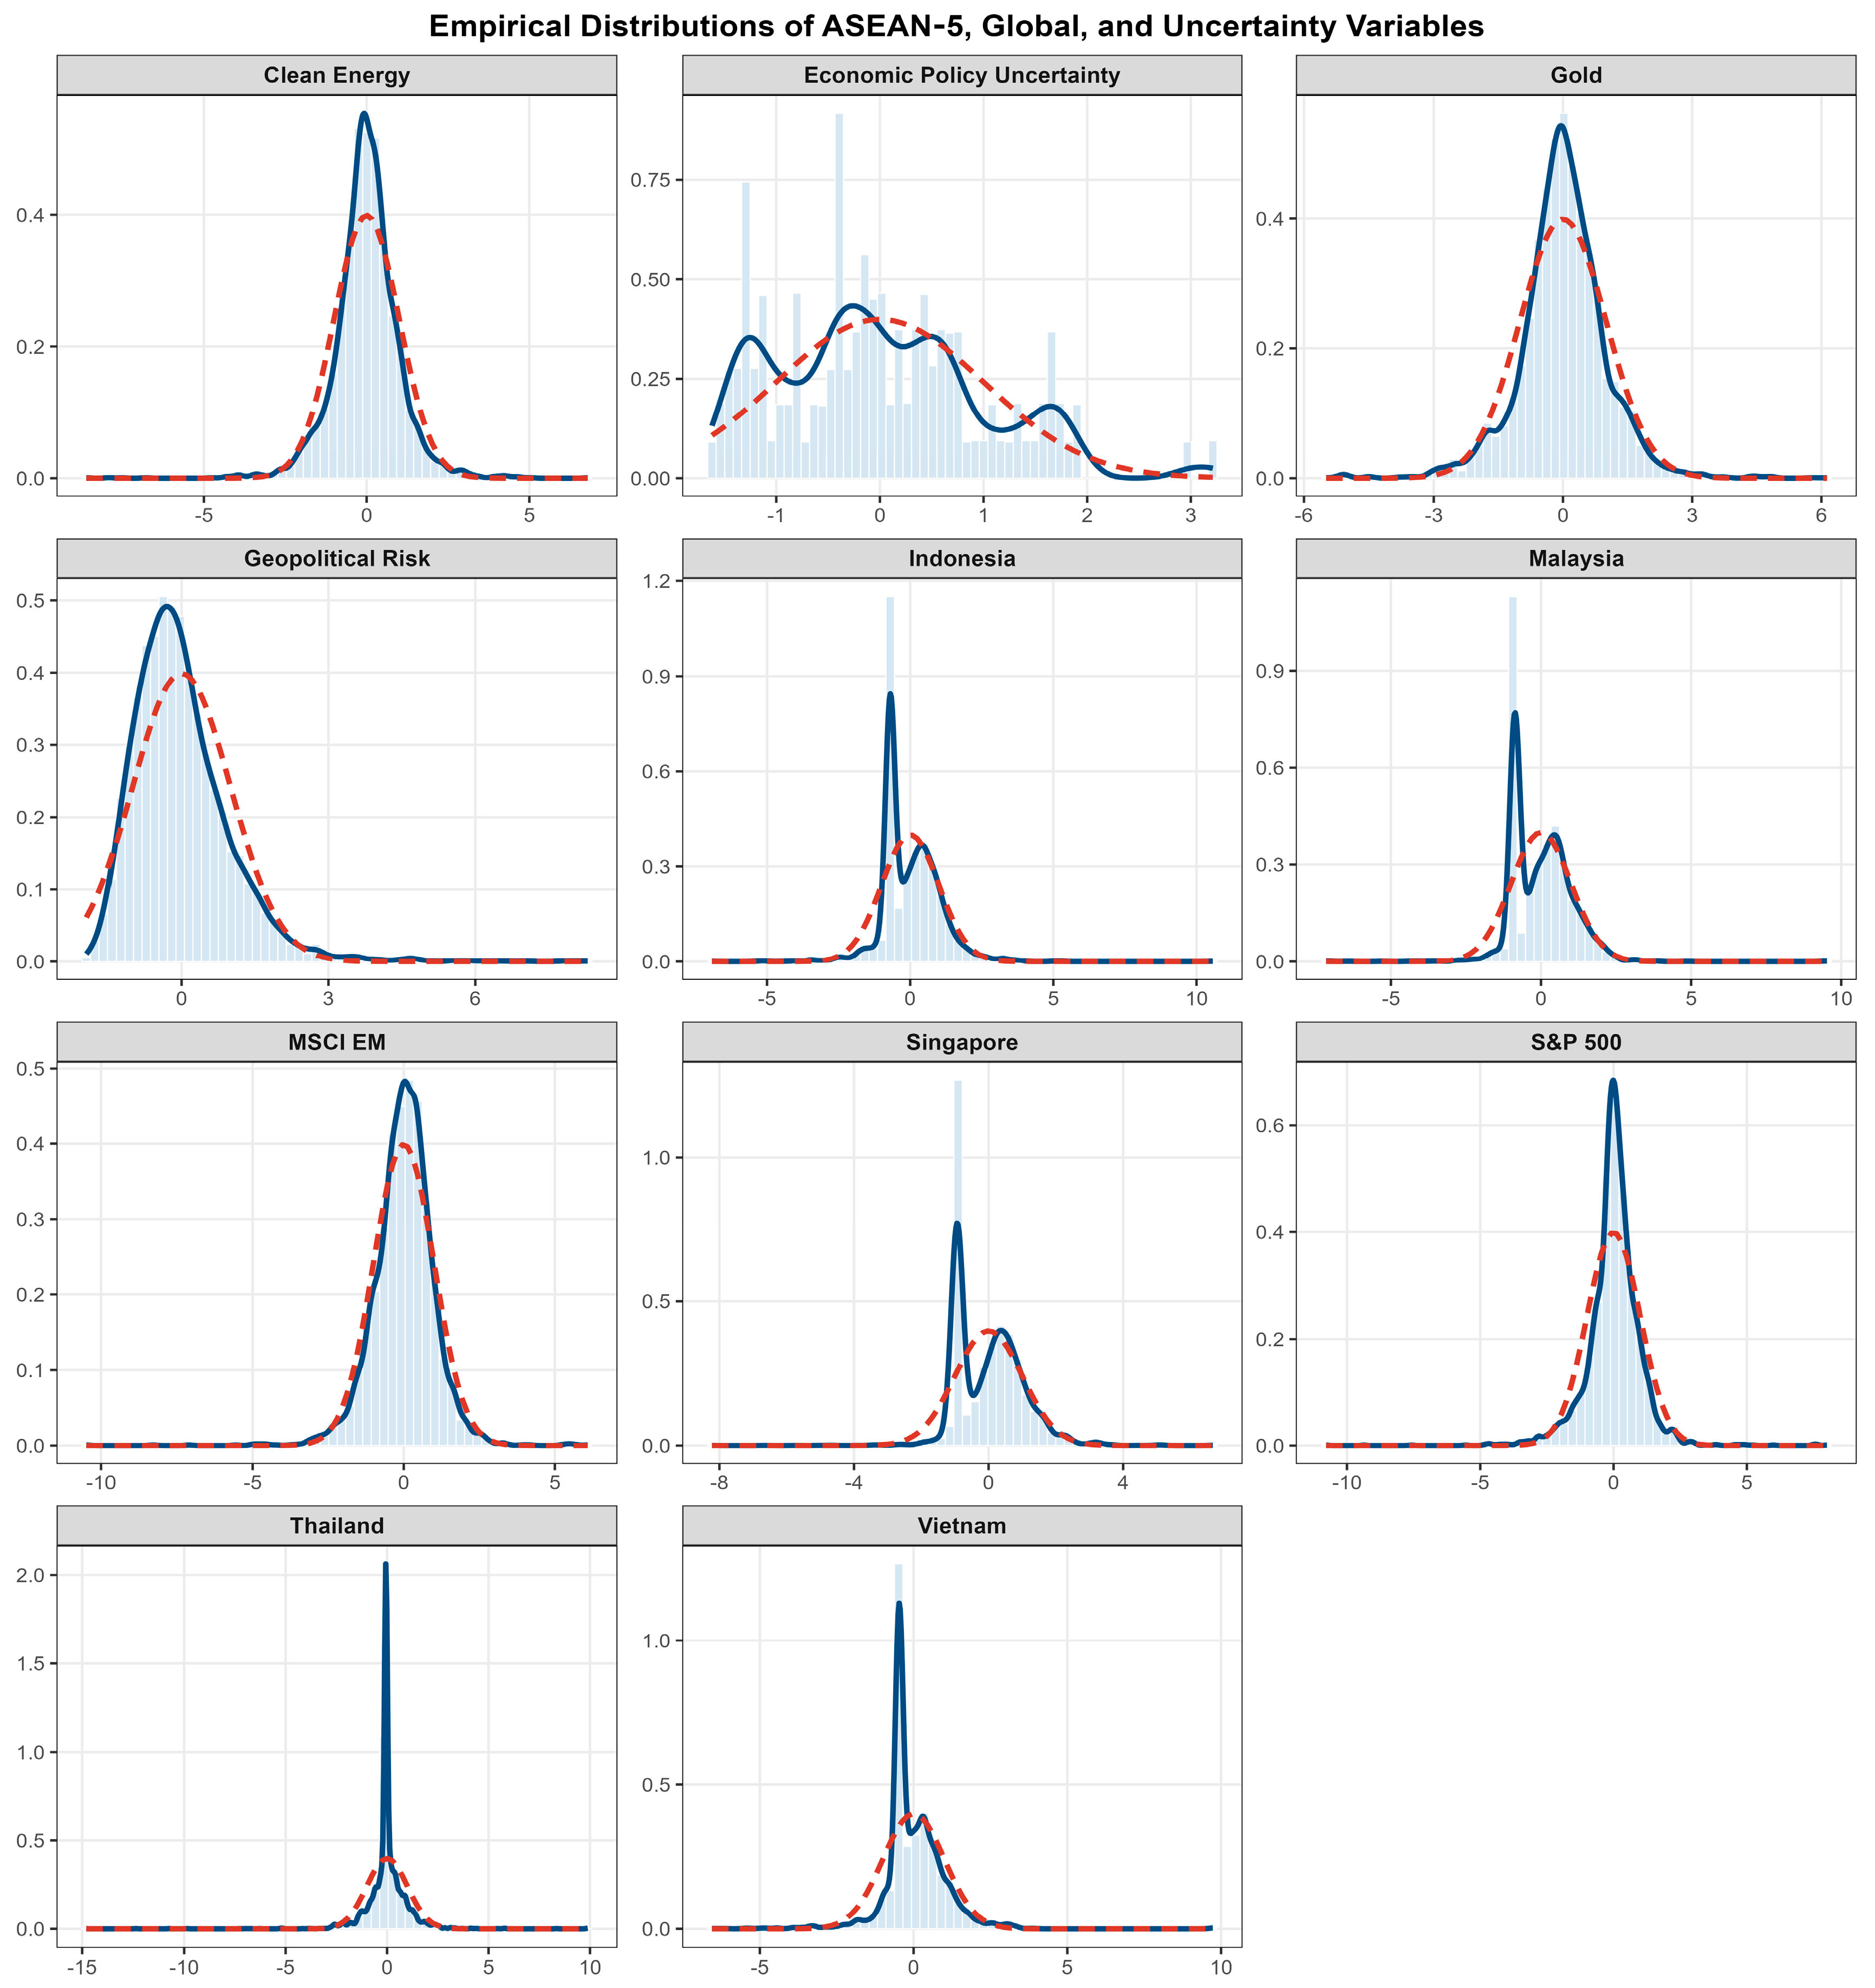
Figure 1 plots standardised empirical distributions for the ASEAN-5 equity returns together with global benchmarks (S&P 500, MSCI EM, Clean Energy, Gold) and the two uncertainty measures over 2000–2024. In each panel, the light blue bars show the standardised histogram, the solid blue line reports the non-parametric kernel density estimate, and the red dashed line depicts the Gaussian density with the same mean and variance as the underlying series. The return distributions are sharply peaked with heavy tails, a canonical signature of daily asset prices, leptokurtosis, and departures from normality well documented in the market microstructure literature (
Cont 2001;
Pagan 1996). The overlaid Gaussian kernels systematically understate tail mass and peak height, reinforcing visual evidence of non normality.
By contrast, the uncertainty proxies display positively skewed, fat tailed shapes: Economic Policy Uncertainty (EPU) and Geopolitical Risk (GPR) concentrate probability mass at low levels with episodic right tail bursts during global events, consistent with their news based construction and historical behaviour (
Baker et al. 2016;
Caldara and Iacoviello 2022). Taken together, these distributions point to series that are non Gaussian, heteroskedastic, and prone to clustering of volatility, stylised facts that motivate models expressly designed for time varying spillovers and mixed frequency volatility.
Methodologically, this evidence justifies our two pillar framework. First, a TVP–VAR connectedness design captures evolving shock transmission across ASEAN and global factors, in the tradition of Diebold–Yılmaz spillovers and their time varying refinements (
Diebold and Yılmaz 2014;
Antonakakis and Gabauer 2017). Second, a GARCH–MIDAS block links long run volatility to low frequency drivers such as attention, accommodating conditional heteroskedasticity at the daily horizon while mapping persistent variation to monthly components (
Engle et al. 2013;
Ghysels et al. 2004; see also
Engle and Rangel 2008).
6. The Impact of Investor Attention on Dynamic Spillover
In this section, we examine how investor attention, proxied by the Google-based investor-sentiment index (IS), affects the long-run component of volatility in the ASEAN-5 and global benchmark markets. Following
Wu and Liu (
2023), we interpret the PCA-based Google index as a neutral measure of information demand or attention intensity rather than as a directional optimism–pessimism indicator.
As described in
Section 3.3, monthly Google Search Volume Index (GSVI) data for five macro-policy topics (stock market, inflation, crisis, politics, and economy) are collected for each ASEAN-5 country. These standardized series are stacked into a regional panel and summarized using principal component analysis (PCA). The first two principal components with eigenvalues greater than one are retained and combined using eigenvalue weights to construct a composite investor-attention index, IS (
Table 5). This index captures the overall intensity of public searches related to financial and macro-policy information in the region. Higher values of IS therefore reflect stronger information demand without implying whether the underlying sentiment is optimistic or pessimistic.
Table 5 reports the average PCA loadings by country, while
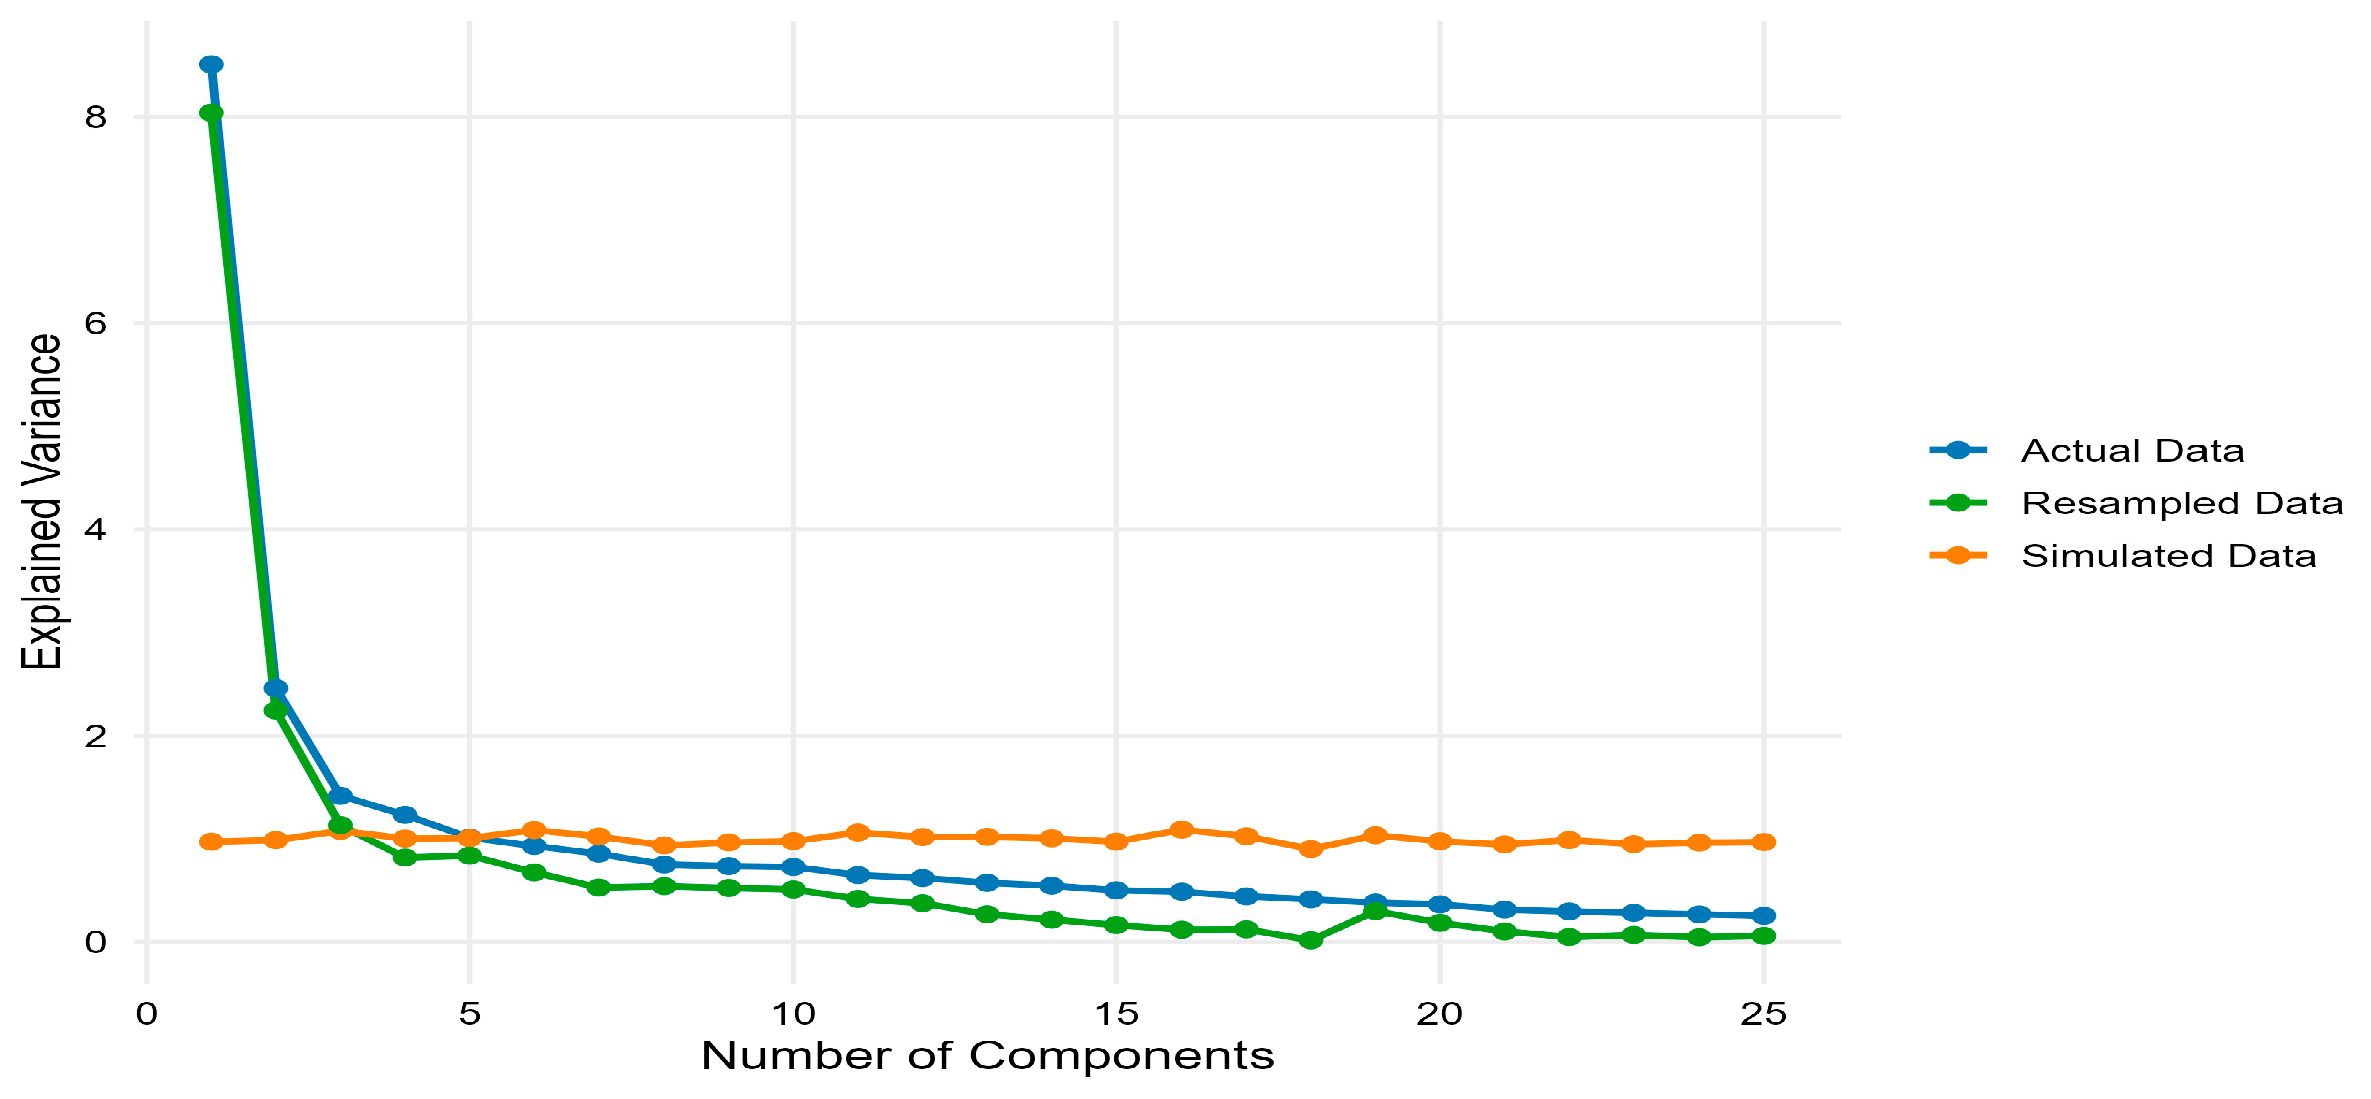
Figure 6 compares the share of variance explained by the retained components, confirming that the first two principal components capture the bulk of common variation in Google search activity across ASEAN-5 markets.
Figure 6 further assesses the PCA by plotting the variance explained by each principal component for the actual GSVI panel, a bootstrap resampled panel, and a panel of simulated white-noise series. For the actual and resampled data, the scree plot shows a steep drop after the first two components and a nearly flat profile thereafter, whereas the simulated data exhibit an almost flat line across all components, confirming that PC1 and PC2 capture genuine common variation in Google search activity rather than sampling noise.
We then estimate a GARCH–MIDAS model for each daily return series used in the TVP–VAR block in order to assess how this low-frequency attention factor shapes high-frequency return volatility within the ASEAN–global system. The conditional variance is decomposed multiplicatively into a short-run daily GARCH(1,1) component and a monthly long-run MIDAS component driven by IS (and, in robustness checks, by EPU). The short-run component captures fast-moving volatility clustering, while the MIDAS term summarizes a slow-moving background factor. The parameter θ on IS measures the sensitivity of the long-run component to attention; the variance-ratio statistic (VR%) quantifies the share of total volatility persistence attributable to this slow component.
Table 6 reports the parameter estimates for all markets.
Across all specifications, the ARCH (α) and GARCH (β) coefficients are statistically significant and satisfy the usual stability condition (α + β < 1), confirming the adequacy of the GARCH(1,1) structure for the short-run component. Short-run persistence is high, with α + β typically in the 0.89–0.99 range (mean 0.94, median 0.932), as is standard for daily financial returns. These results indicate that most short-horizon dynamics are absorbed by the GARCH block and that the MIDAS term captures genuinely lower-frequency variation rather than omitted high-frequency effects.
The composite investor sentiment index is then computed as an eigenvalue-weighted combination of the retained components:
where
denotes the eigenvalue of
. By construction,
summarizes the most salient, low-dimensional variation in sentiment-related searches across ASEAN-5 markets in each period
. This index serves as the parsimonious behavioral state variable used in the subsequent empirical analysis.
As reported in
Table 6, the MIDAS slope coefficient θ on the IS index is negative and statistically significant in most markets. Estimates of θ range from about −0.562 *** in Thailand and −0.160 *** in Indonesia to −0.063 *** and −0.032 *** in Malaysia and Singapore, and approximately −0.001 *** in Vietnam. Although the PCA-based IS index is conceptually neutral with respect to direction, the negative sign implies that episodes of heightened regional information demand are associated with lower long-run volatility. One interpretation is that, in these markets and for the topics considered, increased attention tends to operate through a confidence or information-efficiency channel: more intensive search is associated with better information processing, narrower uncertainty about fundamentals, and hence a lower background variance level, particularly in green and regional markets. This stands in contrast to evidence for traditional or fossil-fuel assets where attention is often triggered by panic and tends to amplify volatility.
The variance-ratio measure VR% shows that the contribution of the slow component is heterogeneous. For ASEAN markets, VR spans roughly 39.0% in Thailand and 13.8% in Indonesia down to about 5–6% in Malaysia and Singapore and 0.4% in Vietnam. Global benchmarks sit in the mid-single digits (for example, around 8.0% for the S&P 500, 4.8% for MSCI EM, and 5.6% for the clean-energy index). On average, the long-run component explains about 10.3% of total conditional variance across all series (median 5.6%), and Thailand together with Indonesia accounts for roughly two thirds of the total VR mass. In other words, the slow attention channel is economically most important in the two ASEAN markets where retail participation, media intensity, and episodic stress are also more pronounced.
The shape parameter m of the Beta weighting function further clarifies the mechanism. In markets where m is relatively large (for example, Thailand and Indonesia), attention shocks diffuse gradually over several months, generating a pronounced slow component in volatility. Where m is close to zero and VR is small (for example, Vietnam), the slow channel is weak and volatility remains dominated by short-run GARCH dynamics. This cross-sectional pattern is consistent with the view that search-based indices are most informative where public news, retail trading, and local narratives play a larger role in price discovery (
Da et al. 2011;
Dimpfl and Jank 2016).
Viewed alongside the TVP–VAR evidence on time-varying connectedness, the GARCH–MIDAS results reveal a coherent pattern. Markets whose slow volatility component is most sensitive to investor attention (notably Thailand and Indonesia) are also the nodes that tend to play a more prominent role in the spillover network during stress episodes, in line with network-based interpretations of connectedness (
Diebold and Yılmaz 2014;
Antonakakis and Gabauer 2017). Global benchmarks exhibit more moderate slow components, consistent with deeper information sets and faster absorption of public news, which accords with the time-varying connectedness patterns documented for emerging Asia (
Youssef et al. 2021). Overall, the Google-based IS index emerges as a significant and stabilising driver of long-run volatility that complements, rather than duplicates, global policy-uncertainty measures such as EPU and GPR (
Baker et al. 2016;
Caldara and Iacoviello 2022;
Da et al. 2011;
Engle et al. 2013).
7. Robustness Checks and Extensions
We extend the baseline GARCH–MIDAS specification to verify that the relationships between market volatility, investor attention, and macro-uncertainty are not artefacts of parametrisation. Following the mixed-frequency volatility literature, we first lengthen the MIDAS memory from
to
monthly lags, allowing the low-frequency component
to aggregate a broader information set without altering the short-run conditional variance dynamics. As argued by
Engle et al. (
2013) and
Conrad and Loch (
2015), a larger
provides a stringent check on whether the slow-moving driver remains economically meaningful once the variance equation accommodates longer memory.
Table 7 (GARCH–MIDAS with IS,
) corroborates the structural role of the attention channel. Across ASEAN and benchmark markets, the loading on the Google-based investor-attention factor,
, remains negative and highly significant, indicating that periods of stronger information demand are associated with lower long-run volatility. Volatility persistence
remains high (around 0.88–0.97), consistent with near unit-root behaviour in financial returns (
Engle 1982;
Bollerslev 1986). The variance-ratio measure, defined as
averages around 20–25%, implying that roughly one quarter of total log-volatility is explained by the slow-moving attention component in this extended specification. This order of magnitude is comparable to findings in
Ghysels et al. (
2016) and
Da et al. (
2015), who show that Google-based attention indices add incremental information for volatility beyond standard macro and liquidity controls.
Next, we replace the attention factor with macro-uncertainty in
Table 8 (GARCH–MIDAS with EPU,
). The MIDAS coefficient
is again negative and statistically significant across markets, while short-run persistence remains in the 0.87–0.91 range and
lies around 19–23%. These patterns echo
Baker et al. (
2016) and
Brogaard and Detzel (
2015), who document that uncertainty shocks are systematically priced in volatility. Taken together, the sign, magnitude, and significance of the MIDAS loadings are robust to (i) lengthening the MIDAS lag window and (ii) substituting the slow-moving driver (IS → EPU), indicating that attention and policy-uncertainty indices capture complementary dimensions of low-frequency risk.
Methodologically, these results align with
Conrad et al. (
2014) and
Engle et al. (
2013): varying the aggregation window or swapping macro drivers should not flip the direction of the MIDAS term if the model is well specified. All estimates satisfy the standard stationarity and positivity constraints
,
, and
, ensuring a well-behaved conditional variance. The stability of
across
Table 7 and
Table 8 indicates that the contribution of the long-run component to total volatility is a structural feature of the data rather than an artefact of window length or variable selection. Overall, the robustness checks confirm that long-horizon information—whether captured by digital attention (IS) or macro-uncertainty (EPU) is tightly linked to short-run volatility, in line with the mixed-frequency volatility literature (
Engle et al. 2013;
Baker et al. 2016;
Da et al. 2015).
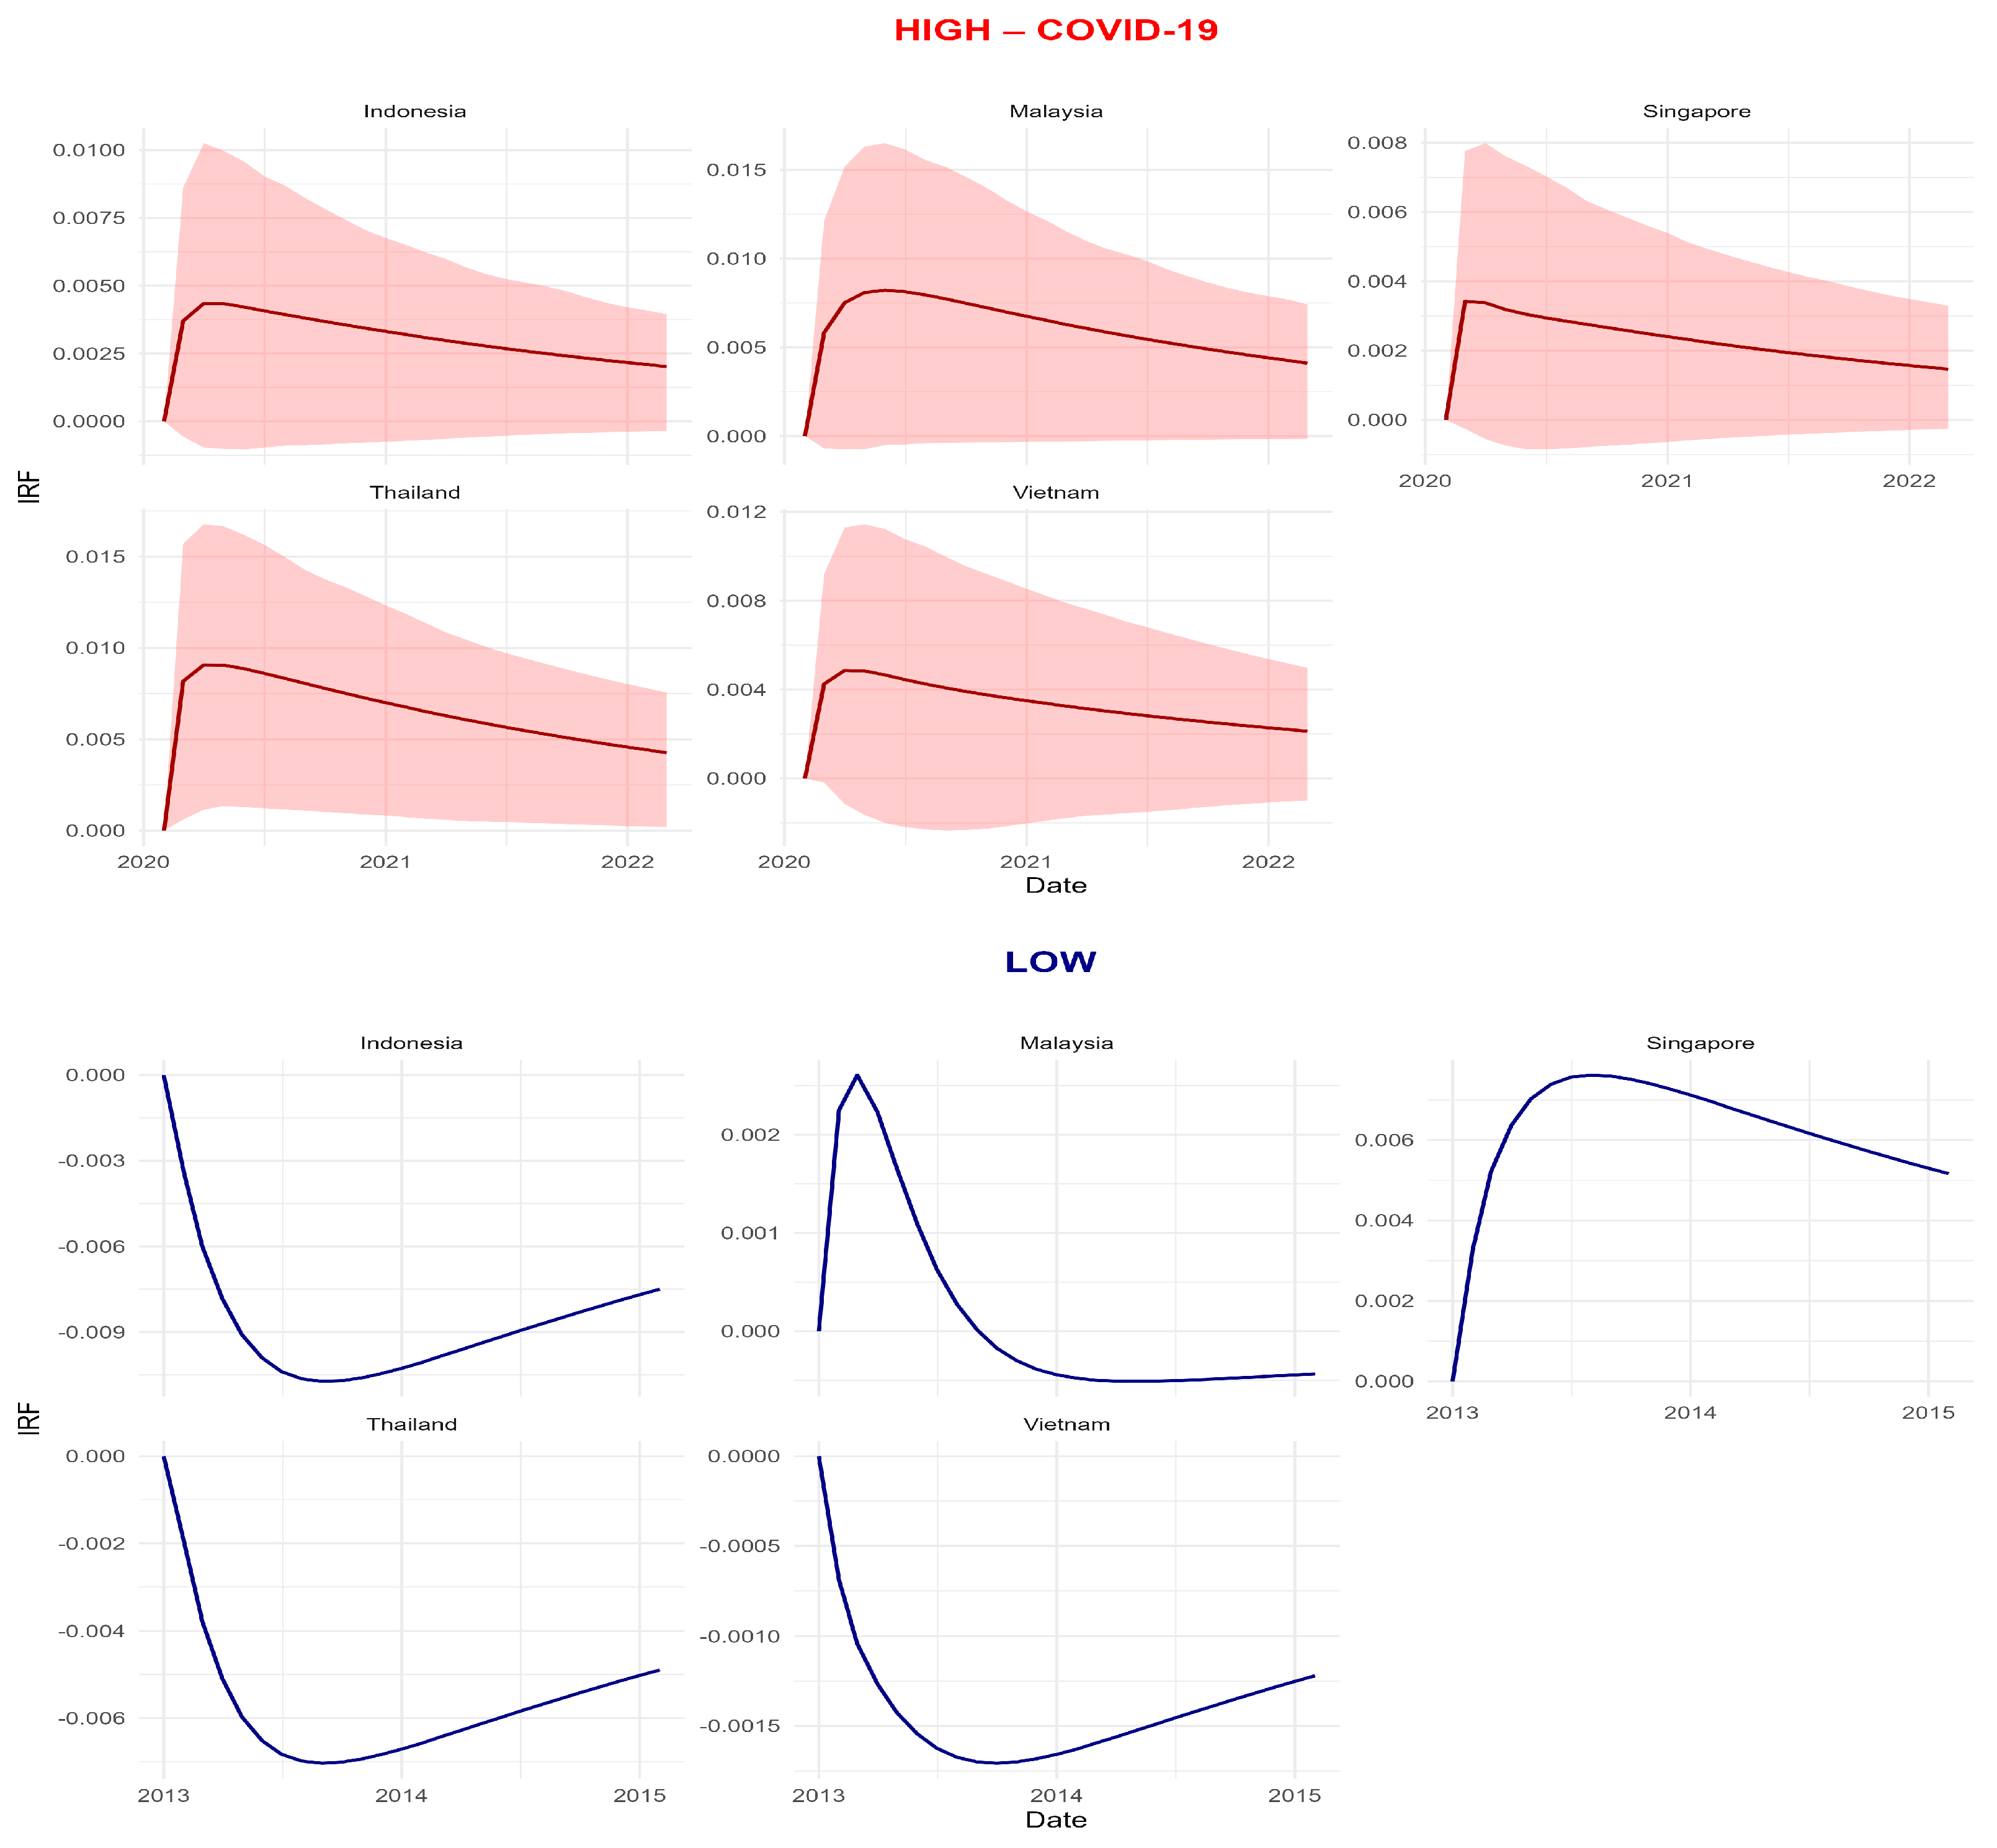
Figure 7 provides an additional robustness check by overlaying the generalized IRFs to an EPU shock across high- and low-uncertainty regimes. The red line (COVID-19 episode) and the dark blue line (low-uncertainty period) are computed from VARs estimated on the corresponding subsamples with the same lag structure and shock normalisation, so differences in magnitude and persistence are attributable to regime conditions rather than model specification (
Diebold and Yılmaz 2014;
Antonakakis and Gabauer 2017). The shaded red area represents the 95% confidence interval around the high-uncertainty impulse responses, illustrating the statistical uncertainty of the estimates under stressed conditions.
In all ASEAN-5 markets, the high-uncertainty IRF is substantially larger on impact and decays more slowly than its low-uncertainty counterpart, while the sign and qualitative shape of the response remain unchanged. This confirms that policy-uncertainty shocks propagate more forcefully and for longer when the global environment is stressed, but do not reverse the basic transmission pattern documented in the baseline TVP–VAR connectedness results (
Baker et al. 2016;
Caldara and Iacoviello 2022). Taken together with
Figure 5,
Figure 7 thus reinforces the interpretation that ASEAN financial integration and shock transmission are state-dependent, and shows that our conclusions are robust to subsample estimation and direct impulse-response analysis (
Youssef et al. 2021).
8. Discussion and Implications
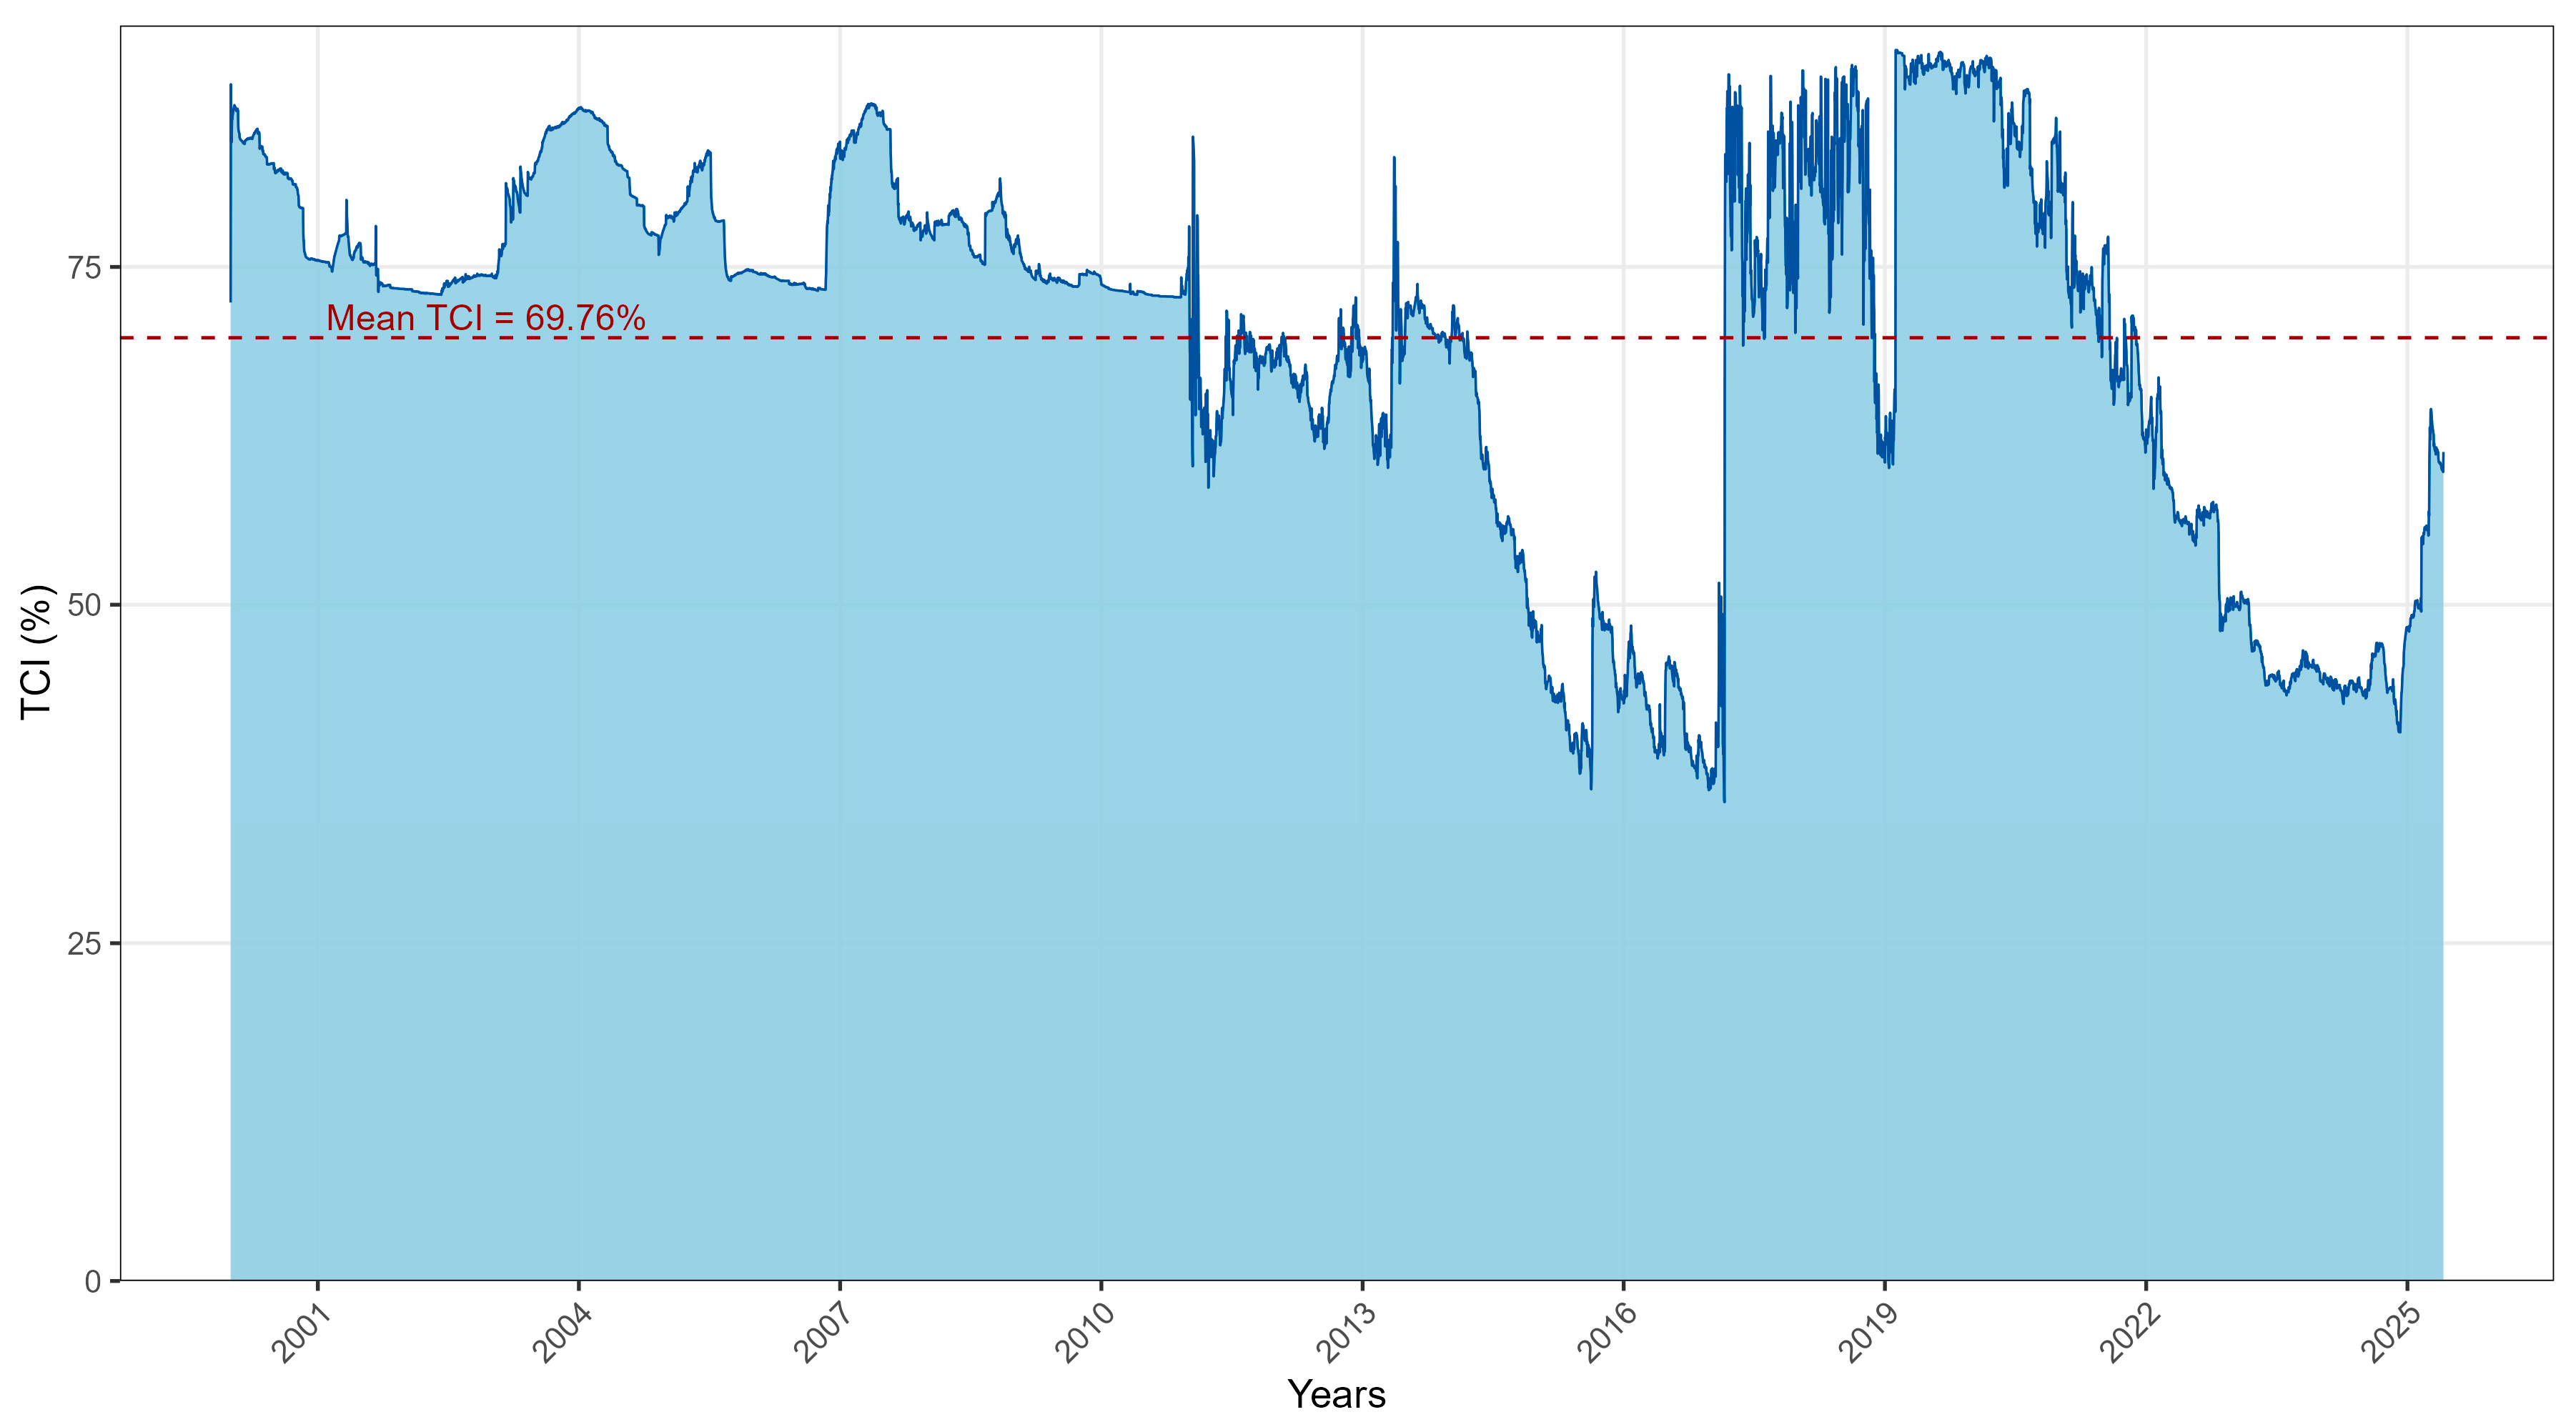
Our evidence situates ASEAN co-movements squarely within the time varying connectedness paradigm. The Total Connectedness Index (TCI) averages ≈ 70% and surges above 90% in turbulent periods, implying that cross market shocks, not idiosyncratic innovations, drive most multi step forecast uncertainty. This pattern matches the crisis sensitivity embedded in GFEVD based connectedness networks and their TVP–VAR extensions, which allow transmission parameters to drift over time (
Diebold and Yılmaz 2014;
Antonakakis and Gabauer 2017;
Gabauer 2021). Frequency domain analyses reach the same conclusion from another angle: crisis era amplification concentrates at low (long horizon) frequencies, consistent with slow moving forces that tighten co-movement in bad times (
Baruník and Křehlík 2018;
Tiwari et al. 2022).
The upshot is clear: ASEAN financial integration is state dependent, rising in stress and receding in calm regimes (
Naeem et al. 2023;
Youssef et al. 2021) Two top-down uncertainty channels help explain these dynamics. First, economic policy uncertainty (EPU), a news-based gauge of fiscal, monetary, and regulatory ambiguity, tends to spike around salient events and is empirically linked to higher volatility and tighter co-movements (
Baker et al. 2016;
Phan et al. 2021;
Su et al. 2023). Second, geopolitical risk (GPR) propagates stress through trade and commodity routes; increases in GPR during conflicts and diplomatic shocks transmit volatility globally (
Caldara and Iacoviello 2022;
Naeem et al. 2023).
The coincidence of our TCI peaks with bursts in EPU and GPR therefore substantiates H1: macroeconomic and geopolitical uncertainty amplify cross market volatility transmission in ASEAN. The green asset node behaves in a regime dependent manner that lines up with recent evidence. Clean energy equities switch between transmitters (around transition policy or carbon pricing headlines) and absorbers (when commodity or liquidity conditions dominate), placing them between global benchmarks and domestic equities in the spillover hierarchy (
Özkan et al. 2024;
Naeem et al. 2023). By contrast, gold remains a mild net receiver, retaining its defensive profile consistent with hedge/safe haven results (
Baur and Lucey 2010;
Baur and McDermott 2010).
Mechanistically, the GARCH–MIDAS block links network behaviour to slow moving fundamentals. The coefficient on investor attention, θ(IS), is negative and significant, and the variance ratio share attributed to the MIDAS term (VR% ≈ 19–26%) is economically meaningful. This is consistent with the broader attention based volatility literature in the sense that attention emerges as a non-redundant, slow moving driver of risk; in our context, however, the negative sign points to an information efficiency channel, whereby periods of heightened, systematic information demand are associated with improved price discovery and a lower long run volatility baseline (
Da et al. 2015;
Ghysels et al. 2016). Taken together, uncertainty and attention operate as complementary channels, aligning the timing (when) and mechanism (why) of spillover intensification.
For investors, diversification is regime-dependent: when TCI is high, spillovers dominate and diversification benefits compress. Hedge ratios and risk budgets should therefore be state aware, keyed to uncertainty monitors such as EPU and GPR. A structural gold sleeve remains defensible as a crisis hedge, whereas clean energy exposure is best treated tactically, with sizing that reflects policy calendars and funding/commodity conditions (
Baur and Lucey 2010;
Baur and McDermott 2010;
Özkan et al. 2024).
From the perspective of international portfolio diversification within and beyond the ASEAN 5, our results imply that investment decisions cannot be based solely on average correlations: the same cross market linkage can be weak at high frequencies yet strong at low frequencies, so that long horizon investors remain exposed to persistent spillovers even when short run co-movement appears modest (
Baruník and Křehlík 2018;
Ghysels et al. 2016). In practical terms, investors need to account explicitly for the asymmetric transmission of short term and long-term volatility when constructing portfolios, evaluating downside risk, and calibrating rebalancing rules because regime shifts in connectedness and volatility persistence can quickly erode the ex ante gains from regional diversification.
For portfolio managers, the joint TVP–VAR and GARCH–MIDAS framework highlights the value of frequency decomposition as a decision support tool. By mapping spillovers and volatility into horizon specific components, managers can design risk budgets that distinguish between fast, “trading horizon” shocks and slow, “strategic horizon” risks, and can align hedging instruments, benchmark choices, and performance attribution to the relevant frequency band (
Engle et al. 2013;
Baruník and Křehlík 2018). Beyond portfolio construction, such a multi scale representation of connectedness can substantially improve the diffusion of knowledge within investment teams and toward clients, providing a transparent narrative for how and why volatility spillovers occur between markets at different horizons, and why diversification sometimes fails precisely when it is most needed.
For policymakers, the dominance of uncertainty as a transmitter underscores the importance of transparent, rules-based communication and regional safety nets (macroprudential coordination, liquidity backstops) to curb “outside in” propagation (
International Monetary Fund 2016;
Lien et al. 2018). These policy implications resonate directly with the ASEAN Economic Community (AEC) initiative, which aims to deepen economic and financial integration and to promote greater mobility of capital and financial services within ASEAN (
International Monetary Fund 2016). As the AEC framework lowers barriers and strengthens cross border linkages, our state dependent connectedness results suggest a classic trade off: in tranquil periods, higher integration enhances risk sharing and market development, but in stress regimes it also increases the scope for regional contagion when global uncertainty spikes (
Lien et al. 2018). Recognising this trade off is crucial for designing regional macroprudential frameworks, surveillance mechanisms, and safety net arrangements that support the long run objectives of the AEC while containing the transmission of global shocks into ASEAN financial systems. For issuers in green finance, regime sensitivity implies time varying issuance costs: placing large offerings in high uncertainty windows raises the cost of capital, while granular disclosure of transition exposures and policy dependencies can dampen contagion to valuations (
Özkan et al. 2024).
Overall, the evidence confirms H1 that ASEAN financial integration is time varying, and H2 that uncertainty and attention jointly amplify spillovers. The interplay between uncertainty, sentiment, and clean energy dynamics places ASEAN within a broader pattern of crisis sensitive connectedness, in which global shocks compress diversification and intensify the behavioural–macro feedbacks that characterise modern financial contagion.
9. Conclusions, Limitations, and Future Research
This paper has examined how financial integration between ASEAN-5 equity markets and global benchmarks changes across regimes and how macro-uncertainty and investor attention shape this process. Taken together, the results point to a regime-dependent form of integration: periods of stress are characterised by a tighter and more hierarchical spillover structure, with global benchmarks and uncertainty factors acting as dominant transmitters and ASEAN markets as receivers, while investor attention operates as a slow-moving background force that influences the persistence of volatility. The joint use of a TVP–VAR connectedness framework and a GARCH–MIDAS volatility block allows us to link network-level interdependence to market-level volatility dynamics in a transparent way and provides a regime-aware perspective that is directly relevant for portfolio risk management, macro-prudential surveillance, and the timing of capital issuance in emerging Asia.
Despite these contributions, several limitations remain. The slow-moving drivers we consider are informative but noisy: EPU and GPR are news-based indices that may embody media and language biases, and Google Search Volume data capture attention rather than valuation fundamentals. The empirical design relies on a linear, Gaussian TVP–VAR and a standard GARCH–MIDAS filter, which, while tractable and interpretable, may understate tail asymmetries, leverage effects, and nonlinear propagation. In addition, connectedness measures are sensitive to the chosen forecast horizon, and a single-horizon summary cannot fully distinguish short- from long-horizon transmission. Our asset universe, focused on equities, gold, and clean-energy indices, does not include FX, rates, credit, or carbon/energy derivatives, which often act as primary conduits for macro and geopolitical shocks. Finally, the clean-energy composite may mask heterogeneous behaviour across underlying sub-sectors.
These limitations suggest several avenues for future research. First, the volatility block could be enriched by moving beyond symmetric GARCH–MIDAS to models that allow for asymmetry and leverage, such as EGARCH–MIDAS or time-varying-parameter EGARCH–MIDAS specifications in which both the variance and the news-impact curve evolve over time. Second, on the spillover side, TVP–VAR frameworks with time-varying latent parameters (LT-TVP-VAR) or low-dimensional factor structures could be employed to better capture structural breaks and common drivers of ASEAN co-movements. Third, time- and frequency-domain approaches could be combined to clearly separate short- and long-horizon transmission, and tail- or quantile-based connectedness tools could be used to focus on downside-risk contagion. Fourth, future work could refine uncertainty and attention measures using multilingual text embeddings and more balanced news corpora, reducing measurement noise in EPU, GPR, and Google-based indices. Lastly, broadening the system to include FX, interest rates, credit spreads, and carbon/energy instruments would allow for a more complete mapping of macro- and transition-risk channels into ASEAN financial markets.
Pursuing these extensions would turn our regime-aware portrait into a more structurally identified and horizon-resolved account of how uncertainty and attention synchronise ASEAN markets, and under which conditions they fail to do so, while at the same time speaking more directly to the institutional architecture and policy pillars of the ASEAN Economic Community (AEC) (
International Monetary Fund 2016;
Lien et al. 2018). In this sense, our findings provide a benchmark for both academics and policymakers seeking to align the deepening of AEC financial integration with the realities of state-dependent connectedness, mixed-frequency risk transmission, and the trade-off between risk-sharing and contagion in emerging Asia.