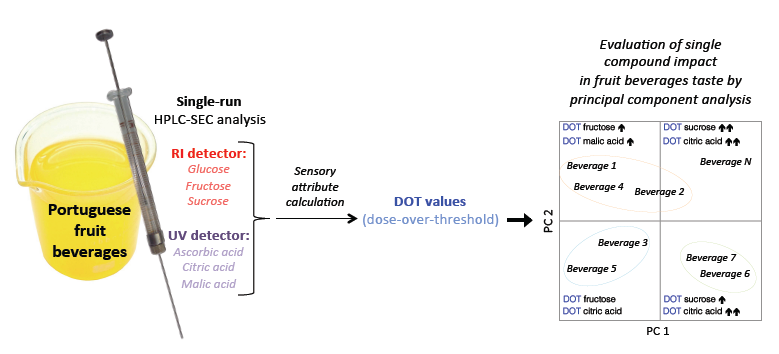
A Size Exclusion HPLC Method for Evaluating the Individual Impacts of Sugars and Organic Acids on Beverage Global Taste by Means of Calculated Dose-Over-Threshold Values


Abstract
:
1. Introduction
2. Experimental Section
2.1. Reagents
2.2. Samples
2.3. Standard and Sample Preparation

| Sample Number | Beverage Brand | Main Fruits in the Composition | Beverage Type a | Minimum Juice % |
|---|---|---|---|---|
| 1 | A | Orange, mango | Nectar | 45 |
| 2 | A | Orange, apple, passion-fruit | Nectar | 50 |
| 3 | A | Orange | Nectar | 50 |
| 4 | A | Strawberry, apple | Nectar | 45 |
| 5 | B | Orange, carrot, mango | Nectar | 50 |
| 6 | B | Peach | Nectar | 50 |
| 7 | B | Carrot, mango, tomato, apple, passion, kiwi, lemon | Soft-drink | 25 |
| 8 | B | Mango | Nectar | 30 |
| 9 | B | Apple | Juice | 100 |
| 10 | B | Red fruits | Nectar | 40 |
| 11 | B | Orange | Juice | 100 |
| 12 | B | Pineapple, coconut | Nectar | 43 |
| 13 | B | Pear | Nectar | 50 |
| 14 | B | Grape and pomegranate fruits and green tea | Soft-drink | 20 |
| 15 | A | Orange, apple, pineapple, mango, apricot | Soft-drink | 20 |
| 16 | A | Pineapple, apple, orange, banana | Soft-drink | 20 |
| 17 | A | Apple, orange, pineapple, mango, guava, banana | Soft-drink | 20 |
| 18 | C | Strawberry | Soft-drink | 14 |
| 19 | C | Orange, pineapple, passion-fruit, apricot, guava, mango, banana | Soft-drink | 20 |
| 20 | C | Pineapple | Soft-drink | 20 |
| 21 | C | Orange | Soft-drink | 20 |
| 22 | D | Orange | Soft-drink | 10 |
| 23 | D | Pineapple | Soft-drink | 8 |
| 24 | E | Orange | Soft-drink | 8 |
| 25 | F | Orange | Soft-drink | 11 |
| 26 | E | Pineapple | Soft-drink | 6 |
| 27 | F | Tropical fruits | Soft-drink | 12 |
| 28 | B | Carrot, mango, tomato, apple, passion-fruit, kiwi, lemon | Nectar | 32 |
| 29 | B | Passion-fruit | Nectar | 25 |
| 30 | B | Strawberry, apple | Nectar | 45 |
2.4. HPLC System, Separation and Performance Evaluation
2.4.1. Linearity, Limits of Detection and of Quantification
2.4.2. Precision (Repeatability and Intermediate Precision)
2.4.3. Accuracy
2.5. Dose-Over-Threshold Values Calculation
2.6. Statistical Analysis
3. Results and Discussion
3.1. HPLC in-House Validation
3.1.1. Linearity, Limits of Detection and of Quantification
| Detector | Compound | Range, g L−1 | Slope ± SD, L g−1 | Intercept ± SD | R | Mandel’s Test (p-value) |
|---|---|---|---|---|---|---|
| RI | Sucrose | [0.326–5.02] | (171 ± 2) × 104 | (−4 ± 5) × 104 | 0.9995 | 0.287 |
| Glucose | [0.321–5.02] | (1950 ± 5) × 103 | (−3 ± 1) × 104 | 0.99998 | 0.944 | |
| Fructose | [0.348–5.13] | (2060 ± 6) × 103 | (10 ± 2) × 104 | 0.99996 | 0.274 | |
| UV | Citric acid | [0.114–4.62] | (1055 ± 8) × 103 | (−5 ± 2) × 104 | 0.9995 | 0.088 |
| Tartaric acid * | [0.691–8.34] | (1340 ± 6) × 103 | (9 ± 3) × 104 | 0.9991 | 0.002 | |
| Malic acid | [0.330–5.02] | (754 ± 2) × 103 | (14 ± 7) × 103 | 0.99995 | 0.256 | |
| Ascorbic acid | [0.105–1.03] | (258 ± 3) × 104 | (−7 ± 2) × 104 | 0.9994 | 0.372 | |
| Acetic acid | [0.128–1.06] | (484 ± 5) × 103 | (4 ± 3) × 103 | 0.9992 | 0.069 |
| Compound | Single Run HPLC Analysis | Separate Runs HPLC Analysis | ||||
|---|---|---|---|---|---|---|
| This work | Eyéghé-Bickong et al. [11] | Pérez et al. [12] | Chinnici et al. [13] | Carballo et al. [20] | ||
| LD, mg L−1 | LQ, mg L−1 | LD, mg L−1 | LD, mg L−1 | LD, mg L−1 | LD, mg L−1 | |
| Sucrose | 90 | 270 | --- | 0.74 | 80 | 97 |
| Glucose | 24 | 74 | 160 | 1.51 | 70 | 67 |
| Fructose | 26 | 77 | 70 | 6.56 | 70 | 93 |
| Citric acid | 48 | 150 | 30 | 18.6 | 3.3 | 0.08 |
| Tartaric acid | 77 | 230 | 20 | --- | --- | --- |
| Malic acid | 32 | 98 | 20 | 28.7 | 1.8 | co-eluted |
| Ascorbic acid | 22 | 68 | --- | 8.29 | --- | 0.003 |
| Acetic acid | 20 | 60 | --- | --- | --- | --- |
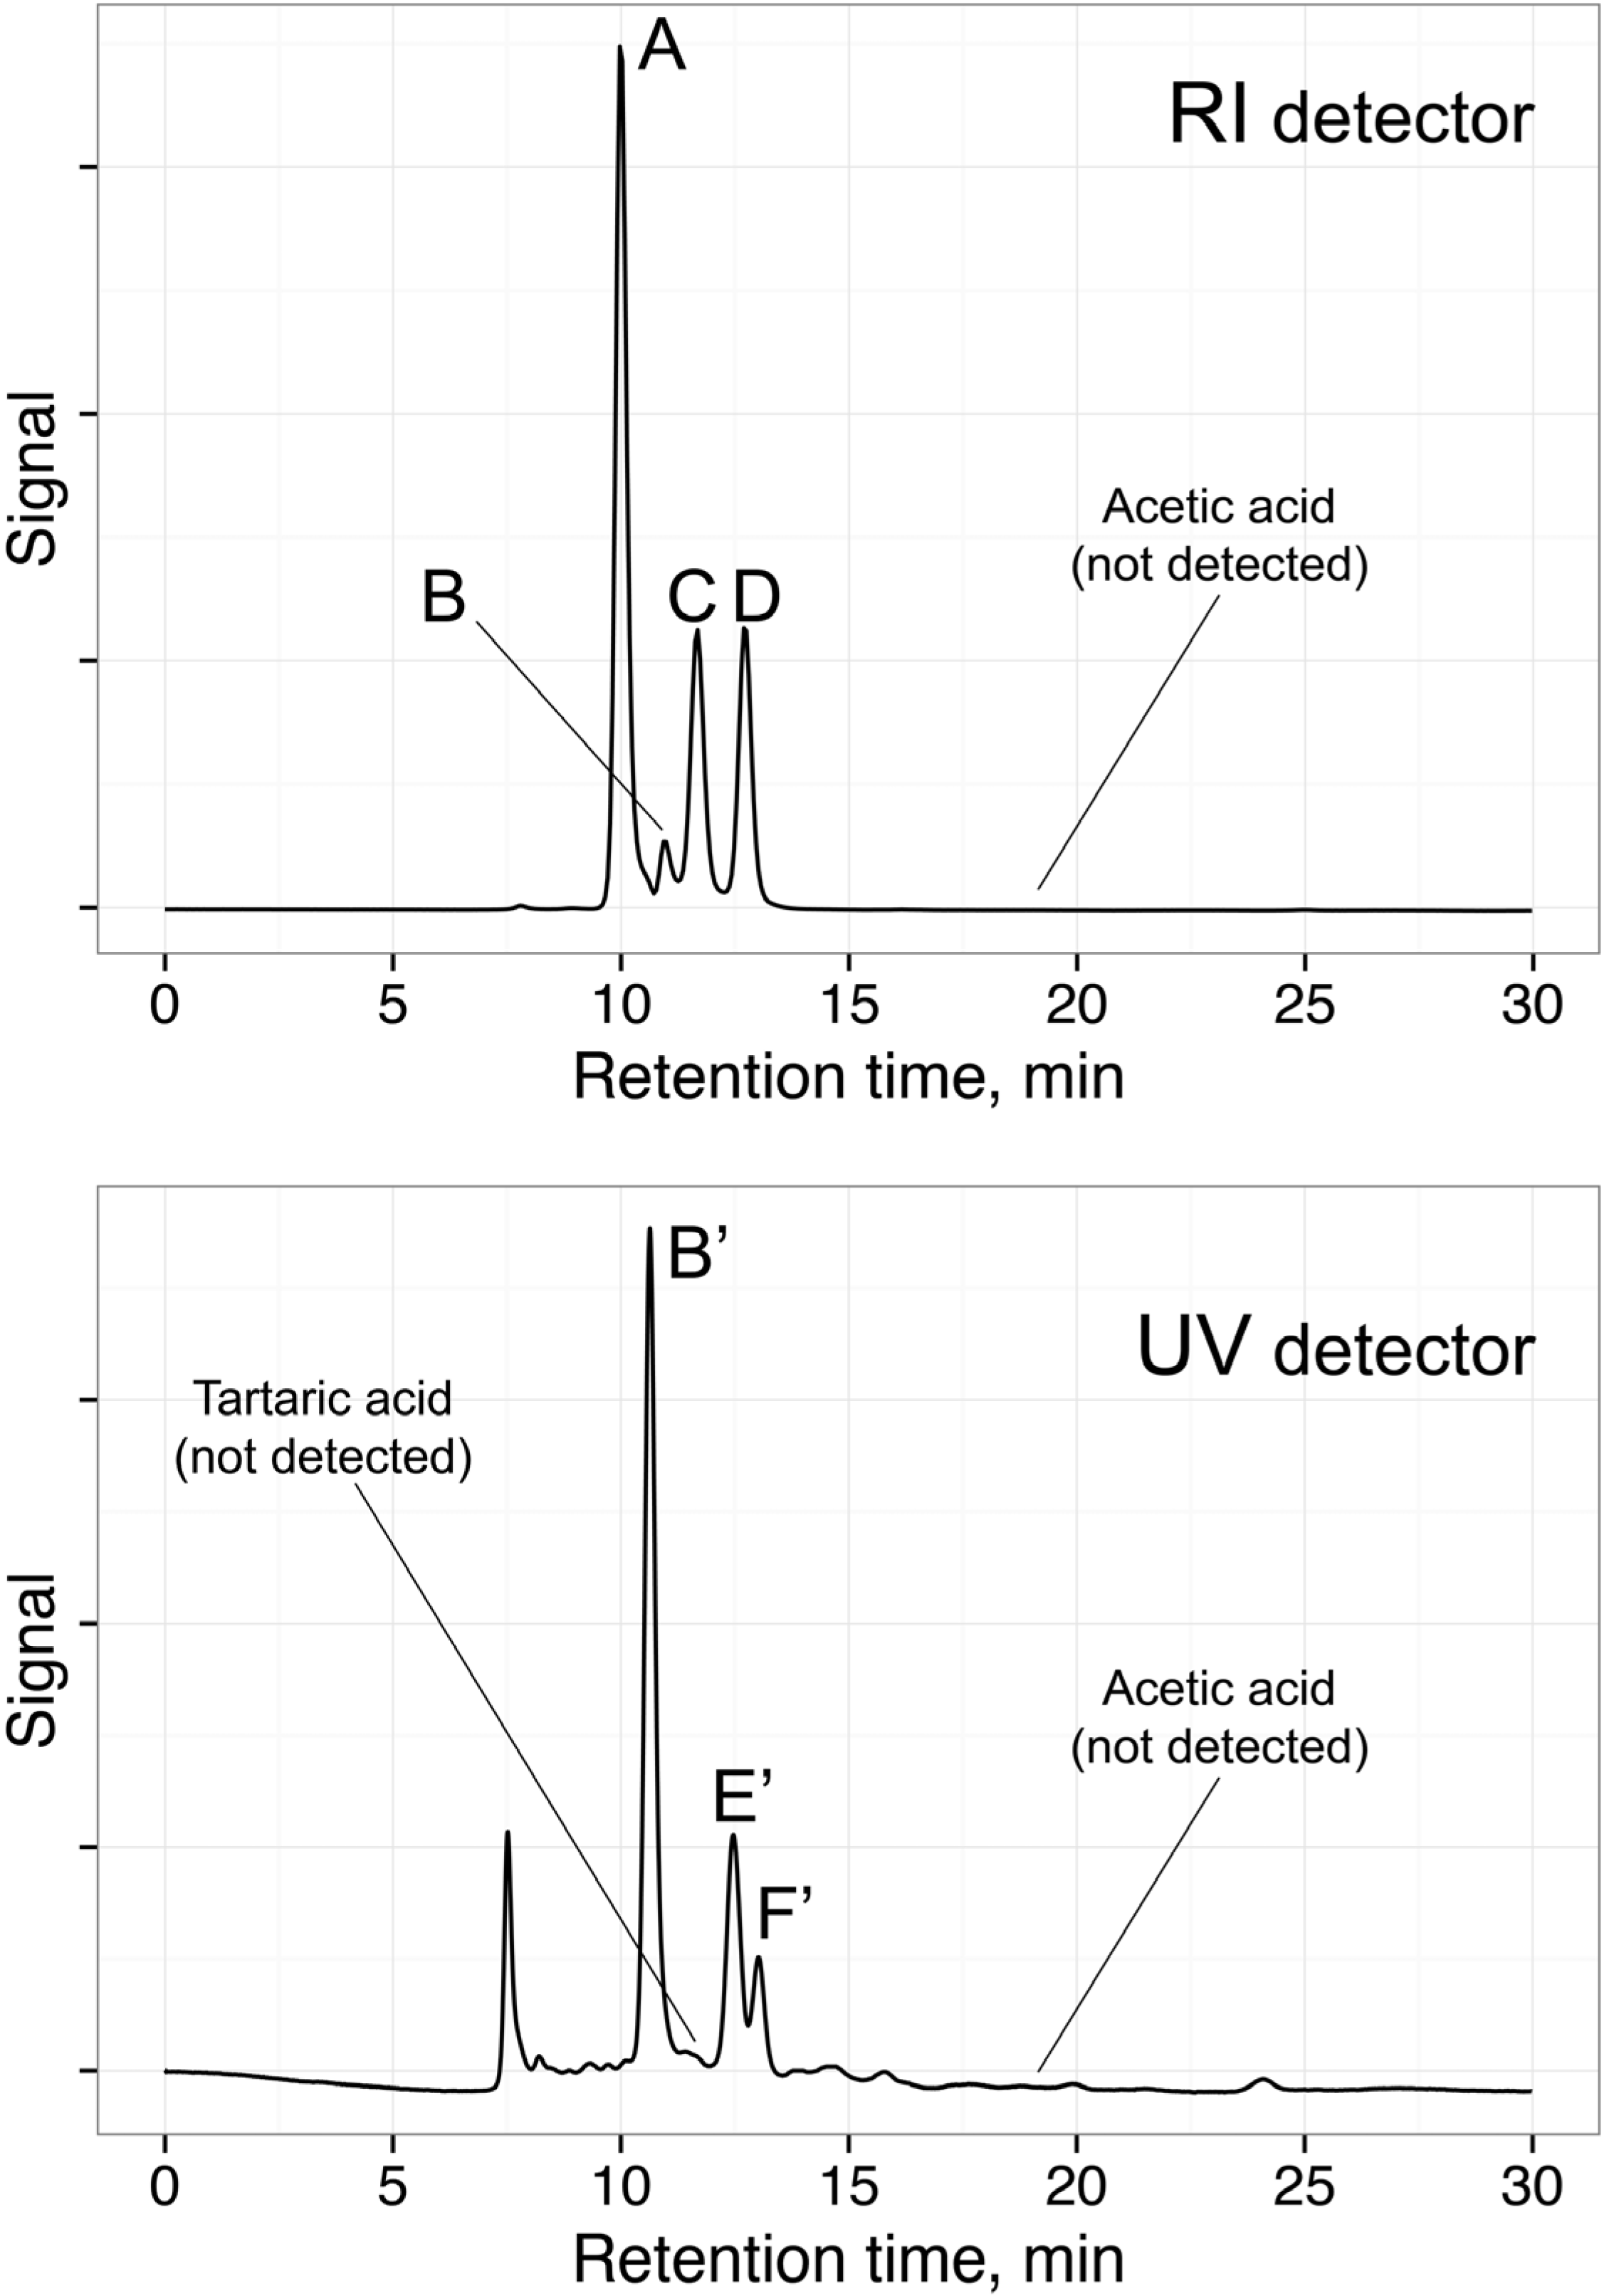
3.1.2. Co-Eluted Analytes Quantification


3.1.3. Precision (Repeatability and Intermediate Precision)
3.1.4. Accuracy
| Compound | Quality Control Solution a | Sample nº 2 | |||
|---|---|---|---|---|---|
| Mean ± SD (g L−1) | RSD% | RE% | Mean ± SD (g L−1) | RSD% | |
| Repeatability | |||||
| Glucose | 0.719 ± 0.005 | 0.8 | 0.8 | 1.142 ± 0.004 | 0.3 |
| Fructose | 1.42 ± 0.01 | 0.7 | 2.1 | 2.361 ± 0.009 | 0.4 |
| Sucrose | 0.786 ± 0.007 | 0.8 | 1.1 | 0.92 ± 0.01 | 1.4 |
| Acetic acid | 0.085 ± 0.002 | 2.3 | 3.4 | d | -- |
| Ascorbic acid | 0.692 ± 0.006 | 1.0 | 2.7 | 0.342 ± 0.008 | 2.2 |
| Citric acid | 0.702 ± 0.002 | 0.4 | 1.4 | 2.51 ± 0.01 | 0.4 |
| Malic acid | 0.834 ± 0.006 | 0.8 | 1.6 | 2.55 ± 0.04 | 1.8 |
| Intermediate precision | |||||
| Glucose | 0.73 ± 0.01 | 1.5 | 1.8 | 1.13 ± 0.02 | 2.0 |
| Fructose | 1.438 ± 0.004 | 0.3 | 1.3 | 2.29 ± 0.02 | 1.0 |
| Sucrose | 0.782 ± 0.005 | 0.6 | 1.6 | 0.913 ± 0.006 | 0.6 |
| Acetic acid | 0.083 ± 0.003 | 4.6 | 4.3 | d | -- |
| Ascorbic acid | 0.679 ± 0.004 | 0.5 | 4.5 | 0.34 ± 0.02 | 4.9 |
| Citric acid | 0.784 ± 0.002 | 0.2 | 1.9 | 2.51 ± 0.006 | 0.2 |
| Malic acid | 0.83 ± 0.02 | 2.2 | 2.4 | 2.47 ± 0.07 | 2.9 |
3.2. HPLC Analysis of Beverage Samples
| Samples | Sucrose (g L−1) | Glucose (g L−1) | Fructose, (g L−1) | Citric Acid (g L−1) | Malic Acid (g L−1) | Ascorbic Acid (g L−1) |
|---|---|---|---|---|---|---|
| 1 | 14.2 | 11.3 | 16.1 | 4.96 | nd | 0.202 |
| 2 | 9.69 | 11.6 | 22.6 a | 2.20 | 2.04 | 0.235 |
| 3 | 13.0 | 12.9 | 15.0 a | 5.41 | 1.08 | 0.144 |
| 4 | 1.49 | 10.0 | 19.0 a | 2.76 | 2.31 | 0.140 |
| 5 | 14.7 | 13.0 | 20.5 a | 3.55 | 1.79 | 0.136 |
| 6 | 74.0 | 17.8 | 16.2 a | 1.39 | 2.43 | 0.197 |
| 7 | 11.6 | 32.0 | 56.3 a | 2.07 | 0.342 | 0.138 |
| 8 | 60.3 | 19.2 | 25.9 | 2.62 | nd | 0.275 |
| 9 | 13.0 | 29.7 | 69.3 a | 1.19 | 4.70 | 0.150 |
| 10 | d | 14.4 | 16.5 a | 2.94 | 1.06 | 0.217 |
| 11 | 35.0 | 25.0 | 30.2 | 7.85 | nd | 0.374 |
| 12 | 15.9 | 16.9 | 16.7 a | 2.02 | 1.43 | 0.145 |
| 13 | 47.5 | 11.7 | 26.5 | 1.22 | nd | 0.144 |
| 14 | d | 11.8 | 13.6 | 3.44 | nd | 0.214 |
| 15 | 57.0 | 24.2 | 27.8 | 3.23 | nd | 0.189 |
| 16 | 72.4 | 19.5 | 22.1 | 3.17 | nd | 0.212 |
| 17 | 42.0 | 32.4 | 38.6 | 3.26 | nd | 0.184 |
| 18 | 35.0 | 28.6 | 31.7 | 2.45 | nd | nd |
| 19 | 42.4 | 28.1 | 33.6 | 3.65 | nd | 0.141 |
| 20 | 67.0 | 20.4 | 23.1 | 2.20 | nd | 0.169 |
| 21 | 68.5 | 17.9 | 21.5 | 3.74 | nd | 0.180 |
| 22 | 32.7 | 32.4 | 23.1 | 1.74 | nd | 0.157 |
| 23 | 38.4 | 36.0 | 30.4 | 1.27 | nd | 0.147 |
| 24 | 30.5 | 42.7 | 28.5 | 1.88 | nd | 0.135 |
| 25 | 25.2 | 11.5 | 13.1 | 2.61 | nd | 0.152 |
| 26 | 9.73 | 57.5 | 44.5 | 1.81 | nd | nd |
| 27 | 19.3 | 22.2 | 27.1 | 3.65 | nd | 0.163 |
| 28 | 31.6 | 54.1 | 84.3 | 3.71 | nd | 0.201 |
| 29 | 76.8 | 26.1 | 29.1 | 7.35 | nd | 0.205 |
| 30 | 2.45 | 10.0 | 17.2 | 1.67 | nd | 0.159 |
| ANOVA b | a | a | a | b | b | c |
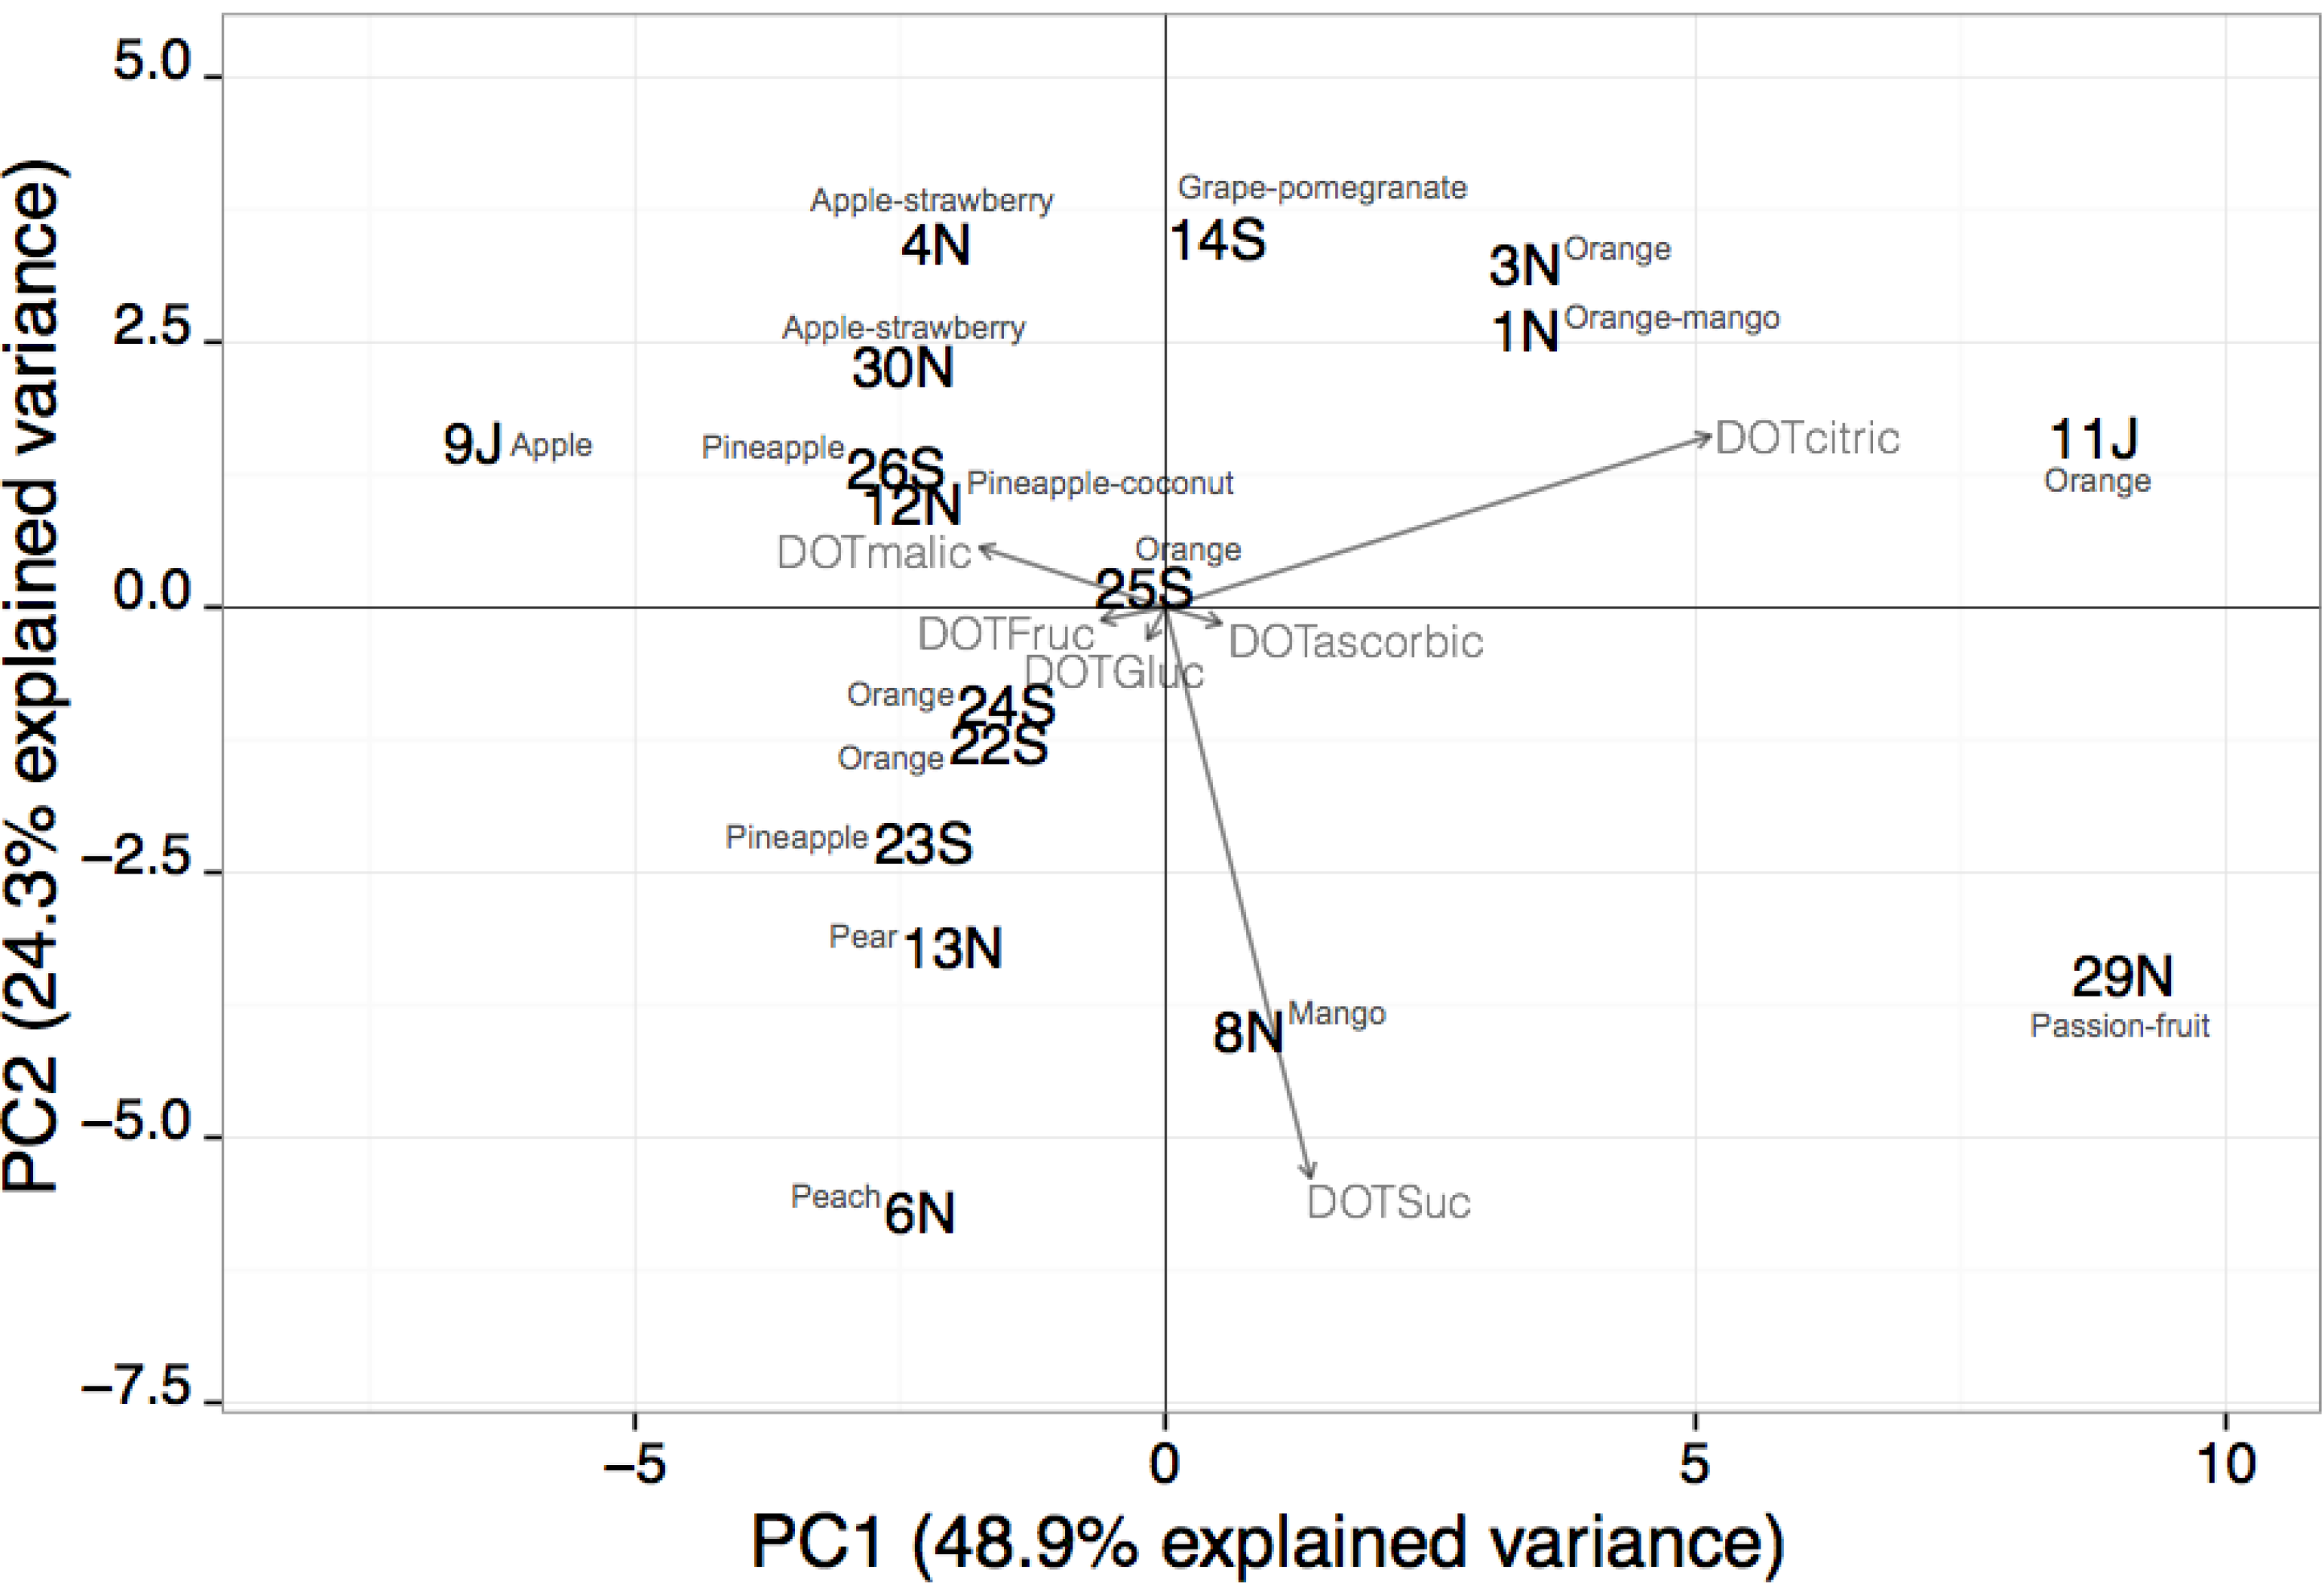
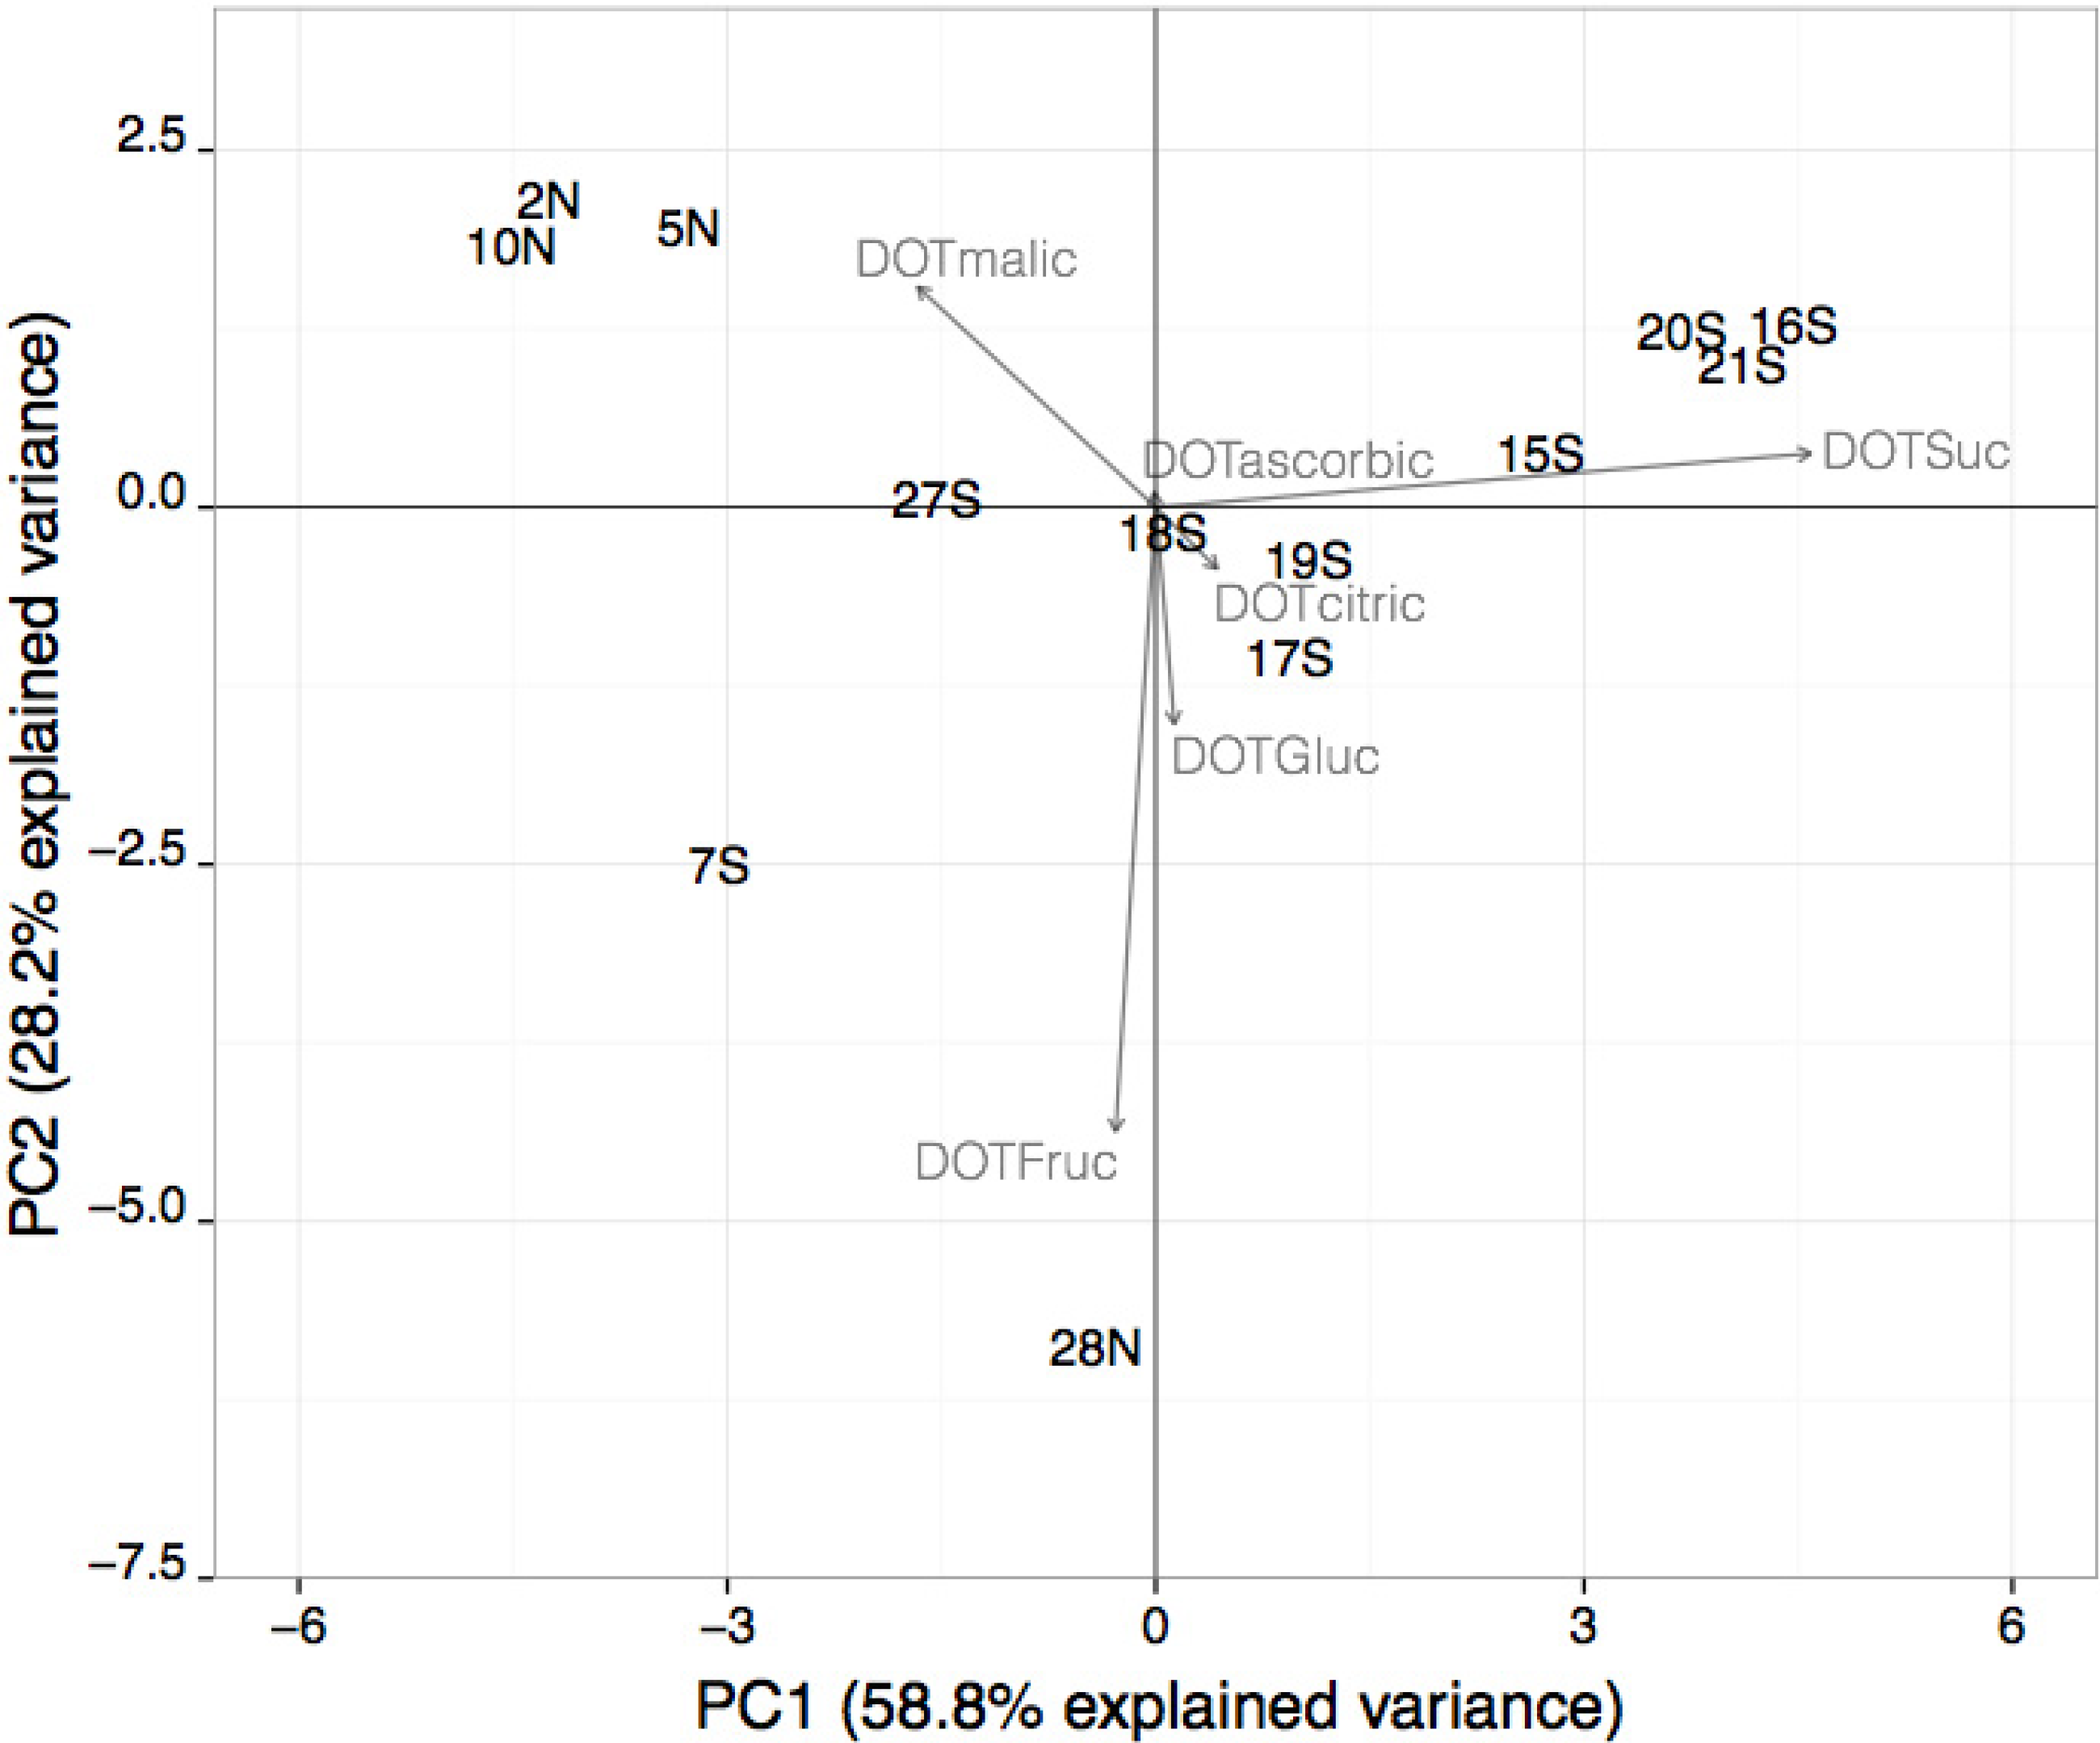
3.3. DOT Values: Contribution for Unsupervised Classification of Beverage Samples
| Sample Number | DOT Values | ||||||||
|---|---|---|---|---|---|---|---|---|---|
| Sucrose | Glucose | Fructose | Citric Acid | Malic Acid | Ascorbic Acid | ||||
| 1 | 1.7 | 0.7 | 1.7 | 9.1 | -- | 1.6 | |||
| 2 | 1.2 | 0.7 | 2.4 | 4.0 | 4.1 | 1.9 | |||
| 3 | 1.6 | 0.8 | 1.6 | 9.9 | 2.2 | 1.2 | |||
| 4 | 0.2 | 0.6 | 2.0 | 5.1 | 4.7 | 1.1 | |||
| 5 | 1.8 | 0.8 | 2.2 | 6.5 | 3.6 | 1.1 | |||
| 6 | 9.0 | 1.1 | 1.7 | 2.5 | 4.9 | 1.6 | |||
| 7 | 1.4 | 2.0 | 6.0 | 3.8 | 0.7 | 1.1 | |||
| 8 | 7.3 | 1.2 | 2.8 | 4.8 | -- | 2.2 | |||
| 9 | 1.6 | 1.8 | 7.4 | 2.2 | 9.5 | 1.2 | |||
| 10 | -- | 0.9 | 1.8 | 5.4 | 2.1 | 1.8 | |||
| 11 | 4.3 | 1.5 | 3.2 | 14.4 | -- | 3.0 | |||
| 12 | 1.9 | 1.0 | 1.8 | 3.7 | 2.9 | 1.2 | |||
| 13 | 5.8 | 0.7 | 2.8 | 2.2 | -- | 1.2 | |||
| 14 | -- | 0.7 | 1.5 | 6.3 | -- | 1.7 | |||
| 15 | 6.9 | 1.5 | 3.0 | 5.9 | -- | 1.5 | |||
| 16 | 8.8 | 1.2 | 2.4 | 5.8 | -- | 1.7 | |||
| 17 | 5.1 | 2.0 | 4.1 | 6.0 | -- | 1.5 | |||
| 18 | 4.3 | 1.8 | 3.4 | 4.5 | -- | -- | |||
| 19 | 5.2 | 1.7 | 3.6 | 6.7 | -- | 1.1 | |||
| 20 | 8.2 | 1.3 | 2.5 | 4.0 | -- | 1.4 | |||
| 21 | 8.3 | 1.1 | 2.3 | 6.8 | -- | 1.5 | |||
| 22 | 4.0 | 2.0 | 2.5 | 3.2 | -- | 1.3 | |||
| 23 | 4.7 | 2.2 | 3.2 | 2.3 | -- | 1.2 | |||
| 24 | 3.7 | 2.6 | 3.0 | 3.4 | -- | 1.1 | |||
| 25 | 3.1 | 0.7 | 1.4 | 4.8 | -- | 1.2 | |||
| 26 | 1.2 | 3.5 | 4.8 | 3.3 | -- | -- | |||
| 27 | 2.4 | 1.4 | 2.9 | 6.7 | -- | 1.3 | |||
| 28 | 3.8 | 3.3 | 9.0 | 6.8 | -- | 1.6 | |||
| 29 | 9.4 | 1.6 | 3.1 | 13.5 | -- | 1.7 | |||
| 30 | 0.3 | 0.6 | 1.8 | 3.1 | -- | 1.3 | |||
| ANOVA a | ade | bc | abd | abe | bcde | bc | |||
4. Conclusions
Acknowledgments
Author Contributions
Conflicts of Interest
References
- Ashurst, P.R. Chemistry and Technology of Soft drinks and Fruit Juices, 2nd ed.; Blackwell Publishing: Hereford, UK, 2005. [Google Scholar]
- Terry, L.A.; White, S.F.; Tigwell, L.A. The application of biosensors to fresh produce and the wider food industry. J. Agric. Food Chem. 2005, 53, 1309–1319. [Google Scholar]
- Keutgen, A.; Pawelzik, E. Modifications of taste-relevant compounds in strawberry fruit under NaCl salinity. Food Chem. 2007, 105, 1487–1494. [Google Scholar]
- Bordonaba, J.G.; Terry, L.A. Biochemical Profiling and Chemometric Analysis of Seventeen UK-Grown Black Currant Cultivars. J. Agric. Food Chem. 2008, 56, 7422–7430. [Google Scholar] [CrossRef]
- Crespo, P.; Bordonaba, J.G.; Terry, L.A.; Carlen, C. Characterisation of major taste and health-related compounds of four strawberry genotypes grown at different Swiss production sites. Food Chem. 2010, 122, 16–24. [Google Scholar] [CrossRef]
- Dias, L.G.; Sequeira, C.; Veloso, A.C.A.; Sousa, M.E.B.C.; Peres, A.M. Evaluation of healthy and sensory indexes of sweetened beverages using an electronic tongue. Anal. Chim. Acta 2014. in Press. [Google Scholar]
- Scharbert, S.; Hofmann, T. Molecular Definition of Black Tea Taste by Means of Quantitative Studies, Taste Reconstitution, and Omission Experiments. J. Agric. Food Chem. 2005, 53, 5377–5384. [Google Scholar] [CrossRef]
- McFeeters, R.F. Single-Injection HPLC Analysis of Acids, Sugars, and Alcohols in Cucumber Fermentations. J. Agric. Food Chem. 1993, 41, 1439–1443. [Google Scholar] [CrossRef]
- Yuan, J.P.; Chen, F. Simultaneous separation and determination of sugars, ascorbic acid and furanic compounds by HPLC—dual detection. Food Chem. 1999, 64, 423–427. [Google Scholar] [CrossRef]
- Kelebek, H.; Selli, S.; Canbas, A.; Cabaroglu, T. HPLC determination of organic acids, sugars, phenolic compositions and antioxidant capacity of orange juice and orange wine made from a Turkish cv. Kozan. Microchem. J. 2009, 91, 187–192. [Google Scholar] [CrossRef]
- Eyéghé-Bickong, H.A.; Alexandersson, E.O.; Gouws, L.M.; Young, P.R.; Vivier, M.A. Optimisation of an HPLC method for the simultaneous quantification of the major sugars and organic acids in grapevine berries. J. Chromatogr. B 2012, 885–886, 43–49. [Google Scholar] [CrossRef]
- Pérez, A.G.; Olías, R.; Espada, J.; Olías, J.M.; Sanz, C. Rapid Determination of Sugars, Nonvolatile Acids and Ascorbic Acid in Strawberry and Other Fruits. J. Agric. Food Chem. 1997, 45, 3545–3549. [Google Scholar] [CrossRef]
- Chinnici, F.; Spinabelli, U.; Riponi, C.; Amati, A. Optimization of the determination of organic acids and sugars in fruit juices by ion-exclusion liquid chromatography. J. Food Comp. Anal. 2005, 18, 121–130. [Google Scholar] [CrossRef]
- Wu, J.; Gao, H.; Zhao, L.; Liao, X.; Chen, F.; Wang, Z.; Hu, X. Chemical compositional characterization of some apple cultivars. Food Chem. 2007, 103, 88–93. [Google Scholar] [CrossRef]
- Nishiyama, I.; Fukuda, T.; Shimohashi, A.; Oota, T. Sugar and Organic Acid Composition in the Fruit Juice of Different Actinidia Varieties. Food Sci. Technol. Res. 2008, 14, 67–73. [Google Scholar] [CrossRef]
- Versari, A.; Parpinello, G.P.; Mattioli, A.U.; Galassi, S. Characterisation of Italian commercial apricot juices by high-performance liquid chromatography analysis and multivariate analysis. Food Chem. 2008, 108, 334–340. [Google Scholar]
- Obando-Ulloa, J.M.; Eduardo, I.; Monforte, A.J.; Fernández-Trujillo, J.P. Identification of QTLs related to sugar and organic acid composition in melon using near-isogenic lines. Sci. Hortic. 2009, 121, 425–433. [Google Scholar] [CrossRef]
- Muñoz-Robredo, P.; Robledo, P.; Manríquez, D.; Molina, R.; Defilippi, B.G. Characterization of sugars and organic acids in commercial varieties of table grapes. Chil. J. Agr. Res. 2011, 71, 452–458. [Google Scholar] [CrossRef]
- Mahmood, T.; Anwar, F.; Abbas, M.; Boyce, M.C.; Saari, N. Compositional Variation in Sugars and Organic Acids at Different Maturity Stages in Selected Small Fruits from Pakistan. Int. J. Mol. Sci. 2012, 13, 1380–1392. [Google Scholar] [CrossRef]
- Carballo, S.; Zingarello, F.A.; Maestre, S.E.; Todolí, J.L.; Prats, M.S. Optimisation of analytical methods for the characterization of oranges, clementines and citrus hybrids cultivated in Spain on the basis of their composition in ascorbic acid, citric acid and major sugars. J. Food Sci. Technol. 2014, 49, 146–152. [Google Scholar]
- Sokullu, R.; Palabiyik, I.M.; Onur, F.; Boyaci, I.H. Chemometric methods for simultaneous quantification of lactic, malic and fumaric acids. Eng. Life Sci. 2010, 10, 297–303. [Google Scholar] [CrossRef]
- Ermer, J.; McB. Miller, J.H. Method Validation in Pharmaceutical Analysis: A Guide to Best Practice; Wiley-VCH Verlag GmbH & Co.: Weinheim, Germany, 2005. [Google Scholar]
- Snyder, L.R.; Kirkland, J.J.; Dolan, J.W. Introduction to Modern Liquid Chromatography, 3rd ed.; John Wiley & Sons Inc.: Hoboken, NJ, USA, 2010. [Google Scholar]
- Funk, W.; Dammann, V.; Donnevert, G. Quality Assurance in Analytical Chemistry: Applications in Environmental, Food and Materials Analysis, Biotechnology, and Medical Engineering; Wiley-VCH Verlag GmbH & Co.: Weinheim, Germany, 2007. [Google Scholar]
- Dalgaarde, P. Introductory Statistics with R (Statistics and Computing); Springer: New York, NY, USA, 2008. [Google Scholar]
- Rencher, A.C. Methods of multivariate analysis; Wiley: New York, NY, USA, 1995. [Google Scholar]
- The R Project for Statistical Computing. Available online: http://www.r-project.org/ (accessed on 16 September 2014).
- Venables, W.N.; Ripley, B.D. Modern Applied Statistics with S; Springer-Verlag: New York, NY, USA, 2002. [Google Scholar]
- Castellari, M.; Versari, A.; Spinabelli, U.; Galassi, S.; Amati, A. An improved HPLC method for the analysis of organic acids, carbohydrates and alcohols in grape musts and wines. J. Liq. Chromatogr. Relat. Technol. 2000, 23, 2047–2056. [Google Scholar] [CrossRef]
© 2014 by the authors; licensee MDPI, Basel, Switzerland. This article is an open access article distributed under the terms and conditions of the Creative Commons Attribution license (http://creativecommons.org/licenses/by/3.0/).
Share and Cite
Dias, L.G.; Sequeira, C.; Veloso, A.C.A.; Morais, J.S.; Sousa, M.E.B.C.; Peres, A.M. A Size Exclusion HPLC Method for Evaluating the Individual Impacts of Sugars and Organic Acids on Beverage Global Taste by Means of Calculated Dose-Over-Threshold Values. Chromatography 2014, 1, 141-158. https://doi.org/10.3390/chromatography1030141
Dias LG, Sequeira C, Veloso ACA, Morais JS, Sousa MEBC, Peres AM. A Size Exclusion HPLC Method for Evaluating the Individual Impacts of Sugars and Organic Acids on Beverage Global Taste by Means of Calculated Dose-Over-Threshold Values. Chromatography. 2014; 1(3):141-158. https://doi.org/10.3390/chromatography1030141
Chicago/Turabian StyleDias, Luís G., Cédric Sequeira, Ana C. A. Veloso, Jorge Sá Morais, Mara E. B. C. Sousa, and António M. Peres. 2014. "A Size Exclusion HPLC Method for Evaluating the Individual Impacts of Sugars and Organic Acids on Beverage Global Taste by Means of Calculated Dose-Over-Threshold Values" Chromatography 1, no. 3: 141-158. https://doi.org/10.3390/chromatography1030141
APA StyleDias, L. G., Sequeira, C., Veloso, A. C. A., Morais, J. S., Sousa, M. E. B. C., & Peres, A. M. (2014). A Size Exclusion HPLC Method for Evaluating the Individual Impacts of Sugars and Organic Acids on Beverage Global Taste by Means of Calculated Dose-Over-Threshold Values. Chromatography, 1(3), 141-158. https://doi.org/10.3390/chromatography1030141