Abstract
In this work, the main organic acids (citric, malic and ascorbic acids) and sugars (glucose, fructose and sucrose) present in commercial fruit beverages (fruit carbonated soft-drinks, fruit nectars and fruit juices) were determined. A novel size exclusion high performance liquid chromatography isocratic green method, with ultraviolet and refractive index detectors coupled in series, was developed. This methodology enabled the simultaneous quantification of sugars and organic acids without any sample pre-treatment, even when peak interferences occurred. The method was in-house validated, showing a good linearity (R > 0.999), adequate detection and quantification limits (20 and 280 mg L−1, respectively), satisfactory instrumental and method precisions (relative standard deviations lower than 6%) and acceptable method accuracy (relative error lower than 5%). Sugars and organic acids profiles were used to calculate dose-over-threshold values, aiming to evaluate their individual sensory impact on beverage global taste perception. The results demonstrated that sucrose, fructose, ascorbic acid, citric acid and malic acid have the greater individual sensory impact in the overall taste of a specific beverage. Furthermore, although organic acids were present in lower concentrations than sugars, their taste influence was significant and, in some cases, higher than the sugars’ contribution towards the global sensory perception.
1. Introduction
The consumption of fruit beverages has increased in the last few years, mainly due to their appreciated sensorial attributes. These kinds of beverages include soft-drinks (minimum percentage of added juice lower than 25%), fruit nectars and fruit juice beverages (minimum percentage of added juice higher than 25%) [1]. The overall well-balanced flavor of a specific beverage is influenced by the sweetness and acid taste perception, which may be evaluated using beverage’s sugars and organic acids contents [2,3,4,5]. Furthermore, knowing sugars contents would allow the calculation of important healthy indexes, such as glycemic load and fructose intolerance ratio, as described in a recent work of our research team [6]. Therefore, considering the impact of these sensory and healthy parameters in the consumer’s acceptability of a specific beverage, it is important to be able to quantify the concentration of the main sugars (e.g., glucose, fructose and sucrose) and organic acids (e.g., malic, ascorbic, tartaric and citric acids), as well as to evaluate their individual sensory contribution to the global taste perception, which may be done by calculating the respective dose-over-threshold values [7].
Sugars and organic acids concentrations in beverages are usually quantified using liquid chromatography in a single run [8,9,10,11] or separate runs [12,13,14,15,16,17,18,19,20]. The use of ultraviolet (UV) or photodiode array (DA) detectors and a refractive index (RI) detector or an evaporative light scattering detector (ELSD) enables quantifying organic acids and sugars, respectively. However, the occurrence of interferences, such as overlapping peaks, has been reported during fruit juice analysis. Pérez et al. [12] observed the co-elution of fructose/malic acid and glucose/tartaric acid, when an isocratic elution (8.5 mN H2SO4 aqueous) was carried out using a hydrogen cation-exchange polymer column. The analysis was made in separate runs, after cleaning or fractionation sample pre-treatment steps. Chinnici et al. [13] noticed the co-elution of malic/quinic acids, succinic/shikimic acids and fructose/quinic acid, using an isocratic elution (1 mN aqueous phosphoric acid solution) with an Aminex hydrogen form cation-exchange resin-based column. Separate runs were performed after a sample’s clean-up step. Eyéghé-Bickong et al. [11] reported unresolved separation peaks between malic acid and fructose for the analysis of grapevine berries, using also an Aminex cation-exchange column with 5 mM aqueous H2SO4, as the isocratic mobile phase. The same interference was also found by Carballo et al. [20], for a two-run analysis, using a polymeric anion exchange column (with 80 mM aqueous solution of NaOH as the eluent) and an ion-exclusion column in hydrogen form (using 5 mM aqueous solution of H2SO4 as the eluent). However, few of these works report HPLC analytical method validation [11,12,13,20], and only one reports the simultaneous quantification of sugars and organic acids in a single run [11].
Therefore, in the present work, it was intended to develop a simple isocratic HPLC method using, for the first time, a size exclusion column, for the rapid separation and quantification of the major organic acids and sugars in soft-drinks and fruit beverages. A single chromatographic run, using a water-based eluent, was envisaged. To overcome possible interference issues (e.g., overlapping peak signals), a multivariate approach for quantifying these compounds was considered to keep the experimental methodology as simply as possible, avoiding any time-consuming sample pre-treatment step or separate chromatographic injections [21]. The method was in-house validated considering linearity, detection and quantification limits, repeatability, precision and/or accuracy. Finally, based on the sugars and organic acids contents, their individual contribution towards global taste perception was evaluated by means of dose-over-threshold (DOT) values calculated as the ratio of the concentration of each compound in the fruit juice and the respective taste threshold [3,7]. This sensory attribute was further used with the purpose of evaluating its potential in understanding how commercial fruit beverages could be assembled into groups considering individual compounds’ impact on the overall taste perception.
2. Experimental Section
2.1. Reagents
All of the reagents were of analytical grade and used as purchased. Solutions were prepared using deionized water. For HPLC analysis, the eluent was prepared with orthophosphoric acid from Panreac. The working standard solution was prepared using standards of sugars and organic acids commonly found in non-alcoholic beverages: fructose, glucose, malic acid and acetic acid from Fluka; sucrose and ascorbic acid from Panreac; citric acid monohydrate of Fisher Scientific and tartaric acid from Riedel-deHaën.
2.2. Samples
Thirty beverage samples were acquired at commercial providers in Bragança City, Portugal, including soft-drinks (15 fruit-based sugar-sweetened carbonated beverages) and fruit beverages (13 fruit nectars and 2 fruit juices). Table 1 shows detailed information regarding the samples studied based on the respective labels. Samples with the same characteristics were from different brands.
2.3. Standard and Sample Preparation
For HPLC calibration and performance evaluation, standard solutions containing sugars (fructose, glucose and sucrose) and organic acids (acetic, ascorbic, citric, malic and tartaric acids) were prepared by dissolving the required amount of each standard in deionized water. Before HPLC analysis, all standard solutions were filtered through a 0.2-μm nylon filter (Whatman, Buckinghamshire, UK). Standard concentrations ranging from 0.1 to 8.4 g L−1 for organic acids and from 0.3 to 5.2 g L−1 for sugars were analyzed in a single run. Beverage samples were analyzed as purchased, except soft-drinks, which were degassed during 5 min in an ultrasonic bath (Elma Transsonic 460/H, Singen, Germany). When necessary, beverage samples were diluted with deionized water. All beverage samples were filtered through a 0.2-μm nylon filter (Whatman, Buckinghamshire, UK) and stored at −5 °C until analysis.

Table 1.
Details regarding the beverage samples analyzed according to the labeling information.
| Sample Number | Beverage Brand | Main Fruits in the Composition | Beverage Type a | Minimum Juice % |
|---|---|---|---|---|
| 1 | A | Orange, mango | Nectar | 45 |
| 2 | A | Orange, apple, passion-fruit | Nectar | 50 |
| 3 | A | Orange | Nectar | 50 |
| 4 | A | Strawberry, apple | Nectar | 45 |
| 5 | B | Orange, carrot, mango | Nectar | 50 |
| 6 | B | Peach | Nectar | 50 |
| 7 | B | Carrot, mango, tomato, apple, passion, kiwi, lemon | Soft-drink | 25 |
| 8 | B | Mango | Nectar | 30 |
| 9 | B | Apple | Juice | 100 |
| 10 | B | Red fruits | Nectar | 40 |
| 11 | B | Orange | Juice | 100 |
| 12 | B | Pineapple, coconut | Nectar | 43 |
| 13 | B | Pear | Nectar | 50 |
| 14 | B | Grape and pomegranate fruits and green tea | Soft-drink | 20 |
| 15 | A | Orange, apple, pineapple, mango, apricot | Soft-drink | 20 |
| 16 | A | Pineapple, apple, orange, banana | Soft-drink | 20 |
| 17 | A | Apple, orange, pineapple, mango, guava, banana | Soft-drink | 20 |
| 18 | C | Strawberry | Soft-drink | 14 |
| 19 | C | Orange, pineapple, passion-fruit, apricot, guava, mango, banana | Soft-drink | 20 |
| 20 | C | Pineapple | Soft-drink | 20 |
| 21 | C | Orange | Soft-drink | 20 |
| 22 | D | Orange | Soft-drink | 10 |
| 23 | D | Pineapple | Soft-drink | 8 |
| 24 | E | Orange | Soft-drink | 8 |
| 25 | F | Orange | Soft-drink | 11 |
| 26 | E | Pineapple | Soft-drink | 6 |
| 27 | F | Tropical fruits | Soft-drink | 12 |
| 28 | B | Carrot, mango, tomato, apple, passion-fruit, kiwi, lemon | Nectar | 32 |
| 29 | B | Passion-fruit | Nectar | 25 |
| 30 | B | Strawberry, apple | Nectar | 45 |
a Beverage classification according to legal regulations [1].
2.4. HPLC System, Separation and Performance Evaluation
An HPLC Varian ProStar equipped with a 220 pump (Varian, Inc., Walnut Creek, CA, USA), a 7725i Rheodyne manual injector, provided with a 20-μL loop, a 7981 Jones Chromatography column oven (Lakewood, CO, USA), with an UV detector (Varian, model 9050, Walnut Creek, CA, USA) coupled to an RI detector (Varian, model RI-4, Minato-Ku, Japan), was used to simultaneously separate and quantify organic acids and sugars. A flow rate of 1 mL min−1 was applied in a Supelcogel size exclusion column (SEC: C-610H model, 30 cm × 7.8 mm id), thermostated at 45 °C, which was, to the best knowledge of the authors, used for the first time for sugars and organic acids analysis in beverages. An isocratic elution, with a mobile phase consisting of a 0.1% orthophosphoric acid aqueous solution, was used. Star Chromatography Workstation software (version 6.4, Varian Inc., Walnut Creek, CA, USA) was used for data acquisition and peak integration. Organic acids were detected with the UV detector at 210 nm, while sugars were detected with the RI detector. Chromatographic peaks of sugars and organic acids were identified by comparing the retention times of solutions of a single pure compound with those recorded for standard mixtures containing all of the analyzed compounds or diluted beverage samples. Peaks were quantified with an external standard calibration method based on areas. The HPLC performance was evaluated considering linearity parameters, instrument and method precision (including repeatability and intermediate precision assays) and accuracy.
2.4.1. Linearity, Limits of Detection and of Quantification
The linearity of the method was evaluated using five mixed standard solutions with different concentrations of the three sugars and five organic acids. Each standard mixture was prepared independently by measuring the appropriate mass of each compound in order to obtain the concentration ranges reported in the previous subsection. Due to co-elution issues reported in the literature [11,12,13,20], between some sugars and organic acids, additional assays were carried out. To study possible interferences between tartaric acid and glucose or malic acid and fructose, new standard solutions, with different concentrations, were prepared by mixing seven of the eight compounds under analysis, each solution without one of the above-mentioned two organic acids or two monosaccharides. Each solution was analyzed separately, and the responses in both (UV and RI) detectors were compared to the known concentrations. The same calibration runs were used to determine the detection and quantification limits (LD and LQ, respectively), which were calculated from the parameters of the calibration curves, being defined as 3.3- and 10-times the value of the intercept error divided by the slope, respectively [22,23]. In the cases of co-elution, multivariate calibration curves were established taking into account both co-eluted components.
2.4.2. Precision (Repeatability and Intermediate Precision)
The instrumental precision was evaluated by means of repeatability and intermediate precision assays using a quality control solution containing a mixture of all sugars and organic acids studied. The quality control solution was injected, in triplicate, on the same day, under the working conditions to evaluate the repeatability of the instrumental system (i.e., intra-day variation, considering only within-day variations). The intermediate precision of the system was also evaluated by determining the variability of the responses of the injections of the reference standard solution in three consecutive days (i.e., inter-day variation considering within- and between-day variations).
The method precision was also inferred with the evaluation of repeatability and intermediate precision, using one beverage sample for studying possible the matrix influence. The chosen sample was injected 3 times in the same day and 3 times per day in three consecutive days.
2.4.3. Accuracy
The instrumental accuracy was evaluated using the repeatability and intermediate precision data obtained for the quality control solution. The known concentration of each standard compound (obtained from the mass values used) was compared with the concentration of each compound calculated from the calibration curves previously established.
2.5. Dose-Over-Threshold Values Calculation
The taste contribution of each individual compound was assessed by means of the dose-over-threshold value (DOT), which allows rating the individual sensory impact. The DOT values were calculated as the ratio of actual (in mol L−1) and taste threshold (in mol L−1) concentration for the given compound, the taste threshold concentration in water being obtained from the literature [7]: glucose: 0.090 mol L−1; fructose: 0.052 mol L−1; sucrose: 0.024 mol L−1; ascorbic acid: 0.00070 mol L−1; citric acid: 0.0026 mol L−1; malic acid: 0.0037 mol L−1. DOT values greater than 1 indicate a significant influence of a specific compound on the global taste perception of a juice.
2.6. Statistical Analysis
Mandel’s fitting test was applied in order to evaluate the linear lack-of-fit of the calibration curves, based on the assumption that relatively large deviations of measured values from a straight line could be reduced by a better regression model, in this case a second-order function [24].
To verify if there were significant differences between the chemical parameters analyzed in the samples, the Welch’s analysis of variance (Welch’s ANOVA) was applied. This technique is used when the data do not show a balanced design, meaning that the number of observations was not the same in each group (chemical compound) and they have heteroscedasticity (different standard deviations in the different groups). The ANOVA is the most commonly used technique for comparing the means of groups of measurement data, followed by a post hoc test considering the Holm’s method for multiple comparisons, which allows one to verify which group means are statistically different [25].
A principal components analysis (PCA) was applied, as an unsupervised technique, for recognizing patterns in the calculated DOT data by plotting them in a multidimensional space, using the new derived variables as dimensions (factor scores). The scree plot estimated the number of factors retained in the data treatment taking into account the eigenvalues [26]. PCA was implemented without variable scaling allowing one to take into account the sensory impact of each compound (sugars and organic acids) in the global taste perception of each beverage studied, which was accessed by means of the DOT values (values greater than 1 indicate a significant influence on taste). All statistical data analyses were performed using the “stats” package that is part of R; a language and environment for statistical computing (version 2.15.2) and a free and open source software from the R Foundation for Statistical Computing organization [27,28].
3. Results and Discussion
3.1. HPLC in-House Validation
3.1.1. Linearity, Limits of Detection and of Quantification
A typical chromatogram of a standard mixture solution of sugars and organic acids is shown in Figure 1. The profile was recorded using an SEC column operating with 0.1% of phosphoric acid aqueous solution as the mobile phase at 45 °C. To the best of the authors’ knowledge, this is the first time that such a column has been used to simultaneously analyze sugars and organic acids in beverages.

Figure 1.
HPLC chromatograms of Sample 16 obtained by an RI detector and a UV detector: sucrose (A), citric acid (B), glucose (C), fructose (D); citric acid (B’), malic acid (E’), ascorbic acid (F’).
Figure 1.
HPLC chromatograms of Sample 16 obtained by an RI detector and a UV detector: sucrose (A), citric acid (B), glucose (C), fructose (D); citric acid (B’), malic acid (E’), ascorbic acid (F’).
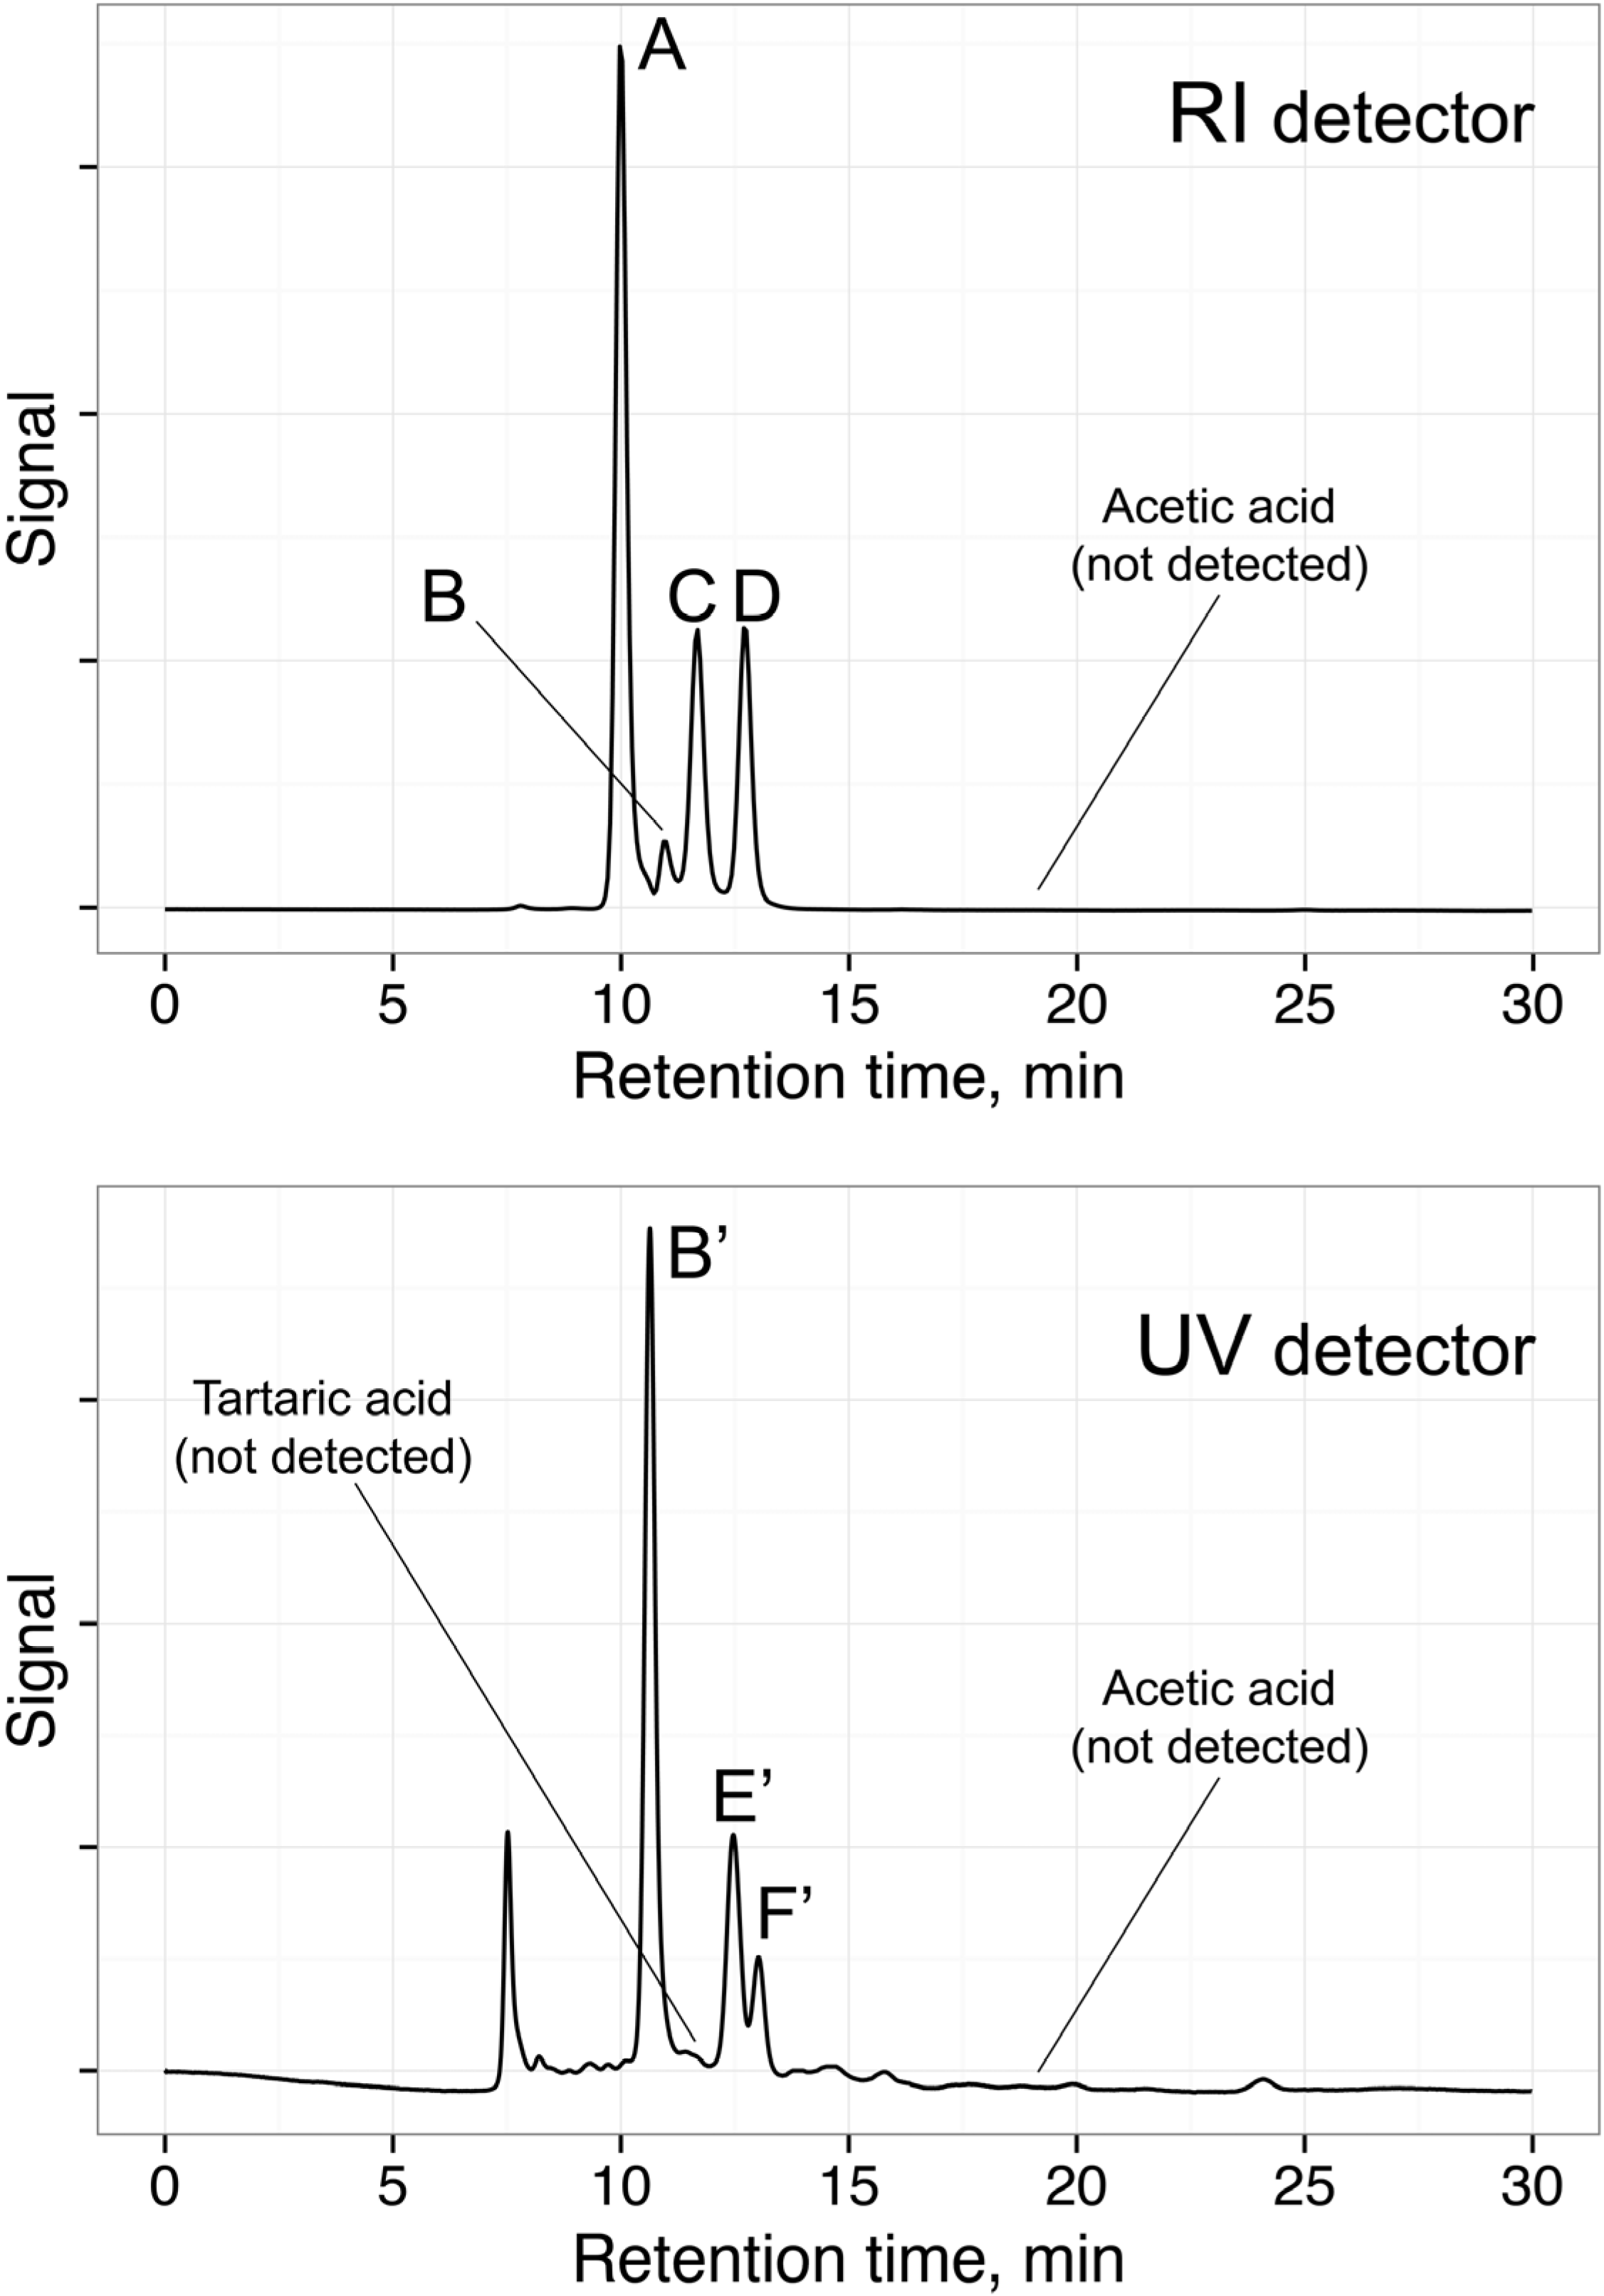
A single run method was used for raw or diluted samples, depending on the sugars concentrations. The method allowed separating all analytes studied, except malic acid/fructose and tartaric acid/glucose, which co-eluted, but could be detected by either RI or UV detectors.
Table 2 shows the overall parameters regarding the HPLC analysis of a mixture of calibration standard solutions prepared in order to determine the calibration curve for each analyte, avoiding co-elution issues. The results show that for each compound evaluated, a good linearity was achieved, all of the correlation coefficients (R) being greater than 0.999 and p-values for the lack of fit F-test (Mandel’s fitting test) greater than 0.05. The only exception was obtained from the calibration curve of tartaric acid, since it was found that the calibration curve should be represented by a second-degree polynomial equation (p-value of 0.002).
The detection and quantification limits of sugars and organic acids ranged between 20–91 mg L−1 and 60–280 mg L−1, respectively, which are comparable with those reported in the literature [11,12,13,20], as can be inferred by analyzing Table 3.
Table 2.
HPLC detector, standards concentration range and calibration curve parameters using a mixed standard solution of sugars and organic acids on a size exclusion column using 0.1% orthophosphoric acid aqueous solution as the eluent.
| Detector | Compound | Range, g L−1 | Slope ± SD, L g−1 | Intercept ± SD | R | Mandel’s Test (p-value) |
|---|---|---|---|---|---|---|
| RI | Sucrose | [0.326–5.02] | (171 ± 2) × 104 | (−4 ± 5) × 104 | 0.9995 | 0.287 |
| Glucose | [0.321–5.02] | (1950 ± 5) × 103 | (−3 ± 1) × 104 | 0.99998 | 0.944 | |
| Fructose | [0.348–5.13] | (2060 ± 6) × 103 | (10 ± 2) × 104 | 0.99996 | 0.274 | |
| UV | Citric acid | [0.114–4.62] | (1055 ± 8) × 103 | (−5 ± 2) × 104 | 0.9995 | 0.088 |
| Tartaric acid * | [0.691–8.34] | (1340 ± 6) × 103 | (9 ± 3) × 104 | 0.9991 | 0.002 | |
| Malic acid | [0.330–5.02] | (754 ± 2) × 103 | (14 ± 7) × 103 | 0.99995 | 0.256 | |
| Ascorbic acid | [0.105–1.03] | (258 ± 3) × 104 | (−7 ± 2) × 104 | 0.9994 | 0.372 | |
| Acetic acid | [0.128–1.06] | (484 ± 5) × 103 | (4 ± 3) × 103 | 0.9992 | 0.069 |
* Second degree polynomial calibration curve: area = −8.61 × 10³ × C2 + 1.42 × 10⁶ × C − 1.89 × 10⁴, R = 0.99994. Abbreviations: SD, standard deviation; R, correlation coefficient.
Table 3.
Limits of detection and quantification of the HPLC method proposed in this work and values reported in the literature for similar chromatographic methods.
| Compound | Single Run HPLC Analysis | Separate Runs HPLC Analysis | ||||
|---|---|---|---|---|---|---|
| This work | Eyéghé-Bickong et al. [11] | Pérez et al. [12] | Chinnici et al. [13] | Carballo et al. [20] | ||
| LD, mg L−1 | LQ, mg L−1 | LD, mg L−1 | LD, mg L−1 | LD, mg L−1 | LD, mg L−1 | |
| Sucrose | 90 | 270 | --- | 0.74 | 80 | 97 |
| Glucose | 24 | 74 | 160 | 1.51 | 70 | 67 |
| Fructose | 26 | 77 | 70 | 6.56 | 70 | 93 |
| Citric acid | 48 | 150 | 30 | 18.6 | 3.3 | 0.08 |
| Tartaric acid | 77 | 230 | 20 | --- | --- | --- |
| Malic acid | 32 | 98 | 20 | 28.7 | 1.8 | co-eluted |
| Ascorbic acid | 22 | 68 | --- | 8.29 | --- | 0.003 |
| Acetic acid | 20 | 60 | --- | --- | --- | --- |
Abbreviations: LD, limit of detection; LQ, limit of quantification.
Concerning the analyzed sugars, the obtained detection limits were higher than the ones presented by Pérez et al. [12], but lower than those reported by Eyéghé-Bickong et al. [11], Chinnici et al. [13] and Carballo et al. [20]. Regarding organic acids, the detection limits of the proposed method were always higher than those mentioned in the previous works [12,13,20], but of the same magnitude [11], when a single-run analysis was employed.
Therefore, globally, the green single-run analytical method developed in this work is a practical and suitable technique for the simultaneous analysis of sugars and organic acids in beverages.
3.1.2. Co-Eluted Analytes Quantification
To overcome quantification issues due to the co-elution of malic acid/fructose and tartaric acid/glucose, a multivariate linear approach was applied. For that, standard mixture solutions, with and without those analytes, were prepared and peak areas recorded with both detectors. The signals recorded showed that co-elution (overlapping peaks) issues were only observed for the RI detector, similarly as reported by Castellari et al. [29]. Therefore, the concentrations of malic and tartaric acids were calculated using the UV response, and therefore, the concentrations of fructose and glucose, respectively, based on the RI response were corrected accordingly to the following equations (R > 0.9999):


None of these two equations has an intercept value, since it was not statistically significant (p-value >0.05) and, therefore, it could be set equal to zero. Concerning the slope values calculated for fructose or glucose, they are similar to those values obtained using standard mixture solutions without malic or tartaric acids (Table 2). This fact shows that overlapping areas are additive and therefore that the proposed correction can be used. Since tartaric acid was not detected in the analyzed beverages, the correction for glucose quantification was not necessary, and thus, the in-house validation data for that compound is not presented.
3.1.3. Precision (Repeatability and Intermediate Precision)
The instrumental precision was evaluated by means of repeatability and intermediate precision assays using a quality control solution containing a mixture of all sugars and organic acids usually present in fruit beverage samples (Table 4). For intra-day assays, the percentage relative standard deviation (RSD%) of the concentration obtained for each sugar and organic acid, by HPLC analysis, ranged between 0.7%–0.8% and 0.4%–1%, respectively. For inter-day assays, the RSD% varied between 0.6%–1.5% and 0.2%–2.2% for sugars and organic acids, respectively.
The repeatability and intermediate precision of the method was also studied using a random selected beverage sample (Sample 2, which corresponds to a fruit nectar with 50% minimum added juice). Globally, for sugars and organic acids detected in the analyzed sample, the RSD% varied from 0.3%–2.2% and 0.2%–4.9% for repeatability and intermediate precision assays, respectively. Therefore, the precision of the proposed single-run HPLC method is acceptable (RSD% lower than 5% [22]) and similar to the precision of separate run analysis reported in the literature (RSD% values varying from 0.2% to 6.6% for intra- and/or inter-day assays [12,13,20]).
3.1.4. Accuracy
The instrumental accuracy was evaluated using the concentration of each compound calculated in the repeatability and intermediate precision study for a quality control solution. The known concentration of each standard compound (obtained from the mass values used) was compared with those calculated from the calibration curves previously established. The percentage relative error (RE%) for all compounds analyzed was lower than 5% (Table 4), showing an acceptable accuracy for the proposed single-run HPLC method.
Table 4.
Precision and accuracy evaluation by terms of repeatability and intermediate assays using a quality control solution containing a mixture of all sugars and organic acids and a beverage sample.
| Compound | Quality Control Solution a | Sample nº 2 | |||
|---|---|---|---|---|---|
| Mean ± SD (g L−1) | RSD% | RE% | Mean ± SD (g L−1) | RSD% | |
| Repeatability | |||||
| Glucose | 0.719 ± 0.005 | 0.8 | 0.8 | 1.142 ± 0.004 | 0.3 |
| Fructose | 1.42 ± 0.01 | 0.7 | 2.1 | 2.361 ± 0.009 | 0.4 |
| Sucrose | 0.786 ± 0.007 | 0.8 | 1.1 | 0.92 ± 0.01 | 1.4 |
| Acetic acid | 0.085 ± 0.002 | 2.3 | 3.4 | d | -- |
| Ascorbic acid | 0.692 ± 0.006 | 1.0 | 2.7 | 0.342 ± 0.008 | 2.2 |
| Citric acid | 0.702 ± 0.002 | 0.4 | 1.4 | 2.51 ± 0.01 | 0.4 |
| Malic acid | 0.834 ± 0.006 | 0.8 | 1.6 | 2.55 ± 0.04 | 1.8 |
| Intermediate precision | |||||
| Glucose | 0.73 ± 0.01 | 1.5 | 1.8 | 1.13 ± 0.02 | 2.0 |
| Fructose | 1.438 ± 0.004 | 0.3 | 1.3 | 2.29 ± 0.02 | 1.0 |
| Sucrose | 0.782 ± 0.005 | 0.6 | 1.6 | 0.913 ± 0.006 | 0.6 |
| Acetic acid | 0.083 ± 0.003 | 4.6 | 4.3 | d | -- |
| Ascorbic acid | 0.679 ± 0.004 | 0.5 | 4.5 | 0.34 ± 0.02 | 4.9 |
| Citric acid | 0.784 ± 0.002 | 0.2 | 1.9 | 2.51 ± 0.006 | 0.2 |
| Malic acid | 0.83 ± 0.02 | 2.2 | 2.4 | 2.47 ± 0.07 | 2.9 |
a Three replicas. Abbreviations: SD, standard deviation; RSD%, percentage relative standard deviation; RE%, percentage relative error; d, detected.
3.2. HPLC Analysis of Beverage Samples
The method was applied to evaluate commercial fruit beverages (fruit carbonated soft-drinks, fruit nectars and fruit juices) and to enable the simultaneous quantification of all compounds of interest in a single-run analysis. Peaks of the main sugars and organic acids, in the beverage samples, were identified by comparing their elution times to those obtained with standards. The identification procedure allowed the detection of three sugars (glucose, fructose and sucrose) and only four organic acids (acetic, ascorbic, citric and malic acids), the mean concentrations being presented in Table 5 for all compounds, except acetic acid, which was only detected in six samples, but below the limit of quantification levels. The results showed that tartaric acid was not detected in any beverage and that malic acid was not detected in nine beverages. All organic acids were quantified using the calibration curves established from UV detection and sucrose using the RI response. The quantification of fructose was accomplished using Equation (1), taking into account the RI response correction, as previously discussed. For statistical analysis purposes, when a compound was detected in a sample, its concentration was set equal to the respective detection limit. In the cases where a specific compound was not detected, its concentration in the sample was set equal to zero.
In the study of the analytical results variability, Welch’s ANOVA indicated a significant mean difference among the chemical parameters (p-value lower than 0.001). The overall results showed that sugars have higher concentrations that are statistically different from those obtained for acids. There were no significant differences between the sugars and also among the citric and malic acid compounds (Table 5).
Table 5.
Mean concentrations of sugars and organic acids of each beverage analyzed.
| Samples | Sucrose (g L−1) | Glucose (g L−1) | Fructose, (g L−1) | Citric Acid (g L−1) | Malic Acid (g L−1) | Ascorbic Acid (g L−1) |
|---|---|---|---|---|---|---|
| 1 | 14.2 | 11.3 | 16.1 | 4.96 | nd | 0.202 |
| 2 | 9.69 | 11.6 | 22.6 a | 2.20 | 2.04 | 0.235 |
| 3 | 13.0 | 12.9 | 15.0 a | 5.41 | 1.08 | 0.144 |
| 4 | 1.49 | 10.0 | 19.0 a | 2.76 | 2.31 | 0.140 |
| 5 | 14.7 | 13.0 | 20.5 a | 3.55 | 1.79 | 0.136 |
| 6 | 74.0 | 17.8 | 16.2 a | 1.39 | 2.43 | 0.197 |
| 7 | 11.6 | 32.0 | 56.3 a | 2.07 | 0.342 | 0.138 |
| 8 | 60.3 | 19.2 | 25.9 | 2.62 | nd | 0.275 |
| 9 | 13.0 | 29.7 | 69.3 a | 1.19 | 4.70 | 0.150 |
| 10 | d | 14.4 | 16.5 a | 2.94 | 1.06 | 0.217 |
| 11 | 35.0 | 25.0 | 30.2 | 7.85 | nd | 0.374 |
| 12 | 15.9 | 16.9 | 16.7 a | 2.02 | 1.43 | 0.145 |
| 13 | 47.5 | 11.7 | 26.5 | 1.22 | nd | 0.144 |
| 14 | d | 11.8 | 13.6 | 3.44 | nd | 0.214 |
| 15 | 57.0 | 24.2 | 27.8 | 3.23 | nd | 0.189 |
| 16 | 72.4 | 19.5 | 22.1 | 3.17 | nd | 0.212 |
| 17 | 42.0 | 32.4 | 38.6 | 3.26 | nd | 0.184 |
| 18 | 35.0 | 28.6 | 31.7 | 2.45 | nd | nd |
| 19 | 42.4 | 28.1 | 33.6 | 3.65 | nd | 0.141 |
| 20 | 67.0 | 20.4 | 23.1 | 2.20 | nd | 0.169 |
| 21 | 68.5 | 17.9 | 21.5 | 3.74 | nd | 0.180 |
| 22 | 32.7 | 32.4 | 23.1 | 1.74 | nd | 0.157 |
| 23 | 38.4 | 36.0 | 30.4 | 1.27 | nd | 0.147 |
| 24 | 30.5 | 42.7 | 28.5 | 1.88 | nd | 0.135 |
| 25 | 25.2 | 11.5 | 13.1 | 2.61 | nd | 0.152 |
| 26 | 9.73 | 57.5 | 44.5 | 1.81 | nd | nd |
| 27 | 19.3 | 22.2 | 27.1 | 3.65 | nd | 0.163 |
| 28 | 31.6 | 54.1 | 84.3 | 3.71 | nd | 0.201 |
| 29 | 76.8 | 26.1 | 29.1 | 7.35 | nd | 0.205 |
| 30 | 2.45 | 10.0 | 17.2 | 1.67 | nd | 0.159 |
| ANOVA b | a | a | a | b | b | c |
a Corrected concentration due to malic acid interference; b Letters (a, b and c) represent which parameters are different by the post hoc test with a significance of p = 0.05. Abbreviations: nd, not detected; d, detected.
3.3. DOT Values: Contribution for Unsupervised Classification of Beverage Samples
DOT values were calculated for each beverage sample according to Keutgen and Pawelzik [3] and are shown in Table 6, allowing the evaluation of each compound’s contribution to the beverage global taste perception. Compounds with DOT values greater than one have a significant individual sensory impact. The analysis of the DOT values clearly shows that, with the exception of glucose, all of the other compounds, when present in a specific beverage, have a significant sensory influence (DOT values higher than one). Furthermore, it should be noticed that the use of DOT values enables the verification of the real influence of each compound on the global taste perception of a specific beverage, revealing that a compound present in a low concentration can have a greater impact on the beverage taste than a more concentrated compound, which is the case for organic acids. For example, citric acid is present in the studied fruit beverages in concentrations lower than any of the sugars (2 < (citric acid, g L−1) < 8; 1.4 < (sugar, g L−1) < 85), but in most of the samples, citric acid has a greater individual sensory influence towards the global taste perception of the beverage (2.1 < DOTcitric acid < 14.5; 0.2 < DOTsugar < 9.5).
Table 6.
Dose-over-threshold calculated values for each individual sugar and organic acid present in each beverage.
| Sample Number | DOT Values | ||||||||
|---|---|---|---|---|---|---|---|---|---|
| Sucrose | Glucose | Fructose | Citric Acid | Malic Acid | Ascorbic Acid | ||||
| 1 | 1.7 | 0.7 | 1.7 | 9.1 | -- | 1.6 | |||
| 2 | 1.2 | 0.7 | 2.4 | 4.0 | 4.1 | 1.9 | |||
| 3 | 1.6 | 0.8 | 1.6 | 9.9 | 2.2 | 1.2 | |||
| 4 | 0.2 | 0.6 | 2.0 | 5.1 | 4.7 | 1.1 | |||
| 5 | 1.8 | 0.8 | 2.2 | 6.5 | 3.6 | 1.1 | |||
| 6 | 9.0 | 1.1 | 1.7 | 2.5 | 4.9 | 1.6 | |||
| 7 | 1.4 | 2.0 | 6.0 | 3.8 | 0.7 | 1.1 | |||
| 8 | 7.3 | 1.2 | 2.8 | 4.8 | -- | 2.2 | |||
| 9 | 1.6 | 1.8 | 7.4 | 2.2 | 9.5 | 1.2 | |||
| 10 | -- | 0.9 | 1.8 | 5.4 | 2.1 | 1.8 | |||
| 11 | 4.3 | 1.5 | 3.2 | 14.4 | -- | 3.0 | |||
| 12 | 1.9 | 1.0 | 1.8 | 3.7 | 2.9 | 1.2 | |||
| 13 | 5.8 | 0.7 | 2.8 | 2.2 | -- | 1.2 | |||
| 14 | -- | 0.7 | 1.5 | 6.3 | -- | 1.7 | |||
| 15 | 6.9 | 1.5 | 3.0 | 5.9 | -- | 1.5 | |||
| 16 | 8.8 | 1.2 | 2.4 | 5.8 | -- | 1.7 | |||
| 17 | 5.1 | 2.0 | 4.1 | 6.0 | -- | 1.5 | |||
| 18 | 4.3 | 1.8 | 3.4 | 4.5 | -- | -- | |||
| 19 | 5.2 | 1.7 | 3.6 | 6.7 | -- | 1.1 | |||
| 20 | 8.2 | 1.3 | 2.5 | 4.0 | -- | 1.4 | |||
| 21 | 8.3 | 1.1 | 2.3 | 6.8 | -- | 1.5 | |||
| 22 | 4.0 | 2.0 | 2.5 | 3.2 | -- | 1.3 | |||
| 23 | 4.7 | 2.2 | 3.2 | 2.3 | -- | 1.2 | |||
| 24 | 3.7 | 2.6 | 3.0 | 3.4 | -- | 1.1 | |||
| 25 | 3.1 | 0.7 | 1.4 | 4.8 | -- | 1.2 | |||
| 26 | 1.2 | 3.5 | 4.8 | 3.3 | -- | -- | |||
| 27 | 2.4 | 1.4 | 2.9 | 6.7 | -- | 1.3 | |||
| 28 | 3.8 | 3.3 | 9.0 | 6.8 | -- | 1.6 | |||
| 29 | 9.4 | 1.6 | 3.1 | 13.5 | -- | 1.7 | |||
| 30 | 0.3 | 0.6 | 1.8 | 3.1 | -- | 1.3 | |||
| ANOVA a | ade | bc | abd | abe | bcde | bc | |||
a Letters (a, b, c, d and e) represent which parameters are different by the post hoc test with a significance of p = 0.05. Abbreviations: DOT, dose-over-threshold values calculated has the ratio of actual concentration (in mol L−1) and the taste threshold (in mol L−1) for the given compound reported in the literature [7].
Welch’s ANOVA showed that there were significant differences between the DOT values of the compounds (p-value lower than 0.001). The multiple comparison test allowed one to reveal which compounds had DOT values with significant differences (Table 6). The results showed that there were more observed mean differences within compounds’ DOT values than those found in the analytical results.
Furthermore, in this study, the DOT values of the main compounds detected in the beverage samples (glucose, fructose and sucrose; ascorbic, citric and malic acids) were used in an attempt to verify the existence of similarity among different fruit beverages of six Portuguese brands, containing different amounts of added juice from one or more fruits (e.g., apple, banana, grape, kiwi, mango, orange, passion fruit, peach, pear, pineapple and/or strawberry, among other). This purpose was accomplished using PCA, an unsupervised statistical technique, after dividing into two main groups: beverages containing one or two fruits (17 samples, including two fruit juices, eight fruit nectars and seven soft-drinks) and multi-fruits beverages (13 samples, including four fruit nectars and nine soft-drinks), containing a mixture of four to nine fruits.
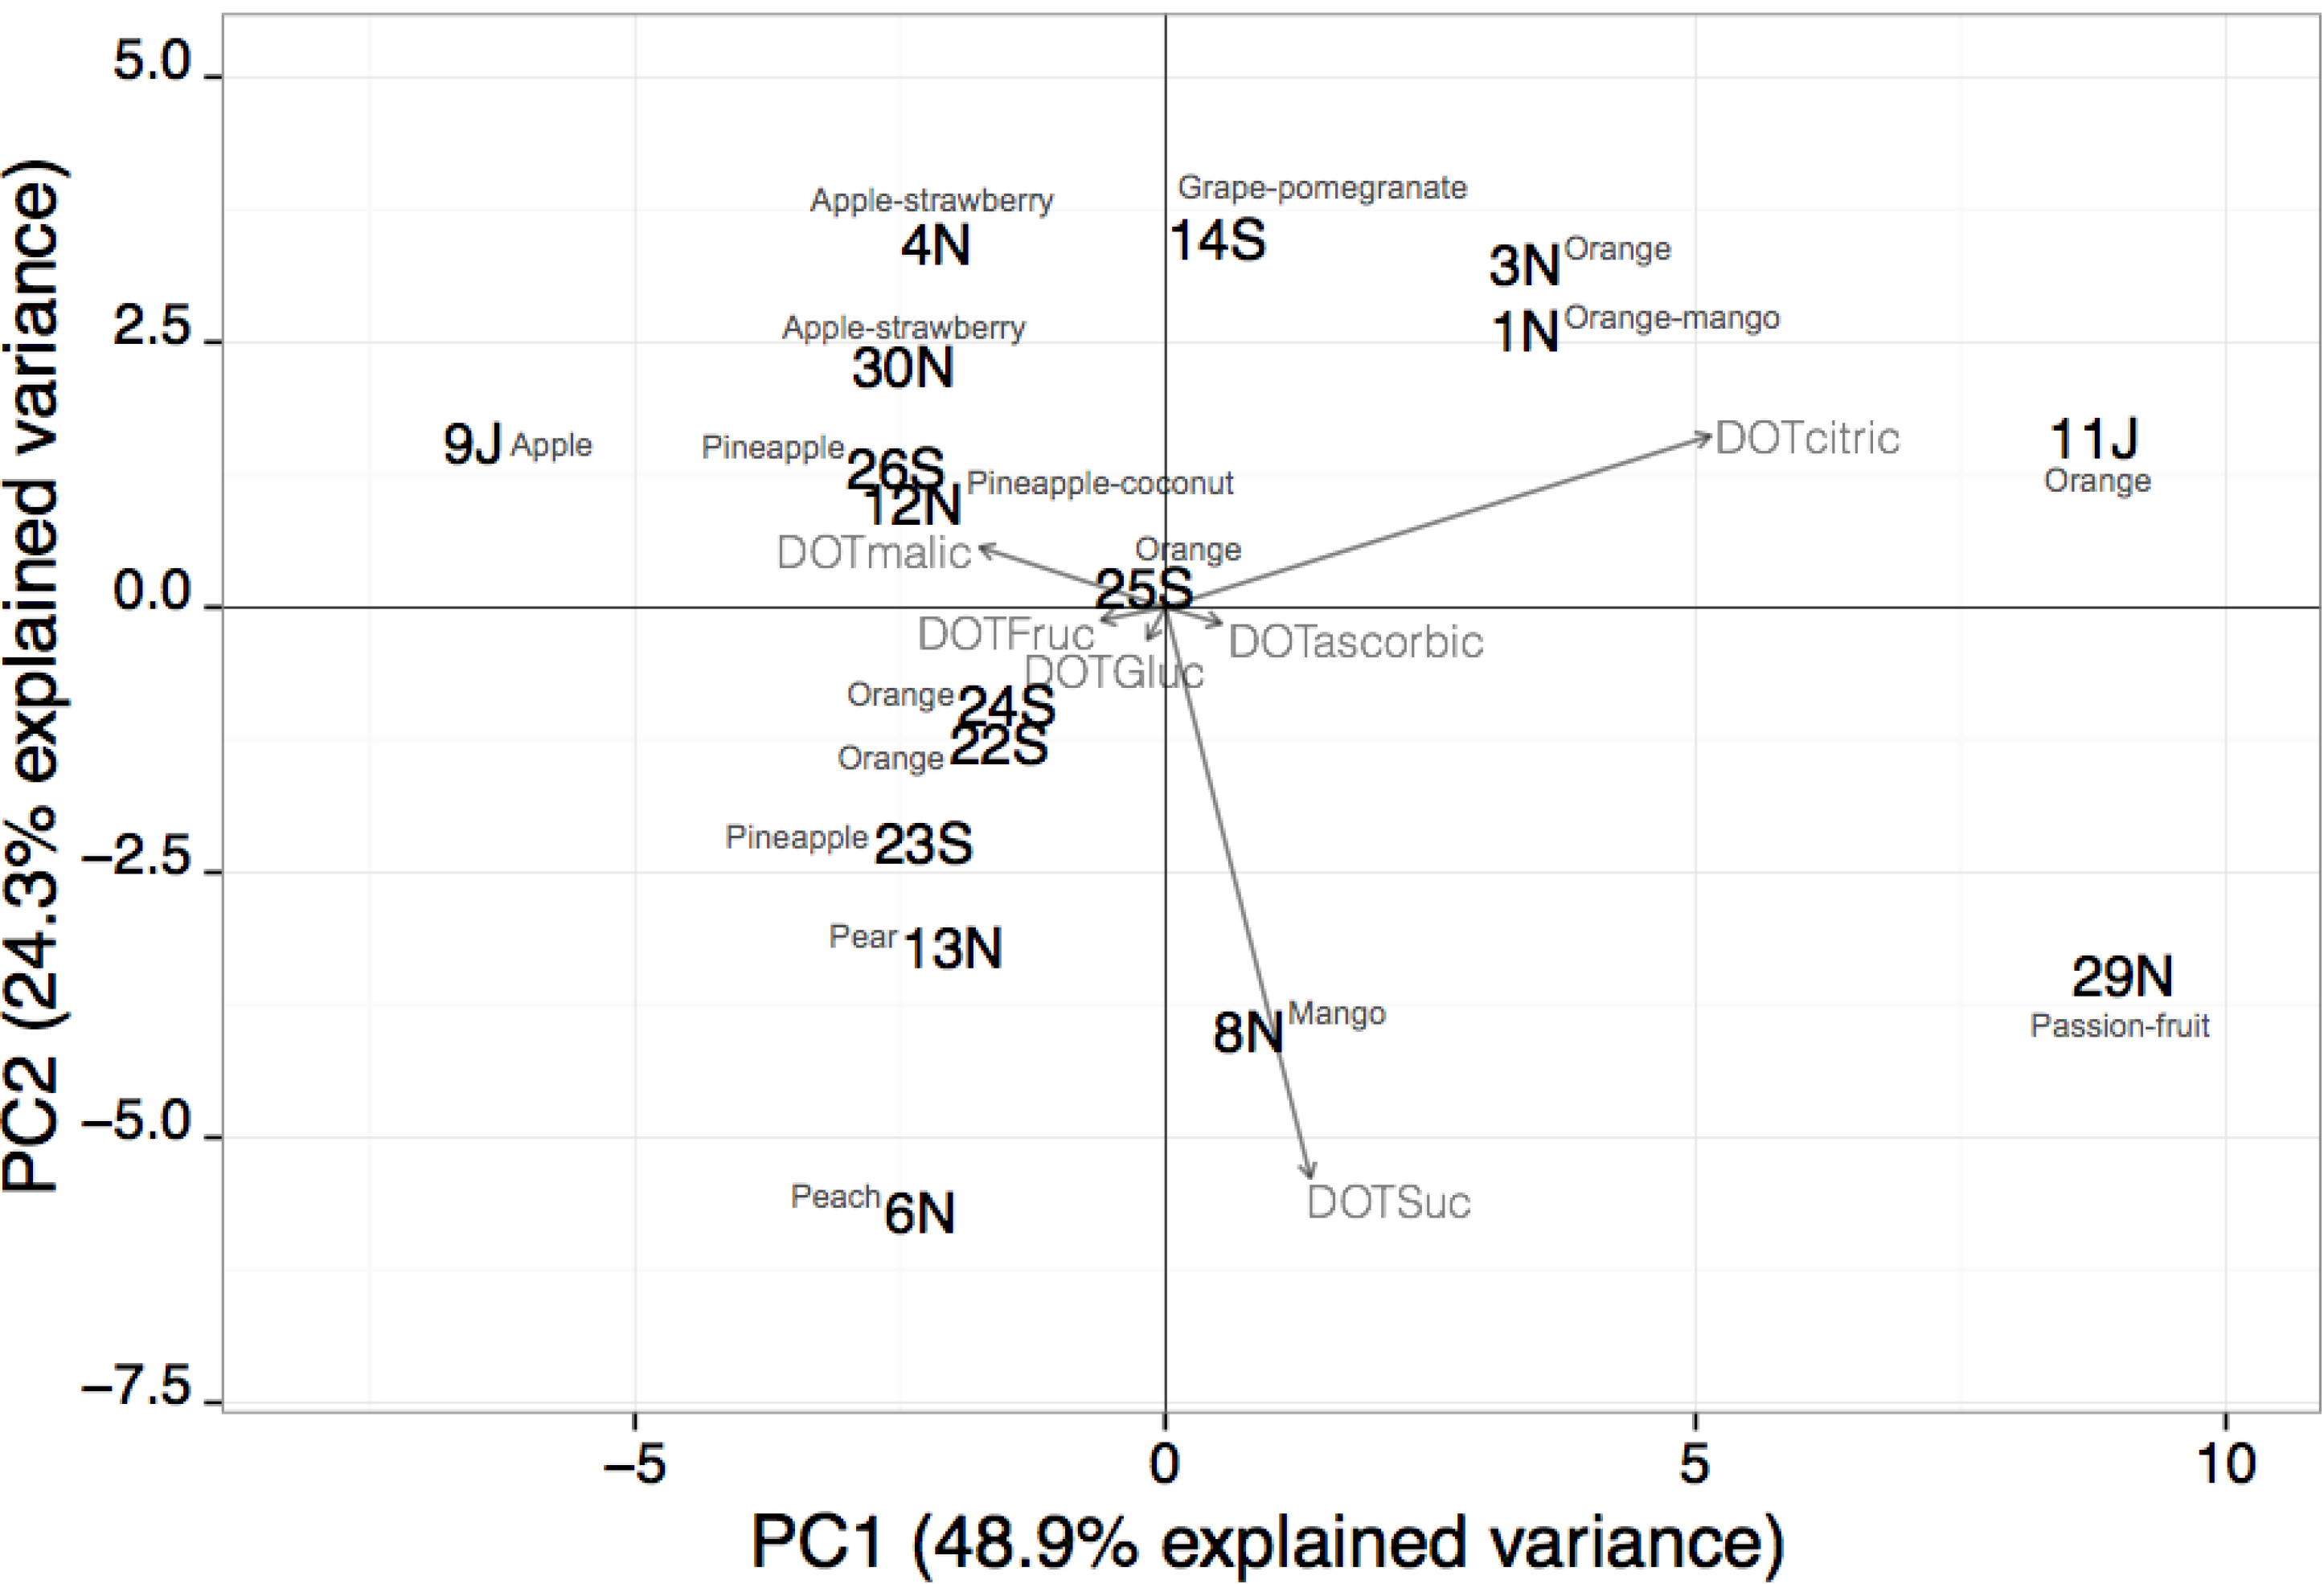
The PCA applied to beverages containing one to two fruits showed that the first four functions explained 98.9% of the total data variance (48.9%, 24.3%, 19.8% and 5.9%, respectively). In Figure 2, the two-dimensional spatial sample distribution considering the first and second principal component functions is shown.
As can be observed, samples were unsupervised and assembled into four main groups. The first group (located in the first quadrant, the positive regions of PC1 and PC2) includes four samples from the three types of beverages, mainly of orange fruit, for which citric acid has a significant impact on the beverage global taste (DOT values varying from 6.3 to 14.4). On the contrary, sugars have a medium to low contribution to the overall taste perception (DOT values between 0.7 and 4.3). In the second quadrant (negative and positive regions of PC1 and PC2, respectively), the formed group contains five beverage samples of pineapple, apple and/or strawberry, also from the three types of beverages, being characterized by average to high citric and/or malic acids DOT values (from 2.2 to 9.5) and a medium to low contribution of sugars towards taste (DOT values ranging from 0.2 to 4.8), with the exception of Sample 9, for which fructose has a high individual sensory impact (DOT equal to 7.4). In the third quadrant (negative regions of PC1 and PC2), for the five samples (fruit nectars and soft-drinks) of one fruit (peach, pear, pineapple or orange), sucrose has a high individual taste contribution (DOT values ranging from 3.7 to 9.4) and citric acid has a medium sensory impact (DOT values between 2.5 and 3.5). Finally, two samples are in the fourth quadrant (positive and negative regions of PC1 and PC2, respectively) for which, although sucrose has also a strong taste influence (DOT values equal to 7.3 and 9.4), as in the previous quadrant, citric acid has a significant individual sensory impact (DOT values equal to 4.8 and 13.5). Globally, the unsupervised groups that emerged considering the individual sensory contribution of sugars and organic acids may be tentatively related to the beverage’s well-balanced flavor, which results from achieving an equilibrium between its sweetness and acidity: high acidity and low sweetness beverages; medium acidity and low sweetness beverages; low acidity and high sweetness beverages; and high acidity and high sweetness beverages. As can be observed, the naturally formed groups appeared not to be related with beverage types or the kind of fruit present in the beverage.

Figure 2.
Representation of the two first principal component factor scores obtained for beverages containing one to two fruits using the sugars and organic acids DOT values (samples are identified by the number and type of fruit beverage: S, soft-drinks; N, fruit nectars; J, fruit juices).
Figure 2.
Representation of the two first principal component factor scores obtained for beverages containing one to two fruits using the sugars and organic acids DOT values (samples are identified by the number and type of fruit beverage: S, soft-drinks; N, fruit nectars; J, fruit juices).
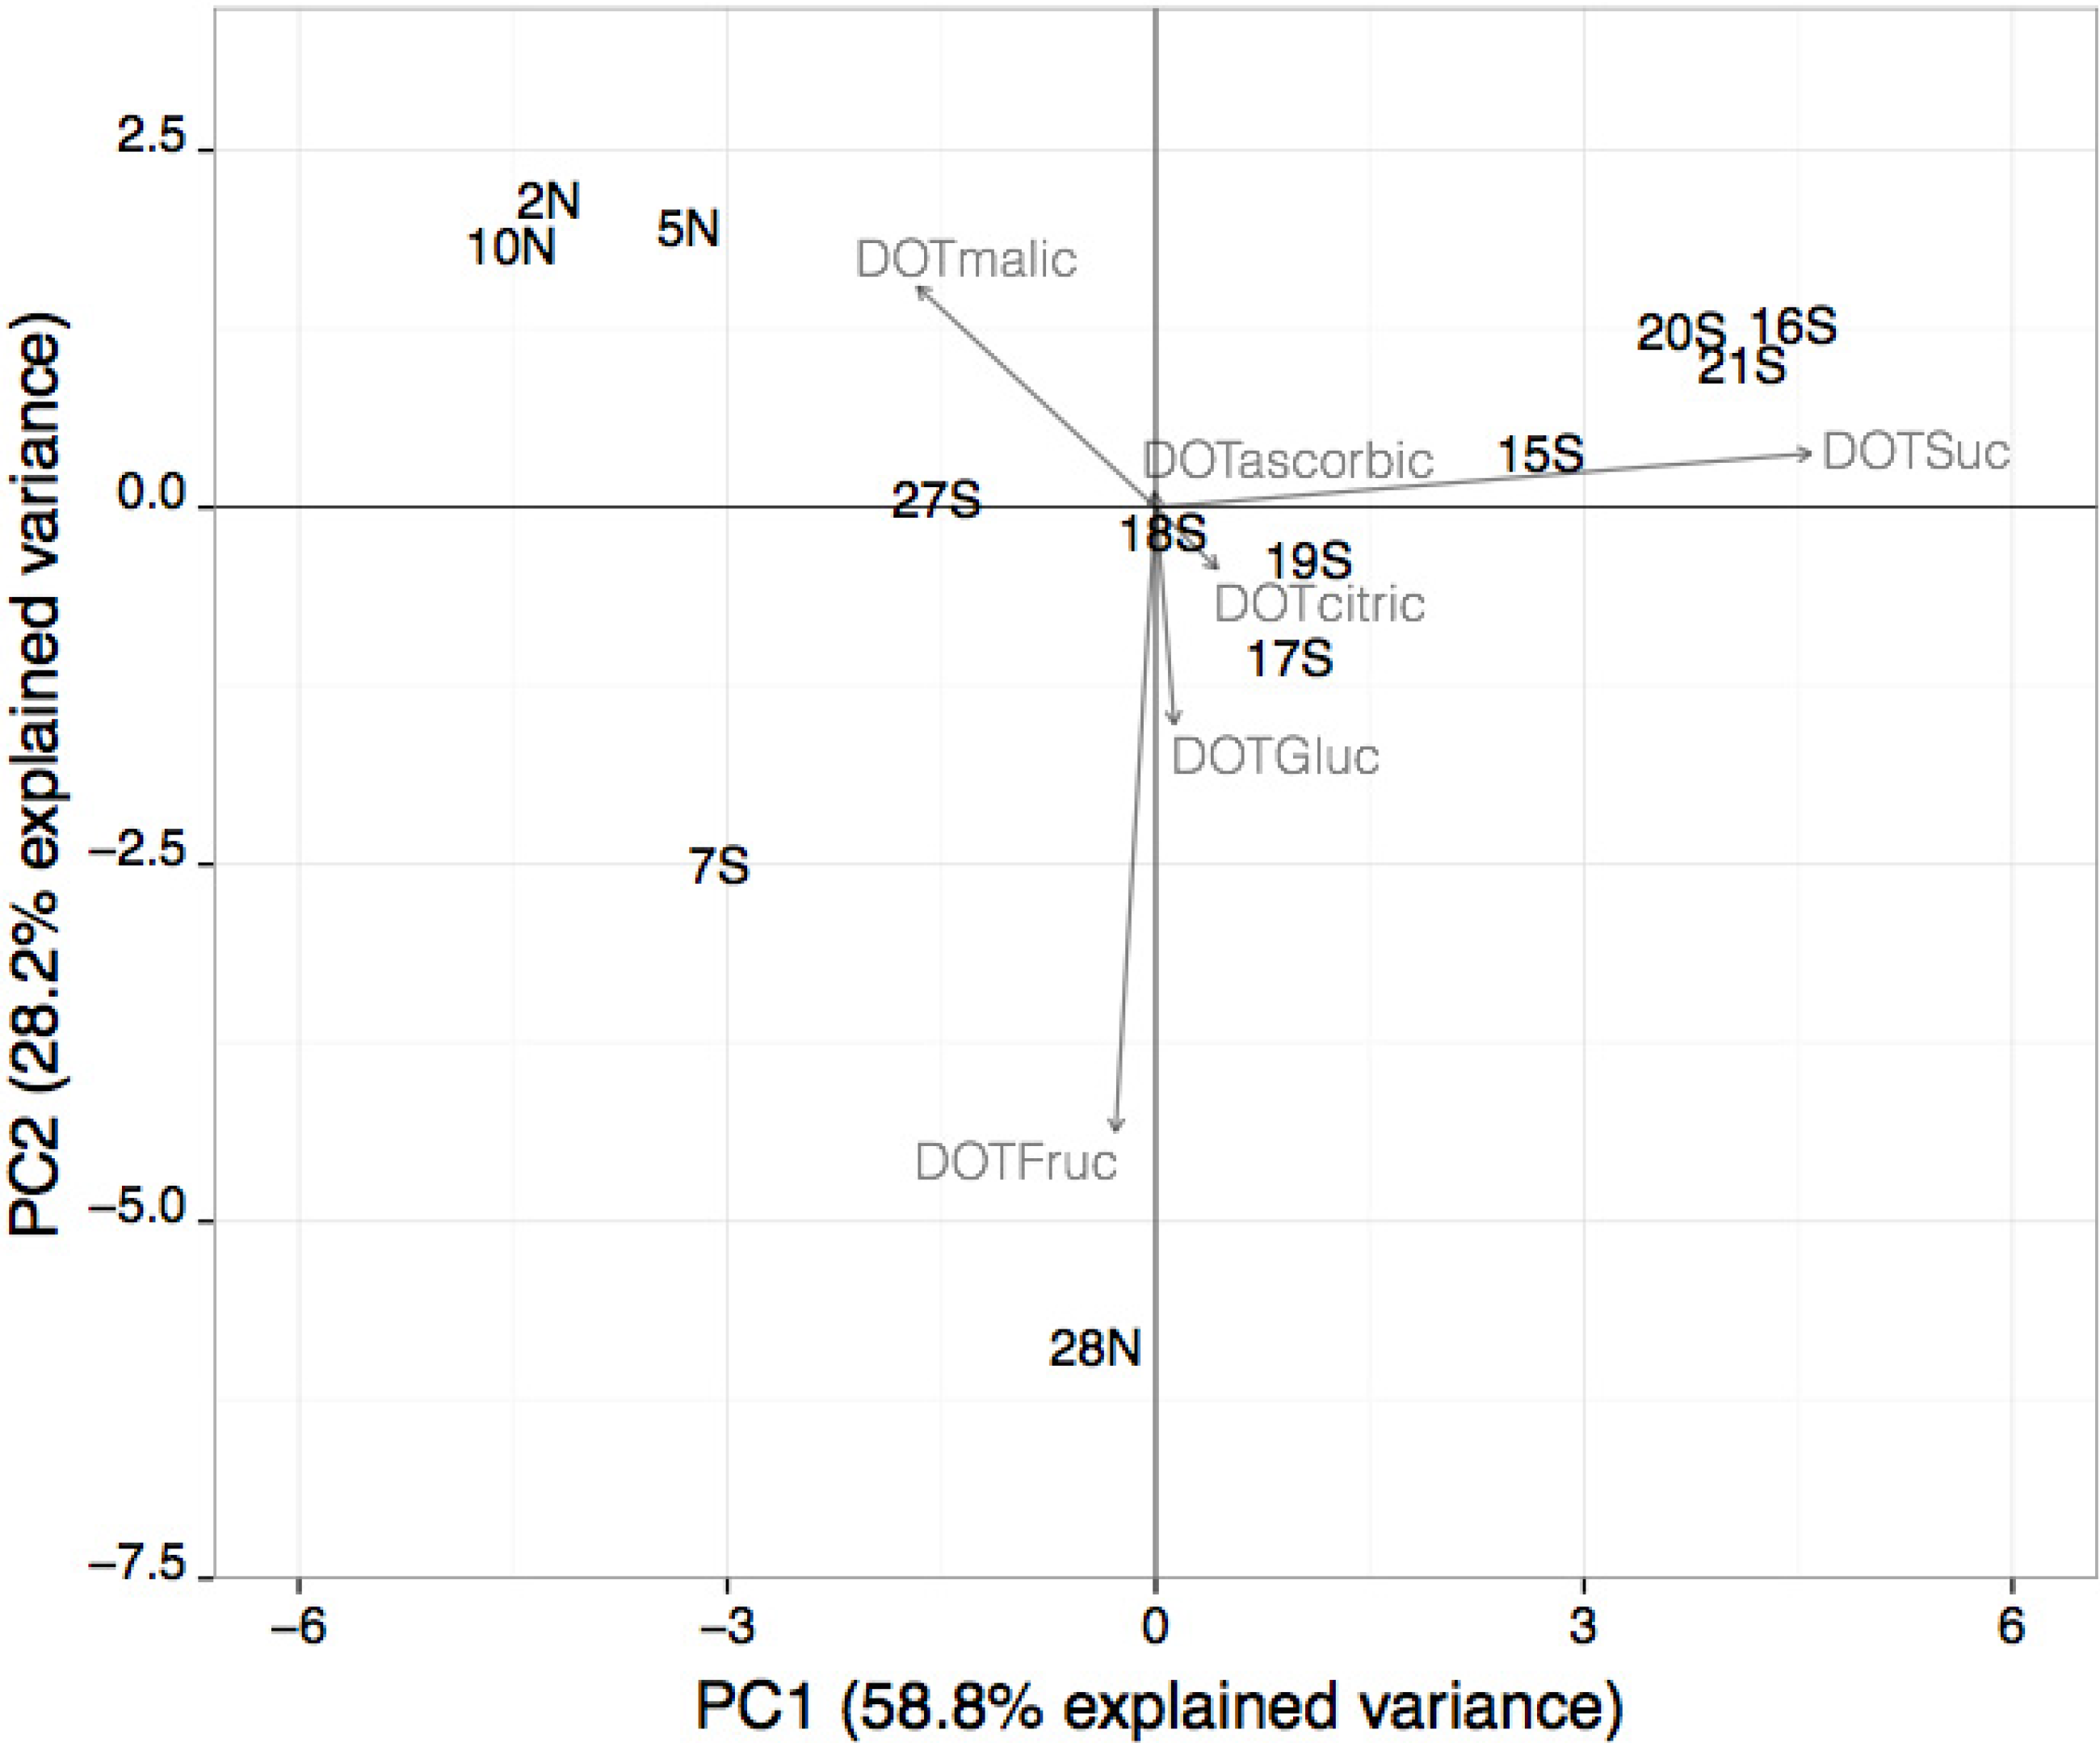
The PCA was also applied to multi-fruit beverages, containing a mixture of four to nine fruits. The scree-plot (data not shown) allowed verifying that only the first three functions should be selected, which explained 94.3% of the total data variance (58.8%, 28.2% and 7.3%, respectively). In Figure 3, the two-dimensional spatial distribution of the multi-fruits beverage samples, considering the first and second principal component functions, is shown. As can be seen, the 13 samples are distributed in the four quadrants considering the two first principal components functions, mainly due to the individual sensory impact of sucrose, fructose and/or malic acid. The first principal component function split samples (located in the positive or negative region), taking into account sucrose individual sensory contribution to the beverage global taste perception (DOT values ranging from 4.3 to 8.8 and from 0 to 3.8, respectively). The second function separates samples according to the influence of fructose towards the beverage’s overall sensory perception, its impact being low or high for samples located in the positive or negative regions, respectively. The significance of the individual sensory effect of malic acid allowed for refining the samples spatial distribution into each one of the four quadrants. Samples located in the first and fourth quadrants do not contain malic acid, and those located in the second and third quadrants have low to medium malic acid contents, corresponding to low to medium DOT values or low values, respectively. According to the previous discussion, it can be noticed that, in general, beverages located in the first, third and fourth quadrants present a well-balanced taste, due to the similar significant sensory contribution of sugars and organic acids, whereas beverages located in the second quadrant may possess a greater acidity.
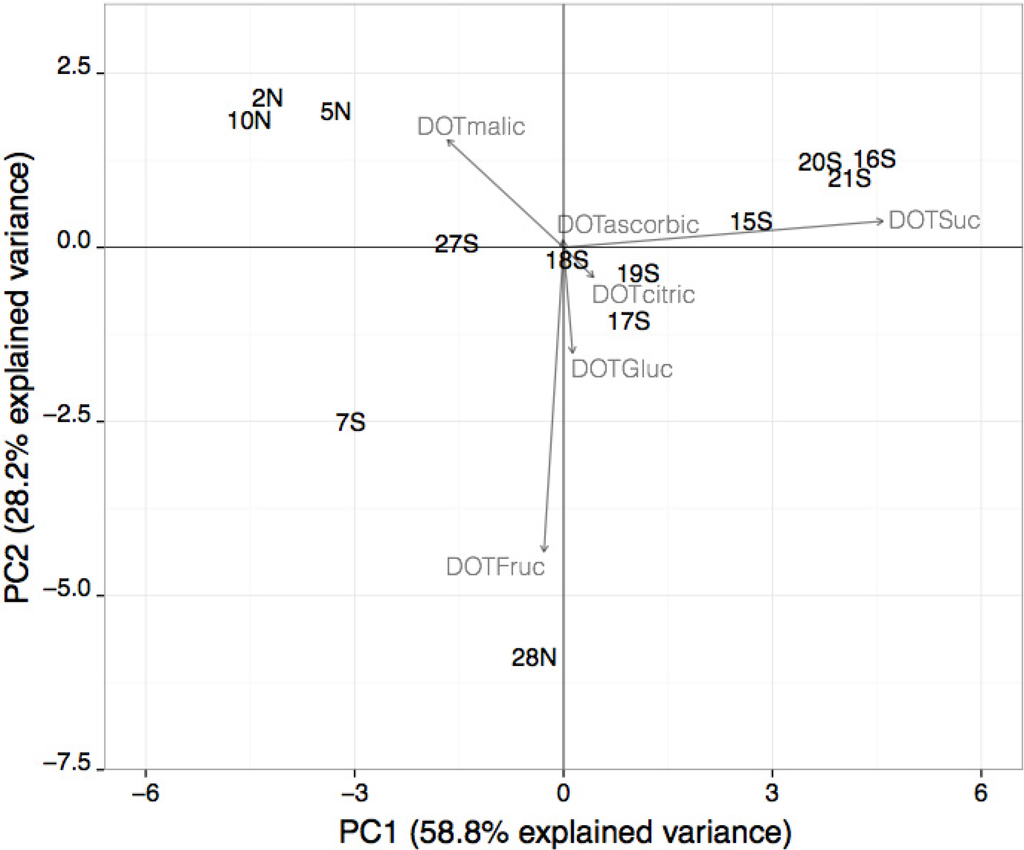
Figure 3.
Representation of the two first principal component factor scores obtained for the multi-fruit beverages containing four to nine fruits using the sugars and organic acids DOT values (samples are identified by the number and type of fruit beverage: S, soft-drinks; N, fruit nectars; J, fruit juices).
4. Conclusions
In this study, a novel green size exclusion HPLC method was developed, and its performance showed that it could be accurately applied for the simultaneous analysis, in a single run assay, of the main sugars and organic acids present in commercial fruit beverages. The results also demonstrated that sucrose, fructose, ascorbic acid, citric acid and malic acid are the compounds that hold the greater individual sensory impact in the overall taste perception of a specific beverage. Moreover, although organic acids are present in lower concentrations than sugars, their sensory influence on the global beverage is quite strong, based on their DOT values. Finally, it was shown that unsupervised fruit beverage groups formed using DOT values may be related with the sweet and sour taste perception of different beverages types (soft-drinks, fruit nectars and fruit juices) containing different fruits (between one to nine, including apple, mango, orange, pineapple, among other) and from six different brands.
Acknowledgments
This work was partially co-financed by FCT (Fundação para a Ciência e a Tecnologia) and FEDER (Fundo Europeu de Desenvolvimento Regional) under Program COMPETE (Programa Operacional Factores de Competitividade) (Project PEst-C/EQB/LA0020/2013); by the Strategic Project PEst-OE/EQB/LA0023/2013 and by Project Reference RECI/BBB-EBI/0179/2012 (Project Number FCOMP-01-0124-FEDER-027462) funded by Fundação para a Ciência e a Tecnologia.
Author Contributions
Luís G. Dias and António M. Peres: experimental setup and design, multivariate data treatment and manuscript preparation. Cédric Sequeira: chromatographic assays and sample collection. Jorge Sá Morais: supervisor of the chromatographic analysis. Mara E.B.C. Sousa and Ana C.A. Veloso: state of the art, data review and manuscript revision.
Conflicts of Interest
The authors declare no conflict of interest.
References
- Ashurst, P.R. Chemistry and Technology of Soft drinks and Fruit Juices, 2nd ed.; Blackwell Publishing: Hereford, UK, 2005. [Google Scholar]
- Terry, L.A.; White, S.F.; Tigwell, L.A. The application of biosensors to fresh produce and the wider food industry. J. Agric. Food Chem. 2005, 53, 1309–1319. [Google Scholar]
- Keutgen, A.; Pawelzik, E. Modifications of taste-relevant compounds in strawberry fruit under NaCl salinity. Food Chem. 2007, 105, 1487–1494. [Google Scholar]
- Bordonaba, J.G.; Terry, L.A. Biochemical Profiling and Chemometric Analysis of Seventeen UK-Grown Black Currant Cultivars. J. Agric. Food Chem. 2008, 56, 7422–7430. [Google Scholar] [CrossRef]
- Crespo, P.; Bordonaba, J.G.; Terry, L.A.; Carlen, C. Characterisation of major taste and health-related compounds of four strawberry genotypes grown at different Swiss production sites. Food Chem. 2010, 122, 16–24. [Google Scholar] [CrossRef]
- Dias, L.G.; Sequeira, C.; Veloso, A.C.A.; Sousa, M.E.B.C.; Peres, A.M. Evaluation of healthy and sensory indexes of sweetened beverages using an electronic tongue. Anal. Chim. Acta 2014. in Press. [Google Scholar]
- Scharbert, S.; Hofmann, T. Molecular Definition of Black Tea Taste by Means of Quantitative Studies, Taste Reconstitution, and Omission Experiments. J. Agric. Food Chem. 2005, 53, 5377–5384. [Google Scholar] [CrossRef]
- McFeeters, R.F. Single-Injection HPLC Analysis of Acids, Sugars, and Alcohols in Cucumber Fermentations. J. Agric. Food Chem. 1993, 41, 1439–1443. [Google Scholar] [CrossRef]
- Yuan, J.P.; Chen, F. Simultaneous separation and determination of sugars, ascorbic acid and furanic compounds by HPLC—dual detection. Food Chem. 1999, 64, 423–427. [Google Scholar] [CrossRef]
- Kelebek, H.; Selli, S.; Canbas, A.; Cabaroglu, T. HPLC determination of organic acids, sugars, phenolic compositions and antioxidant capacity of orange juice and orange wine made from a Turkish cv. Kozan. Microchem. J. 2009, 91, 187–192. [Google Scholar] [CrossRef]
- Eyéghé-Bickong, H.A.; Alexandersson, E.O.; Gouws, L.M.; Young, P.R.; Vivier, M.A. Optimisation of an HPLC method for the simultaneous quantification of the major sugars and organic acids in grapevine berries. J. Chromatogr. B 2012, 885–886, 43–49. [Google Scholar] [CrossRef]
- Pérez, A.G.; Olías, R.; Espada, J.; Olías, J.M.; Sanz, C. Rapid Determination of Sugars, Nonvolatile Acids and Ascorbic Acid in Strawberry and Other Fruits. J. Agric. Food Chem. 1997, 45, 3545–3549. [Google Scholar] [CrossRef]
- Chinnici, F.; Spinabelli, U.; Riponi, C.; Amati, A. Optimization of the determination of organic acids and sugars in fruit juices by ion-exclusion liquid chromatography. J. Food Comp. Anal. 2005, 18, 121–130. [Google Scholar] [CrossRef]
- Wu, J.; Gao, H.; Zhao, L.; Liao, X.; Chen, F.; Wang, Z.; Hu, X. Chemical compositional characterization of some apple cultivars. Food Chem. 2007, 103, 88–93. [Google Scholar] [CrossRef]
- Nishiyama, I.; Fukuda, T.; Shimohashi, A.; Oota, T. Sugar and Organic Acid Composition in the Fruit Juice of Different Actinidia Varieties. Food Sci. Technol. Res. 2008, 14, 67–73. [Google Scholar] [CrossRef]
- Versari, A.; Parpinello, G.P.; Mattioli, A.U.; Galassi, S. Characterisation of Italian commercial apricot juices by high-performance liquid chromatography analysis and multivariate analysis. Food Chem. 2008, 108, 334–340. [Google Scholar]
- Obando-Ulloa, J.M.; Eduardo, I.; Monforte, A.J.; Fernández-Trujillo, J.P. Identification of QTLs related to sugar and organic acid composition in melon using near-isogenic lines. Sci. Hortic. 2009, 121, 425–433. [Google Scholar] [CrossRef]
- Muñoz-Robredo, P.; Robledo, P.; Manríquez, D.; Molina, R.; Defilippi, B.G. Characterization of sugars and organic acids in commercial varieties of table grapes. Chil. J. Agr. Res. 2011, 71, 452–458. [Google Scholar] [CrossRef]
- Mahmood, T.; Anwar, F.; Abbas, M.; Boyce, M.C.; Saari, N. Compositional Variation in Sugars and Organic Acids at Different Maturity Stages in Selected Small Fruits from Pakistan. Int. J. Mol. Sci. 2012, 13, 1380–1392. [Google Scholar] [CrossRef]
- Carballo, S.; Zingarello, F.A.; Maestre, S.E.; Todolí, J.L.; Prats, M.S. Optimisation of analytical methods for the characterization of oranges, clementines and citrus hybrids cultivated in Spain on the basis of their composition in ascorbic acid, citric acid and major sugars. J. Food Sci. Technol. 2014, 49, 146–152. [Google Scholar]
- Sokullu, R.; Palabiyik, I.M.; Onur, F.; Boyaci, I.H. Chemometric methods for simultaneous quantification of lactic, malic and fumaric acids. Eng. Life Sci. 2010, 10, 297–303. [Google Scholar] [CrossRef]
- Ermer, J.; McB. Miller, J.H. Method Validation in Pharmaceutical Analysis: A Guide to Best Practice; Wiley-VCH Verlag GmbH & Co.: Weinheim, Germany, 2005. [Google Scholar]
- Snyder, L.R.; Kirkland, J.J.; Dolan, J.W. Introduction to Modern Liquid Chromatography, 3rd ed.; John Wiley & Sons Inc.: Hoboken, NJ, USA, 2010. [Google Scholar]
- Funk, W.; Dammann, V.; Donnevert, G. Quality Assurance in Analytical Chemistry: Applications in Environmental, Food and Materials Analysis, Biotechnology, and Medical Engineering; Wiley-VCH Verlag GmbH & Co.: Weinheim, Germany, 2007. [Google Scholar]
- Dalgaarde, P. Introductory Statistics with R (Statistics and Computing); Springer: New York, NY, USA, 2008. [Google Scholar]
- Rencher, A.C. Methods of multivariate analysis; Wiley: New York, NY, USA, 1995. [Google Scholar]
- The R Project for Statistical Computing. Available online: http://www.r-project.org/ (accessed on 16 September 2014).
- Venables, W.N.; Ripley, B.D. Modern Applied Statistics with S; Springer-Verlag: New York, NY, USA, 2002. [Google Scholar]
- Castellari, M.; Versari, A.; Spinabelli, U.; Galassi, S.; Amati, A. An improved HPLC method for the analysis of organic acids, carbohydrates and alcohols in grape musts and wines. J. Liq. Chromatogr. Relat. Technol. 2000, 23, 2047–2056. [Google Scholar] [CrossRef]
© 2014 by the authors; licensee MDPI, Basel, Switzerland. This article is an open access article distributed under the terms and conditions of the Creative Commons Attribution license (http://creativecommons.org/licenses/by/3.0/).