




Criterion and Convergent Validity of Youth Physical Activity and Sedentary Behavior Questionnaires in School Settings: A Systematic Review of Current Evidence and Future Perspectives
 ,
,
Highlights
- •
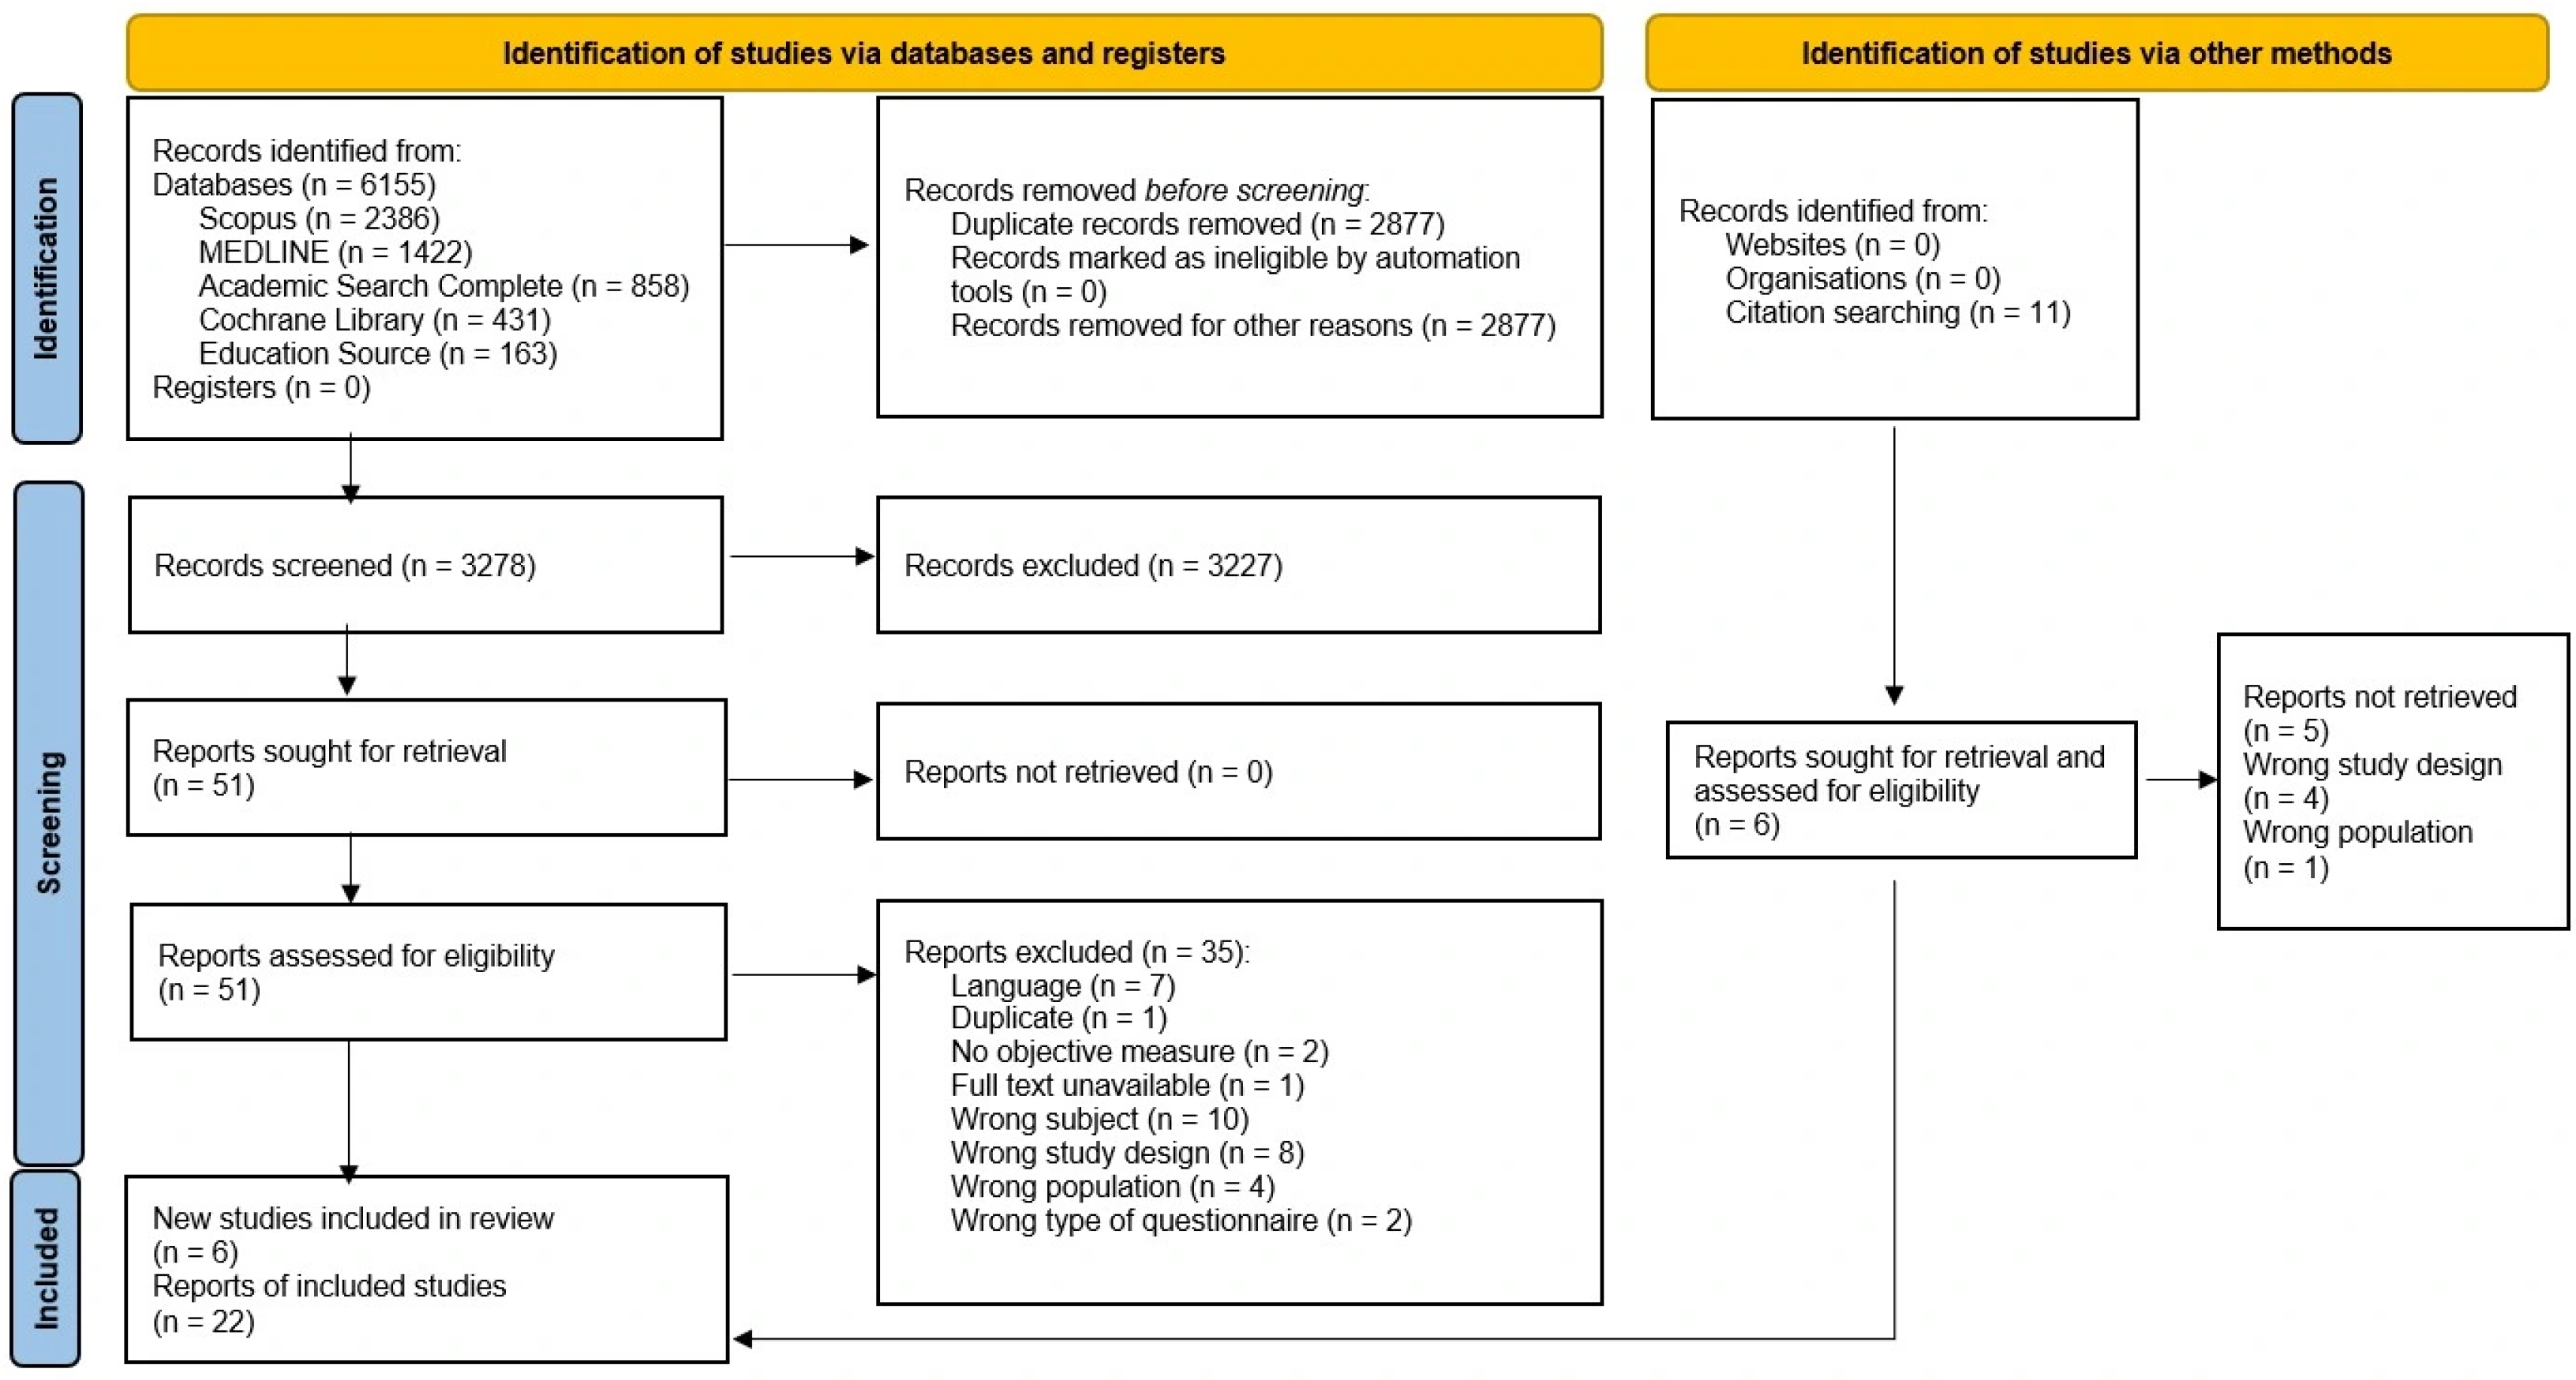
- This systematic review identified 22 studies evaluating 16 questionnaires used to measure physical activity and sedentary behavior among children and adolescents in school settings, with validity estimates ranging from very weak to strong.
- •
- Eight questionnaires demonstrated the most acceptable evidence for criterion validity, convergent validity, and reliability.
- •
- Researchers and practitioners should use caution when selecting physical activity and sedentary behavior questionnaires, as many commonly used instruments lack sufficient evidence of measurement accuracy and may not accurately reflect true behavior levels.
- •
- Further high-quality validation studies are needed to strengthen the evidence base and improve confidence in questionnaire-based assessments of physical activity and sedentary behavior in children and adolescents.
Abstract
1. Introduction
2. Materials and Methods
2.1. Eligibility Criteria
2.2. Search Strategy
2.3. Selection Procedures
2.4. Data Extraction and Management
2.5. Methodological Quality Assessment
3. Results
4. Discussion
4.1. Strengths and Limitations
4.2. Recommendations for Future Research
5. Conclusions
Supplementary Materials
Author Contributions
Funding
Institutional Review Board Statement
Informed Consent Statement
Data Availability Statement
Acknowledgments
Conflicts of Interest
Abbreviations
| PA | Physical activity |
| SB | Sedentary behavior |
References
- Bull, F.C.; Al-Ansari, S.S.; Biddle, S.; Borodulin, K.; Buman, M.P.; Cardon, G.; Carty, C.; Chaput, J.P.; Chastin, S.; Chou, R.; et al. World Health Organization 2020 guidelines on physical activity and sedentary behaviour. Br. J. Sports Med. 2020, 54, 1451–1462. [Google Scholar] [CrossRef] [PubMed]
- Hale, G.E.; Colquhoun, L.; Lancastle, D.; Lewis, N.; Tyson, P.J. Physical activity interventions for the mental health of children: A systematic review. Child Care Health Dev. 2023, 49, 211–229. [Google Scholar] [CrossRef]
- Janssen, I.; LeBlanc, A.G. Systematic review of the health benefits of physical activity and fitness in school-aged children and youth. Int. J. Behav. Nutr. Phys. Act. 2010, 7, 40. [Google Scholar] [CrossRef] [PubMed]
- Mineshita, Y.; Kim, H.-K.; Chijiki, H.; Nanba, T.; Shinto, T.; Furuhashi, S.; Oneda, S.; Kuwahara, M.; Suwama, A.; Shibata, S. Screen time duration and timing: Effects on obesity, physical activity, dry eyes, and learning ability in elementary school children. BMC Public Health 2021, 21, 422. [Google Scholar] [CrossRef]
- Tremblay, M.S.; Carson, V.; Chaput, J.-P.; Gorber, S.C.; Dinh, T.; Duggan, M.; Faulkner, G.; Gray, C.E.; Gruber, R.; Janson, K.; et al. Canadian 24-hour movement guidelines for children and youth: An integration of physical activity, sedentary behaviour, and sleep. Appl. Physiol. Nutr. Metab. 2016, 41, S311–S327. [Google Scholar] [CrossRef]
- Oberle, E.; Fan, S.; Molyneux, T.M.; Ji, X.R.; Brussoni, M. Adherence to 24-hour movement guidelines and associations with mental well-being: A population-based study with adolescents in Canada. BMC Public Health 2025, 25, 749. [Google Scholar] [CrossRef]
- Roberts, K.C.; Yao, X.; Carson, V.; Chaput, J.P.; Janssen, I.; Tremblay, M.S. Meeting the Canadian 24-hour movement guidelines for children and youth. Health Rep. 2017, 28, 3–7. [Google Scholar] [PubMed]
- Arvidsson, D.; Fridolfsson, J.; Börjesson, M. Measurement of physical activity in clinical practice using accelerometers. J. Intern. Med. 2019, 286, 137–153. [Google Scholar] [CrossRef] [PubMed]
- Hidding, L.M.; Altenburg, T.M.; Mokkink, L.B.; Terwee, C.B.; Chinapaw, M.J.M. Systematic review of childhood sedentary behavior questionnaires: What do we know and what is next? Sports Med. 2017, 47, 677–699. [Google Scholar] [CrossRef] [PubMed]
- Hidding, L.M.; Chinapaw, M.J.M.; van Poppel, M.N.M.; Mokkink, L.B.; Altenburg, T.M. An updated systematic review of childhood physical activity questionnaires. Sports Med. 2018, 48, 2797–2842. [Google Scholar] [CrossRef] [PubMed]
- Kohl, H.W.; Fulton, J.E.; Caspersen, C.J. Assessment of physical activity among children and adolescents: A review and synthesis. Prev. Med. 2000, 31, S54–S76. [Google Scholar] [CrossRef]
- Fink, A. Survey research methods. In International Encyclopedia of Education, 3rd ed.; Peterson, P., Baker, E., McGaw, B., Eds.; Elsevier: Amsterdam, The Netherlands, 2010; pp. 152–160. [Google Scholar] [CrossRef]
- Helmerhorst, H.J.; Brage, S.; Warren, J.; Besson, H.; Ekelund, U. A systematic review of reliability and objective criterion-related validity of physical activity questionnaires. Int. J. Behav. Nutr. Phys. Act. 2012, 9, 103. [Google Scholar] [CrossRef] [PubMed]
- Litwin, M. How to Measure Survey Reliability and Validity; SAGE: Thousand Oaks, CA, USA, 1995. [Google Scholar] [CrossRef]
- Arts, J.; Gubbels, J.S.; Verhoeff, A.P.; Chinapaw, M.J.M.; Lettink, A.; Altenburg, T.M. A systematic review of proxy-report questionnaires assessing physical activity, sedentary behavior and/or sleep in young children (aged 0–5 years). Int. J. Behav. Nutr. Phys. Act. 2022, 19, 18. [Google Scholar] [CrossRef] [PubMed]
- Phillips, S.M.; Summerbell, C.; Hobbs, M.; Hesketh, K.R.; Saxena, S.; Muir, C.; Hillier-Brown, F.C. A systematic review of the validity, reliability, and feasibility of measurement tools used to assess the physical activity and sedentary behaviour of pre-school aged children. Int. J. Behav. Nutr. Phys. Act. 2021, 18, 141. [Google Scholar] [CrossRef] [PubMed]
- Page, M.J.; McKenzie, J.E.; Bossuyt, P.M.; Boutron, I.; Hoffmann, T.C.; Mulrow, C.D.; Shamseer, L.; Tetzlaff, J.M.; Akl, E.A.; Brennan, S.E.; et al. The PRISMA 2020 statement: An updated guideline for reporting systematic reviews. BMJ 2021, 372, n71. [Google Scholar] [CrossRef] [PubMed]
- Mokkink, L.B.; Terwee, C.B.; Patrick, D.L.; Alonso, J.; Stratford, P.W.; Knol, D.L.; Bouter, L.M.; de Vet, H.C. The COSMIN checklist for assessing the methodological quality of studies on measurement properties of health status measurement instruments. Qual. Life Res. 2010, 19, 539–549. [Google Scholar] [CrossRef] [PubMed]
- de Vet, H.C.; Mokkink, L.B.; Terwee, C.B.; Hoekstra, O.S.; Knol, D.L. Clinicians are right not to like Cohen’s κ. BMJ 2013, 346, f2125. [Google Scholar] [CrossRef] [PubMed]
- Aggio, D.; Fairclough, S.; Knowles, Z.; Graves, L. Validity and reliability of a modified English version of the physical activity questionnaire for adolescents. Arch. Public Health 2016, 74, 3. [Google Scholar] [CrossRef] [PubMed]
- Chinapaw, M.J.M.; Slootmaker, S.M.; Schuit, A.J.; van Zuidam, M.; van Mechelen, W. Reliability and validity of the Activity Questionnaire for Adults and Adolescents (AQuAA). BMC Med. Res. Methodol. 2009, 9, 58. [Google Scholar] [CrossRef] [PubMed]
- Foley, L.S.; Maddison, R.; Rush, E.; Olds, T.S.; Ridley, K.; Jiang, Y. Doubly labeled water validation of a computerized use-of-time recall in active young people. Metab.-Clin. Exp. 2013, 62, 163–169. [Google Scholar] [CrossRef] [PubMed]
- Ridley, K.; Olds, T.S.; Hill, A. The Multimedia activity recall for children and adolescents (MARCA): Development and evaluation. Int. J. Behav. Nutr. Phys. Act. 2006, 3, 10. [Google Scholar] [CrossRef] [PubMed]
- Treuth, M.S.; Sherwood, N.E.; Butte, N.F.; McClanahan, B.; Obarzanek, E.; Zhou, A.; Ayers, C.; Adolph, A.; Jordan, J.; Jacobs, D.R.; et al. Validity and reliability of activity measures in African-American girls for GEMS. Med. Sci. Sports Exerc. 2003, 35, 532–539. [Google Scholar] [CrossRef] [PubMed]
- Belton, S.; Mac Donncha, C. Reliability and validity of a new physical activity self-report measure for younger children. Meas. Phys. Educ. Exerc. Sci. 2010, 14, 15–28. [Google Scholar] [CrossRef]
- Bringolf-Isler, B.; Mäder, U.; Ruch, N.; Kriemler, S.; Grize, L.; Braun-Fahrländer, C. Measuring and validating physical activity and sedentary behavior comparing a parental questionnaire to accelerometer data and diaries. Pediatr. Exerc. Sci. 2012, 24, 229–245. [Google Scholar] [CrossRef] [PubMed]
- Jago, R.; Baranowski, T.; Watson, K.; Bachman, C.; Baranowski, J.C.; Thompson, D.; Hernández, A.E.; Venditti, E.; Blackshear, T.; Moe, E. Development of new physical activity and sedentary behavior change self-efficacy questionnaires using item response modeling. Int. J. Behav. Nutr. Phys. Act. 2009, 6, 20. [Google Scholar] [CrossRef] [PubMed]
- McVeigh, J.A.; Norris, S.A. Criterion validity and test-retest reliability of a physical activity questionnaire in South African primary school-aged children. S. Afr. J. Sports Med. 2012, 24, 43–48. [Google Scholar] [CrossRef]
- Rangul, V.; Holmen, T.L.; Kurtze, N.; Cuypers, K.; Midthjell, K. Reliability and validity of two frequently used self-administered physical activity questionnaires in adolescents. BMC Med. Res. Methodol. 2008, 8, 47. [Google Scholar] [CrossRef] [PubMed]
- Saint-Maurice, P.F.; Kim, Y.; Hibbing, P.; Oh, A.Y.; Perna, F.M.; Welk, G.J. Calibration and validation of the Youth Activity Profile: The FLASHE study. Am. J. Prev. Med. 2017, 52, 880–887. [Google Scholar] [CrossRef] [PubMed]
- Scholes, S.; Coombs, N.; Pedisic, Z.; Mindell, J.S.; Bauman, A.; Rowlands, A.V.; Stamatakis, E. Age- and Sex-Specific Criterion Validity of the Health Survey for England Physical Activity and Sedentary Behavior Assessment Questionnaire as Compared With Accelerometry. Am. J. Epidemiol. 2014, 179, 1493–1502. [Google Scholar] [CrossRef]
- Treuth, M.S.; Sherwood, N.E.; Baranowski, T.; Butte, N.F.; Jacobs, D.R.; McClanahan, B.; Gao, S.; Rochon, J.; Zhou, A.; Robinson, T.N.; et al. Physical activity self-report and accelerometry measures from the Girls health Enrichment Multi-site Studies. Prev. Med. 2004, 38, 43–49. [Google Scholar] [CrossRef]
- Vandoni, M.; Buzzachera, C.F.; Ottobrini, S.; Correale, L.; Borrelli, P.; Berzolari, F.G.; Codrons, E. Perceived and objectively measured physical activity in high school students: Is there any link between aerobic fitness, psychological responses and acute exercise? Sport Sci. Health 2017, 13, 157–164. [Google Scholar]
- Fillon, A.; Pereira, B.; Vanhelst, J.; Baran, J.; Masurier, J.; Guirado, T.; Boirie, Y.; Duclos, M.; Julian, V.; Thivel, D. Development of the Children and Adolescents Physical Activity and Sedentary Questionnaire (CAPAS-Q): Psychometric Validity and Clinical Interpretation. Int. J. Environ. Res. Public Health 2022, 19, 13782. [Google Scholar]
- Trost, S.G.; Marshall, A.L.; Miller, R.; Hurley, J.T.; Hunt, J.A. Validation of a 24-h physical activity recall in indigenous and non-indigenous Australian adolescents. J. Sci. Med. Sport 2007, 10, 428–435. [Google Scholar] [CrossRef]
- Kastelic, K.; Šarabon, N.; Burnard, M.D.; Pedišić, Ž. Validity and Reliability of the Daily Activity Behaviours Questionnaire (DABQ) for Assessment of Time Spent in Sleep, Sedentary Behaviour, and Physical Activity. Int. J. Environ. Res. Public Health 2022, 19, 5362. [Google Scholar] [CrossRef]
- Wang, C.; Chen, P.; Zhuang, J. Validity and Reliability of International Physical Activity Questionnaire–Short Form in Chinese Youth. Res. Q. Exerc. Sport 2013, 84, S80–S86. [Google Scholar] [CrossRef]
- Fairclough, S.J.; Christian, D.L.; Saint-Maurice, P.F.; Hibbing, P.R.; Noonan, R.J.; Welk, G.J.; Dixon, P.M.; Boddy, L.M. Calibration and Validation of the Youth Activity Profile as a Physical Activity and Sedentary Behaviour Surveillance Tool for English Youth. Int. J. Environ. Res. Public Health 2019, 16, 3711. [Google Scholar] [CrossRef]
- Saint-Maurice, P.F.; Welk, G.J. Validity and calibration of the Youth Activity Profile. PLoS ONE 2015, 10, e0143949. [Google Scholar] [CrossRef] [PubMed]
- Arvidsson, D.; Slinde, F.; Hulthen, L. Physical Activity Questionnaire for adolescents validated against doubly labelled water. Eur. J. Clin. Nutr. 2005, 59, 376–383. [Google Scholar] [CrossRef] [PubMed]
- Slinde, F.; Arvidsson, D.; Sjöberg, A.; Rossander-Hulthén, L. Minnesota leisure time activity questionnaire and doubly labeled water in adolescents. Med. Sci. Sports Exerc. 2003, 35, 1923–1928. [Google Scholar] [CrossRef] [PubMed]
- Durante, R.; Ainsworth, B.E. The recall of physical activity: Using a cognitive model of the question-answering process. Med. Sci. Sports Exerc. 1996, 28, 1282–1291. [Google Scholar] [CrossRef] [PubMed]
- Tcymbal, A.; Messing, S.; Mait, R.; Perez, R.G.; Akter, T.; Rakovac, I.; Gelius, P.; Abu-Omar, K. Validity, reliability, and readability of single-item and short physical activity questionnaires for use in surveillance: A systematic review. PLoS ONE 2024, 19, e0300003. [Google Scholar] [CrossRef] [PubMed]
- Terwee, C.B.; Bot, S.D.; de Boer, M.R.; van der Windt, D.A.; Knol, D.L.; Dekker, J.; Bouter, L.M.; de Vet, H.C. Quality criteria were proposed for measurement properties of health status questionnaires. J. Clin. Epidemiol. 2007, 60, 34–42. [Google Scholar] [CrossRef] [PubMed]

| Parameter | Criterion and Convergent |
|---|---|
| Population | School-aged children and adolescents (5–18 years) |
| Exposure | Self-report or proxy-report questionnaires (paper or electronic) |
| Comparison | Objective criterion and convergent measures |
| Outcome | Criterion and convergent validity metrics |
| Author and Year of Publication | Questionnaire | Study Sample | Objective Measure | Statistical Analysis | PA Results | SB Results |
|---|---|---|---|---|---|---|
| Kastelic et al., 2022. [36] | Daily Activity Behaviors Questionnaire (DABQ) | n = 58 15–18 y.o. | ActivPAL4 (PAL Technologies Ltd., Glasgow, Scotland) | Spearman’s correlation (ρ) | The correlation between MVPA and total physical activity ranged between 0.50 and 0.53 The correlation for LPA was ρ = 0.25 | Moderate correlation for SB (ρ = 0.38) |
| Fillon et al., 2022. [34] | Children and Adolescents Physical Activity and Sedentary Questionnaire (CAPAS-Q) | n = 120 8–18 y.o. | ActiGraph GT3X accelerometer (ActiGraph, LLC, Pensacola, FL, USA) | Spearman’s correlation (ρ) | The correlation between CAPAS-Q and PA is moderate (ρ = 0.45) | The correlation between CAPAS-Q and SB was moderate (ρ = 0.38) |
| Fairclough et al., 2019. [38] | Youth Activity Profile (YAP) | n = 402 10–16 y.o. | SenseWear Armband Mini (SWA) | Pearson’s correlation (r); mean absolute percentage error (MAPE) | In-school MVPA: weakly correlated (r = 0.11), and the MAPE was 70.8% Out-of-school MVPA: moderately correlated (r = 0.45), and the MAPE was 83.9% Weekend MVPA: moderately correlated (r = 0.52), and the MAPE was 199.6% | Out-of-school SB: strongly correlated to SB estimated from SWA (r = 0.80), and MAPE was 50.6% |
| Saint-Maurice et al., 2017. [30] | Youth Activity Profile (YAP) | n = 628 12–17 y.o. | ActiGraph GT3X+ accelerometer (ActiGraph, LLC, Pensacola, FL, USA) | Pearson’s correlation (r) | MVPA at school was moderately correlated (r = 0.38) MVPA accumulated during out-of-school time was moderately correlated (r = 0.52) MVPA based on weekend items were not significantly correlated (r = 0.16) | Predicted SB was moderately correlated with GT3X+ data (r = 0.32) |
| Vandoni et al., 2017. [33] | International Physical Activity Questionnaire (IPAQ) | n = 30 16–20 y.o. | Actiheart monitor (CamNtech Ltd., Cambridge, UK) | Spearman’s correlation (ρ) | VPA showed a strong correlation (ρ = 0.62) For moderate PA, there was no correlation (ρ = 0.23) | Did not find any significant correlation between the two measurements relevant to sedentary behavior (ρ = −0.02) |
| Aggio et al., 2016. [20] | PAQ-A | n = 169 11–17 y.o. | ActiGraph GT1M accelerometer (ActiGraph, LLC, Pensacola, FL, USA) | Spearman’s correlation (ρ) | Total daily PA showed a moderate correlation (ρ = 0.42) and daily MVPA a weak correlation (ρ = 0.39) | The results include both PA and SB |
| Saint-Maurice et al., 2015. [39] | YAP | n = 291 8–16 y.o. | SenseWear Armband Pro3 (SWA). | Pearson’s correlation (r) | School estimates were moderately correlated (r = 0.58) Activity scores were not significantly correlated (r = 0.19) Out-of-school activity was also aggregated into weekend activity estimates These two estimates were not significantly correlated (r = 0.22) | Estimates of sedentary time were strongly correlated (r = 0.75) |
| Scholes et al., 2014. [31] | Physical Activity and Sedentary Behavior Assessment Questionnaire (PASBAQ) | 175 16 y.o. | KineSoft software (KineSoft, Saskatoon, SK, Canada) | Spearman’s correlation (ρ) | Total time spent for PA was moderately correlated (ρ = 0.30) in girls and weakly correlated in boys (ρ = 0.20) | Total sedentary time was moderately correlated (girls: ρ = 0.30; boys: ρ = 0.25) |
| Wang et al., 2013. [37] | IPAQ—Short Form | n = 1021 12–18 y.o. | ActiGraph GT3X+ accelerometer (ActiGraph, LLC, Pensacola, FL, USA) | Spearman’s correlation (ρ) | Weak correlation was found in total PA (ρ = 0.31) and in MVPA (ρ = 0.22) | SB correlation was very weak (ρ = 0.18) |
| Foley et al., 2013. [22] | Multimedia Activity Recall for Children and Adolescents (MARCA) | n = 32 10–18 y.o. | Total energy expenditure using doubly labeled water | Spearman’s correlation (ρ); Bland–Altman plots (limits of agreement) | A strong correlation was observed for TEE (ρ = 0.70) and a moderate correlation for AEE (ρ = 0.56) MARCA over-estimated TEE by an average of 50 kcal/day (limits of agreement, −1589 to 1490 kcal/day) and underestimated AEE as 105 kcal/day (limits of agreement, −1404 to 1614 kcal/day). | The results of AEE and TEE include both PA and SB |
| Bringold-Isler et al., 2012. [26] | A “home-made” questionnaire surveying physical activity and sedentary behavior (no official name) | n = 189 6–14 y.o. | ActiGraph AM7164 accelerometer (ActiGraph, LLC, Fort Walton Beach, FL, USA) | Spearman’s correlation (ρ) | PA was moderately correlated (ρ = 0.46) | SB was moderately correlated (ρ = 0.55) |
| McVeigh et al., 2012. [28] | PAQ-C | n = 30 9–11 y.o. | Actical accelerometer (Philips Respironics, Bend, OR, USA) | Pearson’s correlation (r); weighted kappa (κ) (degree of disagreement) | A moderate correlation was found (r = 0.53) The ability of PAQ to correctly categorize children into activity levels was moderate (κ = 0.41) | A strong correlation was found for time spent doing sedentary activities between both measures (r = 0.63) |
| Belton et al., 2010. [25] | Youth Physical Activity Self-Report (YPAS) | n = 47 7–9 y.o. | Polar Team System HR monitor; direct observations (DOs) of participants’ physical activities were carried out by trained observers (CPAF observation system) | Spearman’s correlation (ρ) | A strong correlation was found between self-reported activity intensity and HR: ρ = 0.87 for weekday and ρ = 0.795 for weekend Corresponding correlations for activity duration were ρ = 0.837 and ρ = 0.684 for weekday and weekend, respectively | The results of self-reported activity, HR, and DOs include both PA and SB |
| Chinapaw et al., 2009. [21] | Activity Questionnaire for Adolescents and Adults (AQuAA) | n = 42 12–16 y.o. | MTI ActiGraph accelerometer (Model 7164; ActiGraph LLC, Pensacola, FL, USA) | Spearman’s correlation (ρ) | Negatively associated with moderate-to-vigorous activities (ρ = −0.23) | SB was weakly correlated (ρ = 0.23) |
| Jago et al., 2009. [27] | Physical Activity Self-Efficacy (PASE) | n = 714 6th grade students (83 with accelerometers) | MTI ActiGraph accelerometer (Model 7164; ActiGraph LLC, Pensacola, FL, USA) | Pearson’s correlation (r) | Full and reduced scales had weakly non-significant correlations with accelerometer counts per minute after school for boys (r = 0.18), with comparable associations for girls (r = 0.16) Non-significant weaker correlations were observed between PASE and minutes of MVPA (r = 0.09–0.11) | Negatively associated with sedentary time (r = −0.29) when using the full set of IRM items |
| Rangul et al., 2008. [29] | IPAQ | n = 71 13–18 y.o. | ActiReg monitor (PreMed AS, Oslo, Norway) and cardiorespiratory fitness test | Spearman’s correlation (ρ) | For TEE, there was a very weak correlation with vigorous activity (ρ = −0.14) and moderate activity (ρ = 0.01) For VO2peak, there was a weak correlation for vigorous activity (ρ = −0.32) and a very weak correlation for moderate activity (ρ = 0.13) | For TEE and VO2peak, there was a very weak correlation for sitting (ρ = −0.04; ρ = 0.18) |
| Trost et al., 2007. [35] | PDPAR-24 | n = 122 13.8 +/− 1.2 y-o. | Yamax Digi-Walker electronic pedometers (SW-700 and SW-200; Yamax Corporation, Tokyo, Japan) | Spearman’s correlation (ρ) | Positive correlations were observed between all three PDPAR-24 variables (30 min blocks VPA, 30 min blocks MVPA) and daily step counts (ρ = 0.29 to 0.34) | Inverse correlation was observed between self-reported screen time and daily step counts (ρ = −0.19) |
| Ridley et al., 2006. [23] | MARCA | n = 1429 9–15 y.o. | ActiGraph accelerometer (Model AM7164-2.2C; ActiGraph LLC, Fort Walton Beach, FL, USA) | Spearman’s correlation (ρ) | There is a weak correlation between MVPA (ρ = 0.35) and locomotion (ρ = 0.37) | There was a moderate correlation for PAL with screen time (ρ = 0.45) |
| Arvidsson et al., 2005. [40] | Physical Activity Questionnaire for Adolescents (PAQA) | n = 33 15–17 y.o. | Doubly labeled water (DLW) and indirect calorimetry (RMR) | Pearson’s correlation (r); Bland–Altman plots (limits of agreement) | There was a strong correlation (r = 0.62) between EEPAQA and EEDLW PAQA underestimated energy expenditure by 3.8 (1.7) MJ (limits of agreement not specified in text) | Strong correlation between predicted and measured RMR (r = 0.85) |
| Treuth et al., 2004. [32] | Girls’ Health Enrichment Multi-Site Studies (GEMS) Activity Questionnaire—(GAQ) | n = 172 8–10 y.o. | ActiGraph accelerometer (Model 7164WAM; ActiGraph LLC, Fort Walton Beach, FL, USA) | Pearson’s correlation (r) | A low correlation was found between GAQ’s usual activity scores and average ActiGraph minutes of MVPA, namely between 12 noon and 6 PM for the total sample (r = 0.11) and the comparison group (r = 0.15) | Correlations for SB were not statistically significant |
| Slinde et al., 2003. [41] | Extended Minnesota Leisure Time Physical Activity Questionnaire (eMLTPAQ) | n = 35 15–17 y.o. | Total energy expenditure using doubly labeled water | Spearman’s correlation (ρ); Bland–Altman plots | A moderate correlation was found between TEEDLW and EELTPA (ρ = 0.49) eMLTPAQ underestimated TEE with a mean difference of 2.8 MJ·d1 (limits of agreement: 0.1 to 5.6 MJ·d1) | Including questions about inactivity increased the correlation to ρ = 0.65; predicted BMR (indirect calorimetry) was the one that correlated best with eMLTPAQ (r2 = 0.73) |
| Treuth et al., 2003. [24] | GEMS Activity Questionnaire (GAQ) | n = 68 8–9 y.o. | MTI/CSA accelerometer Manufacturing Technology Inc. (formerly Computer Science and Applications, Fort Walton Beach, FL, USA) | Pearson’s correlation (r) | The correlations (all 28 activities) were very weak and non-significant (r = −0.05 to 0.21) A weak correlation was found when reducing to 18 physical activities (r = 0.27 to 0.29) | Correlations between TV watching and sedentary activity (excluding TV) were very weak (r = −0.004 to −0.145; r = −0.09 to 0.02) |
| Method | Outcome Measures | Comparison Results | Authors and Year of Publication | ||||
|---|---|---|---|---|---|---|---|
| LPA | MVPA | Total PA | SED | Steps | |||
| ActiGraph (GT3X) | - | - | ♀  ♂  | ♀ ♂ | - | Total PA: ∆ min/day (median estimates) ♀ −188.6 (p < 0.001) ♂ −178.0 (p < 0.001) SED: ∆ minutes/day ♂ −122.1 (p < 0.001) ♀ −145.0 (p < 0.001) | Scholes et al., 2014 [31] |
| ActiGraph (GT3X) | - | School: | - | | - | MVPA: ∆ min/week –17.8 (p = 0.31) SED: ∆ min/week −75.6 (p = 0.02) | St-Maurice et al., 2017 [30] |
| ActiGraph (GT3X) | - | - |  | | - | Total PA: ∆ min/day ♀ 240 (p < 0.001) ♂ 298 SED: ∆ min/day ♀ 551 ♂ 519 | Fillion et al., 2022 [34] |
| ActiGraph (GT3X) | - | | - | | - | Usual PA: Accelerometry counts per minute * Baseline IG: 381 Baseline CG: 354 Usual PA: MET-weighted GAQ * Baseline IG: 3.05 Baseline CG: 2.87 | Treuth et al., 2004 [32] |
| ActiGraph (GT3X) | | | - | | - | MVPA: ∆ min/day ♀ 121.7 (p < 0.001) ♂ 152.5 SED: ∆ min/day Screen ♀ 203.8 (p < 0.001) ♂ 273.7 | Ridley et al., 2006 [23] |
| ActiGraph (GT3X) | - | | | | - | Average Min/day MVPA (IPAQ-SF) = 57.19 MVPA (Actigraph) = 29.06 Average Min/day SED (IPA-SF) = 587.52 SED (Actigraph) = 555.96 | Wang et al., 2013 [37] |
| ActiGraph (MTI) | | | | | No descriptives reported | Jago et al., 2009 [27] | |
| ActivPAL | | | - | | - | Average Min/day MVPA (DABQ2) = 53 MVPA (ActivPAL) = 76 Total PA (DABQ2) = 418 Total PA (ActivPAL) = 271 SED (DABQ2) = 563 SED (ActivPAL) = 719 | Kastelic et al., 2022 [36] |
| Actical | - | | | | - | Average time of their day MPA (PAQ) = 18% of their day MPA (Actical) = 20% of their day Average Min/day VPA (PAQ) = 13.3 VPA (Actical) = 19.7 Average time of their day SED activity (PAQ) = 58% of their day SED activities (Actical) = 54% of their day | McVeigh and Norris, 2012 [28] |
| DLW | - | - | | - | - | ∆ kcal / day TEE: 50 (p < 0.05) AEE: −105 (p < 0.05) | Foley et al., 2013 [22] |
| ActiGraph (GT3X) | - | | - | | - | Average min/day Total MVPA (Actigraph): 153.4 Median min/day Total MVPA (self-reported): 361.4 Average min/day Total SED (Actigraph): 482.9 Median min/day Total SED (self-reported): 197.1 | Bringold-Isler et al., 2012 [26] |
| SW Armband Mini (SWA) | - | In-school: Out-of-school: Weekend: | - | | - | ∆ min/week (equivalence zone) MVPA in-school: 17.2 (20%) MVPA out-of-school: 31.6 (20%) MVPA weekend: −4.9 (15%) ∆ min/week (equivalence zone) SED out-of-school: 109.2 (15%) | Fairclough et al., 2019 [38] |
| Actiheart | - | | | | - | ∆ min/day Walking + moderate PA: −17.6 (p < 0.05) Vigorous PA: −5.1 SED: 209.2 (p < 0.05) | Vandoni et al., 2017 [33] |
| Polar HR monitor | - | | - | | - | No descriptives reported | Belton et al., 2010 [25] |
| Pedometer (SW-700 & SW-200) | - | | - | | | Mean steps * Group 1 = 14,559 Group 2 = 12,116 24h period PA Mean METs * Group 1 = 2.0 Group 2 = 2.1 | Trost et al., 2007 [35] |
| DLW | - | - | | | - | ∆ MJ·d−1 eMLTPAQ underestimated TEE Mean difference of 2.8 MJ·d1 | Slinde et al., 2003 [41] |
| SW Armband Pro3 (SWA) | - | | - | | - | ∆ min/week MVPA in-school: −15.6 MVPA out-of-school weekdays: 3.4 MVPA out-of-school weekend: −21.7 SED out-of-school on weekdays: −49.7 | Saint-Maurice et al., 2015 [39] |
| ActiGraph (MTI, 7164 model ) | | | - | | - | AQuAA (median (25th–75th percentile)) Adolescents AQuAA score (MET * min/wk): 8464 (5146;8465) SED activities (min/wk): 3000 (2415;3600) Light activities (min/wk): 810 (600;1335) Moderate activities (min/wk): 565 (348;1019) Vigorous activities (min/wk): 35 (0;155) Accelerometer (median (25th–75th percentile)) Adolescents Counts/min: 430 (339;510) SED activities (min/wk): 4838 (4602;5076) Light activities (min/wk): 910 (764;1165) Moderate activities (min/wk): 43 (11;66) Vigorous activities (min/wk): 1 (0;4) | Chinapaw et al., 2009 [21] |
| ActiGraph (GT1M model) | - | | | - | - | Modified PAQ-A scores (mean +/− SD) Full sample: 2.8 ± 0.6 Accelerometry median and interquartile range Total daily PA (mins/d) (median and interquartile range): Full sample: 221.6 [193.1–241.6] Daily MVPA (mins/d): Full sample: 57.1 [42.2–71.0] Daily sedentary time (mins/d): Full sample: 484.5 [458.6–515.7] | Aggio et al., 2016 [20] |
| DLW | - | - | | - | - | EEDLW (MJ/day) (median (range)): ♀: 8.7 (7.3–11.9) ♂: 11.1 (9.1–13.9) EEDLW/BW (kJ/day) (median (range)): ♀: 164 (132–208) ♂: 178 (133–225) EEDLW/FFM (kJ/day) (median (range)): ♀: 217 (197–259) ♂: 202 (183–255) EEPAQA (MJ/day) (median (range)): ♀: 4.9 (3.9–8.4) ♂: 7.2 (5.3–11.2) | Arvidsson et al., 2005 [40] |
| Accelerometer MTI/ CSA | - | - | | | - | MTI/CSA mean (count-min−1) (SD): Day1: 410.3(173.7) Day2: 409.2 (152.7) Day3: 365.0 (138.3) Day4 373.8 (113.0) Activitygram mean (intensity-min) (SD): Day1: - Day2: 266.87 (252.0) Day3: 316.8 (279.7) Day4: 216.6 (212.1) | Treuth et al., 2003 [24] |
| ActiReg + cardiorespiratory fitness test (VO2peak) | - | - | VO2peak TEE PAL | VO2peak TEE PAL | - | Physical fitness test: mean (SD) VO2peak (L·min−1): 3.04 (0.77) VO2peak (mL·kg−1·min−1): 52.54 (8.12) Actireg: mean (SD) Actireg (PAL for 7 days): 1.70 (0.24) Actireg (TEE for 7 days): 59.39 (8.65) ActiReg (min at METs < 3 for 7 days): 8954 (441) ActiReg (min at METs 3–6 for 7 days): 845 (313) ActiReg (min at METs > 6 for 7 days): 256 (210) IPAQ: mean (SD) Vigorous activity (days/week): 2.76 (1.84) Vigorous activity (min/day): 73 (43) Moderate activity (days/week): 2.89 (2.18) Moderate activity (min/day): 65 (42) Walking (days/week): 4.39 (2.19) Walking (min/day): 43 (53) Sitting (min/day): 374 (196) | Rangul et al., 2008 [29] |
good = ≥0.40; moderate = 0.3–0.39; weak = ≤0.29. Kappa values: good = ≥0.60; moderate = 0.4–0.6; fair/weak = <0.20. * Not comparable units. LPA = light physical activity; MVPA = moderate-to-vigorous physical activity; PA = physical activity; SED = sedentary behavior; ∆ = mean difference; min = minutes; wk = week; d = day; MET = metabolic equivalent of task; kcal = kilocalories; MJ = megajoules; TEE = total energy expenditure; AEE = activity energy expenditure; EE = energy expenditure; PAL = physical activity level; HR = heart rate; DLW = doubly labeled water; VO2peak = peak oxygen uptake; BW = body weight; FFM = fat-free mass; IG = intervention group; CG = control group; SD = standard deviation; SWA = SenseWear Armband.Disclaimer/Publisher’s Note: The statements, opinions and data contained in all publications are solely those of the individual author(s) and contributor(s) and not of MDPI and/or the editor(s). MDPI and/or the editor(s) disclaim responsibility for any injury to people or property resulting from any ideas, methods, instructions or products referred to in the content. |
© 2026 by the authors. Licensee MDPI, Basel, Switzerland. This article is an open access article distributed under the terms and conditions of the Creative Commons Attribution (CC BY) license.
Share and Cite
Gagnon, M.; Bouqartacha, S.; Bédard, É.; Delattre, L.; Descarreaux, M.; Guimarães, R.d.F. Criterion and Convergent Validity of Youth Physical Activity and Sedentary Behavior Questionnaires in School Settings: A Systematic Review of Current Evidence and Future Perspectives. Children 2026, 13, 931. https://doi.org/10.3390/children13070931
Gagnon M, Bouqartacha S, Bédard É, Delattre L, Descarreaux M, Guimarães RdF. Criterion and Convergent Validity of Youth Physical Activity and Sedentary Behavior Questionnaires in School Settings: A Systematic Review of Current Evidence and Future Perspectives. Children. 2026; 13(7):931. https://doi.org/10.3390/children13070931
Chicago/Turabian StyleGagnon, Mégane, Salma Bouqartacha, Éloane Bédard, Livia Delattre, Martin Descarreaux, and Roseane de Fátima Guimarães. 2026. "Criterion and Convergent Validity of Youth Physical Activity and Sedentary Behavior Questionnaires in School Settings: A Systematic Review of Current Evidence and Future Perspectives" Children 13, no. 7: 931. https://doi.org/10.3390/children13070931
APA StyleGagnon, M., Bouqartacha, S., Bédard, É., Delattre, L., Descarreaux, M., & Guimarães, R. d. F. (2026). Criterion and Convergent Validity of Youth Physical Activity and Sedentary Behavior Questionnaires in School Settings: A Systematic Review of Current Evidence and Future Perspectives. Children, 13(7), 931. https://doi.org/10.3390/children13070931

