
Determinants of Child Growth in Palestine (Ages 5–17): A Structural Equation Modeling Approach to Food Insecurity, Nutrition, and Socioeconomic Factors
 , , , ,
  , ,
, ,  , and
, and
Abstract
1. Introduction
2. Materials and Methods
2.1. Data Source
2.2. Study Variables
2.3. Data Analyses
3. Results
3.1. Descriptive Analysis
3.1.1. Anthropometric vs. Socioeconomic Data
3.1.2. Macronutrient Intake Adequacy
3.1.3. Vitamin Intake Adequacy
3.1.4. Mineral Intake Adequacy
3.2. SEM Analysis
3.2.1. Model Fit
3.2.2. Normality Test
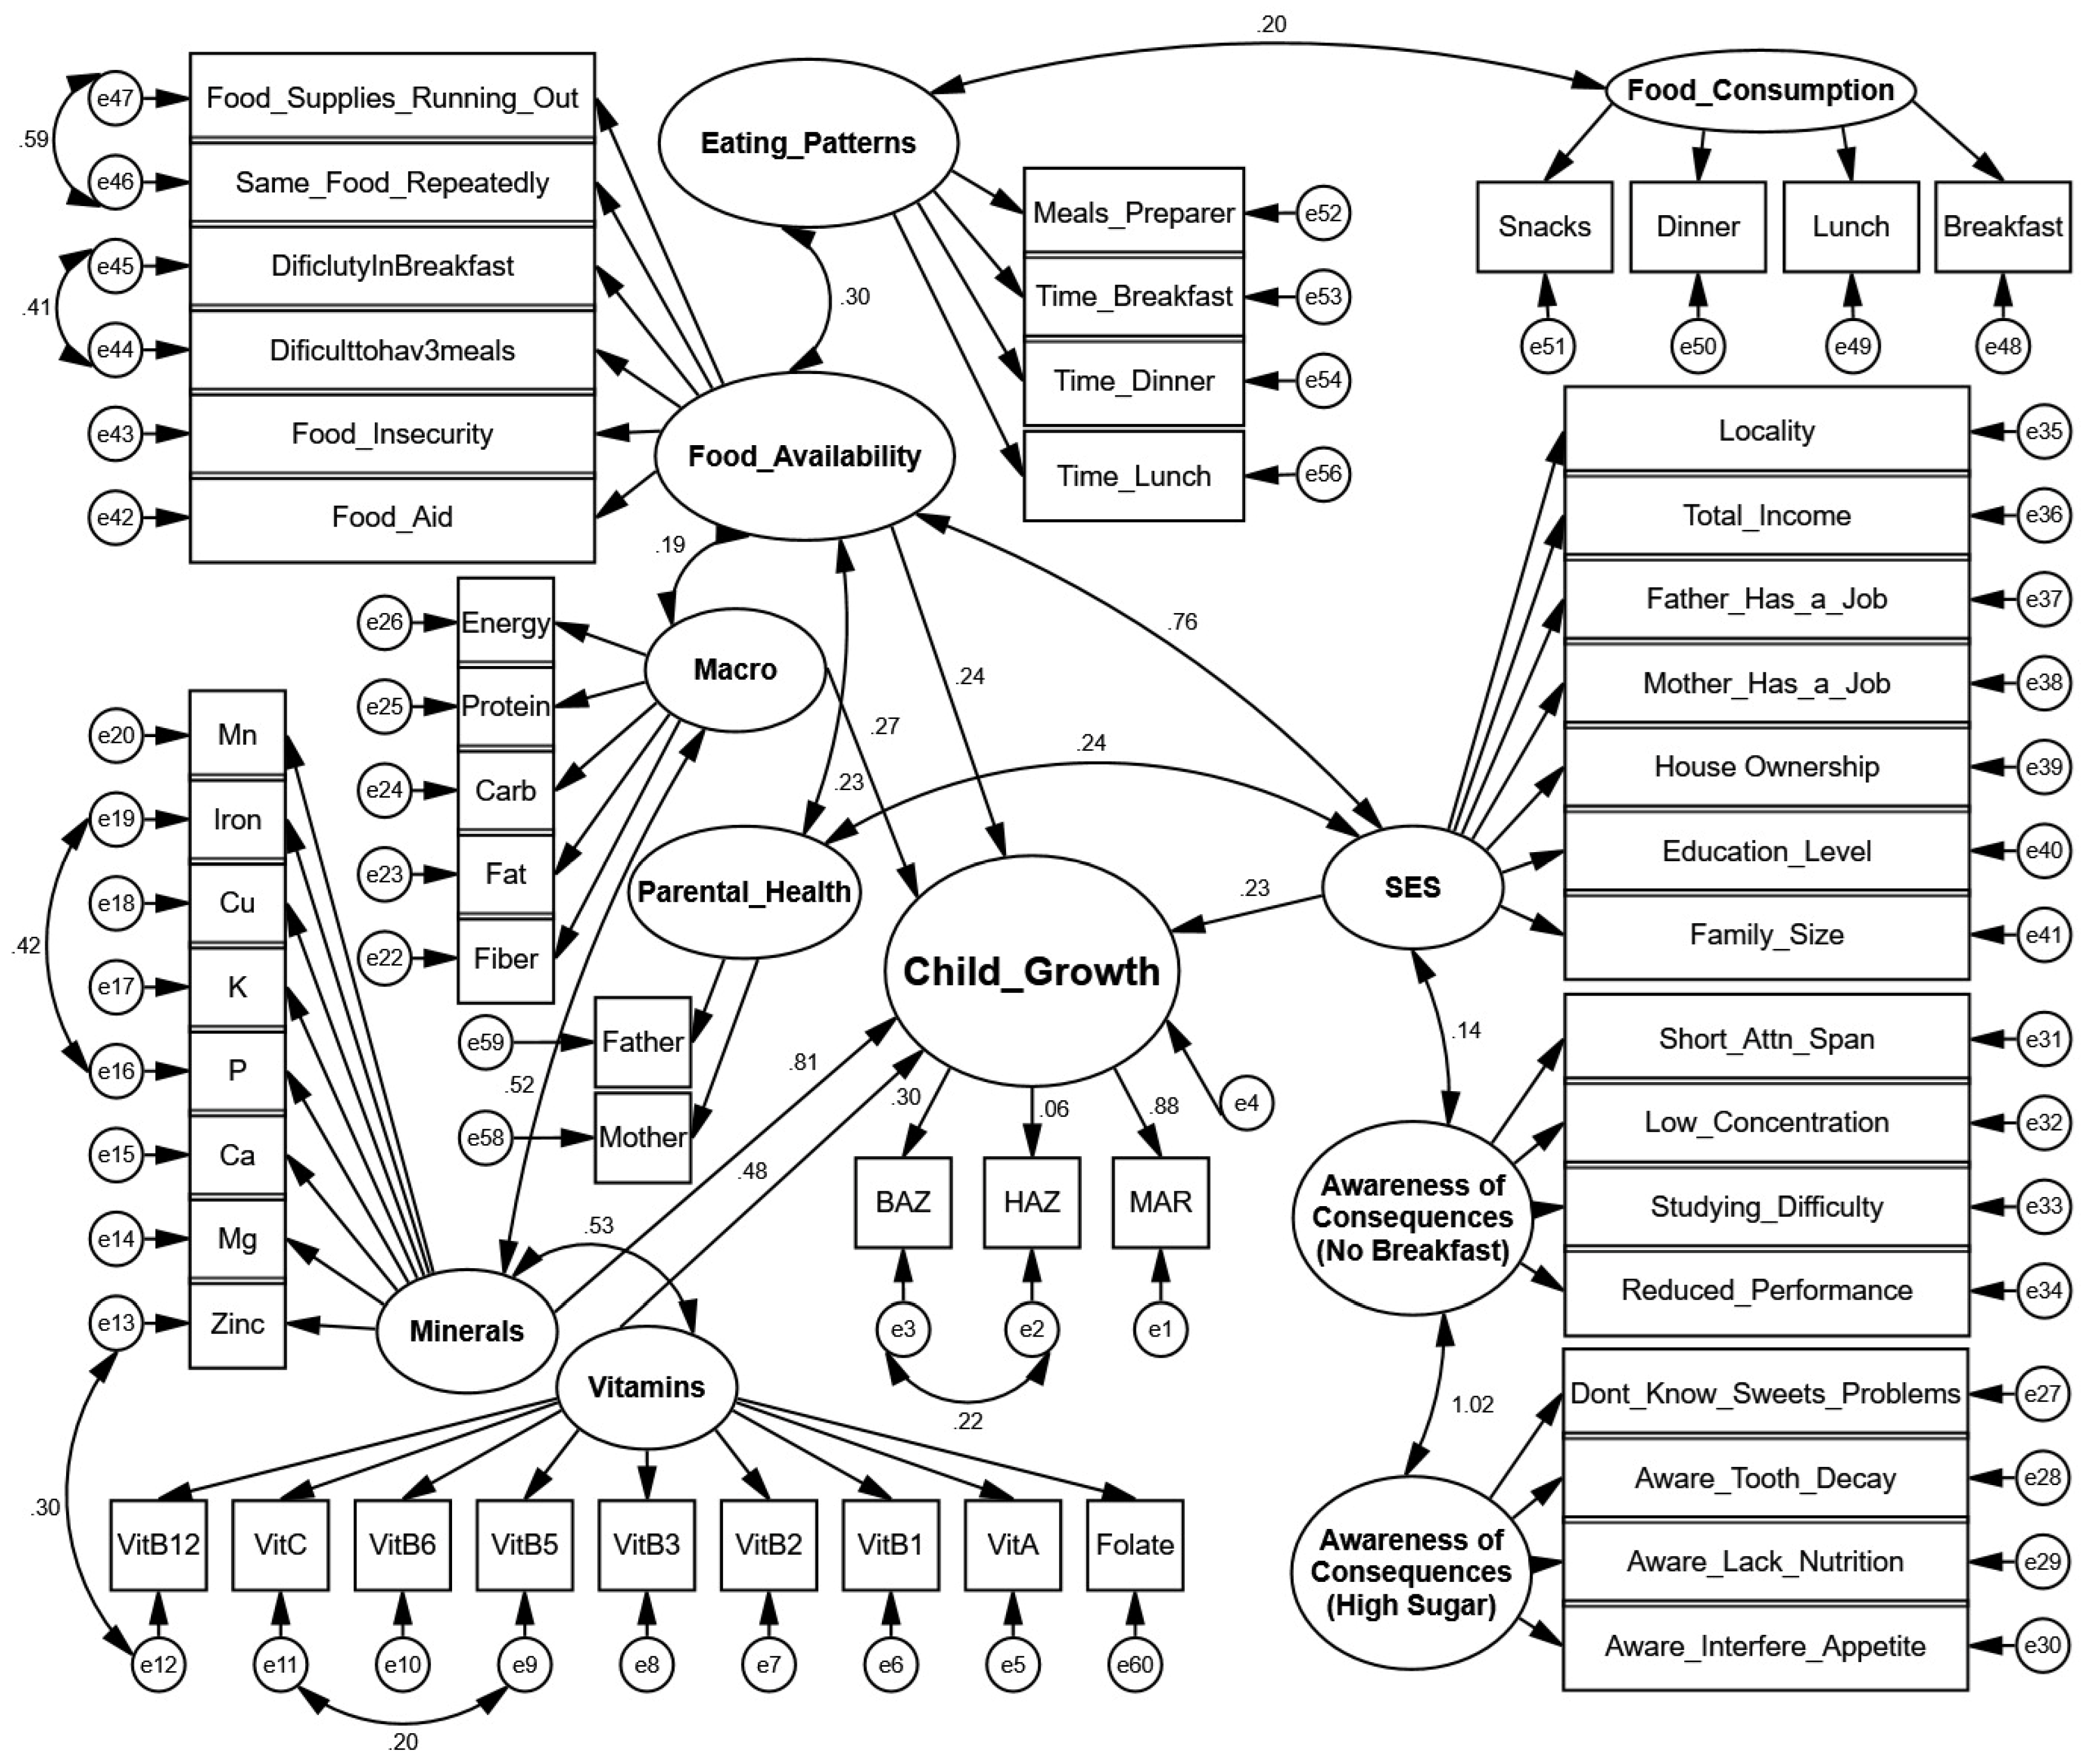
3.2.3. SEM Diagram
3.2.4. Latent-Indicator Standardized Direct Effects
3.2.5. Latent-Indicator Standardized Indirect Effects
3.2.6. Inter-Construct Covariances
4. Discussion
5. Conclusions
6. Study Limitations
Author Contributions
Funding
Institutional Review Board Statement
Informed Consent Statement
Data Availability Statement
Acknowledgments
Conflicts of Interest
References
- Rao, P.; Vander Schaaf, E.B.; Steiner, M.J.; Perry, M. Normal Child Growth and Development. In Encyclopedia of Child and Adolescent Health; Elsevier: Amsterdam, The Netherlands, 2023; pp. 295–309. [Google Scholar]
- World Health Organization. WHO Child Growth Standards: Length/Height-for-Age, Weight-for-Age, Weight-for-Length, Weight-for-Height and Body Mass Index-for-Age: Methods and Development; World Health Organization: Geneva, Switzerland, 2006. [Google Scholar]
- Victora, C.G.; Adair, L.; Fall, C.; Hallal, P.C.; Martorell, R.; Richter, L.; Sachdev, H.S. Maternal and Child Undernutrition: Consequences for Adult Health and Human Capital. Lancet 2008, 371, 340–357. [Google Scholar] [CrossRef] [PubMed]
- de Onis, M. Child Growth and Development. In Nutrition and Health in a Developing World; Springer International Publishing: Cham, Switzerland, 2017; pp. 119–141. [Google Scholar]
- Cameron, N. Child Growth and Armed Conflict. Ann. Hum. Biol. 2023, 50, 301–307. [Google Scholar] [CrossRef] [PubMed]
- Black, R.E.; Victora, C.G.; Walker, S.P.; Bhutta, Z.A.; Christian, P.; de Onis, M.; Ezzati, M.; Grantham-McGregor, S.; Katz, J.; Martorell, R.; et al. Maternal and Child Undernutrition and Overweight in Low-Income and Middle-Income Countries. Lancet 2013, 382, 427–451. [Google Scholar] [CrossRef] [PubMed]
- Jebena, M.G.; Lindstrom, D.; Belachew, T.; Hadley, C.; Lachat, C.; Verstraeten, R.; De Cock, N.; Kolsteren, P. Food Insecurity and Common Mental Disorders among Ethiopian Youth: Structural Equation Modeling. PLoS ONE 2016, 11, e0165931. [Google Scholar] [CrossRef]
- Motbainor, A.; Worku, A.; Kumie, A. Stunting Is Associated with Food Diversity While Wasting with Food Ins among Underfive Children in East and West Gojjam Zones of Amha Region, Ethiopia. PLoS ONE 2015, 10, e0133542. [Google Scholar] [CrossRef]
- Thomas, M.M.C.; Miller, D.P.; Morrissey, T.W. Food Insecurity and Child Health. Pediatrics 2019, 144, e20190397. [Google Scholar] [CrossRef]
- Gallegos, D.; Eivers, A.; Sondergeld, P.; Pattinson, C. Food Insecurity and Child Development: A State-of-the-Art Review. Int. J. Environ. Res. Public Health 2021, 18, 8990. [Google Scholar] [CrossRef]
- Warren, E.; Hawkesworth, S.; Knai, C. Investigating the Association between Urban Agriculture and Food Security, Dietary Diversity, and Nutritional Status: A Systematic Literature Review. Food Policy 2015, 53, 54–66. [Google Scholar] [CrossRef]
- Faber, M.; Schwabe, C.; Drimie, S. Dietary Diversity in Relation to Other Household Food Security Indicators. Int. J. Food Saf. Nutr. Public Health 2009, 2, 1–15. [Google Scholar] [CrossRef]
- Bidisha, S.H.; Khan, A.; Imran, K.; Khondker, B.H.; Suhrawardy, G.M. Role of Credit in Food Security and Dietary Diversity in Bangladesh. Econ. Anal. Policy 2017, 53, 33–45. [Google Scholar] [CrossRef]
- Huang, H.; Wan Mohamed Radzi, C.; Salarzadeh Jenatabadi, H. Family Environment and Childhood Obesity: A New Framework with Structu Equation Modeling. Int. J. Environ. Res. Public Health 2017, 14, 181. [Google Scholar] [CrossRef] [PubMed]
- Cheah, W.L.; Wan Abdul Manan, W.M.; Zabidi-Hussin, Z. A Structural Equation Model of the Determinants of Malnutrition among Children in Rural Kelantan, Malaysia. Rural Remote Health 2010, 10, 38–50. [Google Scholar] [CrossRef]
- Dwomoh, D.; Sewor, C.; Annim, S.K.; Stranges, S.; Kandala, N.-B.; Amegah, A.K. Do Dietary Practices and Household Environmental Quality Mediate Socio-Economic Inequalities in Child Undernutrition Risk in West Africa? Public Health Nutr. 2023, 26, 1022–1033. [Google Scholar] [CrossRef]
- Hartwell, M.L.; Khojasteh, J.; Wetherill, M.S.; Croff, J.M.; Wheeler, D. Using Structural Equation Modeling to Examine the Influence of Social, Behavioral, and Nutritional Variables on Health Outcomes Based on NHA Data: Addressing Complex Design, Nonnormally Distributed Variables, and Missing Information. Curr. Dev. Nutr. 2019, 3, nzz010. [Google Scholar] [CrossRef]
- Riddle, A.Y.; Li, W.; Bhutta, Z.A.; Vlassoff, C.; Taljaard, M.; Kristjansson, E.; Welch, V.; Wells, G.A. Associations between Dimensions of Empowerment and Nutritional Status among Married Adolescent Girls in East Africa: A Structural Equation Modelling Study. BMC Public Health 2023, 23, 225. [Google Scholar] [CrossRef]
- Kassaw, A.; Chane Mekonnen, T.; Tadesse Amsalu, E.; ABeje, E.T.; Daba, C.; Tsega, Y.; Endawkie, A. Mean Nutrient Adequacy Ratio and Associated Factors of Complementary Foods among Children Aged 6–23 Months in Northeast Ethiopia. Front. Pediatr. 2025, 13, 1446431. [Google Scholar] [CrossRef]
- Santosa, A.; Novanda Arif, E.; Abdul Ghoni, D. Effect of Maternal and Child Factors on Stunting: Partial Least Square Structural Equation Modeling. Clin. Exp. Pediatr. 2022, 65, 90–97. [Google Scholar] [CrossRef]
- Moyo, G.; Zachary, S.; Todd, L.; Dawson, J.; Thomas-Jackson, S.; Ngounda, J.; Jordan, M.; Robb, L.; Walsh, C.; Oldewege-Theron, W. Effects of Nutritional and Social Factors on Favorable Fetal Growth Co Using Structural Equation Modeling. Nutrients 2022, 14, 4642. [Google Scholar] [CrossRef]
- Ajayi, O.R.; Matthews, G.B.; Taylor, M.; Kvalsvig, J.D.; Davidson, L.; Kauchali, S.; Mellins, C. Structural Equation Modeling of the Effects of Family, Preschool, and Stunting on the Cognitive Development of School Children. Front. Nutr. 2017, 4, 17. [Google Scholar] [CrossRef]
- Qasrawi, R.; Sgahir, S.; Nemer, M.; Halaikah, M.; Badrasawi, M.; Amro, M.; Vicuna Polo, S.; Abu Al-Halawa, D.; Mujahed, D.; Nasreddine, L.; et al. Machine Learning Approach for Predicting the Impact of Food Insecurity on Nutrient Consumption and Malnutrition in Children Aged 6 Months to 5 Years. Children 2024, 11, 810. [Google Scholar] [CrossRef]
- World Health Organization (WHO). WHO Growth Reference 5–19 Years; WHO: Geneva, Switzerland, 2007. [Google Scholar]
- Institute of Medicine. Dietary Reference Intakes: The Essential Guide to Nutrient Requirements; National Academies Press: Washington, DC, USA, 2006. [Google Scholar]
- Tabachnick, B.G. Using Multivariate Statistics; Alyn and Bacon: Boston, MA, USA, 2007. [Google Scholar]
- Jöreskog, K.G.; Olsson, U.H.; Wallentin, F.Y. Confirmatory Factor Analysis (CFA). In Multivariate Analysis with LISREL; Springer: Berlin/Heidelberg, Germany, 2016; pp. 283–339. [Google Scholar]
- Hu, L.T.; Bentler, P.M. Cutoff Criteria for Fit Indexes in Covariance Structure Analysis: Conventional Criteria versus New Alternatives. Struct. Equ. Model. 1999, 6, 1–55. [Google Scholar] [CrossRef]
- Arbuckle, J.L. IBM ® SPSS ® Amos TM 23 User’s Guide; IBM: Armonk, NY, USA, 2014. [Google Scholar]
- National Research Council (US). Subcommittee on the Tenth Edition of the Recommended Dietary Allowances. In Recommended Dietary Allowances; National Academies Press: Washington, DC, USA, 1989. [Google Scholar]
- Lei, L. The Impact of Community Context on Children’s Health and Nutritional Status in China. Soc. Sci. Med. 2017, 179, 172–181. [Google Scholar] [CrossRef] [PubMed]
- Amir-ud-Din, R.; Fawad, S.; Naz, L.; Zafar, S.; Kumar, R.; Pongpanich, S. Nutritional Inequalities among Under-Five Children: A Geospatial Analysis of Hotspots and Cold Spots in 73 Low- and Middle-Income Countries. Int. J. Equity Health 2022, 21, 135. [Google Scholar] [CrossRef]
- Rabiu, K.M.; Idoko, S.A.; Ganiyu, A.I. Effect of School Feeding Programme on Nutritional Balance in Primary School Pupils in Kano Metropolis. Fudma J. Sci. 2023, 7, 256–264. [Google Scholar] [CrossRef]
- Smith, L.C.; Haddad, L. Reducing Child Undernutrition: Past Drivers and Priorities for the Post-MDG Era. World Dev. 2015, 68, 180–204. [Google Scholar] [CrossRef]
- Gibson, R.S.; Hess, S.Y.; Hotz, C.; Brown, K.H. Indicators of Zinc Status at the Population Level: A Review of the Evidence. Br. J. Nutr. 2008, 99, S14–S23. [Google Scholar] [CrossRef]
- Bird, J.K.; Murphy, R.A.; Ciappio, E.D.; McBurney, M.I. Risk of Deficiency in Multiple Concurrent Micronutrients in Children and Adults in the United States. Nutrients 2017, 9, 655. [Google Scholar] [CrossRef]
- Benton, D. Micronutrient Status, Cognition and Behavioral Problems in Childhood. Eur. J. Nutr. 2008, 47, 38–50. [Google Scholar] [CrossRef]
- Kiline, R. Principles and Practice of Structural Equation Modeling; Guilford Publications: New York, NY, USA, 2023. [Google Scholar]
- de Onis, M.; Branca, F. Childhood Stunting: A Global Perspective. Matern. Child. Nutr. 2016, 12, 12–26. [Google Scholar] [CrossRef]
- Victora, C.G.; Villar, J.; Barros, F.C.; Ismail, L.C.; Chumlea, C.; Papageorghiou, A.T.; Bertino, E.; Ohuma, E.O.; Lambert, A.; Carvalho, M. Anthropometric Characterization of Impaired Fetal Growth: Risk Factors for and Prognosis of Newborns with Stunting or Wasting. JAMA Pediatr. 2015, 169, e151431. [Google Scholar] [CrossRef]
- Allen, L.; De Benoist, B.; Dary, O.; Hurrell, R. Guidelines on Food Fortification with Micronutrients; WHO: Geneva, Switzerland, 2006. [Google Scholar]
- FAO; IFAD; UNICEF; WFP; WHO. The State of Food Security and Nutrition in the World 2021; Transforming Food Systems for Food Security, Improved Nutrition and Affordable Healthy Diets for All; FAO: Rome, Italy, 2021. [Google Scholar] [CrossRef]
- Singh, R. Phosphorus Metabolism. In Clinical Focus Series: Bone and Mineral Disorders; Jaypee Brothers Medical Pub: New Delhi, India, 2019. [Google Scholar]
- Christian, P.; Stewart, C.P. Maternal Micronutrient Deficiency, Fetal Development, and the Risk of Chronic Disease. J. Nutr. 2010, 140, 437–445. [Google Scholar] [CrossRef] [PubMed]
- Dewey, K.G.; Begum, K. Long-term Consequences of Stunting in Early Life. Matern. Child. Nutr. 2011, 7, 5–18. [Google Scholar] [CrossRef] [PubMed]
- Ahmed, T.; Auble, D.; Berkley, J.A.; Black, R.; Ahern, P.P.; Hossain, M.; Hsieh, A.; Ireen, S.; Arabi, M.; Gordon, J.I. An Evolving Perspective about the Origins of Childhood Undernutrition and Nutritional Interventions That Includes the Gut Microbiome. Ann. N. Y. Acad. Sci. 2014, 1332, 22–38. [Google Scholar] [CrossRef]
- Rampersaud, G.C.; Pereira, M.A.; Girard, B.L.; Adams, J.; Metzl, J.D. Breakfast Habits, Nutritional Status, Body Weight, and Academic Performance in Children and Adolescents. J. Am. Diet Assoc. 2005, 105, 743–760. [Google Scholar] [CrossRef]


| Construct | Variables |
|---|---|
| Child Growth | Children’s growth estimated based on the WHO growth reference data from 5 to 19 years. The growth construct is composed of BMI for age; height for age; Mean Nutrient Inadequate Ratio [24]. |
| Socioeconomic and Demographic | Age, gender, household income, family size, parental education, employment status, and refugee status. |
| Household Food Insecurity | Radimer/Cornell Hunger Scale (food quantity, food quality, food acceptability, certainty of obtaining food) [25]. |
| Dietary Intake | Two 24 h dietary recalls (weekday and weekend), types and amounts of food/beverages consumed, meal timings, locations, preparation methods, macronutrients and micronutrients (e.g., magnesium, potassium, phosphorus, iron, zinc), and comparison with RDA standards. |
| Anthropometric Measures | Height, weight, waist circumference, Body Mass Index (BMI) based on WHO and International Obesity Task Force criteria. |
| Nutrition-related Practices | Dietary habits, meal patterns, food purchasing and preparation practices, autonomy in food-related decisions. |
| Awareness of Skipping Breakfast Consequences | Recognition of attention span impact, school performance, and general knowledge of breakfast importance. |
| Knowledge of High Sugar Intake Risks | Awareness of tooth decay, nutritional deficiency, and appetite interference. |
| Attitude Toward Meal Regularity | Importance assigned to breakfast and regular meals and snacks. |
| Practical Barriers to Eating Regularly | Difficulties experienced in having breakfast regularly and maintaining consistent meal patterns. |
| Actual Meal Consumption | Consumption patterns of breakfast, lunch, dinner, and snacks. |
| Meal Timing and Regularity | Timing consistency for breakfast, lunch, and dinner. |
| Meal Preparation and Consumption Environment | Locations of meal consumption and person responsible for meal preparation. |
| Autonomy in Food Purchasing | Independent food purchasing behaviors and purchasing locations. |
| Food Shortage and Insufficiency | Food shortage experience and economic barriers affecting portion size and meal frequency. |
| BMI–Age Z-Score | Height–Age Z-Score | ||||||
|---|---|---|---|---|---|---|---|
| Below | Normal | Above | Below | Normal | Above | ||
| Locality | City | 51 (22.4) | 155 (68) | 22 (9.6) | 24 (10.5) | 194 (85.1) | 10 (4.4) |
| Village | 39 (23.8) | 114 (69.5) | 11 (6.7) | 22 (13.4) | 132 (80.5) | 10 (6.1) | |
| Refugee Camp | 13 (24.5) | 36 (67.9) | 4 (7.5) | 9 (17) | 42 (79.2) | 2 (3.8) | |
| Family Income | Low | 10 (21.3) | 34 (72.3) | 3 (6.4) | 6 (12.8) | 40 (85.1) | 1 (2.1) |
| Moderate | 67 (24.5) | 182 (66.7) | 24 (8.8) | 42 (15.4) | 218 (79.9) | 13 (4.8) | |
| High | 26 (20.8) | 89 (71.2) | 10 (8) | 7 (5.6) | 110 (88) | 8 (6.4) | |
| Father Job | No | 95 (22.9) | 284 (68.6) | 35 (8.5) | 51 (12.3) | 343 (82.9) | 20 (4.8) |
| Yes | 8 (25.8) | 21 (67.7) | 2 (6.5) | 4 (12.9) | 25 (80.6) | 2 (6.5) | |
| Mother Job | No | 73 (23) | 217 (68.5) | 27 (8.5) | 43 (13.6) | 258 (81.4) | 16 (5) |
| Yes | 30 (23.4) | 88 (68.8) | 10 (7.8) | 12 (9.4) | 110 (85.9) | 6 (4.7) | |
| gender | Male | 46 (25.6) | 120 (66.7) | 14 (7.8) | 25 (13.9) | 146 (81.1) | 9 (5) |
| Female | 57 (21.5) | 185 (69.8) | 23 (8.7) | 30 (11.3) | 222 (83.8) | 13 (4.9) | |
| Mother education | Primary | 41 (21.8) | 126 (67) | 21 (11.2) | 22 (11.7) | 154 (81.9) | 12 (6.4) |
| Secondary | 62 (24.1) | 179 (69.6) | 16 (6.2) | 33 (12.8) | 214 (83.3) | 10 (3.9) | |
| Age | 5–8 | 24 (18.9) | 95 (74.8) | 8 (6.3) | 17 (13.4) | 104 (81.9) | 6 (4.7) |
| 9–12 | 35 (22.4) | 101 (64.7) | 20 (12.8) | 20 (12.8) | 127 (81.4) | 9 (5.8) | |
| 13–17 | 44 (27.2) | 109 (67.3) | 9 (5.6) | 18 (11.1) | 137 (84.6) | 7 (4.3) | |
| Family Members | 2–4 | 22 (20.2) | 81 (74.3) | 6 (5.5) | 8 (7.3) | 95 (87.2) | 6 (5.5) |
| 5–6 | 48 (24.7) | 130 (67) | 16 (8.2) | 23 (11.9) | 165 (85.1) | 6 (3.1) | |
| 7+ | 33 (23.2) | 94 (66.2) | 15 (10.6) | 24 (16.9) | 108 (76.1) | 10 (7) | |
| 5–8 Years | 9–12 Years | 13–17 Years | Male | Female | Total | ||
|---|---|---|---|---|---|---|---|
| Energy | Inadequate | 53 (41.7) | 34 (21.8) | 33 (20.4) | 55 (30.6) | 65 (24.5) | 120 (27) |
| Adequate | 74 (58.3) | 122 (78.2) | 129 (79.6) | 125 (69.4) | 200 (75.5) | 325 (73) | |
| Protein | Inadequate | 8 (6.3) | 31 (19.9) | 49 (30.2) | 32 (17.8) | 56 (21.1) | 88 (19.8) |
| Adequate | 119 (93.7) | 125 (80.1) | 113 (69.8) | 148 (82.2) | 209 (78.9) | 357 (80.2) | |
| Carb | Inadequate | 27 (21.3) | 23 (14.7) | 20 (12.3) | 28 (15.6) | 42 (15.8) | 70 (15.7) |
| Adequate | 100 (78.7) | 133 (85.3) | 142 (87.7) | 152 (84.4) | 223 (84.2) | 375 (84.3) | |
| Fat | Inadequate | 69 (54.3) | 84 (53.8) | 64 (39.5) | 86 (47.8) | 131 (49.4) | 217 (48.8) |
| Adequate | 58 (45.7) | 72 (46.2) | 98 (60.5) | 94 (52.2) | 134 (50.6) | 228 (51.2) | |
| Fiber | Inadequate | 117 (92.1) | 144 (92.3) | 149 (92) | 170 (94.4) | 240 (90.6) | 410 (92.1) |
| Adequate | 10 (7.9) | 12 (7.7) | 13 (8) | 10 (5.6) | 25 (9.4) | 35 (7.9) |
| 5–8 Years | 9–12 Years | 13–17 Years | Male | Female | Total | ||
|---|---|---|---|---|---|---|---|
| Folate | Inadequate | 114 (89.8) | 0 (0) | 3 (1.9) | 51 (28.3) | 66 (24.9) | 117 (26.3) |
| Adequate | 13 (10.2) | 156 (100) | 159 (98.1) | 129 (71.7) | 199 (75.1) | 328 (73.7) | |
| VitA | Inadequate | 121 (95.3) | 0 (0) | 3 (1.9) | 54 (30) | 70 (26.4) | 124 (27.9) |
| Adequate | 6 (4.7) | 156 (100) | 159 (98.1) | 126 (70) | 195 (73.6) | 321 (72.1) | |
| VitB1 | Inadequate | 85 (66.9) | 103 (66) | 120 (74.1) | 124 (68.9) | 184 (69.4) | 308 (69.2) |
| Adequate | 42 (33.1) | 53 (34) | 42 (25.9) | 56 (31.1) | 81 (30.6) | 137 (30.8) | |
| VitB2 | Inadequate | 32 (25.2) | 74 (47.4) | 108 (66.7) | 84 (46.7) | 130 (49.1) | 214 (48.1) |
| Adequate | 95 (74.8) | 82 (52.6) | 54 (33.3) | 96 (53.3) | 135 (50.9) | 231 (51.9) | |
| VitB3 | Inadequate | 78 (61.4) | 113 (72.4) | 131 (80.9) | 126 (70) | 196 (74) | 322 (72.4) |
| Adequate | 49 (38.6) | 43 (27.6) | 31 (19.1) | 54 (30) | 69 (26) | 123 (27.6) | |
| VitB5 | Inadequate | 37 (29.1) | 105 (67.3) | 128 (79) | 110 (61.1) | 160 (60.4) | 270 (60.7) |
| Adequate | 90 (70.9) | 51 (32.7) | 34 (21) | 70 (38.9) | 105 (39.6) | 175 (39.3) | |
| VitB6 | Inadequate | 122 (96.1) | 0 (0) | 3 (1.9) | 54 (30) | 71 (26.8) | 125 (28.1) |
| Adequate | 5 (3.9) | 156 (100) | 159 (98.1) | 126 (70) | 194 (73.2) | 320 (71.9) | |
| VitB12 | Inadequate | 90 (70.9) | 110 (70.5) | 116 (71.6) | 127 (70.6) | 189 (71.3) | 316 (71) |
| Adequate | 37 (29.1) | 46 (29.5) | 46 (28.4) | 53 (29.4) | 76 (28.7) | 129 (29) | |
| VitC | Inadequate | 93 (73.2) | 117 (75) | 132 (81.5) | 138 (76.7) | 204 (77) | 342 (76.9) |
| Adequate | 34 (26.8) | 39 (25) | 30 (18.5) | 42 (23.3) | 61 (23) | 103 (23.1) |
| 5–8 Years | 9–12 Years | 13–17 Years | Male | Female | Total | ||
|---|---|---|---|---|---|---|---|
| Calcium | Inadequate | 117 (92.1) | 154 (98.7) | 161 (99.4) | 172 (95.6) | 260 (98.1) | 432 (97.1) |
| Adequate | 10 (7.9) | 2 (1.3) | 1 (0.6) | 8 (4.4) | 5 (1.9) | 13 (2.9) | |
| Mg | Inadequate | 70 (55.1) | 125 (80.1) | 160 (98.8) | 142 (78.9) | 213 (80.4) | 355 (79.8) |
| Adequate | 57 (44.9) | 31 (19.9) | 2 (1.2) | 38 (21.1) | 52 (19.6) | 90 (20.2) | |
| Mn | Inadequate | 9 (7.1) | 12 (7.7) | 148 (91.4) | 72 (40) | 97 (36.6) | 169 (38) |
| Adequate | 118 (92.9) | 144 (92.3) | 14 (8.6) | 108 (60) | 168 (63.4) | 276 (62) | |
| P | Inadequate | 48 (37.8) | 140 (89.7) | 153 (94.4) | 134 (74.4) | 207 (78.1) | 341 (76.6) |
| Adequate | 79 (62.2) | 16 (10.3) | 9 (5.6) | 46 (25.6) | 58 (21.9) | 104 (23.4) | |
| K | Inadequate | 126 (99.2) | 154 (98.7) | 162 (100) | 179 (99.4) | 263 (99.2) | 442 (99.3) |
| Adequate | 1 (0.8) | 2 (1.3) | 0 (0) | 1 (0.6) | 2 (0.8) | 3 (0.7) | |
| Cu | Inadequate | 76 (59.8) | 79 (50.6) | 87 (53.7) | 103 (57.2) | 139 (52.5) | 242 (54.4) |
| Adequate | 51 (40.2) | 77 (49.4) | 75 (46.3) | 77 (42.8) | 126 (47.5) | 203 (45.6) | |
| Iron | Inadequate | 83 (65.4) | 72 (46.2) | 118 (72.8) | 109 (60.6) | 164 (61.9) | 273 (61.3) |
| Adequate | 44 (34.6) | 84 (53.8) | 44 (27.2) | 71 (39.4) | 101 (38.1) | 172 (38.7) | |
| Zinc | Inadequate | 59 (46.5) | 103 (66) | 123 (75.9) | 114 (63.3) | 171 (64.5) | 285 (64) |
| Adequate | 68 (53.5) | 53 (34) | 39 (24.1) | 66 (36.7) | 94 (35.5) | 160 (36) |
| Fit Index | Value | Interpretation |
|---|---|---|
| χ2/df | (2912.34/1514) 1.924 | Good fit: <3.0 indicates good fit |
| CFI | 0.827 | Acceptable fit: ≥0.80 is acceptable, ≥0.90 is good |
| TLI | 0.817 | Acceptable fit: ≥0.80 is acceptable, ≥0.90 is good |
| RMSEA | 0.046 | Good fit: <0.05 good, <0.08 reasonable |
| RMSEA 90% CI | [0.043, 0.048] | Good fit: upper bound <0.08 indicates good precision |
| PCLOSE | 0.998 | Excellent: >0.05 suggests close fit |
| SRMR/RMR | 0.015 | Excellent fit: <0.05 excellent, <0.08 good |
| GFI | 0.809 | Acceptable fit: ≥0.80 is acceptable, ≥0.90 is good |
| AGFI | 0.792 | Marginally acceptable: close to 0.80 threshold |
| Causal Variable | Effect Variable <-- | Direct Effect | Significance (p-Value) |
|---|---|---|---|
| Child Growth | SES | 0.439 | 0.038 |
| Food availability | 0.492 | 0.029 | |
| Macronutrients | 0.383 | <0.001 | |
| Vitamins | 0.481 | <0.001 | |
| Minerals | 0.812 | <0.001 | |
| BAZ | 0.295 | <0.001 | |
| HAZ | 0.065 | 0.216 | |
| MAR | 0.883 | <0.001 | |
| SES | Locality | 0.388 | <0.001 |
| Total income | 0.666 | <0.001 | |
| Father has a job | 0.463 | <0.001 | |
| Mother has a job | 0.278 | <0.001 | |
| Family size | 0.145 | 0.018 | |
| House ownership | 0.058 | 0.322 | |
| Education level | 0.033 | 0.567 | |
| Food Availability | Insecurity level | 0.773 | <0.001 |
| Breakfast difficulty | 0.272 | <0.001 | |
| Not having 3 meals | 0.093 | 0.697 | |
| Food aid | 0.328 | <0.001 | |
| Same food repeatedly | 0.175 | 0.003 | |
| Supplies running out | 0.104 | 0.074 | |
| Macronutrients | Protein | 0.785 | <0.001 |
| Carb | 0.539 | <0.001 | |
| Fat | 0.445 | <0.001 | |
| Fiber | 0.261 | <0.001 | |
| Vitamins | Vitamin A | 0.994 | <0.001 |
| Vitamin B1 | 0.061 | 0.195 | |
| Vitamin B2 | 0.29 | <0.001 | |
| Vitamin B3 | 0.15 | 0.001 | |
| Vitamin B5 | 0.408 | <0.001 | |
| Vitamin B6 | 1.001 | <0.001 | |
| Vitamin B12 | 0.01 | 0.845 | |
| Folate | 0.955 | <0.001 | |
| Minerals | Calcium | 0.26 | 0.001 |
| Magnesium | 0.731 | <0.001 | |
| Manganese | 0.49 | 0.009 | |
| Phosphorus | 0.744 | <0.001 | |
| Potassium | 0.149 | <0.001 | |
| Copper | 0.341 | <0.001 | |
| Iron | 0.449 | <0.001 | |
| Zinc | 0.607 | <0.001 | |
| Parental Health | Father has a disease | 0.644 | <0.001 |
| Mother has a disease | 0.381 | 0.169 | |
| Awareness (Breakfast) | Short attention span | 0.556 | <0.001 |
| Low concentration | 0.349 | <0.001 | |
| Studying difficulty | 0.51 | <0.001 | |
| Reduced performance | 0.552 | <0.001 | |
| Awareness (High Sugar) | Aware of tooth decay | 0.338 | 0.003 |
| Aware it lacks nutrition | 0.544 | 0.001 | |
| Aware it interferes with appetite | 0.195 | 0.016 |
| Causal Variable | Effect Variable <-- | S.E. (95% BC CI) | Indirect Effect |
|---|---|---|---|
| BAZ | SES | 0.109 | 0.135 |
| Food Availability | 0.103 | 0.071 | |
| Macronutrients | 0.044 | 0.179 | |
| Vitamins | 0.036 | 0.075 | |
| Minerals | 0.050 | 0.24 | |
| HAZ | Food Availability | 0.036 | 0.022 |
| Macronutrients | 0.024 | 0.017 | |
| Vitamins | 0.026 | 0.036 | |
| Minerals | 0.044 | 0.064 | |
| MAR | Food Availability | 0.017 | 0.322 |
| Macronutrients | 0.112 | 0.251 | |
| Vitamins | 0.080 | 0.526 | |
| Minerals | 0.055 | 0.947 |
| Causal Variable | Effect Variable <--> | Total Effect | S.E. | Significance (p-Value) |
|---|---|---|---|---|
| SES | Food Availability | 0.76 | 0.01 | <0.001 |
| Awareness (Breakfast) | 0.14 | 0.004 | 0.041 | |
| Parental Health | 0.23 | 0.007 | 0.027 | |
| Food Availability | Eating Patterns | 0.30 | 0.007 | 0.072 |
| Parental Health | 0.23 | 0.006 | 0.014 | |
| Macronutrients | 0.19 | 0.006 | <0.001 | |
| Food Consumption | Eating Patterns | 0.20 | 0.003 | <0.001 |
| BAZ | HAZ | 0.22 | 0.027 | <0.001 |
| Macronutrients | Minerals | 0.52 | 0.004 | <0.001 |
| Vitamins | Minerals | 0.53 | 0.008 | <0.001 |
| Vitamin B5 | Vitamin C | 0.20 | 0.009 | <0.001 |
| Vitamin B12 | Zinc | 0.30 | 0.009 | <0.001 |
| Iron | Phosphorus | 0.42 | 0.007 | <0.001 |
| Breakfast Difficulty | Not Having 3 Meals | 0.41 | 0.011 | <0.001 |
| Same Food Repeatedly | Supplies Running Out | 0.59 | 0.008 | <0.001 |
| Awareness (Breakfast) | Awareness (High Sugar) | 1.02 | 0.002 | 0.002 |
Disclaimer/Publisher’s Note: The statements, opinions and data contained in all publications are solely those of the individual author(s) and contributor(s) and not of MDPI and/or the editor(s). MDPI and/or the editor(s) disclaim responsibility for any injury to people or property resulting from any ideas, methods, instructions or products referred to in the content. |
© 2025 by the authors. Licensee MDPI, Basel, Switzerland. This article is an open access article distributed under the terms and conditions of the Creative Commons Attribution (CC BY) license (https://creativecommons.org/licenses/by/4.0/).
Share and Cite
Thwib, S.; Qasrawi, R.; Issa, G.; Amro, M.; Abu Ghoush, R.; Saghir, S.; Mujahed, D.; Nemer, M.; Halaika, M.; Badrasawi, M.; et al. Determinants of Child Growth in Palestine (Ages 5–17): A Structural Equation Modeling Approach to Food Insecurity, Nutrition, and Socioeconomic Factors. Children 2025, 12, 703. https://doi.org/10.3390/children12060703
Thwib S, Qasrawi R, Issa G, Amro M, Abu Ghoush R, Saghir S, Mujahed D, Nemer M, Halaika M, Badrasawi M, et al. Determinants of Child Growth in Palestine (Ages 5–17): A Structural Equation Modeling Approach to Food Insecurity, Nutrition, and Socioeconomic Factors. Children. 2025; 12(6):703. https://doi.org/10.3390/children12060703
Chicago/Turabian StyleThwib, Suleiman, Radwan Qasrawi, Ghada Issa, Malak Amro, Razan Abu Ghoush, Sabri Saghir, Doa’a Mujahed, Maysaa Nemer, Mousa Halaika, Manal Badrasawi, and et al. 2025. "Determinants of Child Growth in Palestine (Ages 5–17): A Structural Equation Modeling Approach to Food Insecurity, Nutrition, and Socioeconomic Factors" Children 12, no. 6: 703. https://doi.org/10.3390/children12060703
APA StyleThwib, S., Qasrawi, R., Issa, G., Amro, M., Abu Ghoush, R., Saghir, S., Mujahed, D., Nemer, M., Halaika, M., Badrasawi, M., Al-Jawaldeh, A., Elmadfa, I., Nasreddine, L., Abu Al-Halawa, D., & Nimer, M. (2025). Determinants of Child Growth in Palestine (Ages 5–17): A Structural Equation Modeling Approach to Food Insecurity, Nutrition, and Socioeconomic Factors. Children, 12(6), 703. https://doi.org/10.3390/children12060703