Abstract
The purpose is to examine validity and reliability for an obesity risk assessment tool developed in Spanish for immigrant families with children, 3–5 years old using an 8-week cross-sectional design with data collected over 1 year at Head Start and Special Supplemental Nutrition Program for Women, Infants and Children [WIC]. Parent/child dyads (206) provided a child obesity risk assessment, three child modified 24 h dietary recalls, three child 36+ h activity logs and one parent food behavior checklist. Main outcome measures were convergent validity with nutrients, cup equivalents, and diet quality and three assessments of reliability that included item difficulty index, item discrimination index, and coefficient of variation. Validity was demonstrated for assessment tool, named Niños Sanos. Scales were significantly related to variables in direction hypothesized [p ≤ 0.05]: Healthy Eating Index, fruit/vegetable cup equivalents, folate, dairy cup equivalents, vitamins D, β-carotene, fiber, saturated fat, sugar, time at screen/ sleep/physical activity and parent behaviors. Three measures of reliability were acceptable. The addition of nutrient values as an analytical validation approach adds strength and consistency to previously reported Niños Sanos validation results using children’s blood biomarkers and body mass index. This tool can be used by health professionals as an assessment of obesity risk in several capacities: (1) screener for counseling in a clinic, (2) large survey, (3) guide for participant goal setting and tailoring interventions, and (4) evaluation.
1. Introduction
1.1. Background
Obesity prevalence (≥95th percentile-for-age) is significantly higher among Hispanic youth (23.6%) compared with non-Hispanic white youth (14.7%) in the United States [1], thus putting Hispanic youth at higher risk for obesity-associated medical conditions [2]. The differences in obesity rates appear early, as indicated by data among preschool children ages 3–5 years: 16.5% Hispanic vs. 9.9% non-Hispanic [1]. Some home environments are more conducive to setting young children on trajectories for unhealthful weight gain, overweight and eventually obesity [3,4]. The American Academy of Pediatrics (AAP) and the Institute of Medicine (IOM) recommend early intervention of modifiable environmental and behavioral factors associated with the risk of pediatric obesity [3,5]. Accordingly, valid assessments to screen for children at risk, evaluate behavioral family interventions and serve as a counseling tool for goal setting and tailoring intervention efforts are essential. Hispanic/Latinos represent 19% of the United States population and are the ethnic majority in the state of California (40.2%) [6]. Assessment tools that are tailored for and validated with Hispanic/Latino families with young children are scarce, yet necessary to sensibly address obesity prevention and nutrition and health inequities affecting a substantial proportion of the population.
1.2. Healthy Kids
Building on the IOM and AAP recommendations to address pediatric obesity in the U.S., our earlier research uncovered behaviors related to pediatric obesity occurring in the family environment through literature reviews [7]. This resulted in identifying questions in the domains of diet, lifestyle (i.e., sleep, screen time, physical activity), and parenting. The resulting assessment tool for low-income English-speaking parents with 3–5 year-old children, named Healthy Kids (HK), underwent reliability and validity testing using objective measures (inflammatory biomarkers [8] and measured body mass index [9]) and subjective measures (24 h dietary recalls [9] and 36 h activity logs [9]) in a longitudinal research design. Results showed that children with less healthful HK scores had an elevated inflammation index, indicating a low-grade chronic systemic inflammatory state. In children with less healthful behaviors, the inflammatory index increased over the 12 months of the study (p = 0.007), but not in children with more healthful profiles [8]. Results indicated an inverse relationship with a lower and healthier BMI percentile-for-age associated with a higher and healthier score (p = 0.02) [9].
1.3. Niños Sanos
Research from the above work was then rigorously revised to adapt it for another audience: Spanish-speaking immigrant families with young children, 3–5 years old, with a range of reading and written literacy skills in Spanish. Validation of a Spanish-language tool to target this population is warranted given that most low-income immigrants in the U.S. originate from Mexico and primarily speak Spanish, with about 40% having limited English proficiency and educational attainment levels less than a high school diploma [10]. The Mexican origin is especially pronounced in families with young children, which represent a majority of recipients for services targeting families with young children, such as Special Supplemental Nutrition Program for Women, Infants, and Children (WIC; 62%) [11] and Head Start (38%) [12]. The English version of Healthy Kids was converted to Spanish using forward translation conducted by 2 bilingual and bicultural Spanish speakers. To establish face validity of the converted tool, equivalence verification and cognitive interviews to elicit participant views on item clarity and understandability were employed to establish linguistic and cultural appropriateness of the text [13]. Details of this process are reported elsewhere [14]. The original photos targeting English speaking families were retaken with culturally appropriate images of families, activities and food items as recommended by the bilingual translators and endorsed by participants. Pairing the item text with a visual has been previously shown to improve reader understanding of self-administered questionnaires, thus reducing cognitive load and enhancing readability [15,16,17].
The resulting obesity risk assessment tool is named Niños Sanos (translation: Healthy Kids) and contains 18 items and potential minimum and maximum total scores of 18 and 90 points, respectively. Response options were coded on a scale of 1 to 5 points and recoded, if necessary, to reflect 5 points as the healthiest response option. Details of the selection process for the final 18 items are reported elsewhere [14].
Criterion validity of Niños Sanos was established using BMI percentile-for-age (p < 0.05) and blood biomarkers for metabolic (p = 0.03), lipid (p = 0.05), and anti-inflammatory health (p = 0.047) [14]. These results demonstrated that children with higher Niños Sanos scores had more desirable biomarker profiles and body composition. Details of these analyses are reported elsewhere [14]. The final version of Niños Sanos is available for researchers and practitioners at the link provided [18] and a photo is shown in Figure 1.
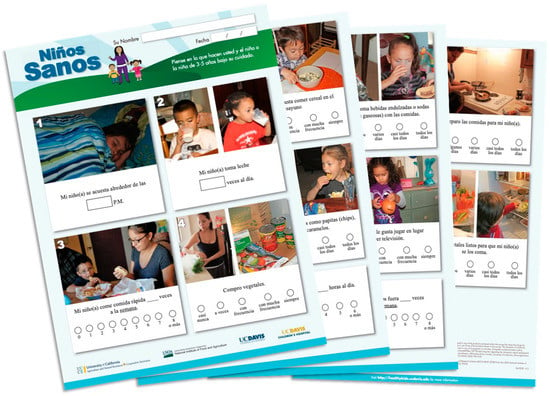
Figure 1.
Niños Sanos Obesity Risk Assessment, final version with 18 items, tailored to Spanish-speaking immigrant parents of 3–5 year old children. Items include parent fruit availability, child fruit intake, parent vegetable availability & accessibility, child eating dry cooked beans, child milk intake, child whole grain intake, child sugar-sweetened beverage frequency, child fast food frequency, child fast food frequency, parent trimming fat, child energy dense snacking, child sedentary time, among others. Printed in color on one 11 by 17-inch paper, folded in booklet format.
1.4. Purpose
Extending the above research [14], this current paper describes the work to establish convergent validity using dietary, activity and sleep data, and explore reliability using three tests. Specifically, objectives for validation are to establish: (1) the Niños Sanos dietary scale and sub-scale scores association with nutrient variables in the healthful direction; (2) the Niños Sanos dietary scale score association with the Healthy Eating Index total score; (3) the Niños Sanos dietary scale correspondence to parent food behaviors; and (4) the Niños Sanos physical activity, screen time and sleep scale scores agreement with variables calculated from the mean of three child’s 36+ h physical activity/screen time/bedtime logs. In addition, three reliability tests (i.e., item difficulty index, item discrimination index, and coefficient of variation) are examined to establish Niños Sanos consistency of measurement. Readability and respondent burden results are investigated.
2. Methods
2.1. Framework
The biopsychosocial framework used for the design of this study was based on Systems Theory [19,20]. This framework considered the health of the child in the context of the family environment and in that respect is similar to the Socio-Ecological Model (SEM) used to guide development of the tool’s content. Details are reported elsewhere [14]. The framework is provided as a Supplemental File (Figure S1).
2.2. Participants
Participants (n = 273 parent-child dyads) lived in 2 urban counties in northern California. The adults were parents or caregivers, ≥18 years, who declared Spanish as their preferred language, had at least one child aged 3–5 years and participated in at least one federal assistance program for low-income residents.
2.3. Recruitment Plan
Incorporating the concepts described by Diaz Rios and Chapman-Novakofski into the recruitment plan [21], parents were recruited by direct solicitation and at information sessions held at Head Start (n = 21) and WIC sites (n = 3). Three 2nd generation adults [22] ages 21–29, female, whose primary language spoken at home during childhood was Spanish and whose parents originated from Mexico, were employed and trained for parent/child recruitment and data collection. They were bicultural and bilingual, first in Spanish and second in English. To enhance trust during recruitment, staff met with potential participants at trusted locations where Spanish-speaking parents bring their children for Head Start classes or to pick up vouchers for WIC. Although signage about the study was posted at these sites and particulars were discussed at Head Start parent meetings by UC Davis research staff, recruitment was always conducted one-on-one in-person [21].
2.4. Retention Plan
Recruitment and subsequent data collection took place during 2017 and 2018 when stigma related to immigration status was a topic of conversation among Hispanic families [23]. Retention was a concern, so data collection staff acknowledged parent fears and conveyed confidentiality assurances. Participant time was respected by offering interview appointments at the time and place of participant preference. Trusted staff from Head Start interacted with parents about the study and made announcements at Head Start parent meetings to encourage parents to remain in the study. When passive channels of communication were employed, those channels were always held in combination with face-to-face contact [21].
2.5. Study Design, Timeline & Data Collection
Data for an individual parent/child dyad were collected over an 8-week period at 5 data collection points interspaced approximately 1–2 weeks apart as shown in Supplemental Figure S2. At Week 1, parents completed a demographic questionnaire as well as the first child’s 36+ h physical activity/screen time/bedtime log, and child’s 24 h dietary recall [24]. The 36+ h activity log and 24 h diet recall were administered again at Week 5 and at Week 7. Niños Sanos [14,18] was completed by parents at Week 3 along with a parent food behavior checklist, Lista de Habitos Alimenticios (translation: Food Behavior Checklist), previously shown to be valid with Spanish-speaking immigrant adults [25,26].
The 5 data collection sessions lasted approximately one hour and were conducted in the language preferred by the parent. Data were collected in person and by telephone interview. Written documentation such as consent forms, assessment tools, questionnaires and logs were printed in Spanish.
2.6. Validation
2.6.1. Convergent Validation for Dietary Behaviors with 24 h Dietary Recalls
Recalls were collected in Spanish by trained researchers in person and by telephone using the Automated Self-Administered 24 h Dietary Assessment Tool (ASA24 system) version 2014 employing USDA’s Automated Multiple-Pass Method (AMPM) and the Food and Nutrient Database for Dietary Studies (FNDDS) v4.1. Recalls were interviewer-administered, replacing the self-administered protocol outlined by ASA24. The ASA24 software protocol was used by the interviewer to guide the parent interview about the child’s diet. This deviation from standard protocol was necessary for several reasons: (1) Minimize data entry error related to participants’ proficiency with electronic devices for ASA24; (2) Parents do not read English; and FNDDS database lacked foods commonly consumed by Spanish-speaking immigrant families resulting in foods without matches. These foods were tagged for later discussion by researchers to determine the best substitute food item. To ensure data integrity, registered dietitians on the research team provided extensive training and guidance to the interviewers who collected the child’s dietary data from the parent in Spanish and then back-translated to English before entering the recall data into ASA24. Parents were asked to report child snack and meal items consumed in their presence. Foods provided by Head Start or another provider were not included when the parent was not present. Two weekday and one weekend recalls were collected per child at weeks 1, 5 and 7 of the 8-week protocol (Supplemental Figure S2). The Healthy Eating Index (HEI) version 2015 was calculated using data reported on the 24 h recalls [27].
2.6.2. Convergent Validation for Physical Activity, Screen and Sleep Behavior Items with Child 36+ h Logs
The child’s behaviors were assessed using the University of California My Child’s Food and Activity Diary, a 36+ h activity log [24]. Variables were collected or calculated for time of day, duration in minutes and location for activities that included bedtime, wake time, nap times, screen activities and physical activity. Two non-consecutive weekdays and one weekend day, during weeks 1, 5 and 7 respectively, were selected by the parent for data collection (Supplemental Figure S2).
2.6.3. Concurrent Validation with Parent Food Behaviors
The parent’s food-related behaviors were assessed using the 16-item University of California Lista de Habitos Alimenticios, a food behavior checklist for Spanish speakers, previously shown to be valid using 3 researcher-interview 24 h dietary recalls. Details are available [25,26]. Parent responses were coded using 4-response options per item for a maximum of 4 points per item. The 16 items were scaled and summed for a maximum of 64 points [26].
2.7. Reliability
Three approaches to reliability were assessed to give different perspectives on the consistency of parent responses to Niños Sanos [28,29,30].
(1) Item difficulty index [30], the ratio of each item’s mean to its maximum, was generated by dividing the mean value of responses to the item by the maximum score of 5 representing the most healthful response, for a potential range of 0.20–1.0.
(2) Item discrimination index [28] represents the ability of an item to discriminate between those parent/child dyads who do well on Niños Sanos, i.e., have high total scores, and those who do not. The index is the corrected item-total correlation, with a potential range of −1.0 to +1.0. The higher the value, the better the item is at identifying families with overall obesity prevention behaviors, indicated by the other 17 items. A value close to zero would indicate the item has no relationship with the other 17 obesity prevention items on the tool. A negative value would indicate the item is negatively related to the other 17 items; this item would be considered for removal.
(3) The coefficient of variation (CV) is the ratio of the standard deviation to the mean and is expressed as a percentage from 0–100% [31]. The higher the coefficient of variation, the greater the level of dispersion around the mean. The lower the value of the coefficient of variation, the more precision associated with the estimate, in this case, the item mean.
2.8. Readability and Respondent Burden
Additionally, two properties considered important for this audience and setting were assessed: readability [32] of Ninos Sanos by the Flesch-Kincaid Reading Index and Flesch Reading Ease using Microsoft Word software for Spanish (MS Office Professional Pro 2016, Microsoft, Inc., Seattle, WA, USA) and respondent burden by timing respondents completing the self-administered tool.
2.9. Statistics
Categorical demographic data are reported as number of participants and % of sample, using SAS for Windows, version 9.4 (SAS Institute, Cary NC, USA, 2017). Statistical program R [https//:cran.cnr.berkeley.edu, (accessed on 2 February 2020) V. 2014, Vienna, Austria] was used to calculate Pearson’s Chi-squared test with Yates’ continuity correction to compare demographic data for dropout and final samples.
Parent responses to Niños Sanos were next scored and total scores were discretized into 2 groups of low and high total behavior scores (18 to 74.9 points; 75.0 to 90 points) for some analyses. For other analyses, continuous variables were used. Kruskal Wallis (KW), a one-factor analysis of variance test, was used to compare Niños Sanos scores with dietary parameters and then with screen, activity and sleep parameters. Following KW analyses, Spearman rank order correlation coefficients were calculated. Spearman rank correlation coefficients provided the direction and strength of relationship between two quantitative variables. Significance level was set at p ≤ 0.05 for all analyses.
Tests for reliability reported in were conducted with data using SPSS [version 26.0, SPSS Inc., Chicago, IL, USA, 2020].
The study was powered by an analysis with BMI percentile-for-age as part of the broader Niños Sanos research. Those results are reported elsewhere [14]. The dietary results reported in this report were secondary to the main hypothesis about BMI.
2.10. Ethical Conduct
The latest version of the protocol, ID #693978-15 dated 27 June 2020, was approved by the Institutional Review Board of the University of California at Davis until 25
June 2029. Participants provided a signed consent at enrollment and were given monetary stipends reflective of their time and effort.
3. Results
3.1. Sample, Retention and Attrition
Families (n = 273) were enrolled in the study with 206 parent/child dyads completing all data collection time points with a 78% retention rate. Tests for attrition (p ≤ 0.05) revealed that participants who remained in the study over the 8-week time period were not different for most demographic variables tested with two exceptions. These parents were older by +2 years and more likely to report being unemployed compared to parents who dropped from the study (n = 67). Additional tests showed no difference in Niños Sanos scores between parents remaining in the study (n = 241) and those (n = 32) that dropped after week 1 (p = 0.63) (Supplemental Figure S2). From the final data set, 4 parents did not complete one or more of the 18 items on Niños Sanos.
3.2. Demographics including Generational Status
Parents (n = 206) were predominantly low-income and Spanish-speaking as a first language. They self-identified as speaking Spanish (87%), English (6%) or both Spanish & English (7%) in the home. Children (54% female) were born in the US (95%), averaged 45 months at enrollment. For acculturation variables, all parents were born outside the U.S. in Mexico (81%) and other Central American countries (19%). Parents (100%) were 1st generation based on IOM definitions. The majority of children were born in the U.S. (n = 198, 95%) and considered 2nd generation. Additional demographic characteristics are provided in Table 1.

Table 1.
Descriptive statistics of Niños Sanos study participants.
3.3. Convergent Validation for Dietary Behaviors with 24 h Dietary Recalls
Fifteen items related to eating behavior composed the Niños Sanos dietary sub-scale (Supplemental Table S1). The hypothesized associations offering support for the validity of the dietary sub-scale included HEI total score (r = 0.33, p ≤ 0.0001) and HEI sub-scale for proteins (r = 0.23, p ≤ 0.003) among others with items grouped by corresponding nutrients and food group (Table 2).
Table 2.
Validation using relationship of Niños Sanos sub-scales/categories with hypothesized variables from the mean of 3 24 h diet recalls, 3 36+ h activity and sleep logs, and University of California Food Behavior Checklist for low-income Mexican immigrant mother/child pairs (n = 206).
With regards to the 4-item fruit and vegetable sub-scale, key variables were significant: vegetable cup equivalents (r = 0.22, p = 0.03), fruit cup equivalents (r = 0.23, p ≤ 0.02), and total fiber (r = 0.21, p = 0.03). β-carotene was not (r = 0.19, p = NS). The dry bean item composing the bean sub-scale (which is also included as a vegetable item), was related to fiber (r = 0.25, p ≤ 0.002) and the HEI for green vegetables and beans (r = 0.42, p ≤ 0.0001). The milk sub-scale composed of two milk items was related to cup equivalents of milk (r = 0.19, p = 0.01). The 2-item sub-scale about soda, juice drinks and sports drinks was related to the HEI for added sugar (r = 0.19, p = 0.02) and inversely related to total dietary added sugar (r = −0.20, p = 0.008). The 3-item saturated fat sub-scale was weakly related to the HEI for saturated fat (r = 0.14, p ≤ 0.10). All associations between the categories and sub-scales from Niños Sanos and HEI scores are shown in Table 2.
3.4. Convergent Validation for Screen, Sleep, Physical Activity Behaviors with Child 36+ h Logs
The single Niños Sanos screen time variable represented by the television (TV) item was related to the screen time in minutes reported on the mean of three 36+ h logs (r = −0.44, p ≤ 0.0001) as shown in Table 2. The more screen time in minutes, the lower the score on the relevant NS item. The single Niños Sanos sleep time variable that captured children’s bedtime was related to average sleep time reported in the logs (r = −0.76, p = 0.008). The physical activity item was related to the mean activity time measured in minutes (r = 0.19, p = 0.05).
3.5. Concurrent Validation with Parent Food Behaviors
As hypothesized, the parent food-related behaviors assessed by the 16 items on the University of California’s Lista de Habitos Alimenticios were significantly related to the child’s overall score on Niños Sanos (r = 0.57, p ≤ 0.0001).
3.6. Reliability
Item difficulty index scores varied from 0.47 to 0.95. We considered the most desirable scores to be between ≥0.40 and ≤0.80. Ten items had scores within this range, while eight had scores > 0.80. One interpretation is that some behaviors, such as ‘Trimming fat from meat’ which was 0.86, were more routinely implemented behaviors and thus were relatively easier items to answer in comparison to other behaviors that may be less routine, such as ‘Parent drinks milk’. Additionally, social desirability bias in parent reporting is always a consideration.
Item discrimination index was lowest (−0.021) for ‘My child drinks milk’ and highest (0.49) for ‘I buy vegetables’. The high score was because parents who indicated they buy vegetables also responded similarly to other Niños Sanos items. Conversely, parents are not responding as expected to ‘My child drinks milk.’ When parents reported healthful behaviors for their children, they didn’t often report milk consumption. The interpretation is that frequency of milk drinking is not related to other healthful behaviors such as eating vegetables. Parents did not respond as expected to “My child eats snack foods like cookies, chips and candy.” A low score of +0.12 indicated that parents who reported their children regularly consumed cookies, chips and candy also reported some healthful behaviors. With a score near zero, our interpretation is that consumption of cookies, chips and candy was not related to the presence of healthful or unhealthful behaviors. Overall, the item-discrimination results showed that there was wide variation in the practice of behaviors related to obesity prevention across respondents, and a parent practicing one healthy behavior did not necessarily practice other healthy behaviors. Results demonstrate that preferences for protective obesity prevention behaviors vary by family (Table 3).
Table 3.
Reliability results for 18-item Niños Sanos: Item and scale difficulty index, item discrimination index, item and scale coefficient of variation and scale internal consistency (n = 202).
Item coefficient of variation (CV) scores indicate dispersion around the mean for responses to a given item, with smaller scores indicating more consistent measurement. The CV scores for Niños Sanos items ranged from 9% for “My child is not drinking soda” and “My child does not eat fast food” to 43% for “My child eats beans”. The two fast food items rendered consistent responses from parents compared to other NS items. The bean item was answered with the greatest variation of responses by participants (Table 3).
3.7. Readability and Other Psychometric Properties
With the objective of producing a readable tool in Spanish for English-as-a-second-language (ESL) audiences, the photographic additions conveying the content of each item to the user allowing the number of words to be reduced improved the readability index score. Flesch-Kincaid Reading Index for Spanish readability score was 81 of a possible 100 points, and a Flesh Reading Ease for Spanish was a score of 80. Scores between 80–89 points indicate easy reading. The average number of syllables per word for Niños Sanos was 1.9 while average sentence length was under 5 words. The 18-item tool with 1- and 2-syllable words and pictorial format required 10–14 min to administer meeting our criteria for minimal respondent burden.
4. Discussion
4.1. Validity
This current research provides support for the validation of Niños Sanos, an obesity risk assessment using a self-administered questionnaire format for immigrant Spanish speakers including those with limited Spanish literacy. The dietary and activity data support previously reported results that used the child’s body mass index and metabolic, inflammatory and lipid biomarkers [14]. The current results support the hypothesized associations between validation variables and Niños Sanos responses. A comprehensive picture of strength in support of a valid tool is portrayed using multiple sources of data and types of analysis.
Associations between the Niños Sanos total diet sub-scale score with an individual nutrient was generally moderate (r = 0.33, p = < 0.0001, HEI-Total Score) or adequate (r = 0.22, p = 0.002, fiber) from a statistical perspective (Table 2). However, when an individual nutrient is considered in combination with other hypothesized nutrients and cup equivalents, stronger associations with Niños Sanos scale scores emerge. There are several possible factors to explain these correlation coefficients. There is more than one food group source for most nutrients. Using fiber as an example, a high concordance cannot be expected for the relationship between Niños Sanos fruit and vegetable sub-scores and total dietary fiber, because fiber sources include whole grains, legumes, nuts and seeds, in addition to fruit and vegetables.
4.2. Reliability
This current research also provides evidence about the quality of Niños Sanos with assessments of reliability. Psychometric tests of reliability can reveal relevant characteristics of individual items in addition to the consistency of responses across the total tool. For example, the data for the vegetable availability item are: mean of 4.2 ± 1.0 SD, 0.85 item difficulty, 0.49 item discrimination and 23% CV. The relatively high score for item difficulty indicates that parents report practicing this behavior with ease compared to lower scoring items. The result for item discrimination reveals that this item is the best choice among the 18 items to identity parents and children who practice healthful behaviors overall. By comparison, the data for the vegetable accessibility item was: mean of 3.2 ± 1.3 SD, 0.63 item difficulty, 0.45 item discrimination and 41% CV. The item difficulty score indicates this behavior is practiced with less frequency. Both items discriminate in a similar manner meaning the items equally identify parents with higher total scores indicating more healthful behaviors reported. This item has a smaller mean and larger standard deviation compared to vegetable availability. By comparison, the vegetable accessibility item has a larger %CV. Our interpretation is that the vegetable accessibility item generates more variation among parent responses in this sample compared to the vegetable availability item. If a shorter tool is desired, vegetable accessibility is the preferred item for risk assessment.
Response option formatting has been a topic of cross-cultural psychological research with this Spanish-speaking audience. Researchers reported that Latinos, including Mexican Americans, with low levels of education and acculturation tended to select the extreme response set, i.e., the highest and lowest ends of the response scale, and to demonstrate acquiescence, i.e., choosing the ‘yes’ response [13,33,34,35]. The results from our current work indicate that most of our participants responded with the 3rd and 4th response options and not the extremes, 1st and 5th. And compared to our previous study assessing obesity risk behaviors with an English speaking audience, means for the item responses for 7 of the 8 overlapping items were smaller with Spanish-speaking participants [36]. This reinforces our observation that participants did not over-select extreme response options in our study. At the same time, participants tended to demonstrate acquiescence, agreement with more positive options.
4.3. Risk Assessment vs. Evaluation
The psychometric procedures employed for evaluating an item’s effectiveness depends on the purpose of the assessment and the researcher’s preference. To assess obesity risk, the tool would be administered to parent/child dyads on one occasion. The ideal item for such a tool has the following characteristics: valid using externally determined variables such as BMI and blood biomarker values as well as valid using self-report analysis such as 36 h logs and 24 h dietary recalls; reliable with sufficient variability; reliable with items that discriminate. If a practitioner could only ask one item to identify at risk families, the single item should have a relatively high score on the item discrimination index such as cooking from scratch and fruit availability in the case of NS. Developers of risk assessment using this pool of items would find items with relatively larger CV’s more helpful, such as the whole grains and vegetable/beans items.
For the purpose of program evaluation for an intervention, the tool would be administered twice: once before and once after an obesity prevention education intervention. Item difficulty is important with relatively lower scoring items preferred in addition to the validations mentioned above. Items with both lower item difficulty scores and smaller % CVs, such as the sleep/bedtime, would improve the chance of the practitioner capturing change and documenting positive impact following the intervention.
4.4. Comparison of Niños Sanos to Other Research
The current results were compared to those reported by the same researchers for the English-language Healthy Kids. Note that the previously reported validation research for both tools began with the same 43 items identified from the literature. Both tools have been shown to be valid using nutrient values [9], BMI [9,14] and blood values [8,14]. Overall, results were similar; however, details varied by audience. There are differences between the final versions of the two tools. The final Niños Sanos tool contains 18 items [18]; while Healthy Kids has 19 items. Eight of the Niños Sanos items do not appear on Healthy Kids.
Two tools for children developed by other researchers were located in the literature for obesity prevention in the United States. The well-researched 21-item Family Nutrition and Physical Activity (FNPA) tool in English targeted slightly older children, 6–12 years-old. This tool was validated with children (n = 704) using measured BMI over 6-year period in a mixed-income school district [37]. Children (n = 415) attending low-income schools were assessed for measured BMI, percent body fat and Acanthosis Nigricans [38]. The tool was later assessed with English-speaking parents of 2–9 year olds in a medical clinic setting and found to be effective with 2–5 year olds [39]. The second tool is the 15-item evaluation tool in English for the Expanded Food and Nutrition Education Program (EFNEP), which targets children 3–11 years-old, and was validated with low-income families (n = 62) [40,41]. Both of these tools were translated into Spanish and in the case of Dickin et al., with cognitive testing. Of these tools, only Niños Sanos was translated with cognitive testing and then in a separate study, validated with a Spanish-speaking immigrant sample [14].Tools have been developed in other counties for local populations: 4–16 year olds in Australia [42]; 4–11 year olds in England [43]; and 1–3 year olds in Ireland [44]. In their literature review, Bell, Golley and Magarey reported on short tools for dietary intake in Norway, Ghana, Europe, Switzerland, Germany, Belgium, Canada, and Argentina [45].
4.5. Limitations and Strengths
As with all studies, this one has limitations. First, generalizability of results beyond this convenience sample is limited; our sample was not randomly drawn from all low-income Spanish-speaking immigrant parents and their children in California. Thus, external validity of these findings to other Spanish-speaking audiences with limited resources is unknown. Second, the diet recalls have the inevitable measurement error associated with self-report. We sought to minimize this measurement error by employing bilingual and bicultural data collection staff and providing them with extensive training. Third, parents volunteered to participate in the study, thus the variability of parent responses in this cohort may be reduced compared to that of the general Spanish-speaking target population in California. Consequently, selection bias must be considered as a threat to external validity [46]. Fourth, the presence of social desirability bias may impact internal validity [47]. This source of error would suggest over-reporting of healthy behaviors such as vegetable accessibility and fruit availability and underreporting of unhealthy behaviors such as snacking on foods like cookies, chips and candy. When examining the potential impact of social desirability bias on Niños Sanos, this error would have the effect of reducing the level of statistical significance of results [46,47]. Fifth, there is the potential for the Hawthorne Effect to influence parent responses to the 24 h diet recalls and the 36+ h activity and sleep logs and thus impact internal validity [46]. Finally, the research design was cross-sectional; thus causality cannot be inferred [46]. Despite these limitations, important strengths should be noted. First, diet quality was characterized by the Healthy Eating Index, a validated diet quality indicator that is recognized by health professionals [48]. Second, by assessing overall diet quality, the effect of all nutrients grouped into one index is provided. And indices are more strongly related to mortality than any one component of diet alone [49]. Third, multiple approaches to validity and to reliability were employed, providing a more robust picture of the accuracy and consistency of Niños Sanos responses.
5. Conclusions
Niños Sanos, ready for field use by researchers and health practitioners, has demonstrated utility for obesity risk assessment among Spanish-speaking immigrant families with young children and is unique in that regard. These new results support and extend the previously reported validation with children’s BMI and blood biomarkers for obesity [14]. The addition of nutrient values as an analytical approach adds strength and consistency to the previous findings. Niños Sanos can be used by health professionals as an assessment of obesity risk in several capacities: (1) screener for counseling in health clinic settings for children most at risk [50], (2) large survey, (3) guide for participant goal setting and tailoring intervention efforts [51] and (4) evaluation tool to assess intervention impact.
Supplementary Materials
The following supporting information can be downloaded at: https://www.mdpi.com/article/10.3390/children10050868/s1, Figure S1: Biopsychosocial framework for validation of Niños Sanos targeting immigrant families with preschool-aged children. (a) Child dietary, physical activity, sleep and screen behaviors collected with original 45-item Niños Sanos. (b) Child diet estimated with 3 modified 24 h dietary recalls using the University of California Child Eating and Activity Diary and ASA24; child physical, screen, and sleep activities were estimated with 3 36 h activity logs using same Diary. (c) Child height, weight, and waist were measured (reported elsewhere). (d) Blood, blood pressure and body temperature were collected (reported elsewhere). Abbreviations: HEI, Healthy Eating Index; ASA24, Automated Self-Administered 24 h Dietary Assessment Tool. Figure S2: Flow diagram of initial recruits and subsequent dropouts of parent/child dyads at each stage of data collection for the Niños Sanos validation study. Table S1: Behavioral domain and construct, item text, item visual content and means ± SD for 18 items selected for final version of Niños Sanos assessment tool.
Author Contributions
M.S.T. was the principal investigator responsible for the grant, conceptualized the study, conducted reliability analyses, participated in discussions of data analysis and interpretation, and wrote drafts of the manuscript. M.K.S. was co-PI, conceptualized the study, provided her ASA24 expertise for data collection, entry and management, participated in discussions of data analysis and interpretation, and reviewed manuscript drafts. L.L. supervised data collection, entry and management, conducted statistical analyses, participated in discussions of data interpretation and reviewed manuscript drafts. C.D. supervised the statistical work of students, participated in discussions of data analysis and interpretation and wrote statistical methods section. L.K.D.R. conducted cognitive interviews and translation/cultural adaptation process, participated in discussions of data analysis and interpretation, and reviewed manuscript drafts. D.M.S. was a collaborator on the grant and conceptualized the study. N.L.K. was a collaborator on the grant, participated in dietary data management, served as an expert resource for dietary analyses and participated in discussions of data interpretation. L.L.O. was a co-PI, conceptualized the study and served as an expert on parenting issues. All authors have read and agreed to the published version of the manuscript.
Funding
National Institute of Food and Agriculture, U.S. Department of Agriculture, under award number #2015-68001-23280. The supporting source had no involvement in the research activities or restrictions regarding the publication of findings. Keim was supported by USDA-ARS, CRIS projects 2032-51530-022-00D and 2032-51530-025-00D.
Institutional Review Board Statement
This study was approved by and conducted in accordance with the ethical standards of the Institutional Review Board at University of California, Davis (ID #693978-15 and date 27 June 2020).
Informed Consent Statement
An oral and written description of the study was given to parents who provided written consent for themselves and their participating child.
Acknowledgments
The authors thank Misty Reed for the Niños Sanos design; WIC and SETA Head Start; Maria Espinoza, Gloria Zavala and Lizania Romero for recruitment, data collection, and data entry; and Larissa Leavens and Christine Davidson for staff training and data processing.
Conflicts of Interest
The authors declare they have no competing interest.
References
- Ogden, C.L.; Fryar, C.D.; Hales, C.M.; Carroll, M.D.; Aoki, Y.; Freedman, D.S. Differences in Obesity Prevalence by Demographics and Urbanization in US Children and Adolescents, 2013-2016. JAMA 2018, 319, 2410–2418. [Google Scholar] [CrossRef] [PubMed]
- Halfon, N.; Larson, K.; Slusser, W. Associations Between Obesity and Comorbid Mental Health, Developmental, and Physical Health Conditions in a Nationally Representative Sample of US Children Aged 10 to 17. Acad. Pediatr. 2013, 13, 6–13. [Google Scholar] [CrossRef]
- Krebs, N.F.; Jacobson, M.S.; American Academy of Pediatrics Committee on Nutrition. Prevention of Pediatric Overweight and Obesity. Pediatrics 2003, 112, 424–430. [Google Scholar] [CrossRef] [PubMed]
- Ward, Z.J.; Long, M.W.; Resch, S.C.; Giles, C.M.; Cradock, A.L.; Gortmaker, S.L. Simulation of Growth Trajectories of Childhood Obesity into Adulthood. N. Engl. J. Med. 2017, 377, 2145–2153. [Google Scholar] [CrossRef] [PubMed]
- Institute of Medicine (US) Committee on Prevention of Obesity in Children and Youth. Preventing Childhood Obesity: Health in the Balance; Koplan, J.P., Liverman, C.T., Kraak, V.I., Eds.; National Academies Press (US): Washington, DC, USA, 2005. Available online: http://www.ncbi.nlm.nih.gov/books/NBK83825/ (accessed on 30 September 2020).
- U.S. Census Bureau. Race and Hispanic Origin QuickFacts: United States, California. Published 2022. Available online: https://www.census.gov/quickfacts/fact/table/CA,US/PST045222 (accessed on 1 May 2023).
- Townsend, M.S.; Ontai, L.; Ritchie, L.; Williams, S.; Young, T. Guiding family-based obesity prevention efforts in low-income children in the US, Part 2: What behaviors do we measure? Int. J. Child Adolesc. Health 2009, 2, 31–48. Available online: https://escholarship.org/uc/item/3jt470x8 (accessed on 30 September 2020).
- Townsend, M.S.; Shilts, M.K.; LaNoue, L.; Drake, C.; Styne, D.M.; Woodhouse, L.; Ontai, L. Obesity Risk Assessment Tool among 3–5 Year Olds: Validation with Biomarkers of Low-Grade Chronic Inflammation. Child. Obes. 2020, 16, S23–S32. [Google Scholar] [CrossRef]
- Townsend, M.S.; Shilts, M.K.; Styne, D.M.; Drake, C.; Lanoue, L.; Ontai, L. An Obesity Risk Assessment Tool for Young Children: Validity with BMI and Nutrient Values. J. Nutr. Educ. Behav. 2018, 50, 705–717. [Google Scholar] [CrossRef]
- Migration Policy Institute. Available online: https://www.migrationpolicy.org/sites/default/files/publications/mpi_low-income-immigrants-factsheet_final.pdf (accessed on 18 April 2023).
- Food and Nutrition Service, USDA. Available online: https://www.fns.usda.gov/wic/eligibility-and-program-reach-estimates-2020 (accessed on 18 April 2023).
- Dual Learners at Head Start. Available online: https://www.acf.hhs.gov/opre/report/spotlight-dual-language-learners-head-start-faces-2014 (accessed on 18 April 2023).
- Hendrickson, S.G. Beyond Translation… Cultural Fit. West. J. Nurs. Res. 2003, 25, 593–608. [Google Scholar] [CrossRef] [PubMed]
- Townsend, M.S.; Shilts, M.K.; Lanoue, L.; Drake, C.; Diaz-Rios, L.K.; Styne, D.M.; Keim, N.L.; Ontai, L. Obesity Risk Assessment Tool for Low-Income Spanish Speaking Immigrant Parents with Young Children: Validity with BMI and Biomarkers of Obesity. Nutrients 2020, 12, 3582. [Google Scholar] [CrossRef]
- Townsend, M.S.; Ganthavorn, C.; Neelon, M.; Donohue, S.; Johns, M.C. Improving the Quality of Data from EFNEP Participants With Low Literacy Skills: A Participant-driven Model. J. Nutr. Educ. Behav. 2014, 46, 309–314. [Google Scholar] [CrossRef]
- Mayer, R.E. Multimedia aids to problem-solving transfer. Int J Educ Res. 1999, 31, 611–623. [Google Scholar] [CrossRef]
- Chandler, P.; Sweller, J. Cognitive Load Theory and the format of instruction. Cogn Instr. 1991, 8, 293–332. [Google Scholar] [CrossRef]
- Townsend, M.S.; Shilts, M.K.; Diaz-Rios, L.K.; Lanoue, L. Ninos Sanos, a 18-Item Pictorial Assessment of Obesity Prevention Behaviors in the Family Environment for Spanish Speakers. 2020. Available online: https://townsendlab.ucdavis.edu/evaluation-research-tools/validation-research/ (accessed on 30 September 2020).
- Engel, G.L. The clinical application of the biopsychosocial model. Am. J. Psychiatry. 1980, 137, 535–544. [Google Scholar] [CrossRef]
- Galea, S.; Riddle, M.; Kaplan, G.A. Causal thinking and complex system approaches in epidemiology. Int. J. Epidemiol. 2010, 39, 97–106. [Google Scholar] [CrossRef] [PubMed]
- Diaz-Rios, L.K.; Chapman-Novakofski, K. Latino/Hispanic Participation in Community Nutrition Research: An Interplay of Decisional Balance, Cultural Competency, and Formative Work. J. Acad. Nutr. Diet. 2018, 118, 1687–1699. [Google Scholar] [CrossRef] [PubMed]
- Taverno, S.E.; Rollins, B.Y.; Francis, L.A. Generation, Language, Body Mass Index, and Activity Patterns in Hispanic Children. Am. J. Prev. Med. 2010, 38, 145–153. [Google Scholar] [CrossRef] [PubMed]
- Bleich, S.N.; Fleischhacker, S. Hunger or Deportation: Implications of the Trump Administration’s Proposed Public Charge Rule. J. Nutr. Educ. Behav. 2019, 51, 505–509. [Google Scholar] [CrossRef] [PubMed]
- Townsend, M.S.; Shilts, M.K.; Davidson, C.; Leavens, L.L. My Child’s Activity & Food Diary (Log for Recording Physical Activity, Television and Computer Times, Bedtime, Wake Up Time, School, Other Activities). 2010. Available online: https://townsendlab.ucdavis.edu/evaluation-research-tools/validation-research/ (accessed on 30 September 2020).
- Banna, J.C.; Becerra, L.E.V.; Kaiser, L.L.; Townsend, M.S. Using Qualitative Methods to Improve Questionnaires for Spanish Speakers: Assessing Face Validity of a Food Behavior Checklist. J. Am. Diet. Assoc. 2010, 110, 80–90. [Google Scholar] [CrossRef]
- Banna, J.C.; Townsend, M.S. Assessing factorial and convergent validity and reliability of a food behaviour checklist for Spanish-speaking participants in US Department of Agriculture nutrition education programmes. Public Health Nutr. 2011, 14, 1165–1176. [Google Scholar] [CrossRef]
- Krebs-Smith, S.M.; Pannucci, T.E.; Subar, A.F.; Kirkpatrick, S.I.; Lerman, J.L.; Tooze, J.A.; Wilson, M.M.; Reedy, J. Update of the Healthy Eating Index: HEI-2015. J. Acad. Nutr. Diet. 2018, 118, 1591–1602. [Google Scholar] [CrossRef]
- Nunnally, J. Psychometric Theory, 3rd ed.; McGraw Hill: Noida, India, 2010. [Google Scholar]
- Price, L.R. Psychometric Methods: Theory into Practice, 1st ed.; The Guilford Press: New York, NY, USA, 2016. [Google Scholar]
- Litwin, M.S. How to Measure Survey Reliability and Validity, 1st ed.; SAGE Publications Inc: Thousand Oaks, CA, USA, 1995. [Google Scholar]
- Traub, R.E. Reliability for the Social Sciences: Theory and Applications; SAGE Publications Inc: Thousand Oaks, CA, USA, 1994. [Google Scholar]
- Klare, G.R. Assessing readability. Current Contents: Social and Behavioral Sciences, 20, No. 47, November 21, 1988, and Current Contents: Arts and Humanities, 20, No. 47, November 21, 1988. Curr. Contents Soc. Behav. Sci. 1988, 20. [Google Scholar]
- Hui, C.H.; Triandis, H.C. Effects of Culture and Response Format on Extreme Response Style. J. Cross-Cult. Psychol. 1989, 20, 296–309. [Google Scholar] [CrossRef]
- Davis, R.E.; Resnicow, K.; Couper, M.P. Survey Response Styles, Acculturation, and Culture among a Sample of Mexican American Adults. J. Cross-Cult. Psychol. 2011, 42, 1219–1236. [Google Scholar] [CrossRef] [PubMed]
- Davis, R.E.; Johnson, T.P.; Lee, S.; Werner, C. Why Do Latino Survey Respondents Acquiesce? Respondent and Interviewer Characteristics as Determinants of Cultural Patterns of Acquiescence among Latino Survey Respondents. Cross-Cult. Res. 2019, 53, 87–115. [Google Scholar] [CrossRef] [PubMed]
- Townsend, M.S.; Shilts, M.; Ontai, L.; Leavens, L.; Davidson, C.; Sitnick, S. Obesity Risk for Young Children: Development and Initial Validation of an Assessment Tool for Participants of Federal Nutrition Programs. Forum Fam. Consum. Issues 2014, 19. Available online: https://www.theforumjournal.org/2014/01/30/obesity-risk-for-young-children-development-and-initial-validation-of-an-assessment-tool-for-participants-of-federal-nutrition-programs/ (accessed on 30 September 2020).
- Ihmels, M.A.; Welk, G.J.; Eisenmann, J.C.; Nusser, S.M.; Myers, E.F. Prediction of BMI Change in Young Children with the Family Nutrition and Physical Activity (FNPA) Screening Tool. Ann. Behav. Med. 2009, 38, 60–68. [Google Scholar] [CrossRef]
- Yee, K.E.; Pfeiffer, K.A.; Turek, K.; Bakhoya, M.; Carlson, J.J.; Sharman, M.; Lamb, E.; Eisenmann, J.C. Association of the Family Nutrition and Physical Activity Screening Tool with Weight Status, Percent Body Fat, and Acanthosis Nigricans in Children from a Low Socioeconomic, Urban Community. Ethn. Dis. 2015, 25, 399–404. [Google Scholar] [CrossRef]
- Bailey-Davis, L.; Kling SM, R.; Wood, G.C.; Cochran, W.J.; Mowery, J.W.; Savage, J.S.; Stametz, R.A.; Welk, G.J. Feasibility of enhancing well-child visits with family nutrition and physical activity risk assessment on body mass index. Obes. Sci. Pract. 2019, 5, 220–230. [Google Scholar] [CrossRef]
- Dickin, K.L.; Larios, F.; Parra, P.A. Cognitive Interviewing to Enhance Comprehension and Accuracy of Responses to a Spanish-Language Nutrition Program Evaluation Tool. J. Nutr. Educ. Behav. 2015, 47, 465–471.e1. [Google Scholar] [CrossRef]
- Dickin, K.L.; Lent, M.; Lu, A.H.; Sequeira, J.; Dollahite, J.S. Developing a Measure of Behavior Change in a Program to Help Low-Income Parents Prevent Unhealthful Weight Gain in Children. J. Nutr. Educ. Behav. 2012, 44, 12–21. [Google Scholar] [CrossRef]
- Magarey, A.; Golley, R.; Spurrier, N.; Goodwin, E.; Ong, F. Reliability and validity of the Children’s Detary Ques-tionnaire; a new tool to measure children’s dietary patterns. Int. J. Pediatr. Obes. 2009, 4, 257–265. [Google Scholar] [CrossRef]
- West, F.; Sanders, M.R. The Lifestyle Behavior Checklist: A measure of weight-related problem behavior in obese children. Int. J. Pediatr. Obes. 2009, 4, 266–273. [Google Scholar] [CrossRef] [PubMed]
- Rice, N.; Gibbons, H.; McNulty, B.A.; Walton, J.; Flynn, A.; Gibney, M.J.; Nugent, A.P. Development and validation testing of a short nutrition questionnaire to identify dietary risk factors in preschooers aged 12-36 months. Food Nutr. Res. 2015, 59, 27912. [Google Scholar] [CrossRef]
- Bell, L.K.; Golley, R.K.; Magarey, A.M. Short tools to assess young children’s dietary intake: A systematic review focusing on application to dietary index research. J. Obes. 2013, 2013, 70962617. [Google Scholar] [CrossRef]
- Cook, T.D.; Campbell, D.T. Quasi-Experimentation: Design & Analysis Issues for Field Settings; Houghton Mifflin: Boston, MA, USA, 1979. [Google Scholar]
- Hebert, J.R.; Clemow, L.; Pbert, L.; Ockene, I.S.; Ockene, J.K. Social desirability bias in dietary selfreport may compromise the validity of dietary intake measures. Int. J. Epidemiol. 1995, 24, 389–398. [Google Scholar] [CrossRef]
- Guenther, P.M.; Kirkpatrick, S.I.; Reedy, J.; Krebs-Smith, S.M.; Buckman, D.W.; Dodd, K.W.; Casavale, K.O.; Carroll, R.J. The Healthy Eating Index-2010 Is a Valid and Reliable Measure of Diet Quality According to the 2010 Dietary Guidelines for Americans. J. Nutr. 2014, 144, 399–407. [Google Scholar] [CrossRef]
- Reedy, J.; Krebs-Smith, S.M.; Miller, P.E.; Liese, A.D.; Kahle, L.L.; Park, Y.; Subar, A.F. Higher diet quality is associated with decreased risk of all-cause, cardiovascular disease, and cancer mortality among older adults. J. Nutr. 2014, 144, 881–889. [Google Scholar] [CrossRef] [PubMed]
- Shilts, M.K.; Sitnic, S.L.; Ontai, L.; Townsend, M.S. Guided Goal Setting: A Feasible Obesity Prevention Behavior Change Strategy for Low-Income Parents with Young Children. J. Hum. Sci. Ext. 2018, 6, 161–179. Available online: https://www.jhseonline.com/article/view/798 (accessed on 30 September 2020). [CrossRef]
- Shilts, M.K.; Rios, L.K.D.; Panarella, K.H.; Styne, D.M.; Lanoue, L.L.; Drake, C.M.; Ontai, L.; Townsend, M.S. Feasibility of Colocating a Nutrition Education Program into a Medical Clinic Setting to Facilitate Pediatric Obesity Prevention. J. Prim. Care Community Health 2021, 12, 21501327211009695. [Google Scholar] [CrossRef]
Disclaimer/Publisher’s Note: The statements, opinions and data contained in all publications are solely those of the individual author(s) and contributor(s) and not of MDPI and/or the editor(s). MDPI and/or the editor(s) disclaim responsibility for any injury to people or property resulting from any ideas, methods, instructions or products referred to in the content. |
© 2023 by the authors. Licensee MDPI, Basel, Switzerland. This article is an open access article distributed under the terms and conditions of the Creative Commons Attribution (CC BY) license (https://creativecommons.org/licenses/by/4.0/).