

Effects of Socioeconomic Environment on Physical Activity Levels and Sleep Quality in Basque Schoolchildren

 ,
,  ,
,  ,
,  , , , ,
Abstract
1. Introduction
2. Materials and Methods
2.1. Subjects and Design
2.2. Instruments
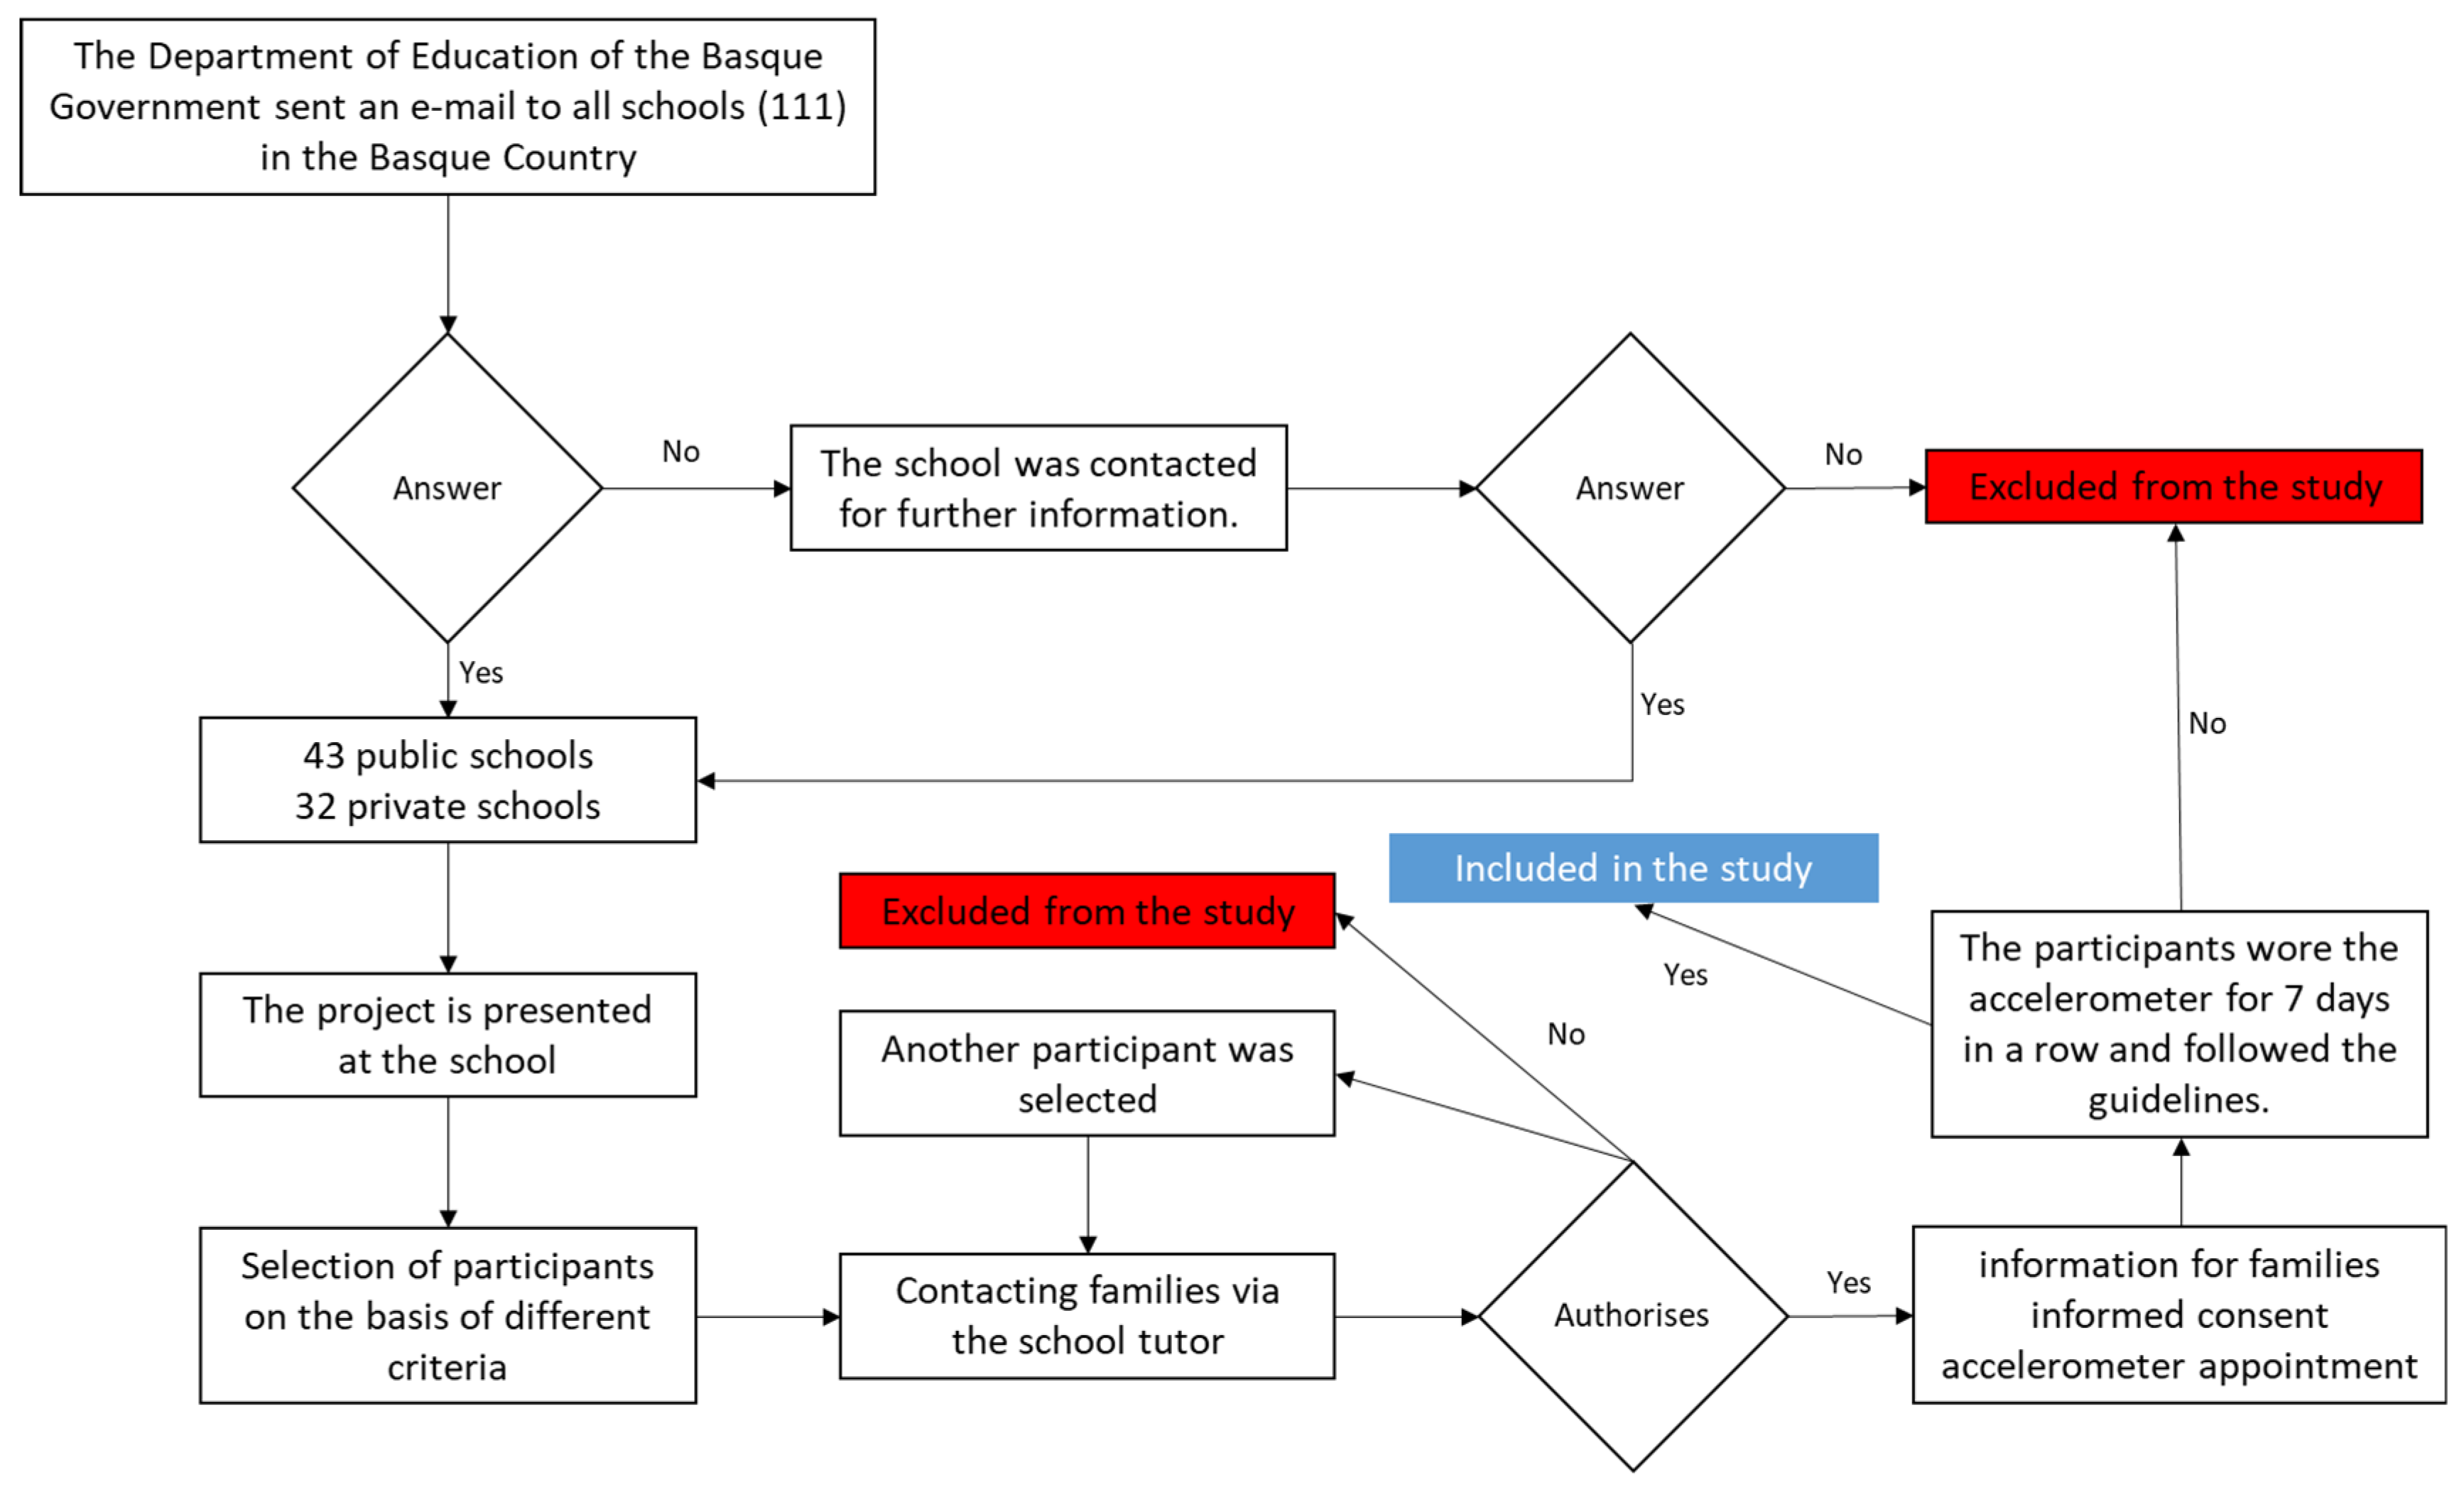
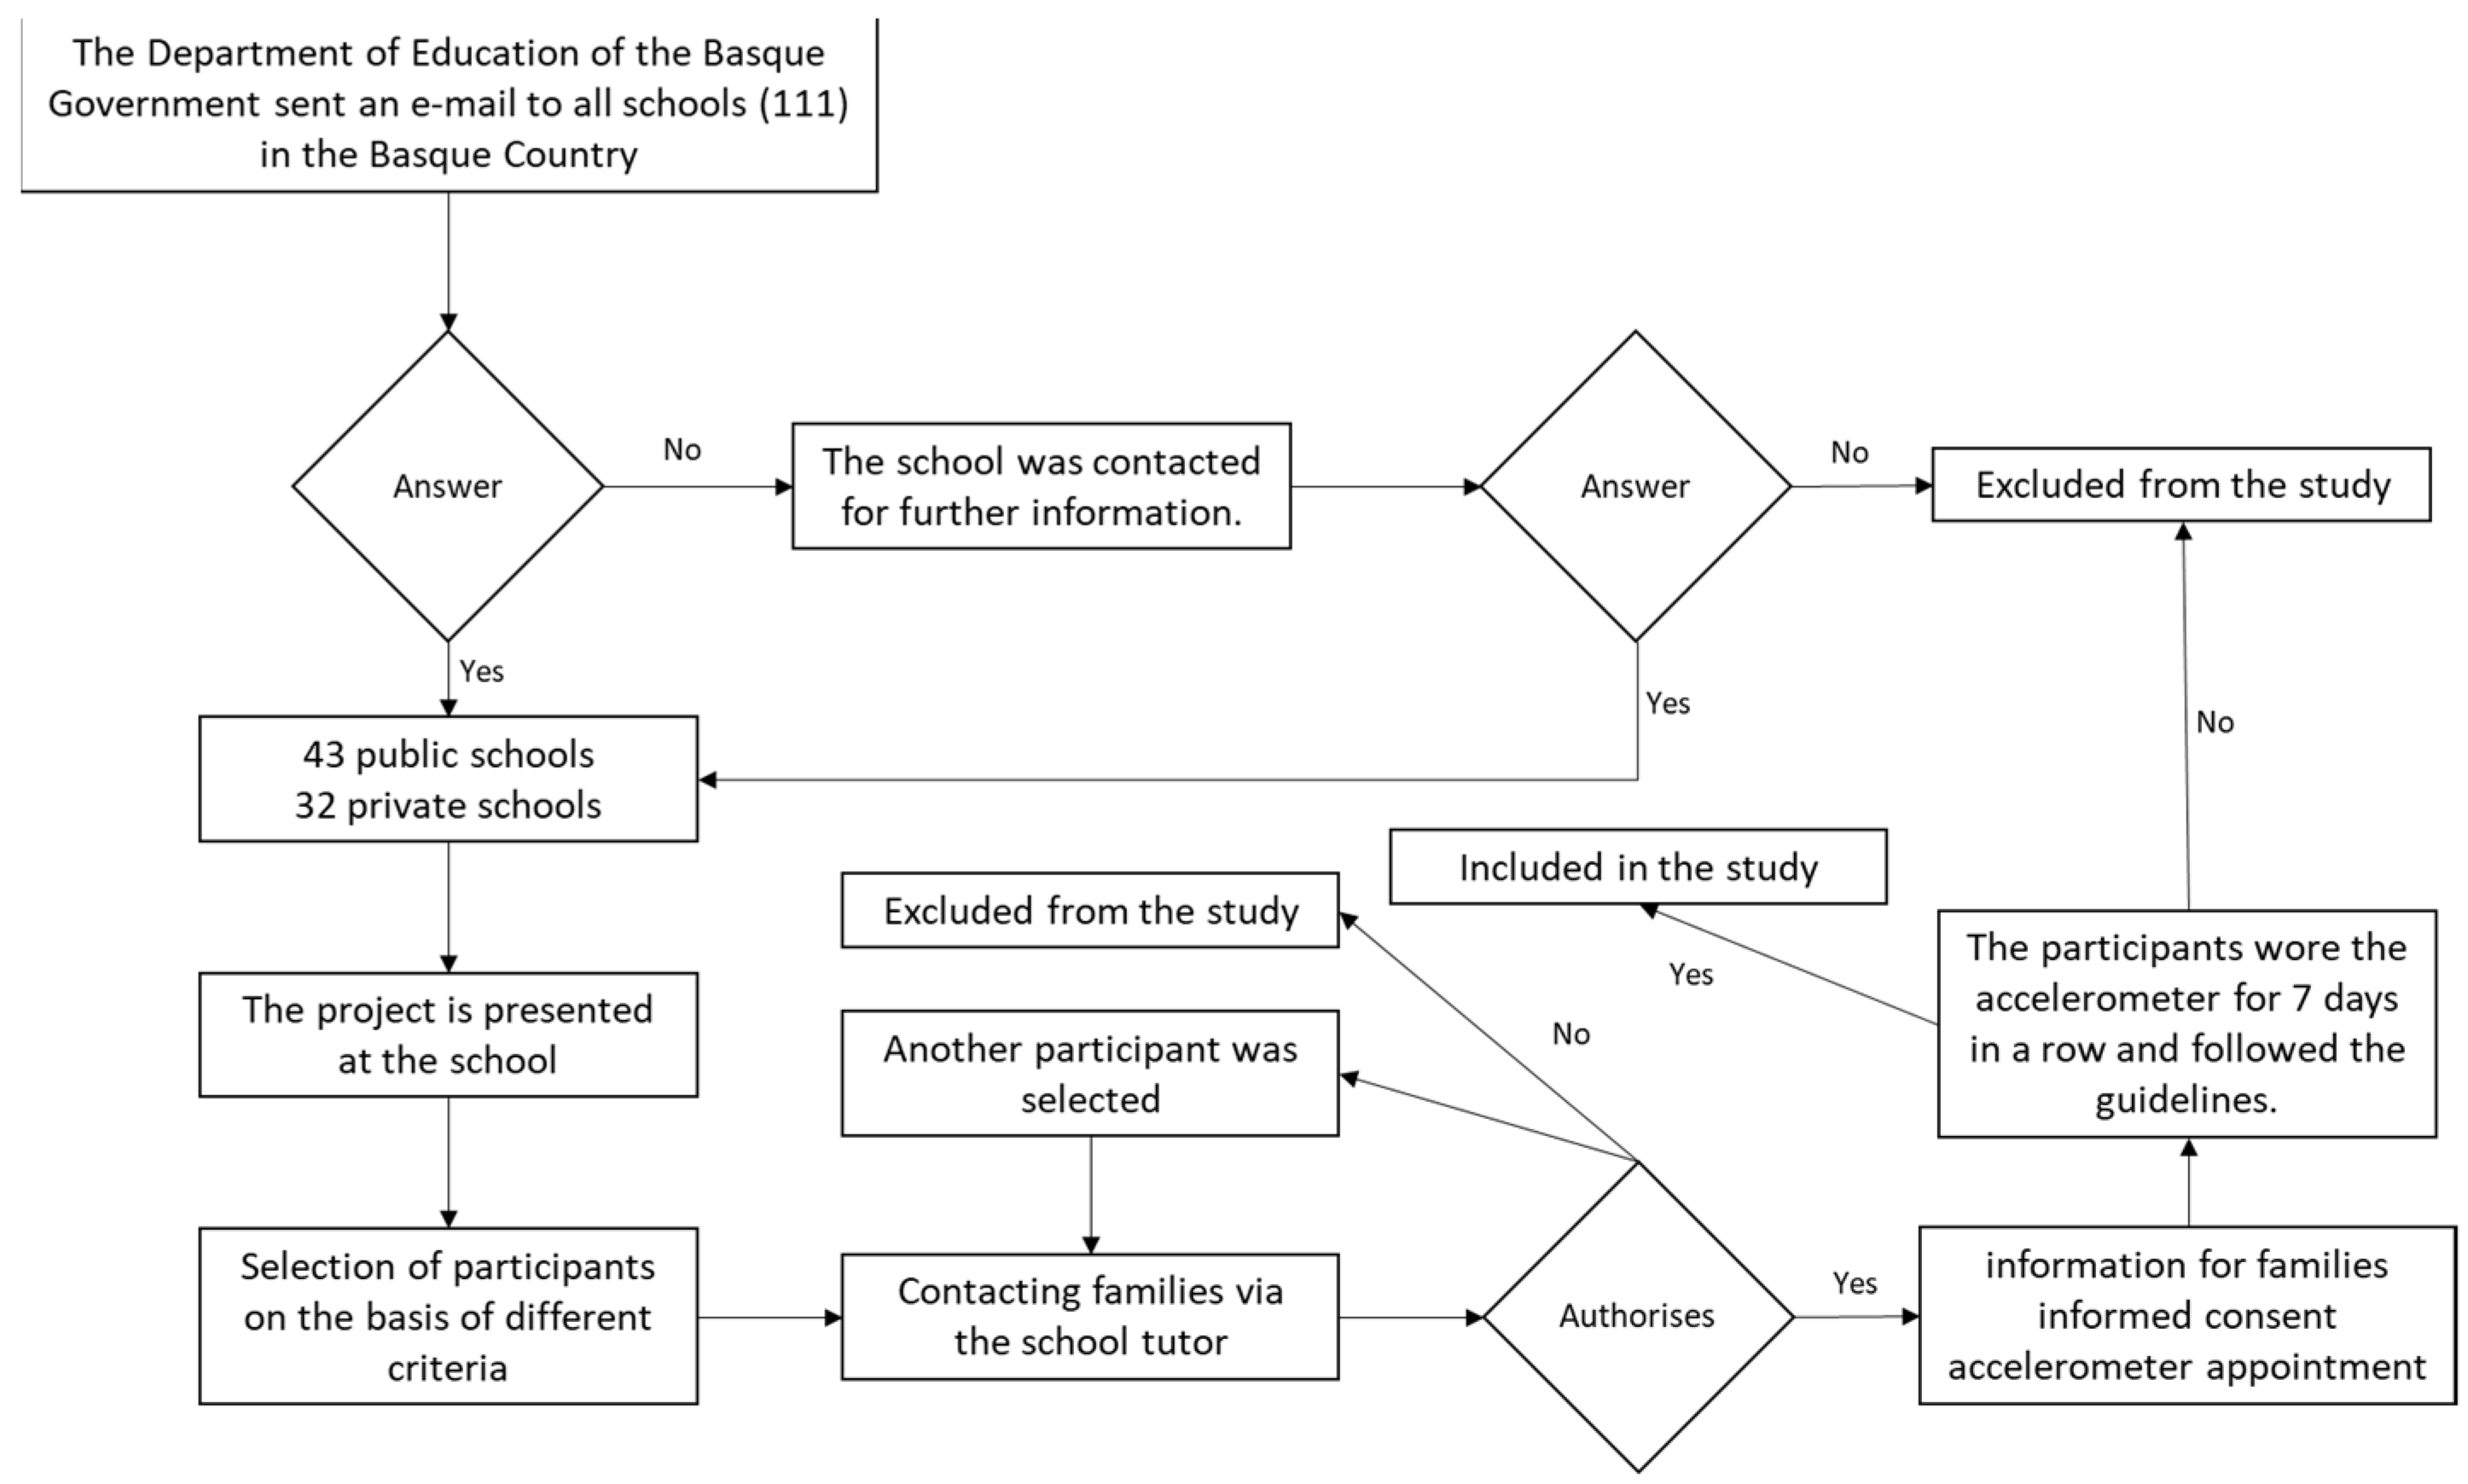
2.3. Procedure
2.4. Statistical Analysis
3. Results
4. Discussion
5. Conclusions
Author Contributions
Funding
Institutional Review Board Statement
Informed Consent Statement
Data Availability Statement
Acknowledgments
Conflicts of Interest
References
- Martín, U.; González-Rábago, Y. Bilbao’s Health in Figures. A Quantitative Diagnosis; EHU/UPV and Bilbao City Council: Bilbao, Spain, 2018. [Google Scholar]
- Whitehead, M.; Dahlgren, G. Concepts and Principles for Tackling Social Inequities in Health: Levelling up Part 1; World Health Organization: Copenhagen, Denmark, 2007. [Google Scholar]
- Borrell, C.; Pons-Vigués, M.; Morrison, J.; Díez, E. Factors and processes influencing health inequalities in urban area. J. Epidemiol. Community Health 2013, 67, 389–391. [Google Scholar] [CrossRef] [PubMed]
- Diez-Roux, A.V.; Mair, C. Neighborhoods and health. Ann. N. Y. Acad. Sci. 2010, 1186, 125–145. [Google Scholar] [CrossRef] [PubMed]
- Commission to Reduce Social Inequalities in Health in Spain. A proposal of policies and interventions to reduce social inequalities in health in Spain. Gac. Sanit. 2012, 26, 182–189. [Google Scholar] [CrossRef]
- Mutrie, N.; Carney, C.; Blamey, A.; Crawford, F.; Aitchison, T.; Whitelaw, A. “Walk in to Work Out”: A randomized controlled trial of a self help intervention to promote active commuting. J. Epidemiol. Community Health 2002, 56, 407–412. [Google Scholar] [CrossRef] [PubMed]
- Brown, V.; Moodie, M.; Mantilla-Herrera, A.M.; Veerman, J.L.; Carter, R. Active transport and obesity prevention—A transportation sector obesity impact. scoping review and assessment for Melbourne, Australia. Prev. Med. 2016, 96, 49–66. [Google Scholar] [CrossRef]
- Virto, N.; Etayo-Urtasun, P.; Sánchez-Isla, J.R.; Arietanizbeaskoa, M.S.; Mendizabal-Gallastegui, N.; Grandes, G.; Gutierrez, B.; Coca, A.; Río, X. Efectos de una intervención de 12 semanas de ejercicio en los niveles de hemoglobina glicada (HbA1c) en pacientes con cáncer (Effects of a 12-week exercise intervention on glycated hemoglobin (HbA1c) levels in cancer patients). Retos 2023, 48, 153–160. [Google Scholar] [CrossRef]
- Wang, Z.; Emmerich, A.; Pillon, N.J.; Moore, T.; Hemerich, D.; Cornelis, M.C.; Mazzaferro, E.; Broos, S.; Ahluwalia, T.S.; Bartz, T.M.; et al. Genome-wide association analyses of physical activity and sedentary behavior provide insights into underlying mechanisms and roles in disease prevention. Nat. Genet. 2022, 54, 1332–1344. [Google Scholar] [CrossRef]
- GBD 2013 Risk Factors Collaborators. Global, regional, and national comparative risk assessment of 79 behavioural, environmental and occupational, and metabolic risks or clusters of risks in 188 countries, 1990–2013: A systematic analysis for the Global Burden of Disease Study 2013. Lancet 2015, 386, 2287–2323. [Google Scholar] [CrossRef]
- Diez-Roux, A.V. Residential environments and cardiovascular risk. J. Urban Health 2003, 80, 569–589. [Google Scholar] [CrossRef]
- Humpel, N.; Owen, N.; Leslie, E. Environmental factors associated with adults’ participation in physical activity: A review. Am. J. Prev. Med. 2002, 22, 188–199. [Google Scholar] [CrossRef]
- Ball, K.; Bauman, A.; Leslie, E.; Owen, N. Perceived environmental aesthetics and convenience and company are associated with walking for exercise among Australian adults. Prev. Med. 2001, 33, 434–440. [Google Scholar] [CrossRef] [PubMed]
- Sallis, J.F.; Hovell, M.F.; Hofstetter, C.R.; Elder, J.P.; Hackley, M.; Caspersen, C.J.; Powell, K.E. Distance between homes and exercise facilities related to frequency of exercise among San Francisco residents. Diego residents. Public Health Rep. 1990, 105, 179–185. [Google Scholar]
- Rodriguez-Romo, G.; Garrido-Muñoz, M.; Lucía, A.; Mayorga, J.I.; Ruiz, J.R. Association between environmental characteristics and physical activity. Gac. Sanit. 2013, 27, 487–493. [Google Scholar] [CrossRef]
- Sallis, J.F.; Cervero, R.B.; Ascher, W.; Henderson, K.A.; Kraft, M.K.; Kerr, J. An ecological approach to creating active living communities. Anu. Rev. Public Health 2006, 27, 297–322. [Google Scholar] [CrossRef] [PubMed]
- Sallis, J.F.; Glanz, K. The role of built environments in physical activity, eating, and obesity in childhood. Future Child. 2006, 16, 89–108. [Google Scholar] [CrossRef] [PubMed]
- Bird, E.L.; Ige, J.O.; Pilkington, P.; Pinto, A.; Petrokofsky, C.; Burgess-Allen, J. Built and natural environment planning principles for promoting health: An umbrella review. BMC Public Health 2018, 18, 930. [Google Scholar] [CrossRef]
- McGrath, L.J.; Hopkins, W.G.; Hinckson, E.A. Associations of objectively measured built environment attributes with moderate-vigorous youth physical activity: A systematic review and meta-analysis. Sport. Med. 2015, 45, 841–865. [Google Scholar] [CrossRef]
- Nordbø, E.C.A.; Nordh, H.; Raanaas, R.K.; Aamodt, G. Promoting activity participation and well-being among children and adolescents: A systematic review of the determinants of the neighbourhood built environment. JBI Evid. Synth. 2020, 18, 370–458. [Google Scholar] [CrossRef]
- Ding, D.; Sallis, J.F.; Kerr, J.; Lee, S.; Rosenberg, D.E. Neighborhood environment and physical activity among young people a review. Am. J. Prev. Med. 2011, 41, 442–455. [Google Scholar] [CrossRef]
- McCrorie, P.R.W.; Fenton, C.; Ellaway, A. Combining GPS. GIS and accelerometry to explore the relationship between physical activity and the environment in children and young people: A review. Int. J. Behav. Nutr. Phys. Act. 2014, 11, 93. [Google Scholar] [CrossRef]
- Boone-Heinonen, J.; Evenson, K.R.; Song, Y.; Gordon-Larsen, P. Built and socioeconomic environments: Patterns and associations with physical activity in US adolescents. Int. J. Behav. Nutr. Phys. Act. 2010, 7, 45. [Google Scholar] [CrossRef] [PubMed]
- Kalak, N.; Lemola, S.; Brand, S.; Holsboer-Trachsler, E.; Grob, A. Sleep duration and subjective psychological well-being in adolescence: A longitudinal study in Switzerland and Norway. Neuropsychiatr. Dis. Treat. 2014, 10, 1199–1207. [Google Scholar] [CrossRef] [PubMed]
- Xu, F.; Adams, S.K.; Cohen, S.A.; Earp, J.E.; Greaney, M.L. Relationship between Physical Activity, Screen Time, and Sleep Quantity and Quality in US Adolescents Aged 16–19. Int. J. Environ. Res. Public Health 2019, 16, 1524. [Google Scholar] [CrossRef] [PubMed]
- Sanz-Martín, D.; Ubago-Jiménez, J.L.; Ruiz-Tendero, G.; Zurita-Ortega, F.; Melguizo-Ibáñez, E.; Puertas-Molero, P. The Relationships between Physical Activity, Screen Time and Sleep Time According to the Adolescents’ Sex and the Day of the Week. Healthcare 2022, 10, 1955. [Google Scholar] [CrossRef] [PubMed]
- Kline, C.E. The bidirectional relationship between exercise and sleep: Implications for exercise adherence and sleep improvement. Am. J. Lifestyle Med. 2014, 8, 375–379. [Google Scholar] [CrossRef]
- Sanz-Martín, D.; Zurita-Ortega, F.; Ruiz-Tendero, G.; Ubago-Jiménez, J.L. Moderate–Vigorous Physical Activity, Screen Time and Sleep Time Profiles: A Cluster Analysis in Spanish Adolescents. Int. J. Environ. Res. Public Health 2023, 20, 2004. [Google Scholar] [CrossRef]
- Kronholm, E.; Puusniekka, R.; Jokela, J.; Villberg, J.; Urrila, A.S.; Paunio, T.; Välimaa, R.; Tynjälä, J. Trends in self-reported sleep problems, tiredness, and related school performance among Finnish adolescents from 1984 to 2011. J. Sleep Res. 2015, 24, 3–10. [Google Scholar] [CrossRef]
- Hansen, J.; Hanewinkel, R.; Galimov, A. Physical activity, screen time, and sleep: Do German children and adolescents meet the movement guidelines? Eur. J. Pediatr. 2022, 181, 1985–1995. [Google Scholar] [CrossRef]
- Global Burden of Disease Study 2013 Collaborators. Global Matrix 4.0. Physical activity report card scores for children and adolescents: Results and analysis from 57 countries. J. Phys. Act. Health 2022, 19, 700–728. [Google Scholar] [CrossRef]
- Sallis, J.F.; Pate, R.R. Creating the future of physical activity surveillance in the United States: Better data for better health. J. Phys. Act. Health 2021, 18, 1–5. [Google Scholar] [CrossRef]
- Pérez, L.G.; Villodres, G.C.; Sánchez, F.J.M.; Cara, E.M.S.; Molina, J.J.M. Adherencia a la Dieta Mediterránea, Actividad Física y su relación con el Nivel Socioeconómico en escolares de Primaria de la capital de Granada. Retos 2021, 41, 485–491. [Google Scholar] [CrossRef]
- Hallal, P.C.; Andersen, L.B.; Bull, F.C.; Guthold, R.; Haskell, W.; Ekelund, U. Global physical activity levels: Surveillance progress, pitfalls, and prospects. Lancet 2012, 380, 247–257. [Google Scholar] [CrossRef] [PubMed]
- Tapia-Serrano, M.A.; Sevil-Serrano, J.; Sánchez-Miguel, P.A.; López-Gil, J.F.; Tremblay, M.S.; García-Hermoso, A. Prevalence of meeting 24-hour movement guidelines from preschool to adolescence: A systematic review and meta-analysis including 387,437 participants and 23 countries. J. Sport Health Sci. 2022, 11, 427–437. [Google Scholar] [CrossRef]
- Papadopoulos, D.; Etindele-Sosso, F.A. Socioeconomic status and sleep health: A narrative synthesis of three decades of empirical research. J. Clin. Sleep Med. 2022. [Google Scholar] [CrossRef] [PubMed]
- Ke, Y.; Shi, L.; Peng, L.; Chen, S.; Hong, J.; Liu, Y. Associations between socioeconomic status and physical activity: A cross-sectional analysis of Chinese children and adolescents. Front. Psychol. 2022, 13, 904506. [Google Scholar] [CrossRef] [PubMed]
- Dennis, E.; Manza, P.; Volkow, N.D. Socioeconomic status, BMI, and brain development in children. Transl. Psychiatry 2022, 12, 33. [Google Scholar] [CrossRef]
- Tandon, P.S.; Kroshus, E.; Olsen, K.; Garrett, K.; Qu, P.; McCleery, J. Socioeconomic Inequities in youth participation in physical activity and sports. Int. J. Environ. Health Res. 2021, 18, 6946. [Google Scholar] [CrossRef]
- Stalsberg, R.; Pedersen, A.V. Effects of socioeconomic status on the physical activity in adolescents: A systematic review of the evidence. Scand. J. Med. Sci. Sport. 2010, 20, 368–383. [Google Scholar] [CrossRef]
- Gidlow, C.; Johnston, L.H.; Crone, D.; Ellis, N.; James, D. A systematic review of the association between socio-economic position and physical activity. Health Educ. J. 2006, 65, 338–367. [Google Scholar] [CrossRef]
- González-Calvo, G.; García-Monge, A.; Gerdin, G.; Pringle, R. Making the familiar strange: A narrative about Spanish children’s experiences of physical (in)activity to reconsider the ability of physical education to produce healthy citizens. Sport. Educ. Soc. 2021, 28, 227–238. [Google Scholar] [CrossRef]
- Bull, F.C.; Al-Ansari, S.S.; Biddle, S.; Borodulin, K.; Buman, M.P.; Cardon, G.; Carty, C.; Chaput, J.P.; Chastin, S.; Chou, R.; et al. World Health Organization 2020 guidelines on physical activity and sedentary behaviour. Br. J. Sport. Med. 2020, 54, 1451–1462. [Google Scholar] [CrossRef] [PubMed]
- Reilly, J.J.; Aubert, S.; Brazo-Sayavera, J.; Liu, Y.; Cagas, J.Y.; Tremblay, M.S. Surveillance to improve physical activity of children and adolescents. Bull. World Health Organ. 2022, 100, 815–824. [Google Scholar] [CrossRef] [PubMed]
- Musić-Milanović, S.; Buoncristiano, M.; Križan, H.; Rathmes, G.; Williams, J.; Hyska, J.; Duleva, V.; Zamrazilová, H.; Hejgaard, T.; Jørgensen, M.B.; et al. Socioeconomic disparities in physical activity, sedentary behavior and sleep patterns among 6-to 9-year-old children from 24 countries in the WHO European region. Obes. Rev. 2021, 22, e13209. [Google Scholar] [CrossRef]
- Gerber, M.; Lang, C.; Beckmann, J.; Degen, J.; du Randt, R.; Gall, S.; Walter, C. Associations Between Household Socioeconomic Status, Car Ownership, Physical Activity, and Cardiorespiratory Fitness in South African Primary Schoolchildren Living in Marginalized Communities. J. Phys. Act. Health 2021, 18, 883–894. [Google Scholar] [CrossRef]
- Yang-Huang, J.; van Grieken, A.; Wang, L.; Jansen, W.; Raat, H. Clustering of Sedentary Behaviours, Physical Activity, and Energy-Dense Food Intake in Six-Year-Old Children: Associations with Family Socioeconomic Status. Nutrients 2020, 12, 1722. [Google Scholar] [CrossRef] [PubMed]
- Wong, R.S.; Tung, K.T.; Chan, B.N.; Ho, F.K.; Rao, N.; Chan, K.L.; Ip, P. Early-life activities mediate the association between family socioeconomic status in early childhood and physical fitness in early adolescence. Sci. Rep. 2022, 12, 81. [Google Scholar] [CrossRef] [PubMed]
- UNICEF. How We Protect Children’s Rights with the United Nations Convention on the Rights of the Child; UNICEF: New York, NY, USA, 2022; Available online: https://www.unicef.org.uk/what-we-do/un-convention-child-rights/ (accessed on 5 February 2023).
- Nyström, C.; Barnes, J.D.; Blanchette, S.; Faulkner, G.; Leduc, G.; Riazi, N.A.; Larouche, R. Relationships between area-level socioeconomic status and urbanization with active transportation, independent mobility, outdoor time, and physical activity among Canadian children. BMC Public Health 2019, 19, 1802. [Google Scholar] [CrossRef]
- Tremblay, M.S.; Shields, M.; Laviolette, M.; Craig, C.L.; Janssen, I.; Connor-Gorber, S. Physical fitness of Canadian children and youth: Results from the 2007–2009 Canadian Health Measures Survey. Health Rep. 2010, 21, 7–20. [Google Scholar]
- Elmesmari, R.; Martin, A.; Reilly, J.J.; Paton, J.Y. Comparison of accelerometer-measured levels of physical activity and sedentary time among obese and non-obese children and adolescents: A systematic review. BMC Pediatr. 2018, 18, 106. [Google Scholar] [CrossRef]
- Bozkurt, M. Metropolitan children’s physical fitness: The relationship between overweight and obesity prevalence, socioeconomic status, urban green space access, and physical activity. Urban Urban Green 2021, 64, 127272. [Google Scholar] [CrossRef]
- Galaviz, U.Z.; González, R.V.; Arvizuo, J.G.; Meneses, E.F.E.; Samaniego, C.V.; Domínguez, I.D.J.T.; Gutiérrez, A.O. Socioeconomic status and physical activity during elementary school student recess. Rev. Bras. Med. Esporte 2021, 27, 80–83. [Google Scholar] [CrossRef]
- Peralta, L.R.; Mihrshahi, S.; Bellew, B.; Reece, L.J.; Hardy, L.L. Influence of School-Level Socioeconomic Status on Children’s Physical Activity, Fitness, and Fundamental Movement Skill Levels. J. Sch. Health 2019, 89, 460–467. [Google Scholar] [CrossRef] [PubMed]
- Duffey, K.; Barbosa, A.; Whiting, S.; Mendes, R.; Aguirre, I.Y.; Tcymbal, A.; Breda, J. Barriers and Facilitators of Physical Activity Participation in Adolescent Girls: A Systematic Review of Systematic Reviews. Front. Public Health 2021, 9, 743935. [Google Scholar] [CrossRef] [PubMed]
- Kennewell, E.; Curtis, R.G.; Maher, C.; Luddy, S.; Virgara, R. The relationships between school children’s wellbeing, socio-economic disadvantage and after-school activities: A cross-sectional study. BMC Pediatr. 2022, 22, 297. [Google Scholar] [CrossRef] [PubMed]
- Rosado, J.R.; Fernández, Á.I.; López, J.M. Evaluation of physical activity practice, dietary adherence and behaviour and its relationship with quality of life in Primary Education students. Retos 2020, 38, 129–136. [Google Scholar] [CrossRef]
- Phillips, S.M.; Summerbell, C.; Hobbs, M.; Hesketh, K.R.; Saxena, S.; Muir, C.; Hillier-Brown, F.C. A systematic review of the validity, reliability and feasibility of measurement tools used to assess physical activity and sedentary behaviour in preschool children. Int. J. Behaviour. Phys. Nutr. Act. 2021, 18, 141. [Google Scholar] [CrossRef] [PubMed]
- Cooper, A.R.; Goodman, A.; Page, A.S.; Sherar, L.B.; Esliger, D.W.; van Sluijs, E.M.; Anderson, L.B.; Anderssen, S.; Cardón, G.; Davey, R.; et al. Objectively measured physical activity and sedentary time in youth: The international children’s accelerometry database (ICAD). Int. J. Behaviour. Phys. Nutr. Act. 2015, 12, 113. [Google Scholar] [CrossRef] [PubMed]
- Pate, R.R.; Almeida, M.J.; McIver, K.L.; Pfeiffer, K.A.; Dowda, M. Validation and calibration of an accelerometer in preschool children. Obesity 2006, 14, 2000–2006. [Google Scholar] [CrossRef]
- Chandler, J.L.; Brazendale, K.; Beets, M.W.; Mealing, B.A. Classification of physical activity intensities using a wrist accelerometer in children aged 8–12 years. Pediatr. Obes. 2016, 11, 120–127. [Google Scholar] [CrossRef]
- Ley 14/2007, de 3 de julio de 2007, de Investigación Biomédica. Available online: https://www.euskadi.eus/contenidos/informacion/ceic_proyectos/es_def/adjuntos/Ley_14_2007_de_Investigacion_Biomedica.pdf (accessed on 10 December 2022).
- Editorial, E. Declaración de Helsinki de la Asociación Médica Mundial. Arbor 2008, 184, 349–352. Available online: https://arbor.revistas.csic.es/index.php/arbor/article/view/183 (accessed on 25 September 2022).
- Reglamento (UE) 2016/679, de 27 de abril de 2016, Relativo a la Protección de las Personas Físicas en lo que Respecta al Tratamiento de Datos Personales y a la Libre Circulación de Estos Datos. Available online: https://eur-lex.europa.eu/legalcontent/ES/TXT/PDF/?uri=CELEX:02016R067920160504&from=fi (accessed on 15 October 2022).
- Ley Orgánica 3/2018, de 5 de diciembre, de Protección de Datos Personales y Garantía de los Derechos Digitales. Available online: https://www.boe.es/eli/es/lo/2018/12/05/3 (accessed on 6 December 2022).
- Real Decreto 1720/2007, de 21 de diciembre, por el que se Aprueba el Reglamento de Desarrollo de la Ley Orgánica 15/1999, de 13 de diciembre, de Protección de Datos de Carácter Personal. Available online: https://www.boe.es/eli/es/rd/2007/12/21/1720 (accessed on 8 December 2022).
- Domínguez-Berjón, M.F.; Borrell, C.; Cano-Serral, G.; Esnaola, S.; Nolasco, A.; Pasarín, M.I.; Ramis, R.; Saurina, C.; Escolar-Pujolar, A. Construction of a deprivation index from census data in large Spanish cities: (MEDEA Project). Gac. Sanit. 2008, 22, 179–187. [Google Scholar] [CrossRef] [PubMed]
- Guidolin, M.; Gradisar, M. Is shortened sleep duration a risk factor for overweight and obesity during adolescence? A review of the empirical literature. Sleep Med. 2012, 13, 779–786. [Google Scholar] [CrossRef] [PubMed]
- Khan, M.K.A.; Chu, Y.L.; Kirk, S.F.L.; Veugelers, P.J. Are sleep duration and quality associated with diet quality, physical activity and body weight status? A population-based study of Canadian children. Can. J. Public Health 2015, 106, 277–282. [Google Scholar] [CrossRef] [PubMed]
- Garfield, V. The association between body mass index (BMI) and sleep duration: Where are we after nearly two decades of epidemiological research? Int. J. Environ. Res. Public Health 2019, 16, 4327. [Google Scholar] [CrossRef]
- Chen, H.; Wang, L.J.; Xin, F.; Liang, G.; Chen, Y. Associations between sleep duration, sleep quality and weight status in Chinese children and adolescents. BMC Public Health 2022, 22, 1136. [Google Scholar] [CrossRef] [PubMed]
- López-Gil, J.F.; García-Hermoso, A.; Smith, L.; Firth, J.; Trott, M.; Eumann-Mesas, A.; Jiménez-López, E.; Gutiérrez-Espinoza, H.; Tárraga-López, P.J.; Victoria-Montesinos, E. Global Proportion of Disordered Eating in Children and Adolescents: A Systematic Review and Meta-analysis. JAMA Pediatr. 2023. [Google Scholar] [CrossRef]
- Fatima, Y.; Doi, S.A.R.; Mamun, A.A. Sleep quality and obesity in young subjects: A meta-analysis. Obes. Rev. 2016, 17, 1154–1166. [Google Scholar] [CrossRef]
- Mota, J.; Vale, S. Associations between sleep quality with cardiorespiratory fitness and BMI among adolescent girls. Am. J. Hum. Biol. 2010, 22, 473–485. [Google Scholar] [CrossRef]
- Wang, J.; Adab, P.; Liu, W.J.; Chen, Y.J.; Li, B.; Lin, R.; Liu, W.; Cheng, K.K.; Pallan, M. Prevalence of adiposity and its association with sleep duration, quality, and timing among 9-12-year-old children in Guangzhou, China. J. Epidemiol. 2017, 27, 531–537. [Google Scholar] [CrossRef]
- Muthuri, S.K.; Wachira, L.J.M.; Leblanc, A.G.; Francis, C.E.; Sampson, M.; Onywera, V.O.; Tremblay, M.S. Temporal trends and correlates of physical activity, sedentary behaviour, and physical fitness among school-aged children in Sub-Saharan Africa: A systematic review. Int. J. Environ. Res. Public Health 2014, 11, 3327–3359. [Google Scholar] [CrossRef]
- Lavin, J.; Bruzzone, F.; Mamondi, V.; González, E.; Berra, S. Physical activity and sedentary behaviors of schoolchildren from Córdoba in their free time and in Physical Education class. Rev. Argent. Salud. 2015, 6, 15–21. [Google Scholar]
- Owen, K.B.; Nau, T.; Reece, L.J.; Bellew, W.; Rose, C.; Bauman, A.; Halim, N.K.; Smith, B.J. Fair play? Equity of participation in organised sport and physical activity among children and adolescents in high-income countries: A systematic review and meta-analysis. Int. J. Behav. Nutr. Phys. Act. 2022, 19, 27. [Google Scholar] [CrossRef] [PubMed]
- Heradstveit, O.; Haugland, S.; Hysing, M.; Stormmark, K.; Sivertsen, B.; Boe, T. Physical inactivity, non-participation in sports and socioeconomic status: A large population-based study among Norwegian adolescents. BMC Public Health 2020, 20, 1010. [Google Scholar] [CrossRef] [PubMed]
- Stalsberg, R.; Pedersen, A. Are Differences in Physical Activity across Socioeconomic Groups Associated with Choice of Physical Activity Variables to Report? Int. J. Environ. Res. Public Health 2018, 15, 922. [Google Scholar] [CrossRef]
- Guthold, R.; Stevens, G.; Riley, L.; Bull, F. Global trends in insufficient physical activity among adolescents: A pooled analysis of 298 population-based surveys with 1–6 million participants. Lancet 2019, 4, 23–35. [Google Scholar] [CrossRef]
- Fernández-Prieto, I.; Giné-Garriga, M.; Canet, O. Barriers and motivations perceived by adolescents in relation to physical activity. Qualitative study through focus groups. Rev. Esp. Salud. Publica 2019, 93, 1–12. [Google Scholar]
- Falese, L.; Federico, B.; Kunst, A.E.; Perelman, J.; Richter, M.; Rimpelä, A.; Lorant, V. The association between socioeconomic status and vigorous physical activity among adolescents: A cross-sectional study in six European cities. BMC Public Health 2021, 21, 866. [Google Scholar] [CrossRef] [PubMed]
- Love, R.; Adams, J.; Atkin, A.; van Sluijs, E. Socioeconomic and ethnic differences in vigorous intensity physical activity in children: A cross-sectional analysis of the UK Millennium Cohort Study. BMJ Open 2019, 9, e027627. [Google Scholar] [CrossRef]
- Tarp, J.; Child, A.; White, T.; Westgate, K.; Bugge, A.; Grøntved, A.; Wedderkopp, N.; Andersen, L.B.; Cardon, G.; Davey, R.; et al. Physical activity intensity, shift duration and markers of cardiometabolic risk in children and adolescents. Int. J. Obes. 2018, 42, 1639–1650. [Google Scholar] [CrossRef]
- Farinola, M.G.; Tuñón, I.; Laíño, F.; Marchesich, M.; Rodríguez, M.P. Socio-educational and economic profile of Argentine elite adolescent athletes. Retos 2018, 34, 172–176. [Google Scholar] [CrossRef]
- McCormack, G.R.; Giles-Corti, B.; Timperio, A.; Wood, G.; Villanueva, K. A cross-sectional study of individual, social, and constructed environmental correlates of pedometer-based physical activity among primary schools children. Int. J. Behav. Nutr. Phys. Act. 2011, 8, 30. [Google Scholar] [CrossRef] [PubMed]
- Sluijs, E.; Ekelund, U.; Crochemore-Silva, I.; Guthold, R.; Ha, A.; Lubans, D.; Oyeyemi, A.; Ding, D.; Katzmarzyk, P. Physical activity behaviours in adolescence: Current evidence and opportunities for intervention. Lancet 2020, 398, 429–442. [Google Scholar] [CrossRef] [PubMed]
- Poulain, T.; Vogel, M.; Sobek, C.; Hilbert, A.; Korner, A.; Kiess, W. Associations Between Socio-Economic Status and Child Health: Findings of a Large German Cohort Study. Int. J. Environ. Res. Public Health 2019, 16, 677. [Google Scholar] [CrossRef]
- Gasol Foundation. The Gasol Foundation and Fundación Probitas Resume Their Partnership to Promote the Second Edition of the PASOS Study; Gasol Fundation: Barcelona, Spain, 2022; Available online: https://cutt.ly/DI0o4qx (accessed on 10 January 2023).
- Nyberg, G.; Kjellenberg, K.; Fröberg, A.; Lindroos, A.K. A national survey showed low levels of physical activity in a representative sample of Swedish adolescents. Acta Paediatr. 2020, 109, 2342–2353. [Google Scholar] [CrossRef] [PubMed]
- Leech, R.M.; McNaughton, S.A.; Timperio, A. Clustering of children’s obesity-related behaviours: Associations with sociodemographic indicators. Eur. J. Clin. Nutr. 2014, 68, 623–628. [Google Scholar] [CrossRef]


| Inclusion criteria | Belong to a school centre adhering to for program at primary or secondary school levels. |
| The parents or legal guardians of the student must complete the informed consent form. | |
| Exclusion criteria | Failure to comply with any of the following conditions: negative consent by the person legally responsible for the student, failure to complete the qualitative record (daily), incorrect use of the accelerometer. |
| Disability or inability to complete the qualitative record or correctly use the accelerometer according to protocol. In the case of doubt regarding any participant, the teaching staff of the school will be involved in the decision to include or exclude. |
| SEP | Assigned Term |
|---|---|
| SEP 1 | Group 1 |
| SEP 2 | Group 2 |
| SEP 3 | Group 3 |
| SEP 4 | Group 4 |
| SEP 5 | Group 5 |
| SEP | Sex | Sleep Efficiency % | Total Bed Time (min) | Total Sleep Time (min) | WASO (min) |
|---|---|---|---|---|---|
| 1 | M (n = 120) | 87.5 ± 6.2 | 468.6 ± 82.2 | 409.1 ± 75.5 | 56.1 ± 33.0 |
| F (n = 122) | 87.2 ± 5.7 | 462.5 ± 76.0 | 401.3 ± 66.9 | 57.7 ± 28.9 | |
| 2 | M (n = 113) | 86.2 ± 6.6 | 494.3 ± 78.3 | 425.4 ± 67.2 | 65.2 ± 37.8 |
| F (n = 120) | 87.2 ± 5.8 | 481.6 ± 80.6 | 417.5 ± 61.7 | 59.7 ± 30.6 | |
| 3 | M (n = 162) | 86.5 ± 6.4 | 491.5 ± 84.4 | 421.7 ± 64.1 | 65.5 ± 35.0 |
| F (n = 147) | 86.6 ± 5.7 | 495.3 ± 85.2 | 426.8 ± 69.6 | 63.3 ± 29.7 | |
| 4 | M (n = 105) | 86.3 ± 6.6 | 489.5 ± 85.1 | 419.9 ± 71.9 | 61.8 ± 33.8 |
| F (n = 111) | 86.6 ± 7.0 | 487.9 ± 82.1 | 419.1 ± 65.6 | 60.4 ± 35.4 | |
| 5 | M (n = 66) | 87.1 ± 6.5 | 459.5 ± 77.4 | 398.5 ± 64.8 | 54.4 ± 32.4 |
| F (n = 73) | 88.6 ± 5.5 | 457.8 ± 91.0 | 404.9 ± 80.9 | 55.0 ± 28.2 |
| SEP | Sex | Sedentary (min) | Light PA (min) | Moderate PA (min) | Vigorous PA (min) | MVPA |
|---|---|---|---|---|---|---|
| 1 | M (n = 120) | 625.6 ± 202.5 | 200.8 ± 62.5 | 69.0 ± 34.3 | 8.7 ± 7.5 | 77.6 ± 40.5 |
| F (n = 122) | 614.8 ± 171.7 | 215.9 ± 54.7 * | 79.9 ± 32.1 * | 6.3 ± 4.7 | 86.2 ± 35.7 | |
| 2 | M (n = 113) | 573.4 ± 145.0 | 215.2 ± 54.2 | 81.1 ± 36.5 | 11.6 ± 9.3 *** | 92.7 ± 44.1 |
| F (n = 120) | 541.6 ± 171.4 | 216.0 ± 72.2 | 81.4 ± 36.6 | 6.9 ± 5.7 | 88.3 ± 40.6 | |
| 3 | M (n = 162) | 551.4 ± 175.6 | 212.7 ± 66.4 | 80.7 ± 40.4 | 11.1 ± 9.3 ** | 91.7 ± 48.2 |
| F (n = 147) | 542.2 ± 167.2 | 223.2 ± 63.1 | 85.8 ± 33.5 | 7.7 ± 6.1 | 93.4 ± 38.2 | |
| 4 | M (n = 105) | 556.7 ± 214.3 | 202.7 ± 76.8 | 71.8 ± 41.0 | 9.1 ± 9.3 | 81.0 ± 49.0 |
| F (n = 111) | 600.0 ± 199.2 | 210.7 ± 62.3 | 79.8 ± 36.9 | 6.7 ± 6.9 | 86.5 ± 42.3 | |
| 5 | M (n = 66) | 583.1 ± 227.1 | 201.2 ± 73.9 | 69.9 ± 37.4 | 8.1 ± 8.0 | 78.0 ± 44.2 |
| F (n = 73) | 563.1 ± 201.7 | 208.3 ± 78.3 | 77.4 ± 39.5 | 6.8 ± 5.2 | 84.3 ± 43.8 |
| School Group | SEP | Sex | BMI (kg/m2) | Sleep Efficiency (%) | Total Bed Time (min) | Total Sleep Time (min) | WASO (min) |
|---|---|---|---|---|---|---|---|
| Primary 6–12 | 1 | M (n = 59) | 18.08 ± 4.03 | 88.13 ± 5.84 2,3,4 87.82 ± 4.99 3,4 | 466.48 ± 88.8 2,3,4 448.68 ± 82.72 2,3,4 | 410.75 ± 79.43 2,3,4 392.60 ± 75.04 2,3,4 | 52.81 ± 32.53 2,3,4 54.16 ± 24.32 2,3,4 |
| F (n = 66) | 17.79 ± 2.88 | ||||||
| 2 | M (n = 62) | 17.51 ± 2.55 | 85.72 ± 6.89 1 85.52 ± 6.31 5 | 521.73 ± 81.15 1,5 508.66 ± 88.08 1,5 | 445.24 ± 67.76 1,5 432.07 ± 65.49 1 | 73.38 ± 42.63 1,5 67.98 ± 32.99 1 | |
| F (n = 58) | 17.05 ± 2.03 | ||||||
| 3 | M (n = 104) | 17.36 ± 2.64 | 84.98 ± 6.02 1,5 85.76 ± 4.99 1,5 | 515.10 ± 86.01 1,5 518.15 ± 92.22 1,5 | 434.17 ± 63.51 1,5 442.15 ± 74.84 1,5 | 74.50 ± 35.22 1,5 72.69 ± 28.77 1,5 | |
| F (n = 95) | 17.79 ± 2.80 | ||||||
| 4 | M (n = 36) | 18.55 ± 3.73 | 84.46 ± 6.08 1,5 84.16 ± 7.38 1,5 | 537.30 ± 75.49 1,5 527.41 ± 86.25 1,5 | 450.46 ± 50.27 1,5 438.11 ± 55.17 1 | 74.87 ± 32.82 1,5 76.52 ± 40.96 1,5 | |
| F (n = 38) | 16.80 ± 2.01 | ||||||
| 5 | M (n = 51) | 17.52 ± 2.63 | 86.65 ± 6.28 3,4 88.51 ± 3.80 2,3,4 | 467.38 ± 80.33 2,3,4 466.23 ± 95.62 2,3,4 | 403.54 ± 68.32 2,3,4 411.12 ± 80.76 3 | 57.38 ± 33.49 2,3,4 57.30 ± 25.19 3,4 | |
| F (n = 54) | 17.24 ± 2.79 | ||||||
| Secondary 12–17 | 1 | M (n = 59) | 20.23 ± 2.72 | 86.67 ± 6.43 | 469.80 ± 74.35 | 405.34 ± 68.82 | 60.44 ± 33.24 |
| F (n = 56) | 19.70 ± 2.46 1,4 | 86.49 ± 6.54 | 478.74 ± 64.29 3,5 | 411.49 ± 54.77 | 61.78 ± 33.34 | ||
| 2 | M (n = 51) | 20.22 ± 3.83 | 86.88 ± 6.12 | 460.97 ± 60.20 | 401.21 ± 58.65 | 55.25 ± 28.32 | |
| F (n = 62) | 20.31 ± 2.934 | 88.77 ± 4.90 | 456.34 ± 63.76 | 403.77 ± 54.97 | 56.00 ± 26.21 | ||
| 3 | M (n = 58) | 20.52 ± 3.05 | 89.10 ± 6.14 | 449.25 ± 62.44 | 399.29 ± 59.36 | 49.23 ± 28.25 | |
| F (n = 52) | 20.54 ± 2.904 | 88.12 ± 6.66 | 453.62 ± 48.36 1 | 398.83 ± 47.92 | 46.02 ± 23.01 | ||
| 4 | M (n = 69) | 20.90 ± 2.51 | 87.19 ± 6.66 | 464.49 ± 79.40 | 403.94 ± 76.51 | 55.02 ± 32.45 | |
| F (n = 73) | 21.58 ± 3.39 1,2,3,5 | 87.88 ± 6.47 | 467.30 ± 71.78 5 | 409.26 ± 68.69 | 52.05 ± 29.12 | ||
| 5 | M (n = 15) | 27.33 ± 31.26 | 88.71 ± 7.04 | 432.66 ± 61.12 | 381.40 ± 49.06 | 44.43 ± 26.88 | |
| F (n = 19) | 21.03 ± 7.31 4 | 88.91 ± 8.73 | 433.89 ± 73.23 1,4 | 387.05 ± 80.85 | 48.45 ± 35.51 |
| School Group | SEP | Sex | Sedentary (min) | Light PA (min) | Moderate PA (min) | Vigorous PA (min) | MVPA (min) |
|---|---|---|---|---|---|---|---|
| Primary 6–12 | 1 | M (n = 59) | 573.71 ± 162.45 3,4,5 | 220.16 ± 55.90 2,3,4 237.56 ± 53.97 | 88.33 ± 30.36 2,3,4 95.76 ± 31.10 | 12.46 ± 7.00 2,3,4,5 8.56 ± 4.83 | 100.80 ± 35.39 2,3,4 104.33 ± 34.52 |
| F (n = 66) | 549.66 ± 152.63 3,4 | ||||||
| 2 | M (n = 62) | 558.03 ± 160.84 3,4,5 | 234.43 ± 53.10 1,5 248.40 ± 55.25 | 101.19 ± 30.90 1,5 99.72 ± 30.67 | 15.47 ± 8.78 1,5 9.07 ± 5.09 | 116.66 ± 37.78 1,5 108.79 ± 34.18 | |
| F (n = 58) | 543.62 ± 145.12 3,4 | ||||||
| 3 | M (n = 104) | 514.76 ± 141.80 1,2,5 | 233.72 ± 58.32 1,5 231.03 ± 72.87 | 100.43 ± 31.68 1,5 94.45 ± 34.51 | 15.39 ± 8.26 1,5 9.55 ± 5.99 | 115.82 ± 37.60 1,5 104.00 ± 38.72 | |
| F (n = 95) | 481.40 ± 162.42 1,2,5 | ||||||
| 4 | M (n = 36) | 492.76 ± 83.43 1,2,5 | 252.89 ± 37.49 1,5 242.76 ± 55.11 | 105.02 ± 33.64 1,5 103.42 ± 37.64 | 17.12 ± 9.85 1,5 12.07 ± 8.48 | 122.15 ± 41.73 1,5 115.49 ± 44.08 | |
| F (n = 38) | 478.75 ± 126.03 1,2,5 | ||||||
| 5 | M (n = 51) | 624.32 ± 190.64 1,2,3,4 | 215.68 ± 59.06 2,3,4 | 77.73 ± 36.09 2,3,4 | 4.95 ± 5.98 | 87.39 ± 43.25 2,3,4 | |
| F (n = 54) | 591.02 ± 169.85 3,4 | 229.30 ± 63.57 | 89.38 ± 35.55 | 8.43 ± 4.93 | 97.81 ± 39.31 | ||
| Secondary 12–17 | 1 | M (n = 59) | 683.77 ± 223.52 2,3,4,5 | 182.44 ± 61.45 | 50.44 ± 26.49 | 4.95 ± 5.98 | 55.40 ± 30.95 |
| F (n = 56) | 691.45 ± 162.05 2,3,4,5 | 190.41 ± 43.76 | 61.22 ± 21.64 5 | 3.60 ± 2.90 | 64.82 ± 23.085 | ||
| 2 | M (n = 51) | 591.97 ± 121.95 1 | 191.77 ± 45.98 | 56.55 ± 26.63 | 6.97 ± 7.80 | 63.53 ± 32.10 | |
| F (n = 62) | 539.66 ± 193.91 1,3,4 | 185.59 ± 73.27 | 64.34 ± 33.50 5 | 4.86 ± 5.53 | 69.21 ± 36.89 5 | ||
| 3 | M (n = 58) | 617.01 ± 209.61 1,5 | 175.09 ± 63.85 | 45.21 ± 28.47 | 3.25 ± 4.86 | 48.46 ± 32.46 | |
| F (n = 52) | 653.17 ± 109.23 2,5 | 208.82 ± 35.94 | 69.88 ± 24.81 5 | 4.26 ± 4.84 | 74.15 ± 28.79 5 | ||
| 4 | M (n = 69) | 605.31 ± 249.52 1,5 | 176.48 ± 79.08 | 54.52 ± 33.24 | 4.95 ± 5.59 | 59.47 ± 37.56 | |
| F (n = 73) | 662.21 ± 201.27 2,5 | 193.93 ± 59.47 | 67.54 ± 30.10 5 | 3.87 ± 3.51 | 71.41 ± 32.595 | ||
| 5 | M (n = 15) | 442.80 ± 286.98 1,3,4 | 152.08 ± 97.56 | 43.26 ± 29.05 | 2.90 ± 3.29 | 46.17 ± 31.30 | |
| F (n = 19) | 483.87 ± 262.36 | 148.67 ± 87.01 | 43.46 ± 29.63 1,2,3,4 | 2.31 ± 2.51 | 45.78 ± 31.63 1,2,3,4 |
| School Group | SEP | Sex | BMI (kg/m2) | Sleep Efficiency (%) | Total Bed Time (min) | Total Sleep Time (min) | WASO (min) |
|---|---|---|---|---|---|---|---|
| Public school | 1 | M (n = 34) | 18.82 ± 4.23 4 | 89.75 ± 5.13 2,3,4 87.93 ± 6.42 | 469.61 ± 87.17 3 439.17 ± 78.13 2,3,4 | 424.84 ± 91.40 3 383.99 ± 75.66 2,3,4 | 41.16 ± 20.59 2,3,4 53.61 ± 30.18 3 |
| F (n = 36) | 18.57 ± 2.88 | ||||||
| 2 | M (n = 74) | 19.01 ± 3.64 4 | 85.26 ± 6.52 1 87.09 ± 6.05 5 | 489.37 ± 81.47 3,5 478.33 ± 84.57 1,3 | 415.25 ± 62.38 3,5 413.34 ± 61.03 1,3 | 65.77 ± 36.15 1,3,5 60.29 ± 37.71 3,5 | |
| F (n = 84) | 19.40 ± 3.10 | ||||||
| 3 | M (n = 77) | 18.13 ± 2.86 4 | 84.72 ± 5.96 1 86.19 ± 5.14 4,5 | 538.12 ± 62.38 1,2,4,5 540.52 ± 61.65 1,2,4,5 | 453.27 ± 50.031 1,2,4,5 464.34 ± 50.28 1,2,4,5 | 78.08 ± 32.80 1,2,4,5 71.17 ± 28.01 1,2,4,5 | |
| F (n = 71) | 18.96 ± 3.10 | ||||||
| 4 | M (n = 68) | 20.26 ± 2.85 1,2,3,5 | 86.48 ± 7.08 1 87.27 ± 7.65 3 | 483.54 ± 90.31 3 481.13 ± 88.93 1,3 | 416.28 ± 79.87 3,5 416.78 ± 73.65 1,3 | 58.84 ± 35.02 1,3 56.86 ± 38.30 3 | |
| F (n = 69) | 20.27 ± 4.00 | ||||||
| 5 | M (n = 30) | 18.37 ± 3.22 4 | 86.36 ± 7.15 2,3 | 443.10 ± 70.92 3,5 | 381.38 ± 61.50 2,3,4 | 47.69 ± 23.71 2,3 | |
| F (n = 29) | 18.71 ± 3.24 | 89.80 ± 6.45 | 449.72 ± 85.72 3 | 404.26 ± 88.86 3 | 47.85 ± 28.27 2,3 | ||
| Private school | 1 | M (n = 86) | 19.24 ± 3.29 | 86.57 ± 6.31 | 468.24 ± 80.73 2,4 | 402.85 ± 67.86 2,4 | 62.06 ± 35.08 |
| F (n = 86) | 18.71 ± 2.86 2,5 | 86.91 ± 5.48 | 472.23 ± 73.41 | 408.51 ± 61.96 | 59.35 ± 28.41 | ||
| 2 | M (n = 39) | 18.21 ± 3.05 | 88.12 ± 6.29 | 503.68 ± 71.89 1,4 | 444.57 ± 72.60 1,4 | 64.11 ± 41.26 | |
| F (n = 36) | 17.17 ± 2.07 1,3,4 | 87.46 ± 5.36 | 489.31 ± 70.82 3 | 427.03 ± 63.01 3 | 58.39 ± 28.32 | ||
| 3 | M (n = 85) | 18.82 ± 3.42 | 88.02 ± 6.34 | 449.31 ± 79.52 2,4 | 393.07 ± 62.20 2,4 | 54.01 ± 33.08 | |
| F (n = 76) | 18.58 ± 3.15 2,5 | 86.97 ± 6.23 | 453.10 ± 82.64 2,4 | 391.78 ± 66.98 | 55.86 ± 29.48 | ||
| 4 | M (n = 37) | 19.78 ± 3.71 | 85.84 ± 5.60 | 500.33 ± 74.60 1,3 | 426.52 ± 54.73 1,3 | 67.31 ± 31.07 | |
| F (n = 42) | 19.41 ± 3.26 2,5 | 85.52 ± 5.66 | 498.96 ± 68.96 3 | 423.00 ± 50.16 3 | 66.30 ± 29.64 | ||
| 5 | M (n = 36) | 20.90 ± 2.51 | 87.76 ± 5.85 | 473.15 ± 80.76 | 412.79 ± 64.79 | 60.05 ± 37.54 | |
| F (n = 44) | 17.91 ± 5.43 1,3,4 | 87.84 ± 4.60 | 463.15 ± 94.86 | 405.24 ± 76.30 | 59.71 ± 27.53 |
| School Group | SEP | Sex | Sedentary (min) | Light PA (min) | Moderate PA (min) | Vigorous PA (min) | MVPA (min) |
|---|---|---|---|---|---|---|---|
| Public school | 1 | M (n = 34) | 562.82 ± 154.26 5 | 203.96 ± 61.60 241.30 ± 34.40 2,4 | 76.70 ± 34.76 97.25 ± 23.52 2,4 | 10.23 ± 6.90 4 8.43 ± 4.34 2,4 | 86.94 ± 40.88 105.69 ± 26.28 2,4 |
| F (n = 36) | 570.17 ± 115.09 4 | ||||||
| 2 | M (n = 74) | 594.88 ± 150.42 5 | 206.68 ± 54.51 201.38 ± 78.51 1,3 | 73.52 ± 37.49 76.77 ± 39.61 1,3,4 | 10.66 ± 9.59 4 6.55 ± 6.27 1,3 | 84.18 ± 45.34 83.33 ± 44.13 1,3 | |
| F (n = 84) | 538.20 ± 198.80 4,5 | ||||||
| 3 | M (n = 77) | 557.12 ± 179.43 2 | 218.92 ± 59.93 231.57 ± 56.74 2,4 | 82.65 ± 38.08 92.68 ± 31.53 2 | 12.47 ± 9.82 4 8.95 ± 6.38 2,4 | 95.12 ± 46.51 101.63 ± 35.98 2,4 | |
| F (n = 71) | 549.06 ± 160.89 4 | ||||||
| 4 | M (n = 68) | 580.01 ± 225.52 5 | 198.21 ± 79.67 203.51 ± 64.52 1,3,5 | 66.77 ± 38.85 74.92 ± 34.71 1,3 | 6.98 ± 6.97 1,2,3 5.55 ± 5.21 1,3 | 73.76 ± 44.79 80.47 ± 38.95 1,3 | |
| F (n = 69) | 632.72 ± 213.89 1,2,3,5 | ||||||
| 5 | M (n = 30) | 443.90 ± 216.89 1,2,3,4 | 190.69 ± 91.38 | 71.69 ± 46.12 | 9.77 ± 9.94 | 81.46 ± 54.79 | |
| F (n = 29) | 494.79 ± 155.67 2,4 | 221.45 ± 76.60 4 | 82.76 ± 37.83 | 7.04 ± 4.64 | 89.80 ± 41.66 | ||
| Private school | 1 | M (n = 86) | 650.37 ± 214.46 2,3,4 | 199.48 ± 63.22 2 | 65.90 ± 33.83 2,3 | 8.04 ± 7.63 2,4 | 73.94 ± 40.03 2,3,4 |
| F (n = 86) | 633.40 ± 187.95 2,3,4 | 205.29 ± 58.18 2 | 72.64 ± 32.55 2,4 | 5.38 ± 4.64 | 78.03 ± 36.05 2,4 | ||
| 2 | M (n = 39) | 532.49 ± 125.95 1,5 | 231.31 ± 50.33 1,3 | 95.32 ± 30.21 1,3,5 | 13.49 ± 8.65 1,3,4,5 | 108.81 ± 36.98 1,3,4,5 | |
| F (n = 36) | 549.45 ± 76.56 1,5 | 249.94 ± 37.28 1,3,4,5 | 92.33 ± 25.78 1,3,5 | 7.70 ± 4.08 | 100.03 ± 28.25 1,3,5 | ||
| 3 | M (n = 85) | 546.16 ± 172.96 1,5 | 207.13 ± 71.73 2 | 78.85 ± 42.58 1,2 | 9.76 ± 8.62 2 | 88.61 ± 49.83 1,2 | |
| F (n = 76) | 535.72 ± 173.64 1,5 | 215.33 ± 67.97 2 | 79.29 ± 34.15 2 | 6.49 ± 5.69 | 85.79 ± 38.872 | ||
| 4 | M (n = 37) | 542.29 ± 192.60 1,5 | 210.88 ± 71.40 | 81.14 ± 43.78 | 13.06 ± 11.65 1,5 | 94.20 ± 54.11 1 | |
| F (n = 42) | 548.16 ± 161.27 1,5 | 222.39 ± 57.21 2 | 87.88 ± 39.35 1 | 8.53 ± 8.75 | 96.41 ± 46.09 1 | ||
| 5 | M (n = 36) | 699.04 ± 162.36 2,3,4 | 210.00 ± 55.11 | 68.40 ± 28.70 2 | 6.74 ± 5.81 2,4 | 75.15 ± 33.47 2 | |
| F (n = 44) | 608.17 ± 217.07 2,3,4 | 199.65 ± 79.12 2 | 73.91 ± 40.62 2 | 6.70 ± 5.55 | 80.62 ± 45.20 2 |
| Medea | BMI (kg/m2) | Sleep Efficiency (%) | Total Bed Time (min) | Total Sleep Time (min) | WASO (min) | Sedentary | Light PA (min) | Moderate PA (min) | Vigorous PA (min) | MVPA (min) | |
|---|---|---|---|---|---|---|---|---|---|---|---|
| Medea | 1 | ||||||||||
| BMI (kg/m2) | 0.00 | 1 | |||||||||
| Sleep Efficiency (%) | 0.00 | 0.15 ** | 1 | ||||||||
| Total bed time (min) | 0.02 | −0.16 ** | −0.38 ** | 1 | |||||||
| Total sleep time (min) | 0.02 | −0.12 ** | 0.00 | 0.90 ** | 1 | ||||||
| WASO (min) | −0.00 | −0.16 ** | −0.81 ** | 0.53 ** | 0.22 ** | 1 | |||||
| Sedentary | −0.04 | 0.22 ** | 0.02 | −0.16 ** | −0.16 ** | −0.06 * | 1 | ||||
| Light PA (min) | 0.01 | −0.30 ** | −0.24 ** | 0.21 ** | 0.13 ** | 0.27 ** | −0.30 ** | 1 | |||
| Moderate PA (min) | 0.00 | −0.39 ** | −0.23 ** | 0.25 ** | 0.19 ** | 0.26 ** | −0.38 ** | 0.82 ** | 1 | ||
| Vigorous PA (min) | −0.02 | −0.40 ** | −0.20 ** | 0.26 ** | 0.21 ** | 0.24 ** | −0.30 ** | 0.59 ** | 0.80 ** | 1 | |
| MVPA (min) | −0.00 | −0.41 ** | −0.23 ** | 0.26 ** | 0.20 ** | 0.26 ** | −0.39 ** | 0.80 ** | 0.99 ** | 0.86 ** | 1 |
Disclaimer/Publisher’s Note: The statements, opinions and data contained in all publications are solely those of the individual author(s) and contributor(s) and not of MDPI and/or the editor(s). MDPI and/or the editor(s) disclaim responsibility for any injury to people or property resulting from any ideas, methods, instructions or products referred to in the content. |
© 2023 by the authors. Licensee MDPI, Basel, Switzerland. This article is an open access article distributed under the terms and conditions of the Creative Commons Attribution (CC BY) license (https://creativecommons.org/licenses/by/4.0/).
Share and Cite
Larrinaga-Undabarrena, A.; Río, X.; Sáez, I.; Martinez Aguirre-Betolaza, A.; Albisua, N.; Martínez de Lahidalga Aguirre, G.; Sánchez Isla, J.R.; Urbano, M.; Guerra-Balic, M.; Fernández, J.R.; et al. Effects of Socioeconomic Environment on Physical Activity Levels and Sleep Quality in Basque Schoolchildren. Children 2023, 10, 551. https://doi.org/10.3390/children10030551
Larrinaga-Undabarrena A, Río X, Sáez I, Martinez Aguirre-Betolaza A, Albisua N, Martínez de Lahidalga Aguirre G, Sánchez Isla JR, Urbano M, Guerra-Balic M, Fernández JR, et al. Effects of Socioeconomic Environment on Physical Activity Levels and Sleep Quality in Basque Schoolchildren. Children. 2023; 10(3):551. https://doi.org/10.3390/children10030551
Chicago/Turabian StyleLarrinaga-Undabarrena, Arkaitz, Xabier Río, Iker Sáez, Aitor Martinez Aguirre-Betolaza, Neritzel Albisua, Gorka Martínez de Lahidalga Aguirre, José Ramón Sánchez Isla, Mikel Urbano, Myriam Guerra-Balic, Juan Ramón Fernández, and et al. 2023. "Effects of Socioeconomic Environment on Physical Activity Levels and Sleep Quality in Basque Schoolchildren" Children 10, no. 3: 551. https://doi.org/10.3390/children10030551
APA StyleLarrinaga-Undabarrena, A., Río, X., Sáez, I., Martinez Aguirre-Betolaza, A., Albisua, N., Martínez de Lahidalga Aguirre, G., Sánchez Isla, J. R., Urbano, M., Guerra-Balic, M., Fernández, J. R., & Coca, A. (2023). Effects of Socioeconomic Environment on Physical Activity Levels and Sleep Quality in Basque Schoolchildren. Children, 10(3), 551. https://doi.org/10.3390/children10030551