
Lifestyle Behaviours, Self-Esteem and Academic Performance in Primary Education Students—A Structural Equation Model According to Sex and School Type
 ,
,  , and
, and 
Abstract
:
1. Introduction
2. Materials and Methods
2.1. Design and Participants
2.2. Instruments
2.3. Procedure
2.4. Data Analysis
3. Results
4. Discussion
Limitations and Future Perspectives
5. Conclusions
Author Contributions
Funding
Institutional Review Board Statement
Informed Consent Statement
Data Availability Statement
Acknowledgments
Conflicts of Interest
References
- Serra-Majem, L.; Ortiz-Andrellucchi, A. The Mediterranean diet as an example of food and nutrition sustainability: A multidisciplinary approach. Nutr. Hosp. 2018, 35, 96–101. [Google Scholar] [PubMed]
- Physical Activity. Available online: https://www.who.int/news-room/fact-sheets/detail/physical-activity (accessed on 24 September 2023).
- Pasos Study. Available online: https://gasolfoundation.org/es/estudio-o+pasos/ (accessed on 24 September 2023).
- Warburton, D.E.R.; Bredin, S.S.D. Health benefits of physical activity: A systematic review of current systematic reviews. Curr. Opin. Cardiol. 2017, 32, 541. [Google Scholar] [CrossRef] [PubMed]
- Neil-Sztramko, S.E.; Caldwell, H.; Dobbins, M. School-based physical activity programs for promoting physical activity and fitness in children and adolescents aged 6 to 18. Cochrane Database Syst. Rev. 2021, 2013, CD007651. [Google Scholar]
- Liu, M.; Wu, L.; Ming, Q. How Does Physical Activity Intervention Improve Self-Esteem and Self-Concept in Children and Adolescents? Evidence from a Meta-Analysis. PLoS ONE 2015, 10, e0134804. [Google Scholar] [CrossRef] [PubMed]
- Ardoy, D.N.; Fernández-Rodríguez, J.M.; Jiménez-Pavón, D.; Castillo, R.; Ruiz, J.R.; Ortega, F.B. A physical education trial improves adolescents’ cognitive performance and academic achievement: The EDUFIT study. Scand. J. Med. Sci. Sports 2014, 24, e52–e61. [Google Scholar] [CrossRef] [PubMed]
- Depboylu, G.Y.; Kaner, G. Younger age, higher father education level, and healthy lifestyle behaviors are associated with higher adherence to the Mediterranean diet in school-aged children. Nutrition 2023, 114, 112166. [Google Scholar] [CrossRef] [PubMed]
- López-Gil, J.F.; Brazo-Sayavera, J.; García-Hermoso, A.; Yuste Lucas, J.L. Adherence to Mediterranean Diet Related with Physical Fitness and Physical Activity in Schoolchildren Aged 6-13. Nutrients 2020, 12, 567. [Google Scholar] [CrossRef]
- Willett, W.C.; Sacks, F.; Trichopoulou, A.; Drescher, G.; Ferro-Luzzi, A.; Helsing, E.; Trichopoulos, D. Mediterranean diet pyramid: A cultural model for healthy eating. Am. J. Clin. Nutr. 1995, 61, 1402S–1406S. [Google Scholar] [CrossRef]
- Donini, L.M.; Serra-Majem, L.; Bulló, M.; Gil, Á.; Salas-Salvadó, J. The Mediterranean diet: Culture, health and science. Br. J. Nutr. 2015, 113, S1–S3. [Google Scholar] [CrossRef]
- Lassale, C.; Fitó, M.; Morales-Suárez-Varela, M.; Moya, A.; Gómez, S.F.; Schröder, H. Mediterranean diet and adiposity in children and adolescents: A systematic review. Obes. Rev. 2022, 23, e13381. [Google Scholar] [CrossRef]
- Juton, C.; Berruezo, P.; Rajmil, L.; Lerin, C.; Fíto, M.; Homs, C.; Según, G.; Gómez, S.F.; Schröder, H. Prospective Association between Adherence to the Mediterranean Diet and Health-Related Quality of Life in Spanish Children. Nutrients 2022, 14, 5304. [Google Scholar] [CrossRef] [PubMed]
- San Mauro-Martin, I.; Sanz-Rojo, S.; Garicano-Vilar, E.; González-Cosano, L.; Conty-de la Campa, R.; Blumenfeld-Olivares, J.A. Lifestyle factors, diet and attention-deficit/hyperactivity disorder in Spanish children—An observational study. Nutr. Neurosci. 2021, 24, 614–623. [Google Scholar] [CrossRef] [PubMed]
- Ministerio de Sanidad—Profesionales—Resultados del Estudio: La Adolescencia en España: Salud, Bienestar, Familia, Vida Académica y Social. Available online: https://www.sanidad.gob.es/areas/promocionPrevencion/entornosSaludables/escuela/estudioHBSC/2018/resultados.htm (accessed on 18 October 2023).
- Masini, A.; Sanmarchi, F.; Kawalec, A.; Esposito, F.; Scrimaglia, S.; Tessari, A.; Scheier, L.M.; Sacchetti, R.; Dallolio, L. Mediterranean diet, physical activity, and family characteristics associated with cognitive performance in Italian primary school children: Analysis of the I-MOVE project. Eur. J. Pediatr. 2023, 182, 917–927. [Google Scholar] [CrossRef] [PubMed]
- Vassiloudis, I.; Yiannakouris, N.; Panagiotakos, D.B.; Apostolopoulos, K.; Costarelli, V. Academic performance in relation to adherence to the Mediterranean diet and energy balance behaviors in Greek primary schoolchildren. J. Nutr. Educ. Behav. 2014, 46, 164–170. [Google Scholar] [CrossRef] [PubMed]
- Black, M.M.; Fernandez-Rao, S.; Nair, K.M.; Balakrishna, N.; Tilton, N.; Radhakrishna, K.V.; Ravinder, P.; Harding, K.B.; Reinhart, G.; Yimgang, D.P.; et al. A Randomized Multiple Micronutrient Powder Point-of-Use Fortification Trial Implemented in Indian Preschools Increases Expressive Language and Reduces Anemia and Iron Deficiency. J. Nutr. 2021, 151, 2029–2042. [Google Scholar] [CrossRef] [PubMed]
- Ludyga, S.; Gerber, M.; Herrmann, C.; Brand, S.; Pühse, U. Chronic effects of exercise implemented during school-break time on neurophysiological indices of inhibitory control in adolescents. Trends Neurosci. Educ. 2018, 10, 1–7. [Google Scholar] [CrossRef]
- Rasberry, C.N.; Lee, S.M.; Robin, L.; Laris, B.A.; Russell, L.A.; Coyle, K.K.; Nihiser, A.J. The association between school-based physical activity, including physical education, and academic performance: A systematic review of the literature. Prev. Med. 2011, 52, S10–S20. [Google Scholar] [CrossRef] [PubMed]
- Martinsen, K.D.; Rasmussen, L.M.P.; Wentzel-Larsen, T.; Holen, S.; Sund, A.M.; Pedersen, M.L.; Løvaas, M.E.S.; Patras, J.; Adolfsen, F.; Neumer, S.-P. Change in quality of life and self-esteem in a randomized controlled CBT study for anxious and sad children: Can targeting anxious and depressive symptoms improve functional domains in schoolchildren? BMC Psychol. 2021, 9, 8. [Google Scholar] [CrossRef]
- O’Brien, E.J.; Bartoletti, M.; Leitzel, J.D. Self-Esteem, Psychopathology, and Psychotherapy. In Self-Esteem Issues and Answers: A Sourcebook of Current Perspectives; Psychology Press: New York, NY, USA, 2006; pp. 306–315. [Google Scholar]
- Villodres, G.C.; García-Pérez, L.; Corpas, J.M.; Muros, J.J. Influence of Confinement Due to COVID-19 on Physical Activity and Mediterranean Diet Adherence and Its Relationship with Self-Esteem in Pre-Adolescent Students. Children 2021, 8, 848. [Google Scholar] [CrossRef]
- Salway, R.; Foster, C.; de Vocht, F.; Tibbitts, B.; Emm-Collison, L.; House, D.; Williams, J.G.; Breheny, K.; Reid, T.; Walker, R.; et al. Accelerometer-measured physical activity and sedentary time among children and their parents in the UK before and after COVID-19 lockdowns: A natural experiment. Int. J. Behav. Nutr. Phys. Act. 2022, 19, 51. [Google Scholar] [CrossRef]
- Schlund, A.; Reimers, A.K.; Bucksch, J.; Brindley, C.; Schulze, C.; Puil, L.; Coen, S.E.; Phillips, S.P.; Knapp, G.; Demetriou, Y. Do Intervention Studies to Promote Physical Activity and Reduce Sedentary Behavior in Children and Adolescents Take Sex/Gender Into Account? A Systematic Review. J. Phys. Act. Health 2021, 18, 461–468. [Google Scholar] [CrossRef] [PubMed]
- Muñiz, M.; Suárez-Pandiello, J. Educación en valores y competencias sociales: Diferencias (o no) entre institutos públicos y colegios concertados. Investig. Econ. Educ. 2011, 6, 208–222. [Google Scholar]
- Crocker, P.R.; Bailey, D.A.; Faulkner, R.A.; Kowalski, K.C.; McGrath, R. Measuring general levels of physical activity: Preliminary evidence for the Physical Activity Questionnaire for Older Children. Med. Sci. Sports Exerc. 1997, 29, 1344–1349. [Google Scholar] [CrossRef]
- Manchola-González, J.; Bagur-Calafat, C.; Girabent-Farrés, M. Fiabilidad de la versión española del Cuestionario de actividad física PAQ-C/Reliability of the Spanish Version of Questionnaire of Physical Activity PAQ-C. Rev. Int. Med. Cienc. Act. Física Deporte 2017, 6. [Google Scholar] [CrossRef]
- Léger, L.A.; Mercier, D.; Gadoury, C.; Lambert, J. The multistage 20 metre shuttle run test for aerobic fitness. J. Sports Sci. 1988, 6, 93–101. [Google Scholar] [CrossRef] [PubMed]
- Altavilla, C.; Comeche-Guijarro, J.M.; Comino, I.; Caballero, P. El Índice de Calidad de la Dieta Mediterránea en la Infancia y la Adolescencia (KIDMED). Propuesta de Actualización para Países Hispanohablantes. Spanish Update of the KIDMED Questionnaire, a Mediterranean Diet Quality Index in Children and Adolescents; Ministerio de Sanidad, Consumo y Bienestar Social (España): Madrid, Spain, 2020; Volume 94, pp. e1–e8.
- Serra-Majem, L.; Ribas, L.; Ngo, J.; Ortega, R.M.; García, A.; Pérez-Rodrigo, C.; Aranceta, J. Food, youth and the Mediterranean diet in Spain. Development of KIDMED, Mediterranean Diet Quality Index in children and adolescents. Public Health Nutr. 2004, 7, 931–935. [Google Scholar] [CrossRef] [PubMed]
- Rosenberg, M. Society and the Adolescent Self-Image. In Society and the Adolescent Self-Image; Princeton University Press: Princeton, NJ, USA, 2015. [Google Scholar]
- Atienza, F.L. Análisis de la dimensionalidad de la escala de autoestima de Rosenberg en una muestra de adolescentes valencianos. Rev. Psicol. Univ. Tarracon. 2000, 22, 29–42. [Google Scholar]
- Currie, C.E.; Elton, R.A.; Todd, J.; Platt, S. Indicators of socioeconomic status for adolescents: The WHO Health Behaviour in School-aged Children Survey. Health Educ. Res. 1997, 12, 385–397. [Google Scholar] [CrossRef]
- Hobza, V.; Hamrik, Z.; Bucksch, J.; De Clercq, B. The Family Affluence Scale as an Indicator for Socioeconomic Status: Validation on Regional Income Differences in the Czech Republic. Int. J. Environ. Res. Public Health 2017, 14, 1540. [Google Scholar] [CrossRef]
- Moreno-Maldonado, C.; Moreno, C.; Rivera, F. Indicadores para detectar y evaluar el impacto de las desigualdades socioeconómicas en los estilos de vida y la salud de los adolescentes españoles. Apunt. Psicol. 2016, 34, 177–188. [Google Scholar] [CrossRef]
- Byrne, B.M. Structural Equation Modeling With AMOS: Basic Concepts, Applications, and Programming, 3rd ed.; Routledge: New York, NY, USA, 2016; p. 460. [Google Scholar]
- González, N.F.; Rivas, A.D. Actividad física y ejercicio en la mujer. Rev. Colomb. Cardiol. 2018, 25, 125–131. [Google Scholar] [CrossRef]
- Ciria, L.F.; Román-Caballero, R.; Vadillo, M.A.; Holgado, D.; Luque-Casado, A.; Perakakis, P.; Sanabria, D. An umbrella review of randomized control trials on the effects of physical exercise on cognition. Nat. Hum. Behav. 2023, 7, 928–941. [Google Scholar] [CrossRef] [PubMed]
- Esteban-Cornejo, I.; Izquierdo-Gomez, R.; Gómez-Martínez, S.; Padilla-Moledo, C.; Castro-Piñero, J.; Marcos, A.; Marcos, A.; Veiga, O.L. Adherence to the Mediterranean diet and academic performance in youth: The UP&DOWN study. Eur. J. Nutr. 2016, 55, 1133–1140. [Google Scholar] [PubMed]
- Ammar, A.; Trabelsi, K.; Boukhris, O.; Bouaziz, B.; Müller, P.; Glenn, J.M.; Bott, N.T.; Müller, N.; Chtourou, H.; Driss, T.; et al. Effects of Polyphenol-Rich Interventions on Cognition and Brain Health in Healthy Young and Middle-Aged Adults: Systematic Review and Meta-Analysis. J. Clin. Med. 2020, 9, 1598. [Google Scholar] [CrossRef]
- Brainard, J.S.; Jimoh, O.F.; Deane, K.H.O.; Biswas, P.; Donaldson, D.; Maas, K.; Abdelhamid, A.S.; Hooper, L.; PUFAH group. Omega-3, Omega-6, and Polyunsaturated Fat for Cognition: Systematic Review and Meta-analysis of Randomized Trials. J. Am. Med. Dir. Assoc. 2020, 21, 1439–1450. [Google Scholar] [CrossRef] [PubMed]
- Rutjes, A.W.; Denton, D.A.; Nisio, M.D.; Chong, L.Y.; Abraham, R.P.; Al-Assaf, A.S.; Anderson, J.L.; Malik, M.A.; Vernooij, R.W.; Martínez, G.; et al. Vitamin and mineral supplementation for maintaining cognitive function in cognitively healthy people in mid and late life. Cochrane Database Syst. Rev. 2018, 12, CD011906. [Google Scholar] [CrossRef]
- Bergier, J.; Niźnikowska, E.; Bergier, B.; Acs, P.; Salonna, F.; Junger, J. Differences in physical activity, nutritional behaviours, and body silhouette concern among boys and girls from selected european countries. Hum. Mov. 2018, 18, 19–28. [Google Scholar] [CrossRef]
- Castro, M.; Ríos-Reina, R.; Ubeda, C.; Callejón, R.M. Evaluación de menús ofertados en comedores escolares: Comparación entre colegios públicos, privados y concertados. Rev. Nutr. 2016, 29, 97–108. [Google Scholar] [CrossRef]
- Constandt, B.; Thibaut, E.; De Bosscher, V.; Scheerder, J.; Ricour, M.; Willem, A. Exercising in Times of Lockdown: An Analysis of the Impact of COVID-19 on Levels and Patterns of Exercise among Adults in Belgium. Int. J. Environ. Res. Public Health 2020, 17, 4144. [Google Scholar] [CrossRef]
- Rogero-García, J.; Candelas, M.A. Representaciones sociales de los padres y madres sobre la educación pública y privada en España. Rev. Sociol. Educ.-RASE 2016, 9, 46–58. [Google Scholar]
- Sahli, H.; Ouerghi, N.; Jebabli, N.; Amara, S.; Sahli, F.; Makram, Z. Effects of Verbal Encouragements on Selected Measures of Physical Fitness and Subjective Effort Perception in Young High School Students. Int. J. Sport. Stud. Health 2022, 4, e122590. [Google Scholar] [CrossRef]
- Braun-Trocchio, R.; Williams, A.; Harrison, K.; Warfield, E.; Renteria, J. The Effects of Heart Rate Monitoring on Ratings of Perceived Exertion and Attention Allocation in Individuals of Varying Fitness Levels. Front. Sports Act. Living 2021, 3, 798941. [Google Scholar] [CrossRef]


| Characteristics | n | % | PA | p | ST | p | MD | p | VO2max | p | SE | p | AP | p | |
|---|---|---|---|---|---|---|---|---|---|---|---|---|---|---|---|
| Total | 269 | 100 | 3.49 ± 0.88 | 2.31 ± 1.54 | 6.43 ± 2.74 | 39.79 ± 6.46 | 30.48 ± 5.99 | 7.85 ± 1.21 | |||||||
| Sex | Boys | 144 | 53.5 | 3.65 ± 0.90 | <0.001 | 2.39 ± 1.66 | 0.628 | 6.41 ± 2.74 | 0.820 | 41.82 ± 6.37 | <0.001 | 30.94 ± 5.55 | 0.280 | 7.77 ± 1.22 | <0.001 |
| Girls | 125 | 46.5 | 3.29 ± 0.82 | 2.21 ± 1.39 | 6.43 ± 2.74 | 37.45 ± 5.74 | 29.94 ± 6.43 | 8.15 ± 1.16 | |||||||
| School Type | SS | 114 | 42.4 | 3.17 ± 0.85 | <0.001 | 1.82 ± 1.51 | <0.001 | 7.12 ± 2.51 | <0.001 | 40.27 ± 6.73 | 0.684 | 30.04 ± 6.83 | 0.733 | 8.21 ± 1.20 | <0.001 |
| MFS | 155 | 57.6 | 3.72 ± 0.82 | 2.68 ± 1.46 | 5.92 ± 2.8 | 39.43 ± 6.51 | 30.81 ± 5.28 | 7.75 ± 1.8 | |||||||
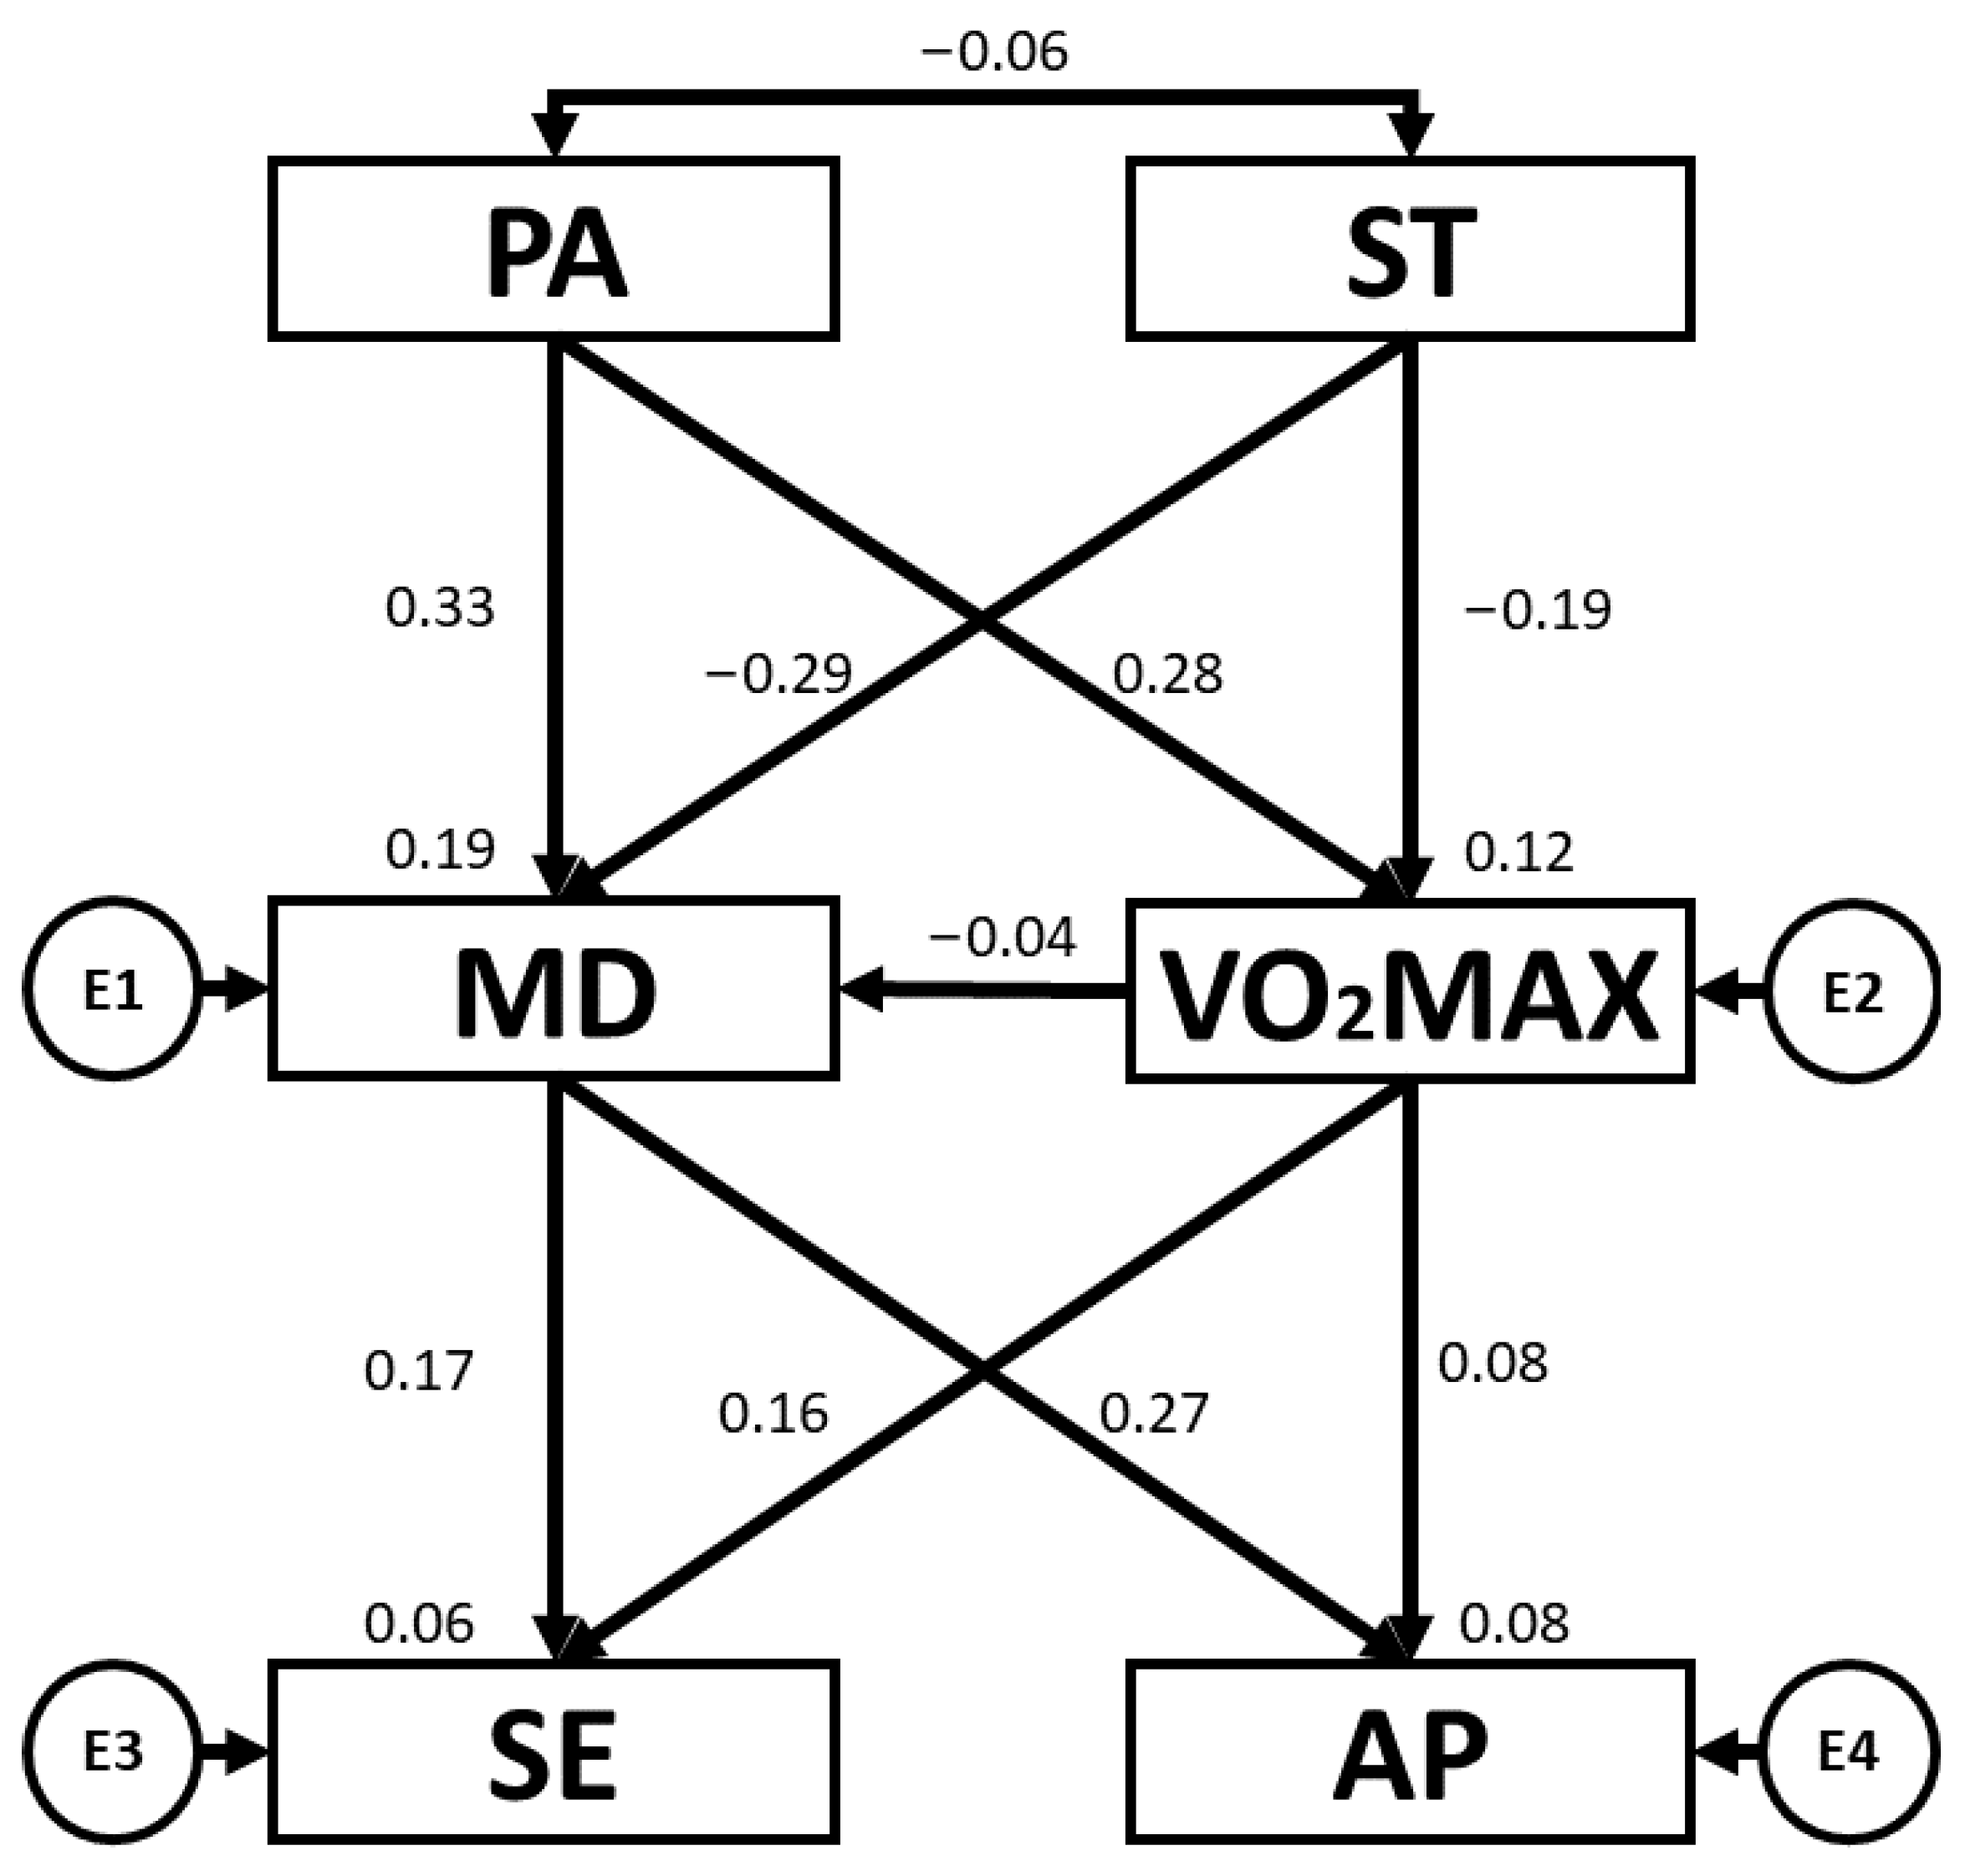
| Association between Variables | RW | SRW | |||||
|---|---|---|---|---|---|---|---|
| Estimation | SE | CR | p | Estimation | |||
| VO2max | ← | PA | 2.043 | 0.423 | 4.831 | *** | 0.278 |
| VO2max | ← | ST | −0.788 | 0.240 | −3.276 | 0.001 | −0.188 |
| MD | ← | PA | 1.016 | 0.180 | 5.655 | *** | 0.325 |
| MD | ← | VO2max | −0.016 | 0.025 | −0.642 | 0.521 | −0.038 |
| MD | ← | ST | −0.512 | 0.100 | −5.118 | *** | −0.288 |
| AP | ← | MD | 0.120 | 0.026 | 4.632 | *** | 0.272 |
| SE | ← | MD | 0.376 | 0.130 | 2.898 | 0.004 | 0.173 |
| SE | ← | VO2max | 0.150 | 0.055 | 2.726 | 0.006 | 0.162 |
| AP | ← | VO2max | 0.014 | 0.011 | 1.290 | 0.197 | 0.076 |
| PA | ↔ | ST | −0.080 | 0.082 | −0.976 | 0.329 | −0.060 |
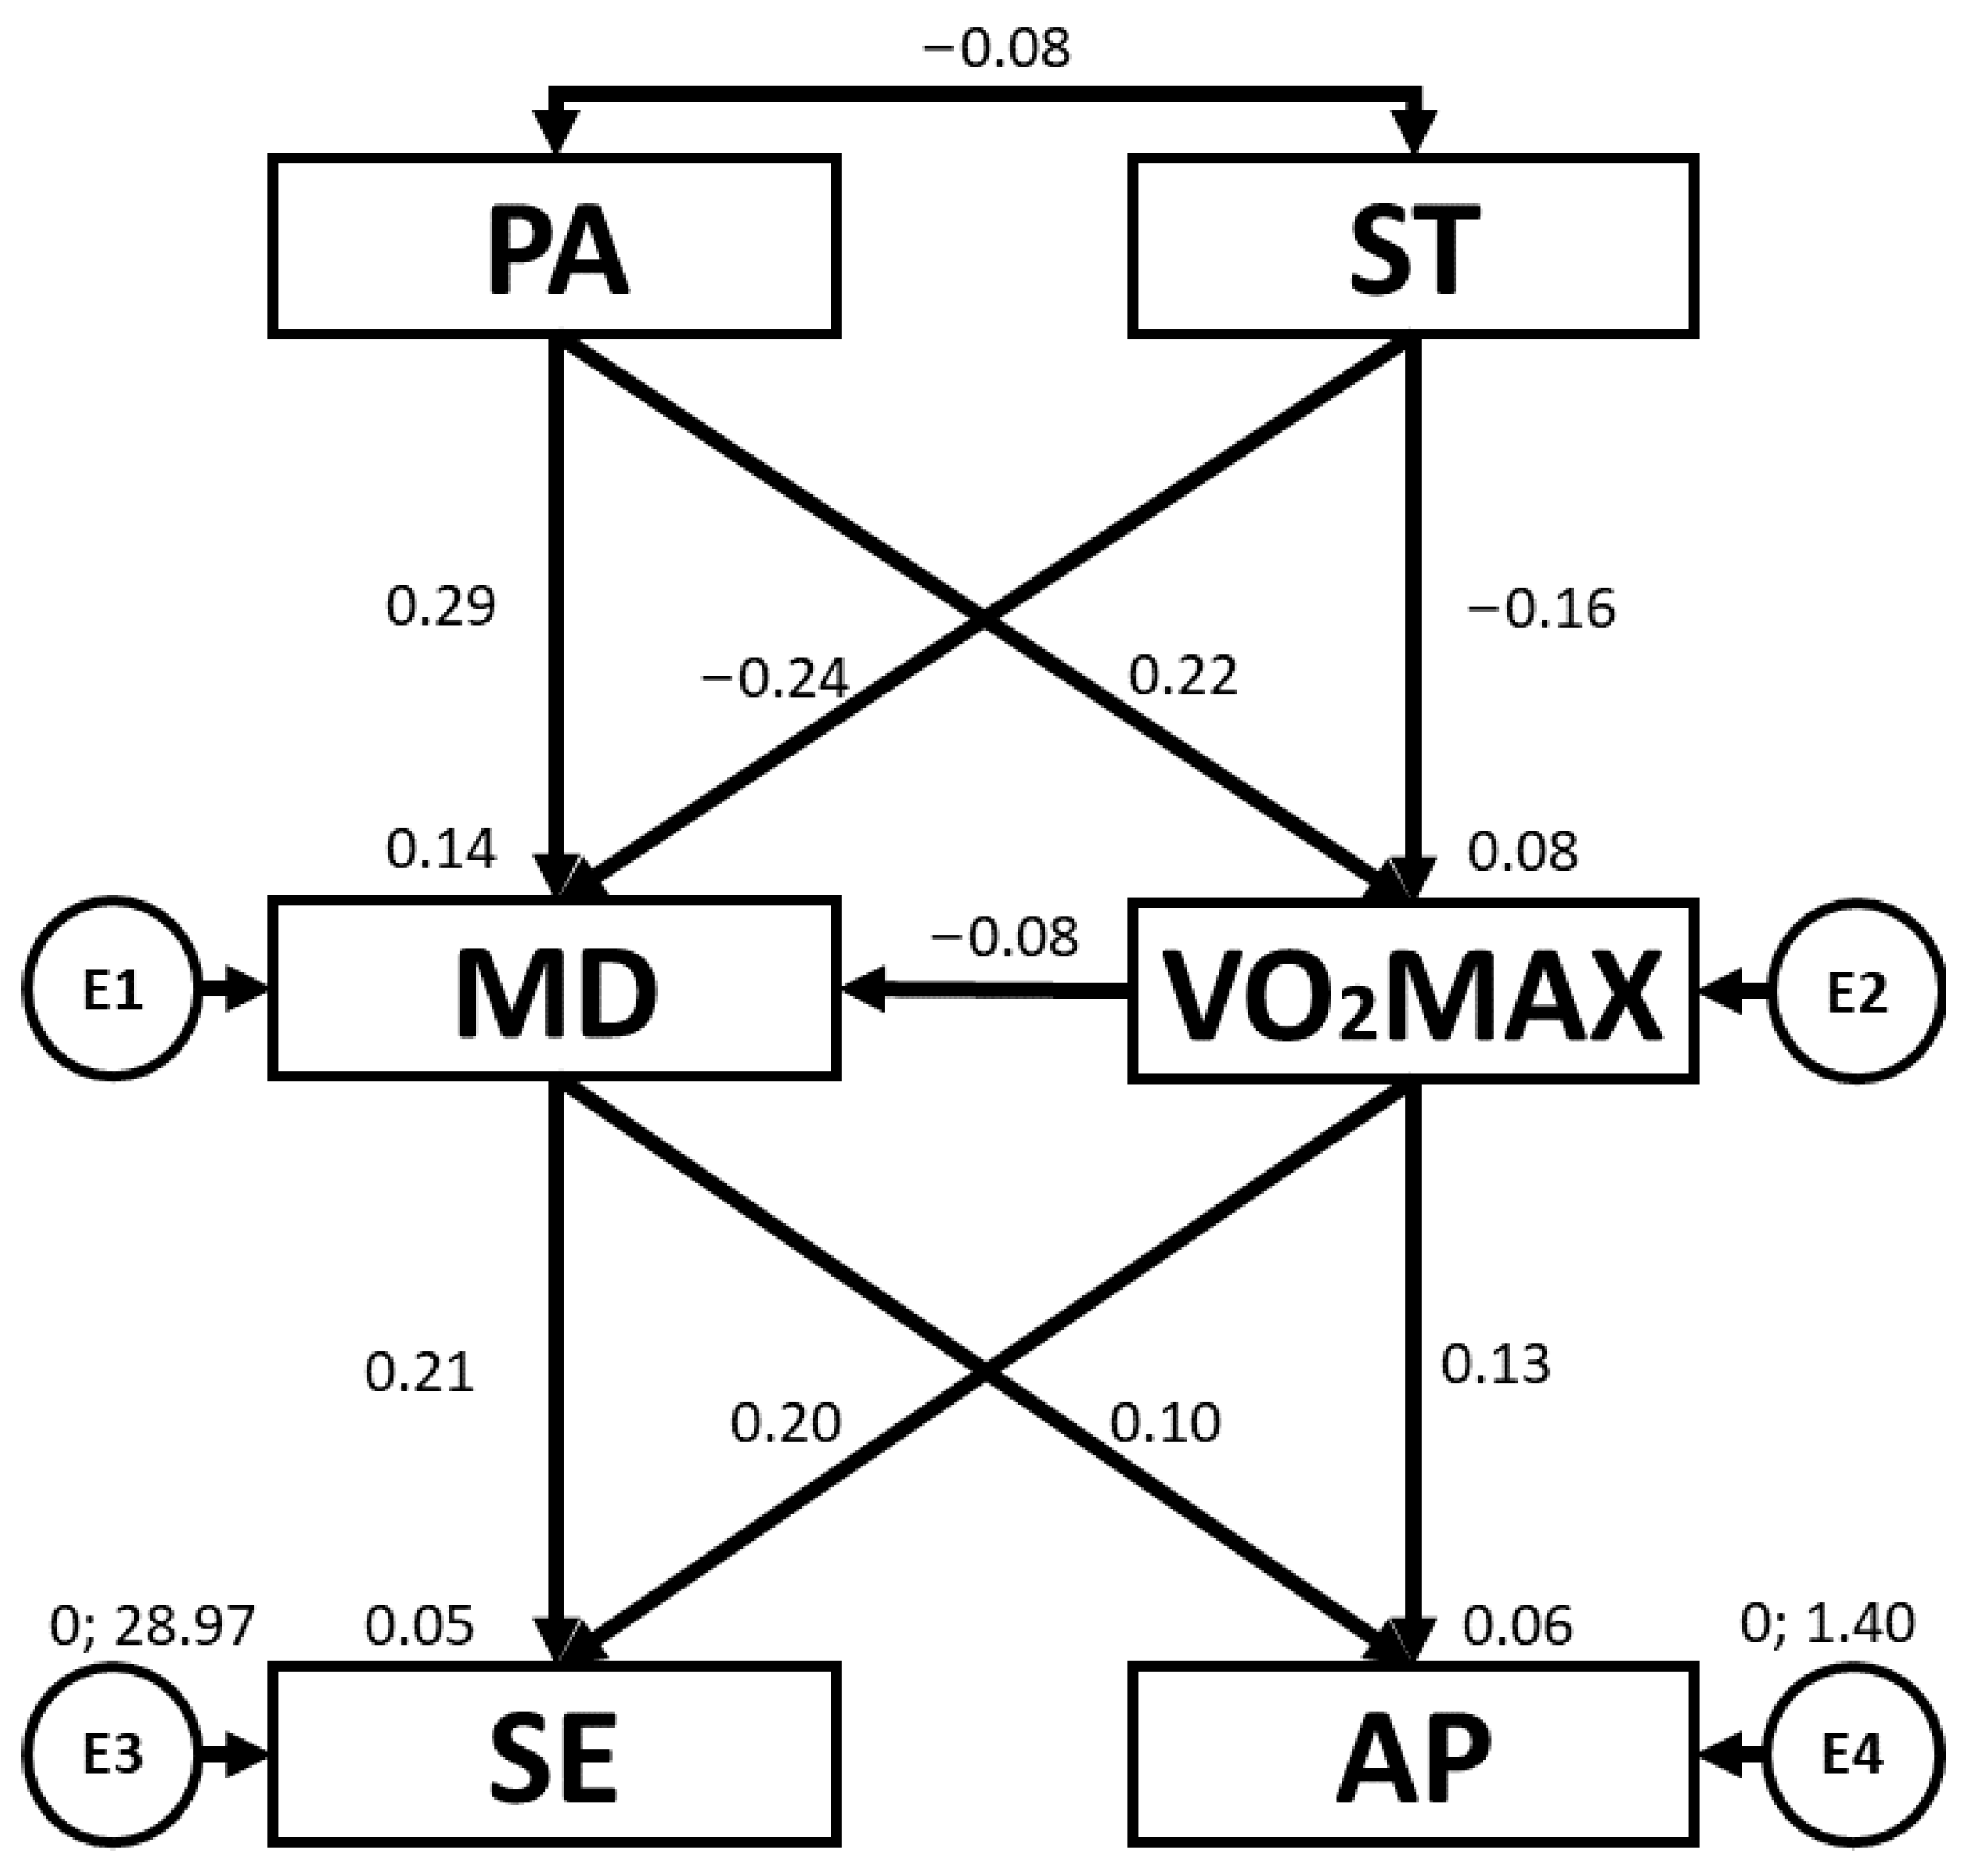
| Association between Variables | RW | SRW | |||||
|---|---|---|---|---|---|---|---|
| Estimation | SE | CR | p | Estimation | |||
| VO2max | ← | PA | 1.582 | 0.573 | 2.762 | 0.006 | 0.222 |
| VO2max | ← | ST | −0.615 | 0.308 | −1.992 | 0.046 | −0.160 |
| MD | ← | PA | 0.889 | 0.243 | 3.653 | *** | 0.291 |
| MD | ← | VO2max | −0.033 | 0.035 | −0.939 | 0.348 | −0.076 |
| MD | ← | ST | −0.402 | 0.130 | −3.105 | 0.002 | −0.244 |
| AP | ← | MD | 0.090 | 0.036 | 2.490 | 0.013 | 0.202 |
| SE | ← | MD | 0.418 | 0.165 | 2.531 | 0.011 | 0.206 |
| SE | ← | VO2max | 0.083 | 0.071 | 1.176 | 0.240 | 0.096 |
| AP | ← | VO2max | 0.025 | 0.016 | 1.581 | 0.114 | 0.128 |
| PA | ↔ | ST | −0.123 | 0.124 | −0.990 | 0.322 | −0.083 |
| Association between Variables | RW | SRW | |||||
|---|---|---|---|---|---|---|---|
| Estimation | SE | CR | p | Estimation | |||
| VO2max | ← | PA | 1.588 | 0.578 | 2.747 | 0.006 | 0.226 |
| VO2max | ← | ST | −1.313 | 0.340 | −3.861 | *** | −0.318 |
| MD | ← | PA | 1.248 | 0.266 | 4.688 | *** | 0.370 |
| MD | ← | VO2max | 0.018 | 0.040 | 0.450 | 0.653 | 0.038 |
| MD | ← | ST | −0.653 | 0.161 | −4.061 | *** | −0.329 |
| AP | ← | MD | 0.144 | 0.036 | 4.044 | *** | 0.342 |
| SE | ← | MD | 0.299 | 0.207 | 1.439 | 0.150 | 0.128 |
| SE | ← | VO2max | 0.228 | 0.100 | 2.284 | 0.022 | 0.204 |
| AP | ← | VO2max | 0.030 | 0.017 | 1.729 | 0.084 | 0.146 |
| PA | ↔ | ST | −0.066 | 0.102 | −0.648 | 0.517 | −0.058 |
| Association between Variables | RW | SRW | |||||
|---|---|---|---|---|---|---|---|
| Estimation | SE | CR | p | Estimation | |||
| VO2max | ← | PA | 1.956 | 0.713 | 2.745 | 0.006 | 0.247 |
| VO2max | ← | ST | −0.804 | 0.400 | −2.010 | 0.044 | −0.181 |
| MD | ← | PA | 1.198 | 0.257 | 4.657 | *** | 0.405 |
| MD | ← | VO2max | −0.030 | 0.033 | −0.904 | 0.366 | −0.080 |
| MD | ← | ST | −0.351 | 0.142 | −2.467 | 0.014 | −0.211 |
| AP | ← | MD | 0.067 | 0.045 | 1.488 | 0.137 | 0.139 |
| SE | ← | MD | 0.628 | 0.243 | 2.585 | 0.010 | 0.231 |
| SE | ← | VO2max | 0.212 | 0.091 | 2.346 | 0.019 | 0.209 |
| AP | ← | VO2max | 0.001 | 0.017 | 0.052 | 0.958 | 0.005 |
| PA | ↔ | ST | −0.190 | 0.121 | −1.564 | 0.118 | −0.149 |
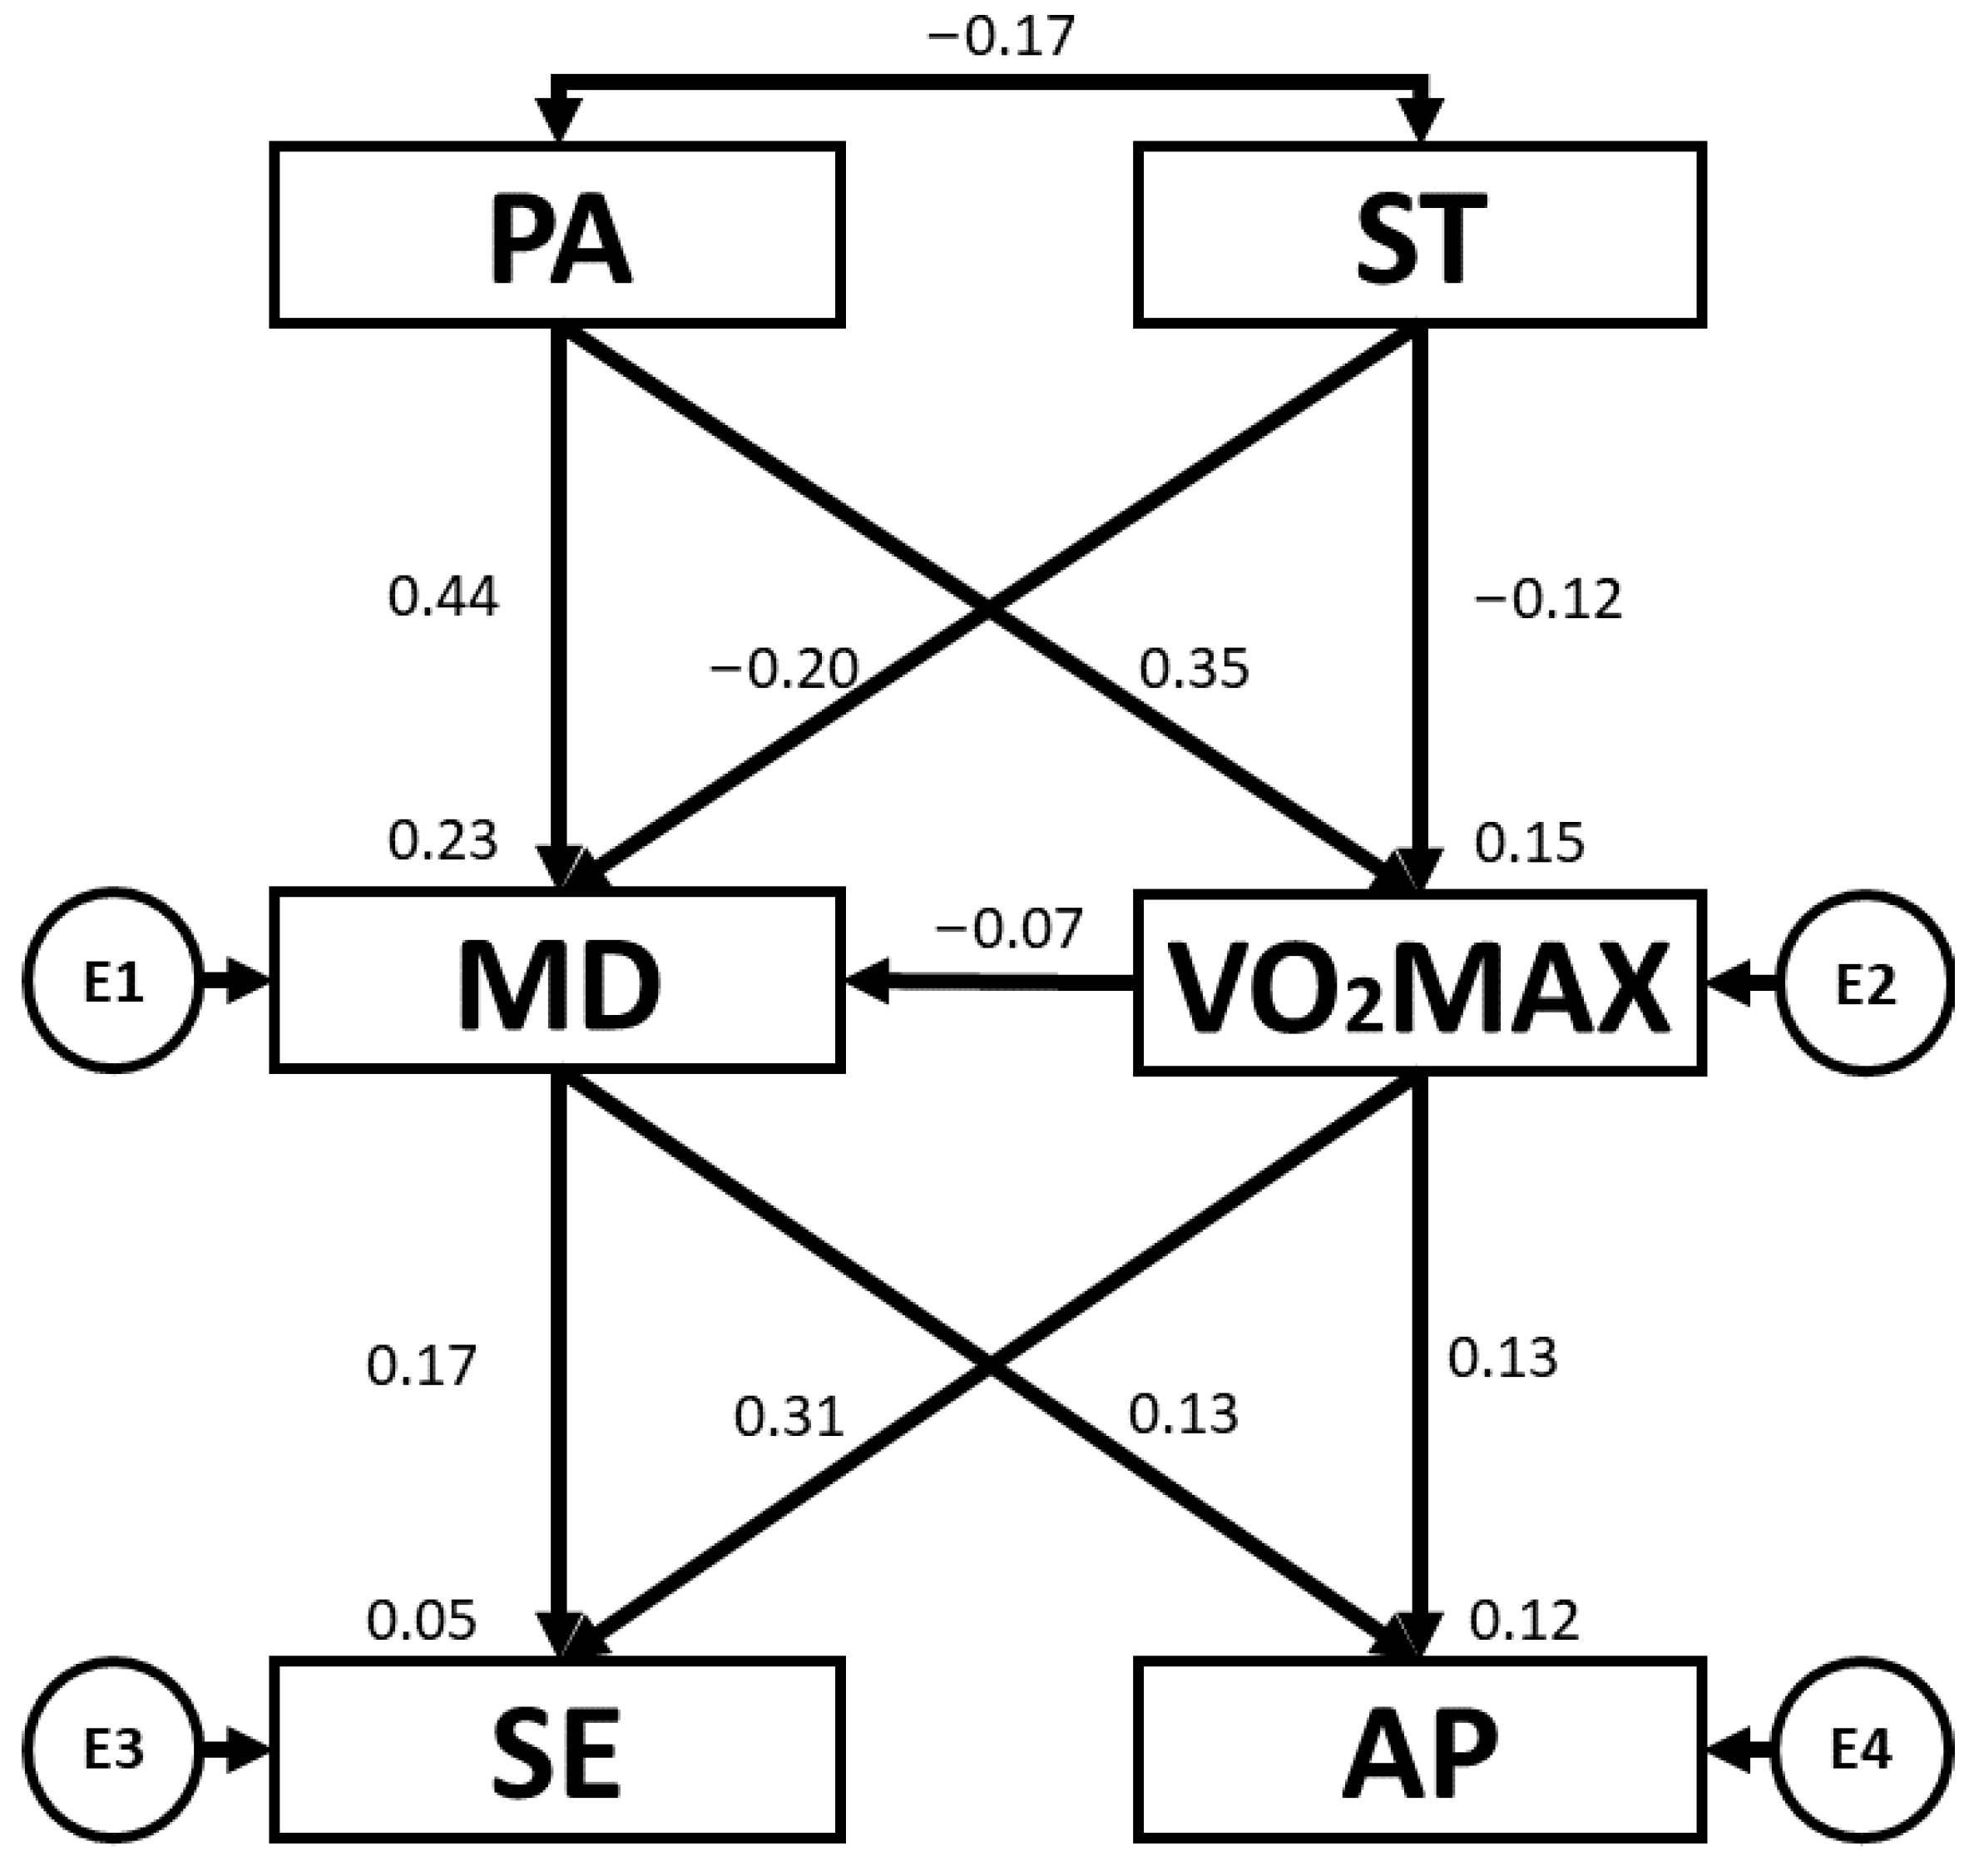
| Association between Variables | RW | SRW | |||||
|---|---|---|---|---|---|---|---|
| Estimation | SE | CR | p | Estimation | |||
| VO2max | ← | PA | 2.636 | 0.571 | 4.614 | *** | 0.348 |
| VO2max | ← | ST | −0.503 | 0.322 | −1.560 | 0.119 | −0.118 |
| MD | ← | PA | 1.479 | 0.260 | 5.693 | *** | 0.435 |
| MD | ← | VO2max | −0.032 | 0.034 | −0.929 | 0.353 | −0.071 |
| MD | ← | ST | −0.373 | 0.138 | −2.697 | 0.007 | −0.195 |
| AP | ← | MD | 0.130 | 0.032 | 4.073 | *** | 0.310 |
| SE | ← | MD | 0.322 | 0.149 | 2.157 | 0.031 | 0.171 |
| SE | ← | VO2max | 0.107 | 0.067 | 1.596 | 0.110 | 0.126 |
| AP | ← | VO2max | 0.023 | 0.014 | 1.636 | 0.102 | 0.125 |
| PA | ↔ | ST | −0.203 | 0.098 | −2.072 | 0.038 | −0.169 |
Disclaimer/Publisher’s Note: The statements, opinions and data contained in all publications are solely those of the individual author(s) and contributor(s) and not of MDPI and/or the editor(s). MDPI and/or the editor(s) disclaim responsibility for any injury to people or property resulting from any ideas, methods, instructions or products referred to in the content. |
© 2023 by the authors. Licensee MDPI, Basel, Switzerland. This article is an open access article distributed under the terms and conditions of the Creative Commons Attribution (CC BY) license (https://creativecommons.org/licenses/by/4.0/).
Share and Cite
Villodres, G.C.; Salvador-Pérez, F.; Chacón-Cuberos, R.; Muros, J.J. Lifestyle Behaviours, Self-Esteem and Academic Performance in Primary Education Students—A Structural Equation Model According to Sex and School Type. Children 2023, 10, 1769. https://doi.org/10.3390/children10111769
Villodres GC, Salvador-Pérez F, Chacón-Cuberos R, Muros JJ. Lifestyle Behaviours, Self-Esteem and Academic Performance in Primary Education Students—A Structural Equation Model According to Sex and School Type. Children. 2023; 10(11):1769. https://doi.org/10.3390/children10111769
Chicago/Turabian StyleVillodres, Gracia Cristina, Federico Salvador-Pérez, Ramón Chacón-Cuberos, and José Joaquín Muros. 2023. "Lifestyle Behaviours, Self-Esteem and Academic Performance in Primary Education Students—A Structural Equation Model According to Sex and School Type" Children 10, no. 11: 1769. https://doi.org/10.3390/children10111769
APA StyleVillodres, G. C., Salvador-Pérez, F., Chacón-Cuberos, R., & Muros, J. J. (2023). Lifestyle Behaviours, Self-Esteem and Academic Performance in Primary Education Students—A Structural Equation Model According to Sex and School Type. Children, 10(11), 1769. https://doi.org/10.3390/children10111769