1. Introduction
The development of optical carbon dioxide (CO
2) sensors is an expanding area of analytical science because of the demand for inexpensive and efficient devices for use in engineering and medicine [
1]. CO
2 sensors are essential for the detection of environmental changes related to global temperature increases such as ocean acidification and for use in monitoring dissolved CO
2 levels in stagnant rivers and lakes [
1,
2,
3,
4]. Further, CO
2 sensors are used in the monitoring of internal blood gases in routine medical practice to evaluate human health [
1,
5], because when too much CO
2 accumulates in the blood, disruption of the regulation of gas exchange in the lungs can affect cardiac and neurological functions as well as downstream immune responses [
5,
6]. While there are several CO
2 sensitive optical materials available most of them have limitations, which include high cost, sensitivity to electrical interference, sensitivity to pH changes and acidic or basic gases, and often have slow response and recovery times [
1]. There is a clear and immediate need, therefore, to develop alternative molecular systems for CO
2 detection. In the present study, we offer a novel CO
2 sensor, Neutral Red (NR), and provide evidence of NR’s efficacy as a new pH/
pCO
2 luminescent sensor to measure dCO
2. Indirect sensing of CO
2 involves the measurement of changes in CO
2 concentrations and NR, a cellular stain, responds to changes in dissolved (dCO
2) under different pHs and external CO
2 concentrations. Measuring changes in CO
2 concentration based on the changes in pH of the medium has been a method used primarily by the Severinghaus electrode [
1,
7]. While there are some advantages, including high accuracy and stability, for using Severinghaus electrodes to measure CO
2 concentration, the disadvantages far outweigh the advantages. Some common disadvantages of Severinghaus electrodes include high-cost, bulkiness, slow response and recovery times, contamination of reference electrode, liquid junction fouling, and high maintenance. Severinghaus electrodes are also vulnerable to electrical interferences, the presence of acidic and basic gases, changes in osmostic pressure and therefore salt conditions. [
1,
8,
9,
10]. Alternative CO
2 sensors to the Severinghaus devices are needed, which are inexpensive, portable, robust, with rapid response times and that can monitor analyte concentrations continuously. For these reasons, CO
2 sensors that function based on optical signal (absorbance or fluorescence) changes are of high interest. Optical CO
2 sensors come in two forms: (1) colorimetric/absorption-based, and (2) luminescence-based, and can potentially replace electrodes equipped with pH indicators. Of the two forms, luminescent sensors are more desirable because of their higher sensitivity compared to colorimetric dyes as the pKa of the sensing material or colorimetric/fluorescent dye will play a major role in the selection of the sensor materials. A colorimetric/luminescent dye with a pKa value close to the first dissociation constant of carbonic acid is a good choice for effective CO
2 detection. For intracellular studies in biological systems, the range of detection should bracket the pH range typical of a live biological cell, i.e., pH 7.0 to 7.4 [
11]. It is therefore critically important that for a CO
2 sensor to be efficient for use in biological systems, the sensor signal must be non-responsive to dissolved oxygen concentrations present in the atmosphere and the water [
12].
In the present study, we provide evidence that NR can reliably measure dissolved CO
2 (dCO
2) in buffered media. While NR has been commonly used as a non-fluorescent pH indicator and biological stain, it also exhibits concentration-dependent optical properties, is non-fluorescent at concentrations higher than 10
−4 M, with a pH sensitive emission detectable at concentrations of <10
−4 M [
13,
14,
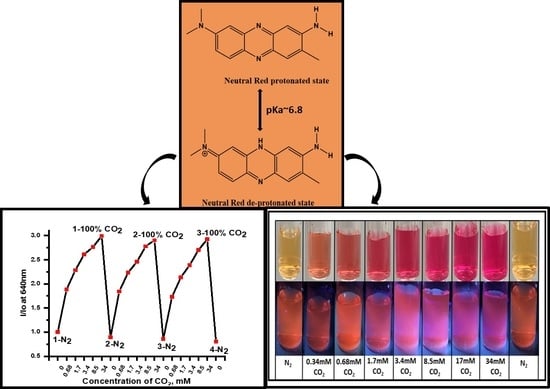
15]. The chemical structure and effect of pH on the chemistry of NR is shown in
Figure 1. NR exhibits pH-dependent dual excitation/absorption peaks at 455 and 540 nm. The fluorescent emission peak maximum is not altered with pH and is centered at 640 nm from pHs ranging from 5.9 to 8.2. The orange-red emission at 640 nm is considerably red-shifted from the auto-fluorescence of many biological organelles and thereby expected to exhibit minimized background interference, which is useful for intracellular CO
2 studies. The universal cellular fluorophores—NADPH, proteins, and flavins exhibit mostly blue and green emission [
16,
17]. The pKa of neutral red is 6.9, which lies near to the first pKa of carbonic acid of 6.35, and because the pKa of NR is near to neutral pH, this suggests that NR will serve as a good candidate as a CO
2 sensor especially for biological systems. NR as a pH luminescent sensor for environmental and biological applications has the promising additional property of very low toxicity [
18], based on the fact that NR has been certified as a biological stain and is well known as a method for determining cell viability through the staining of lysosomes and chromatin staining [
14,
15,
18]. In an eco-toxicological safety study by Kastury et al. (2015), acute toxicity values of NR were determined to lie between 2.5 × 10
−4 M to 0.01 M [
19,
20]. In the present study, all experiments were conducted at NR concentrations below 10
−5 M.
Many past studies of fluorescent CO
2 sensors used sensors made from pyranine (8-hydroxypyrene-1, 3, 6-trisulfonic acid trisodium salt (HPTS) with a pKa of 7.3 [
1]. HPTS is ideal for sensing
pCO
2 because as with NR, HPTS exhibits pH-dependent dual excitation and a single emission spectrum with excitation/absorption at 405 nm at pHs below the pKa and exhibited a red-shifted 455 nm excitation/absorption at pHs above the pKa of the system. HPTS peak emission is centered at 515 nm and is unaffected by the pH of the medium between the pH range of 6.5 to 8.0. The structure of HPTS in acidic and basic conditions is in the
Figure S1. The emission and excitation spectra at different pHs along with changes in the color of HPTS in buffer solution under ambient and under UV light irradiation are shown in
Figure S2. Several studies have demonstrated that response and recovery times of optical sensors vary with fabrication as well as experimental conditions including type of buffer, pH, dye concentration, and coating thickness [
1]. HPTS is a bicarbonate buffer and will detect concentrations as low as 5% CO
2 in 15 s with a recovery time of 30 s [
7]. HPTS is also known to have low toxicity, although this property has not been rigorously investigated [
12]. A major limitation of HPTS for intracellular biological studies is its lack of cell permeability [
12], compared to NR [
18]. While our major goal in the present study was to establish the CO
2 sensing properties of NR, some additional experimental studies were performed to compare and contrast the CO
2 sensing properties of NR with the well-established HPTS system. These studies include comparing the NR vs. HPTS under the same experimental conditions of differing dCO
2 and pH to determine differences in sensor sensitivity, response time, and reversibility.
2. Materials and Methods
Six different 1 mM fresh phosphate-buffered solutions of pH, 5.5, 6, 6.5, 7, 7.5, and 8 were prepared by adding different ratios of NaH2PO4 and Na2HPO4 to de-ionized (DI) water. An 8 × 10⁻⁴ M aqueous stock solution of neutral red (NR) was prepared by dissolving NR in DI water and different pH solutions of NR in phosphate-buffered solution were prepared by adding 0.4 mL of the NR stock solution to each of the six phosphate-buffered solutions of the desired pH (as mentioned above), resulting in a final NR solution concentration of 3.1 × 10⁻⁵ M. It should be noted that on addition of the NR stock solution to the pH phosphate-buffered solutions, the final pH of the samples increased slightly to reach a final pH of, 5.9, 6.4, 6.8, 7.3, 7.8 and 8.2. For comparison, solutions of HPTS were prepared using the same methods as with NR. All (NR and HPTS) solutions were investigated to determine the effects of pH on their fluorescence properties.
Different concentrations of CO
2 and N
2 gas mixtures were used in the experiments to determine NR’s ability to detect changes in dCO
2 in a buffer medium. To arrive at different gas concentrations, pre-mixed cylinders of CO
2/N
2 gas were purchased with the following gas ratios, 2/98, 5/95, 6/94, 10/90, 25/75, 50/50 and 100/0 or, 2%, 5%, 6%, 10%, 25%, 50% and 100% CO
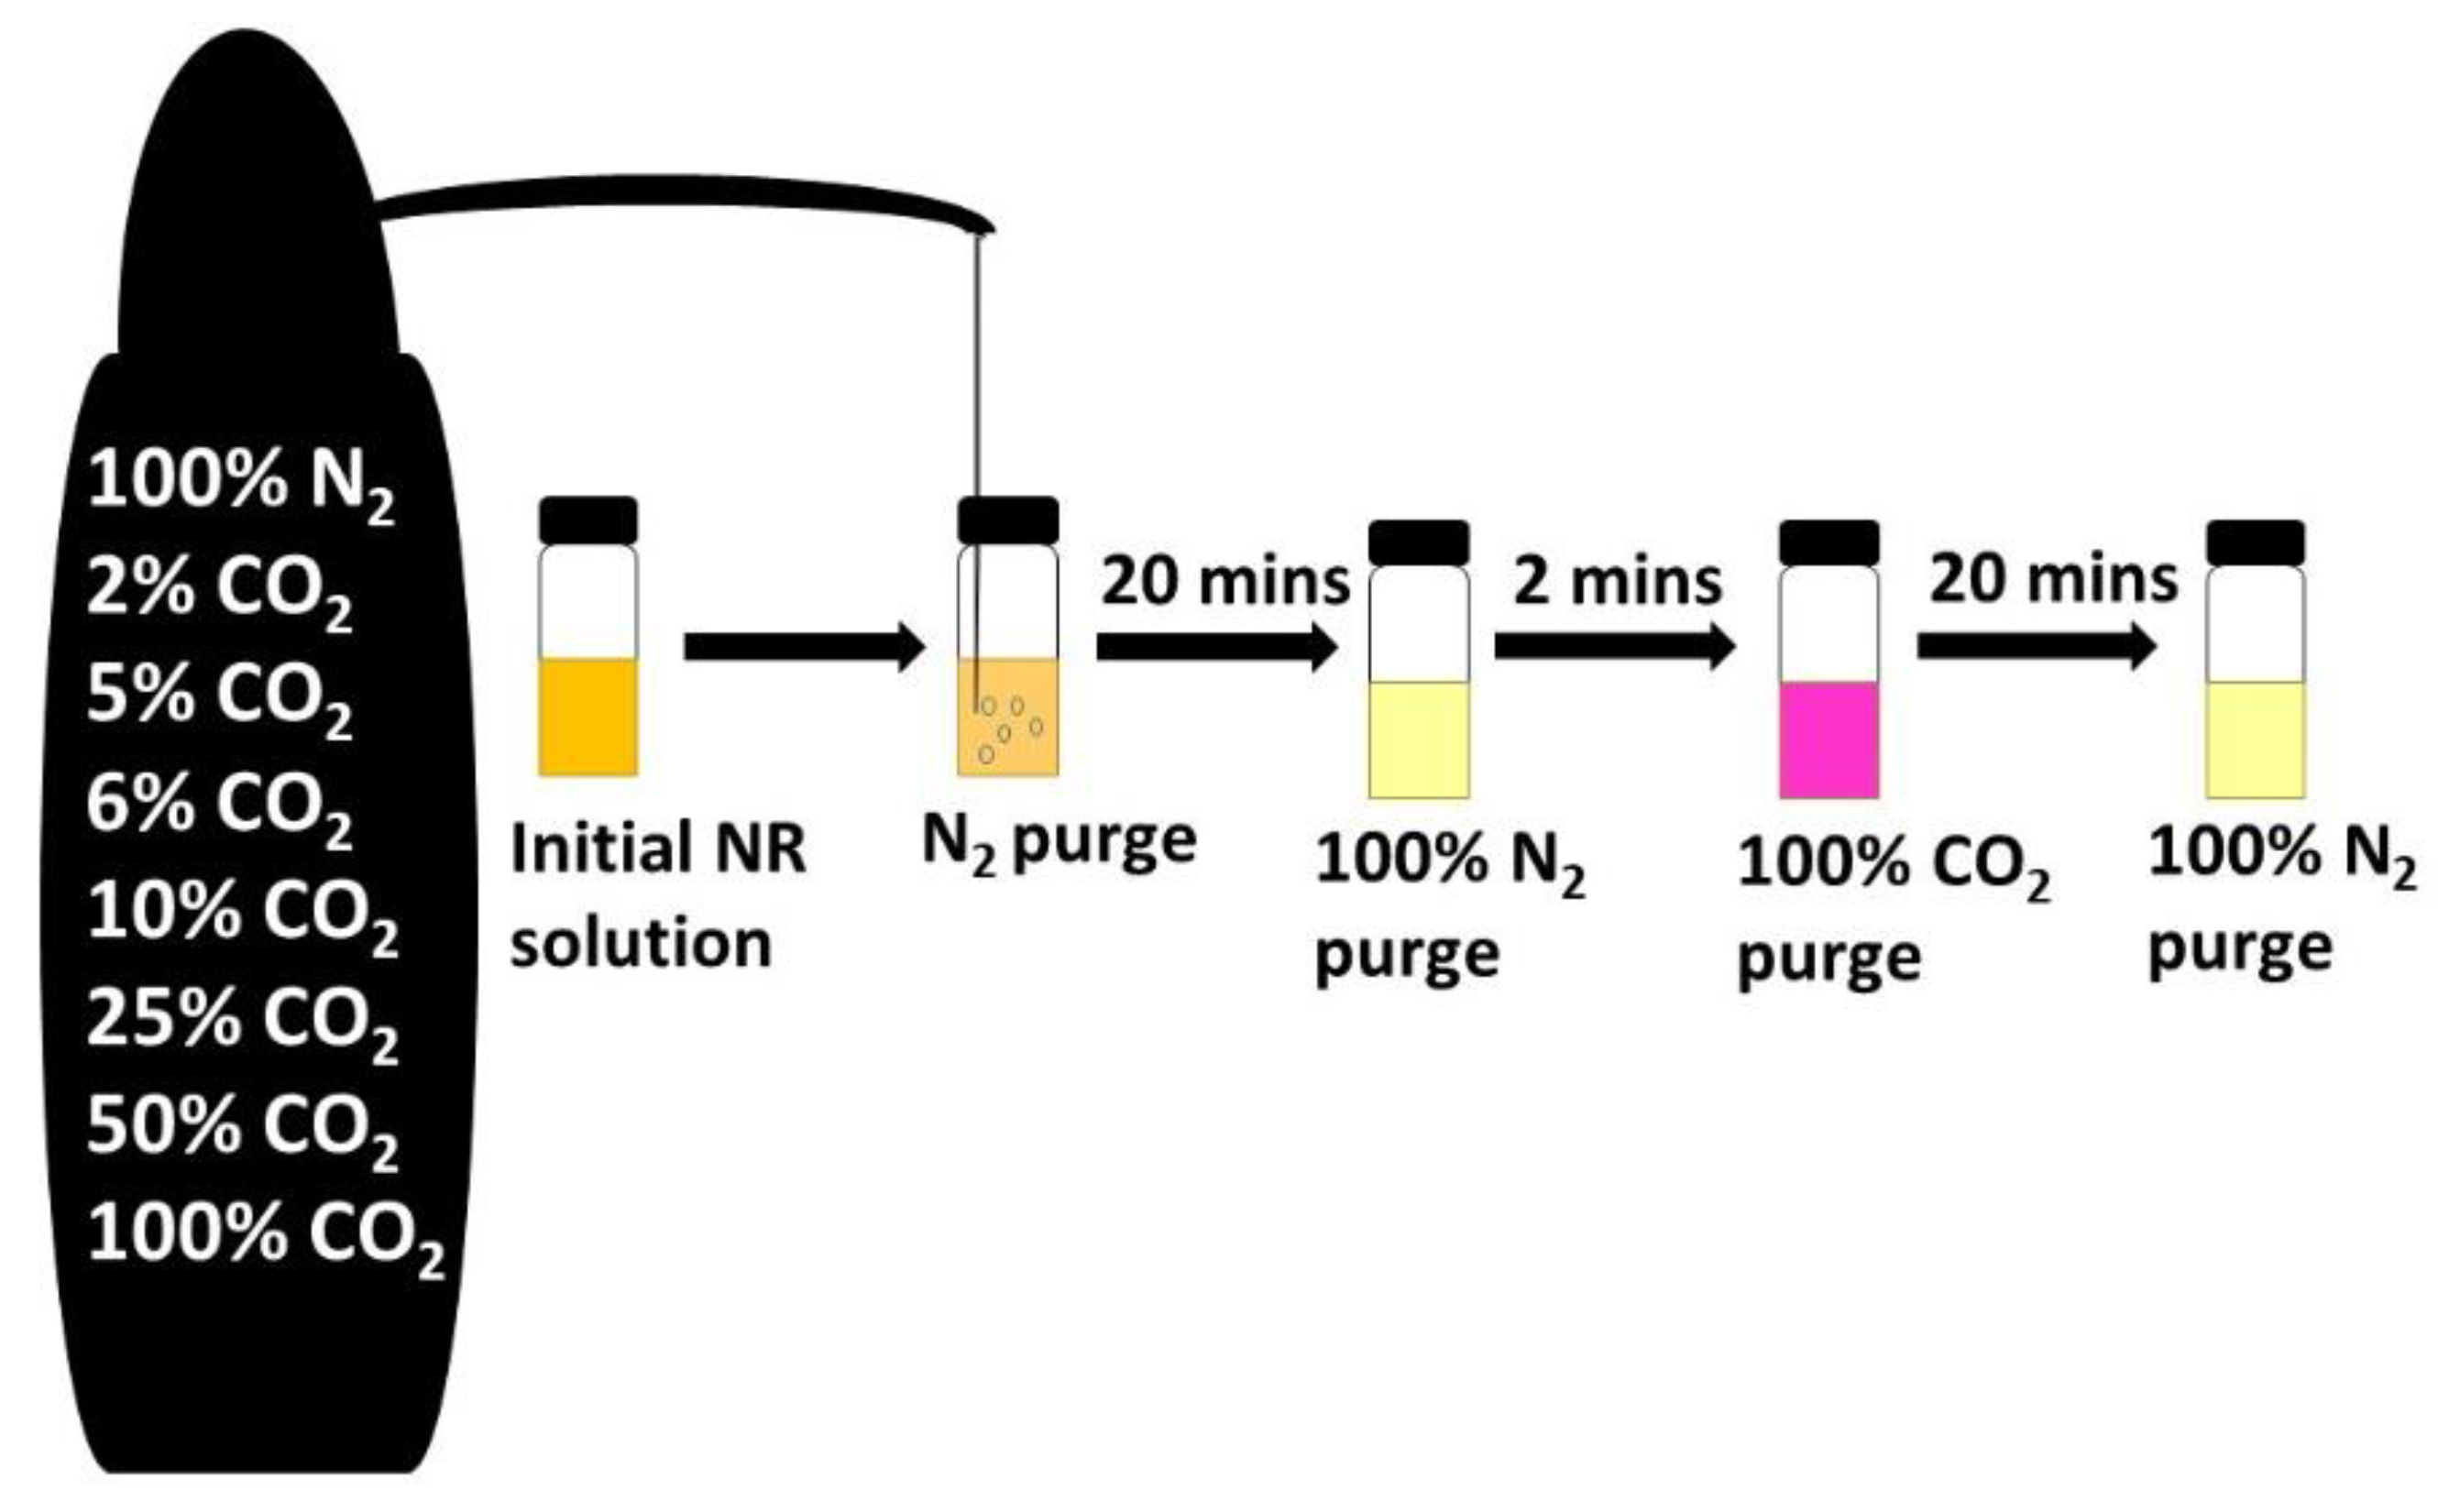
2, respectively. The 10 mL NR buffer solution at pH 7.3 was selected to be used for the CO
2 purging studies (
Figure 2). Purging studies consisted of the following steps, (1) the test sample was first de-aerated by purging it with N
2 followed by saturation with 100% CO
2, (2) the treated solution was then brought back to its initial state by purging the sample with 100% N
2 followed by, (3) purging with the pre-mixed gases of, 2%, 5%, 6%, 10%, 25%, 50% and 100% CO
2 from the pre-mixed cylinders and then neutralization by purging with 100% N
2 (
Figure 2),. Fluorescence spectra were recorded using PTI Quanta Master Model QM-4, with a 75-watt Xenon arc lamp source and photomultiplier tube detector, scanning spectrofluorometric and absorption spectra are recorded using the PerkinElmer Lambda 900 UV/VIS/NIR spectrophotometer.
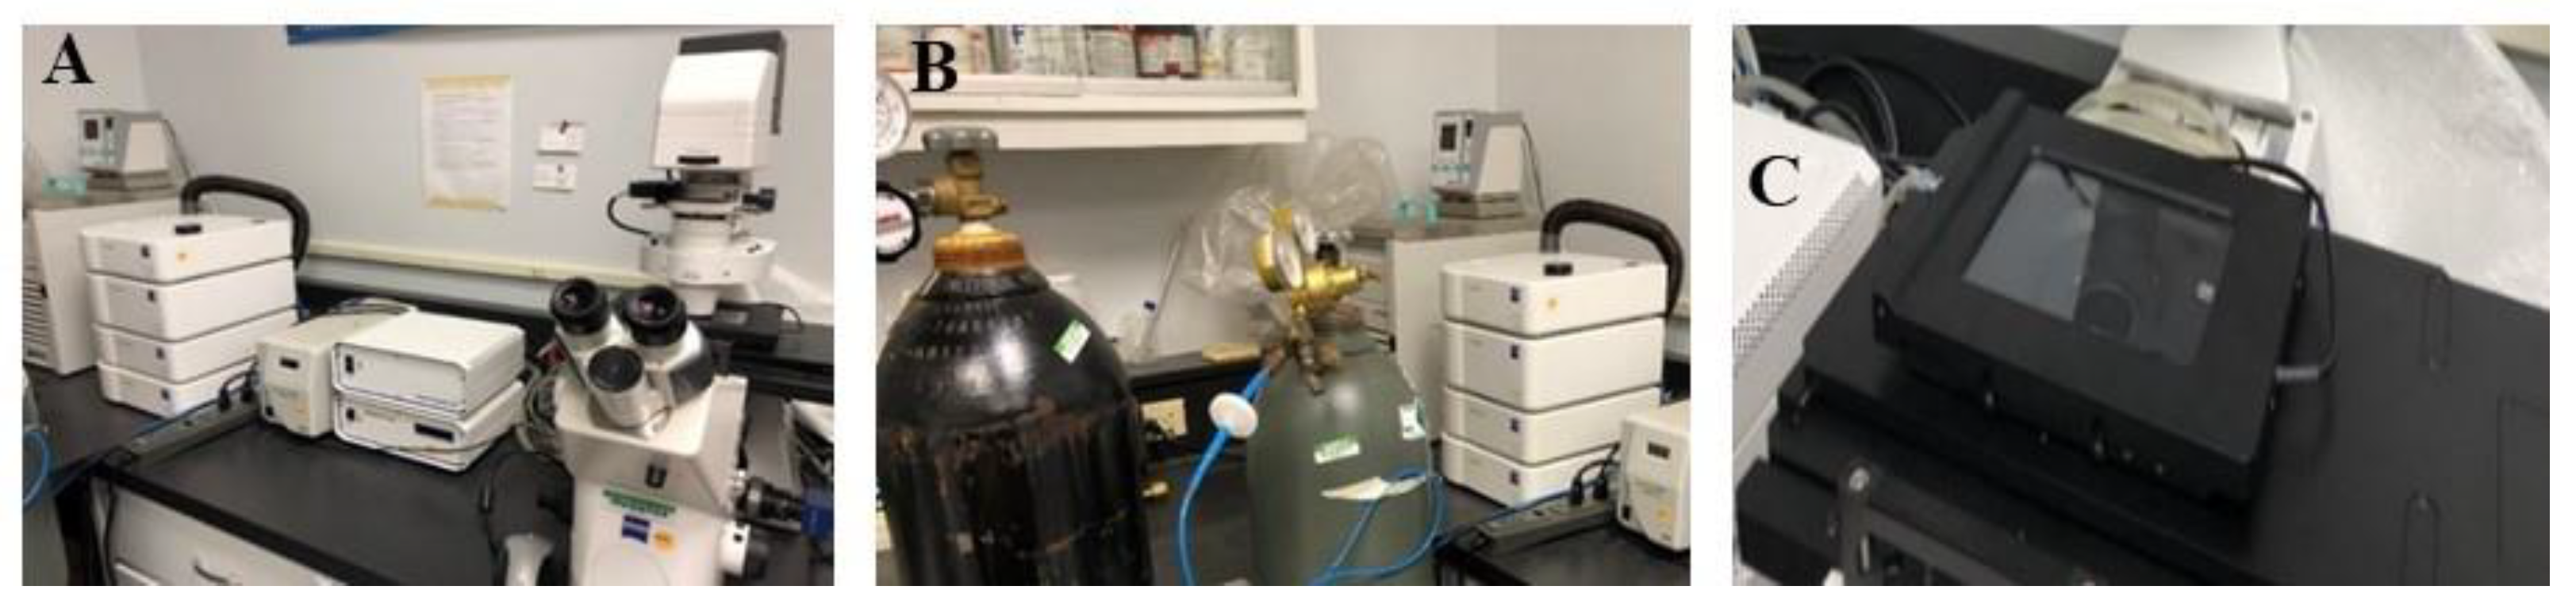
Following the fluorescence studies, blanketing studies were performed using 10 mL of 3.1 × 10
−5 M NR solution at pH 7.3, on a Zeiss Axio Observer Z1 epifluorescent microscope equipped with an incubation chamber in which different atmospheric mixtures of CO
2/N
2 gases could be maintained for several hours if necessary. The microscope setup and environmental chamber are shown in
Figure 3 and
Figure S3. As in the fluorometer, different concentrations of CO
2 gas were tested to further characterize the sensitivity of NR using epifluorescence microscopy. For each blanketing study, a NR sample was first purged with 100% CO
2 and then brought back to neutral by purging with 100% N
2. The desired CO
2 concentration within the environmental chamber was obtained by mixing the gases from 100% CO
2 cylinder with different amounts of room atmosphere air, (about 78% N
2), to obtain 2%, 4%, and 6% final CO
2 concentrations. Due to technical limitations, the maximum CO
2 concentration attained in the incubation chamber was 6%. Images from the Zeiss microscope were captured using Zeiss image software and were taken for 60 min at 10 min intervals during CO
2 exposure and at 20 min intervals during reversibility studies. For the 100% CO
2 measurements, the sample was directly purged with CO
2 gas and then images were recorded.
Calibrations existed within the microscope to determine and maintain the desired final atmospheric CO
2 concentrations during the experiments [
21,
22]. Epifluorescence of each sample was recorded when the sample solution was blanketed with three different concentrations of CO
2 gas (2%, 4%, 6%) and exposed to light passed through a rhodamine band-pass (BP) filter with an excitation of 546/12 and an emission of 575–640 nm [
23]. The rhodamine band-pass (BP) filter was selected because of the overlap with the excitation 540 nm and emission 640 nm, peaks of the NR solution system. For the 100% CO
2 studies, the NR sample was removed from the incubation chamber and purged with 100% CO
2 gas externally because concentrations could not reach 100% CO
2 within the incubation chamber. All microscopic images were analyzed using ImageJ [
24].
Table 1 shows the % partial pressure, kPa and mm of Hg, and molar concentrations of CO
2 gas used in this study. The % values were either directly obtained from the gas cylinder manufacturer or controlled via the Zeiss Axiovert mixing modules, while partial pressure and molar concentration values in the solution were directly calculated.
3. Results and Discussion
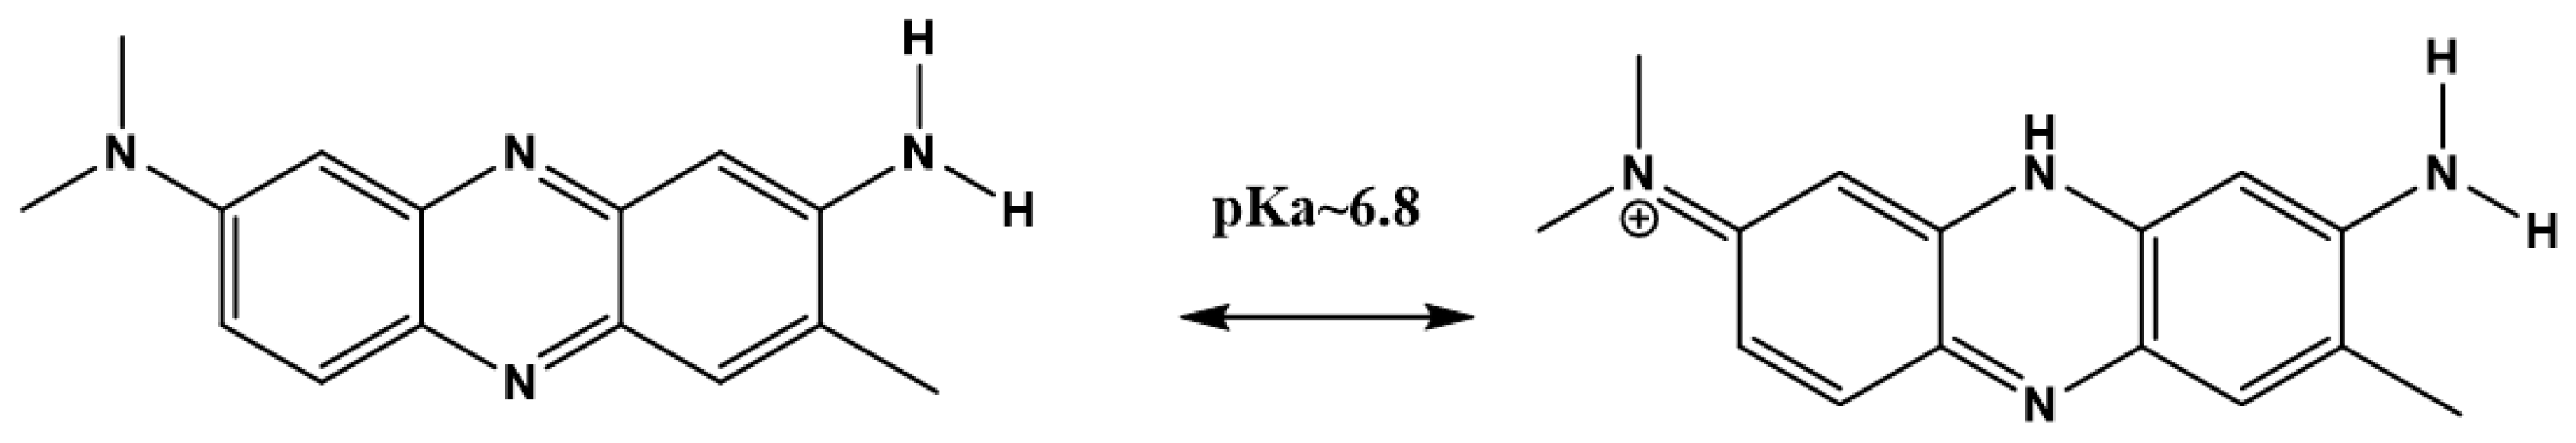
Effects of pH on emission and excitation spectra of the NR solution were tested before determining the effects of different concentrations of dissolved CO
2 on NR’s optical properties. Results from the pH experiments on NR in solution showed clear pH dependence (
Figure 4A–C). Specifically, while a broad excitation band at 455 nm was observed from pHs of 7.3 to 8.2, at lower pHs 5.9 to 6.8 the excitation band red-shifted to 540 nm. In short, as pH was reduced from 8.2 to 5.9, the orange-red emission, which had a peak maximum at 640 nm, exhibited a 50% increase in intensity when excited with a single wavelength at 540 nm (
Figure 4A). The dual excitation characteristic of NR is specifically useful for a good optical sensor because dual excitations can help overcome background interference and help with baseline corrections during the calibration of the sensor. The Xenon arc lamp has a wide excitation wavelength range (200–800 nm) which benefits the study of molecules with multiple excitation wavelengths. All photoluminescence studies reported here are monitored at an excitation wavelength of 540 nm. The optical properties of NR in a phosphate-buffered solution, therefore, were sensitive to pH changes between 6.0–8.5 and thus appropriate for dCO
2 studies in living organisms. The pKa of the NR solution was calculated from an emission (I/I
o at 640 nm) vs. pH plot and was determined to be 6.9 (
Figure 4C).
Determination of the effects of dCO
2 on NR in a phosphate-buffered solution with a pH of 7.3 followed the pH experiments. A buffer solution with a pH of 7.3 was selected for the experiments because a pH of 7.3 is common in human blood. For example, arteries and veins carry blood between a pH of 7.2–7.4, the shift in pH responsible for the ability of hemoglobin to transport both O
2 and CO
2 and blood-oxygen dissociation curves in humans and is known as the Bohr Effect [
25]. In the dCO
2 experiments, the NR buffered phosphate solution was initially saturated with 100% CO
2 gas for equilibration followed by purging it with 100% N
2. Responses and reversibility times were determined to be about 2 min and 10 min, respectively. After saturation with 100% CO
2 gas, absorption and emission data for the NR buffered phosphate solution was recorded when it was exposed to different concentrations of CO
2 gas (2%, 6%, 10%, 25%, 50%, and 100%) (
Figure 5 and
Figure 6). In
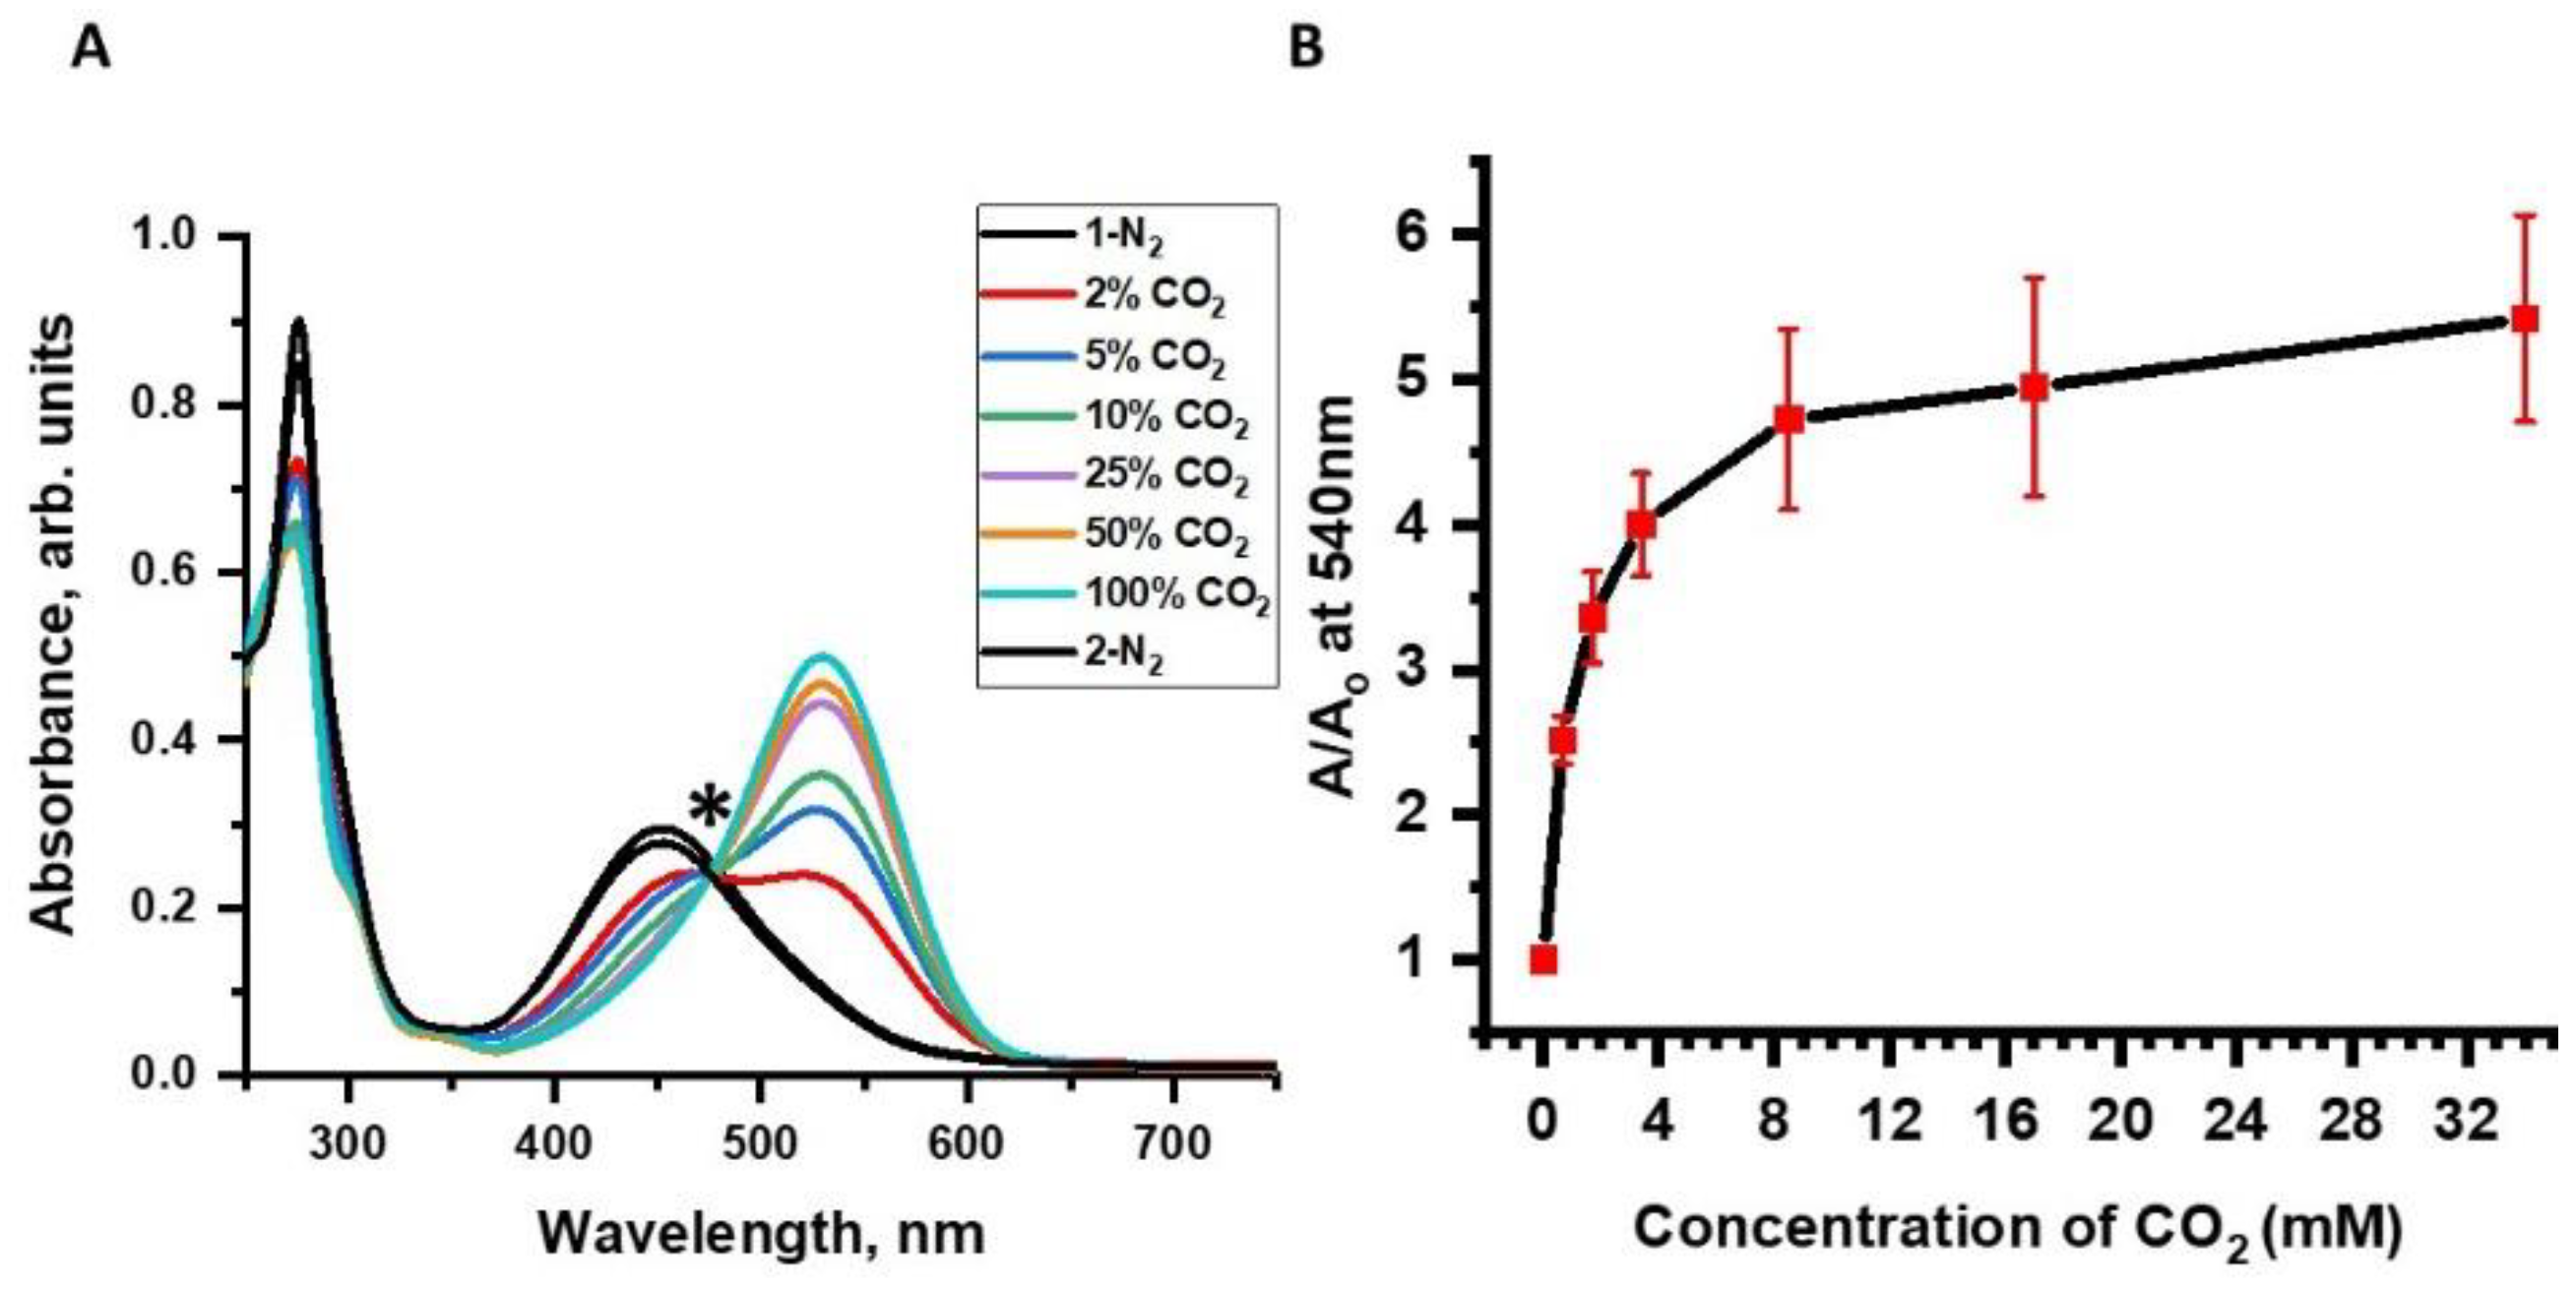
Figure 5A, NR buffered phosphate solution exhibited a 433.6% increase in absorbance signal at 540 nm when switched from 100% N
2 to 100% CO
2. At the lowest concentration of 2% CO
2 (0.68 mM), there was a 149.5% increase in absorbance signal at 540 nm and the absorbance at 540 nm and absorption spectra are completely reversible when gas mixtures were switched from pure N
2 to 100% CO
2 followed by purging with pure N
2 (
Figure 5B). As the dCO
2 concentration is increased, an isosbestic point was observed at around 470 nm in
Figure 4A,
Figure 5A and
Figure 6A indicated by ‘*’. The isosbestic point represents the presence of both the acidic and basic forms of NR, at equilibrium.
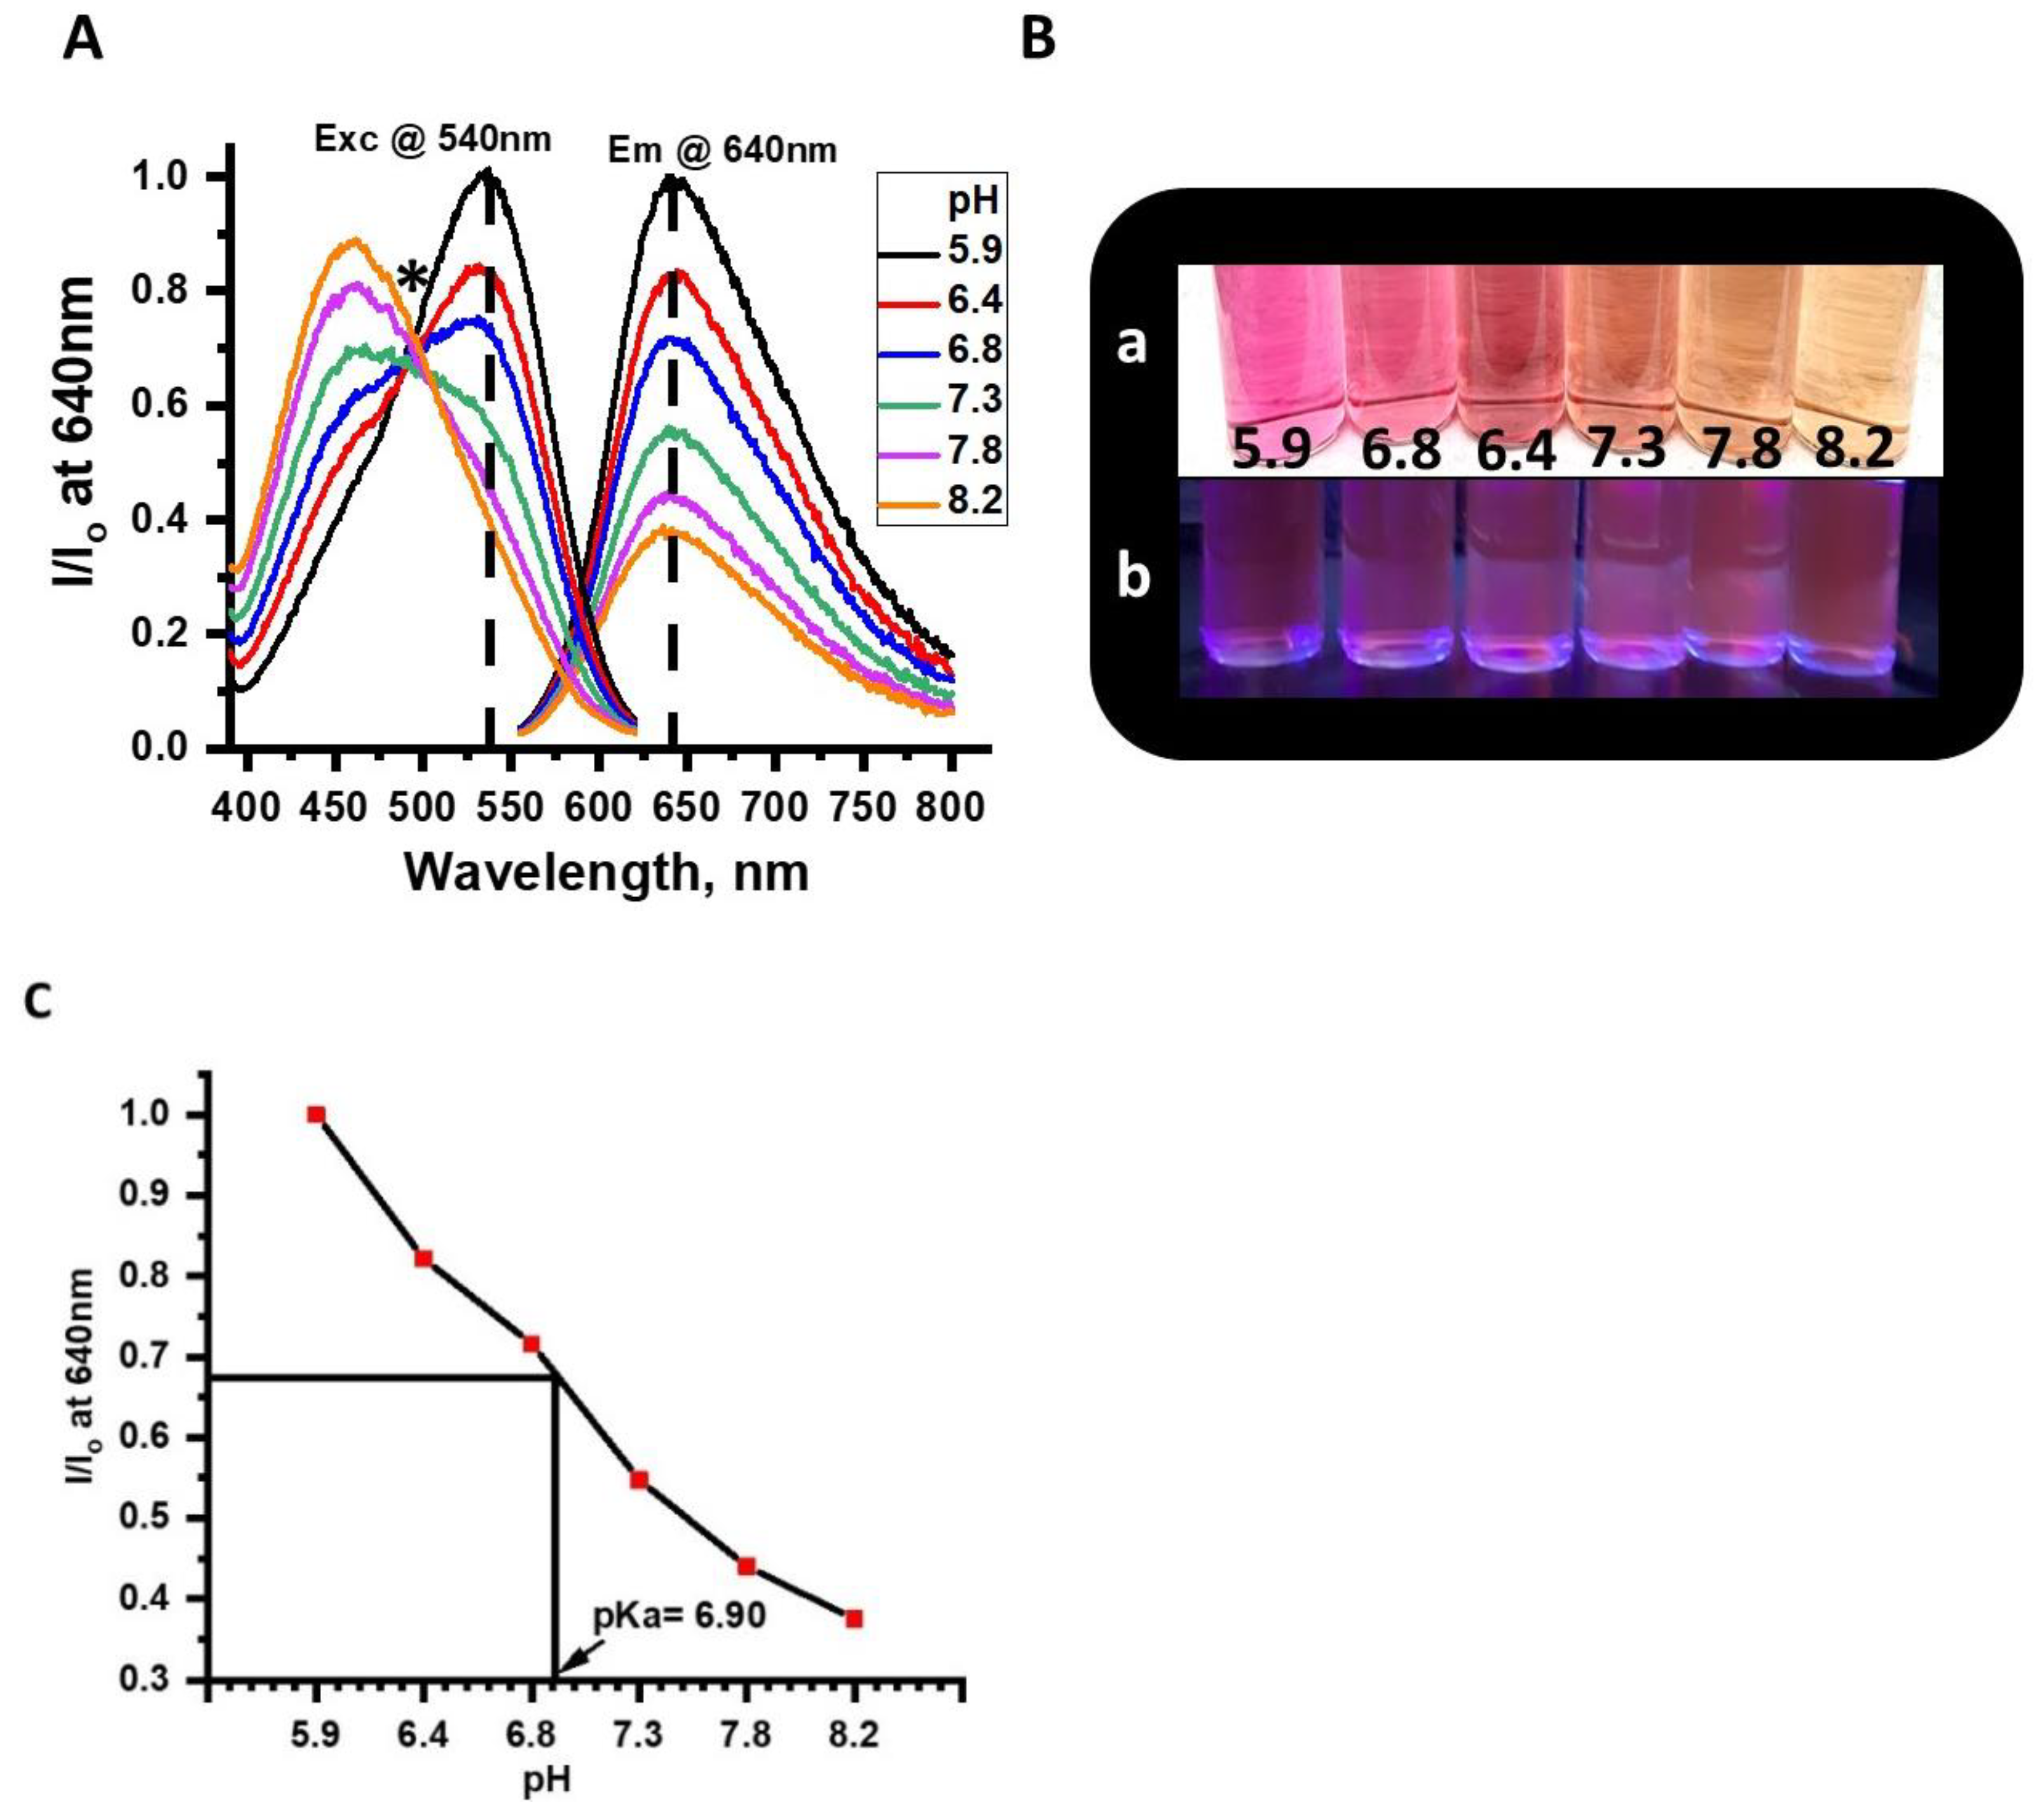
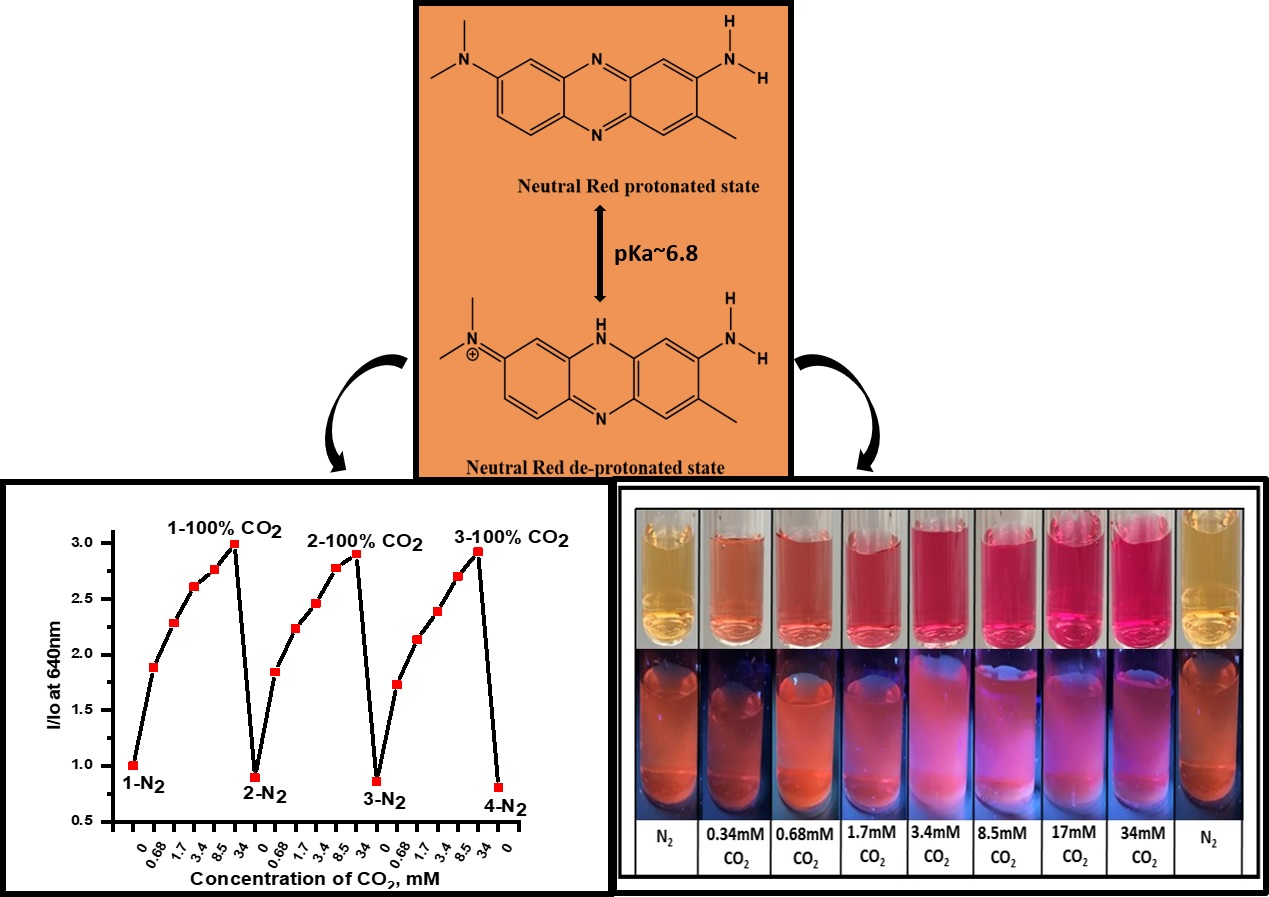
To further the development of a photo-luminescent CO
2 sensor and provide additional evidence for the significant changes observed in the absorbance of the NR solution under different concentrations of CO
2 gas, a series of fluorescence studies were conducted (
Figure 6). The NR solution showed significant shifts in emission intensity at pH 7.3 when purged with different concentrations of dissolved CO
2, 2% (0.68 mM), 5% (1.7 mM), 10% (3.4 mM), 25% (8.5 mM), 50% (17 mM) and, 100% (34.0 mM) (
Figure 6A). The NR solution exhibited > 10% signal change in absorbance as well as emission intensity at concentrations from 0 mM dCO
2. From these results, we concluded that changes in absorbance are greater than changes in emission. We suggest that the higher sensitivity of absorbance was due to an inner filter effect from the chromophore resulting in weaker fluorescence compared to its absorbance. Additionally, NR is known to exhibit self-quenching at higher concentrations, explaining the smaller changes in emission intensity vs. absorbance when exposed to dCO
2.
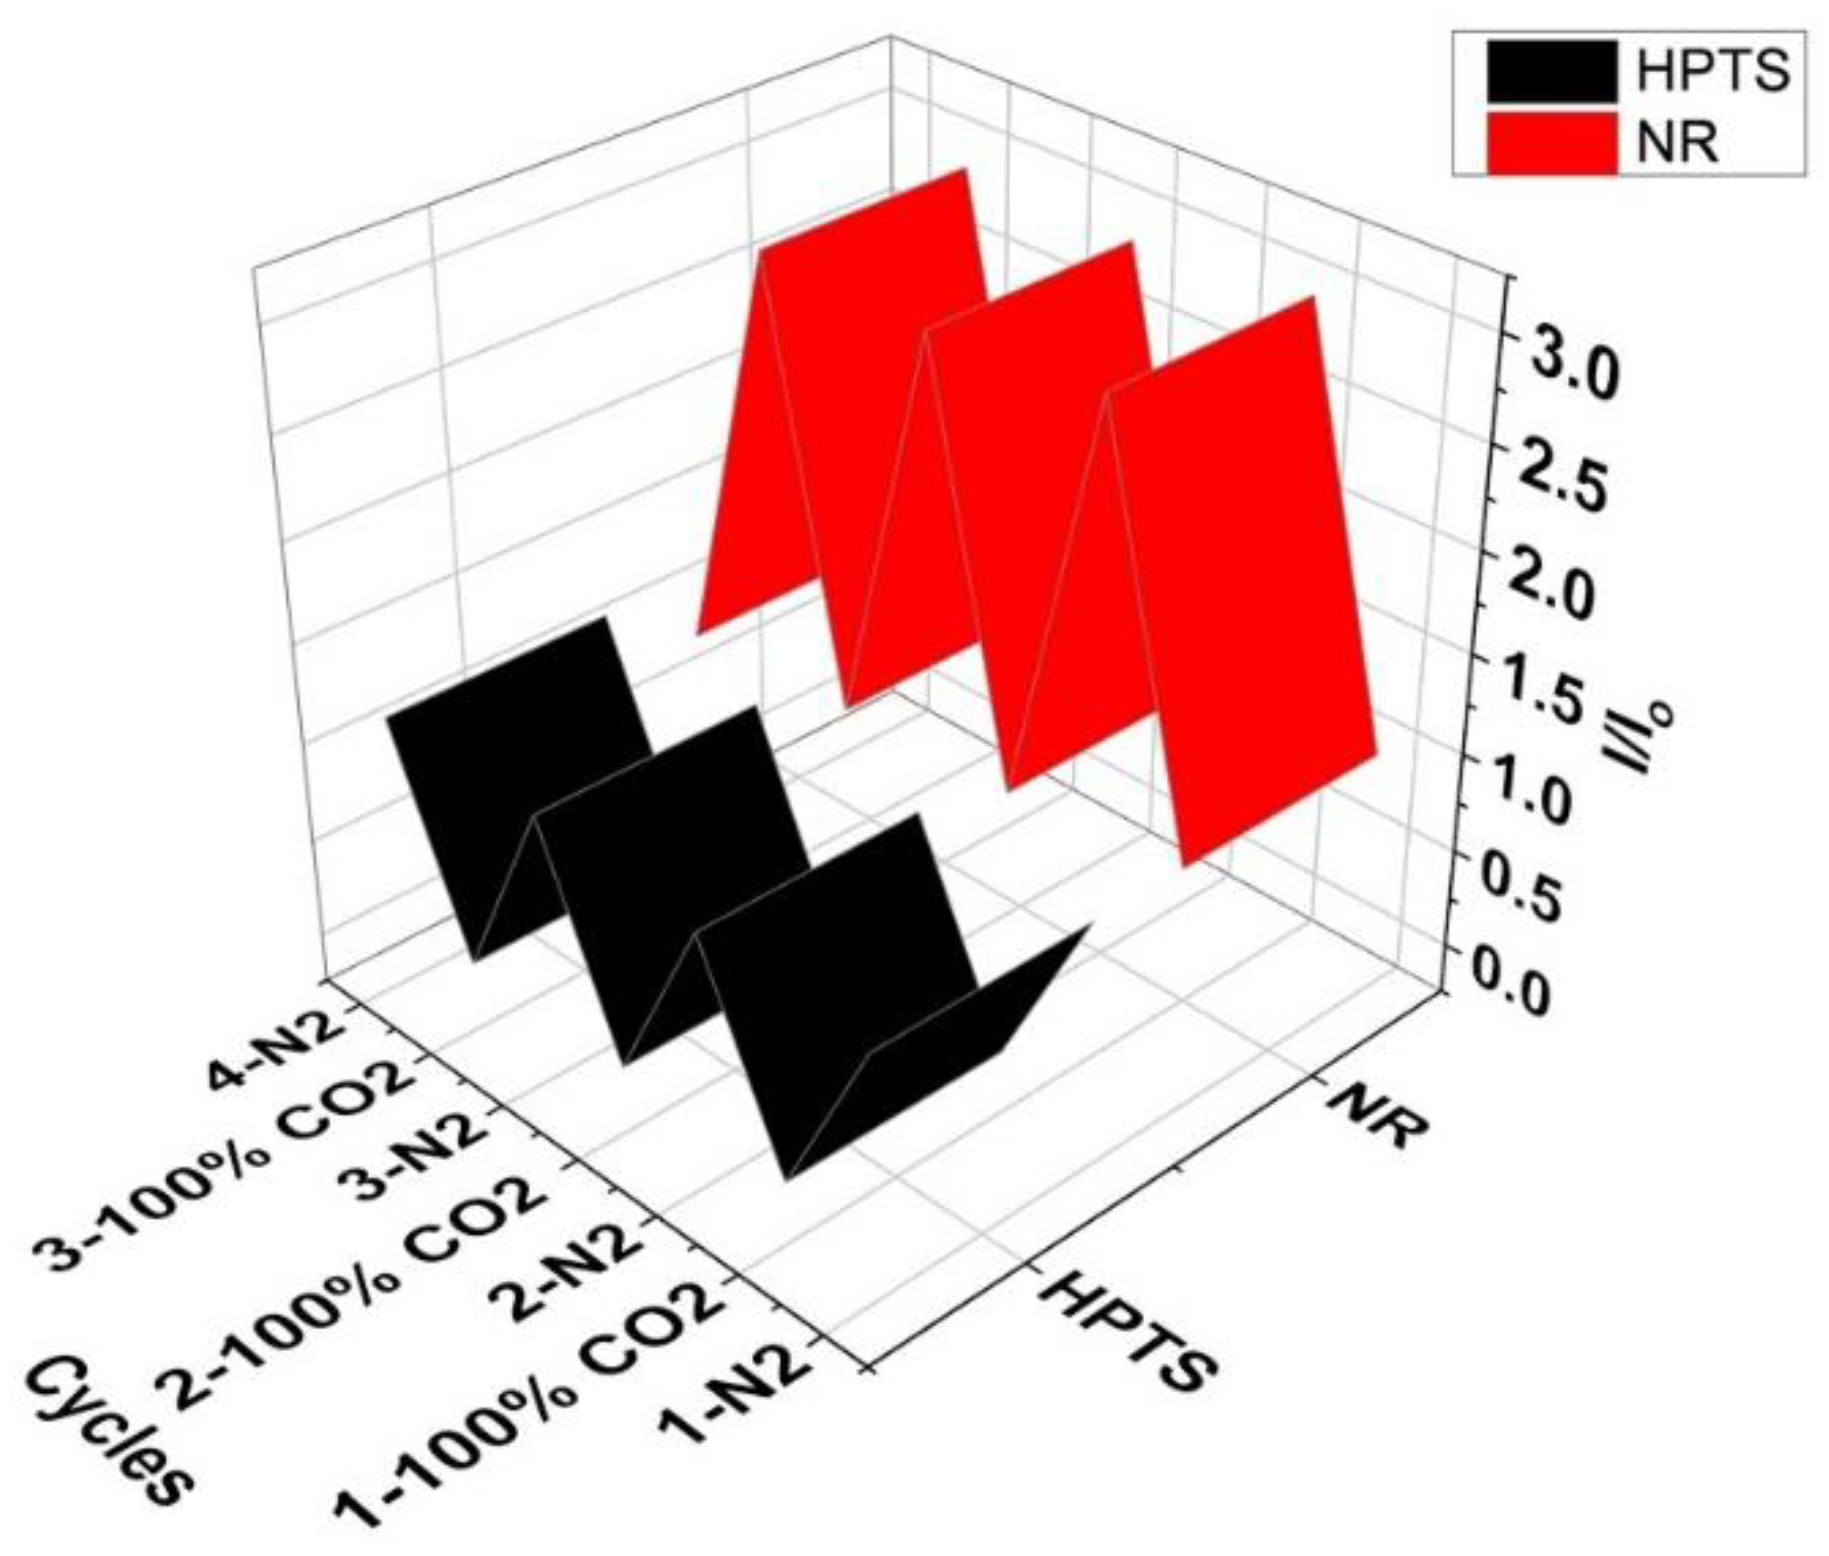
Figure 6B showed the drift in optical signal for three sensing cycles. Comparing emission intensities of different cycles at 100% (34 mM) dCO
2, I/I
o values drifted no more than 3.05% and less than 24.2% at 0% (0 mM) dCO
2 highlighting the stability of NR system for dCO
2 sensor studies. Further, the NR solution also exhibited changes in absorbance and emission intensity upon exposure to different concentrations of dCO
2 and exhibited reversibility upon purging with N
2 gas (
Figure 4 and
Figure 5). In
Figure 6C, clear changes in physical and emission color of the NR solution at different concentrations of CO
2 gas were observed and the % signal changes at different concentrations of dCO
2 for emission and absorption for NR solution are summarized in
Table 2. Based on the changes in A/A
o and using the 10% signal change rule the NR system can detect less than 0.68 mM dCO
2, and based on changes in I/I
o, the NR solution can detect as low as 2.0 mM dCO
2 in a buffer media of pH 7.3. Complete information regarding the sensitivity of the complex between any two concentrations of the gases is given in
Table S1.
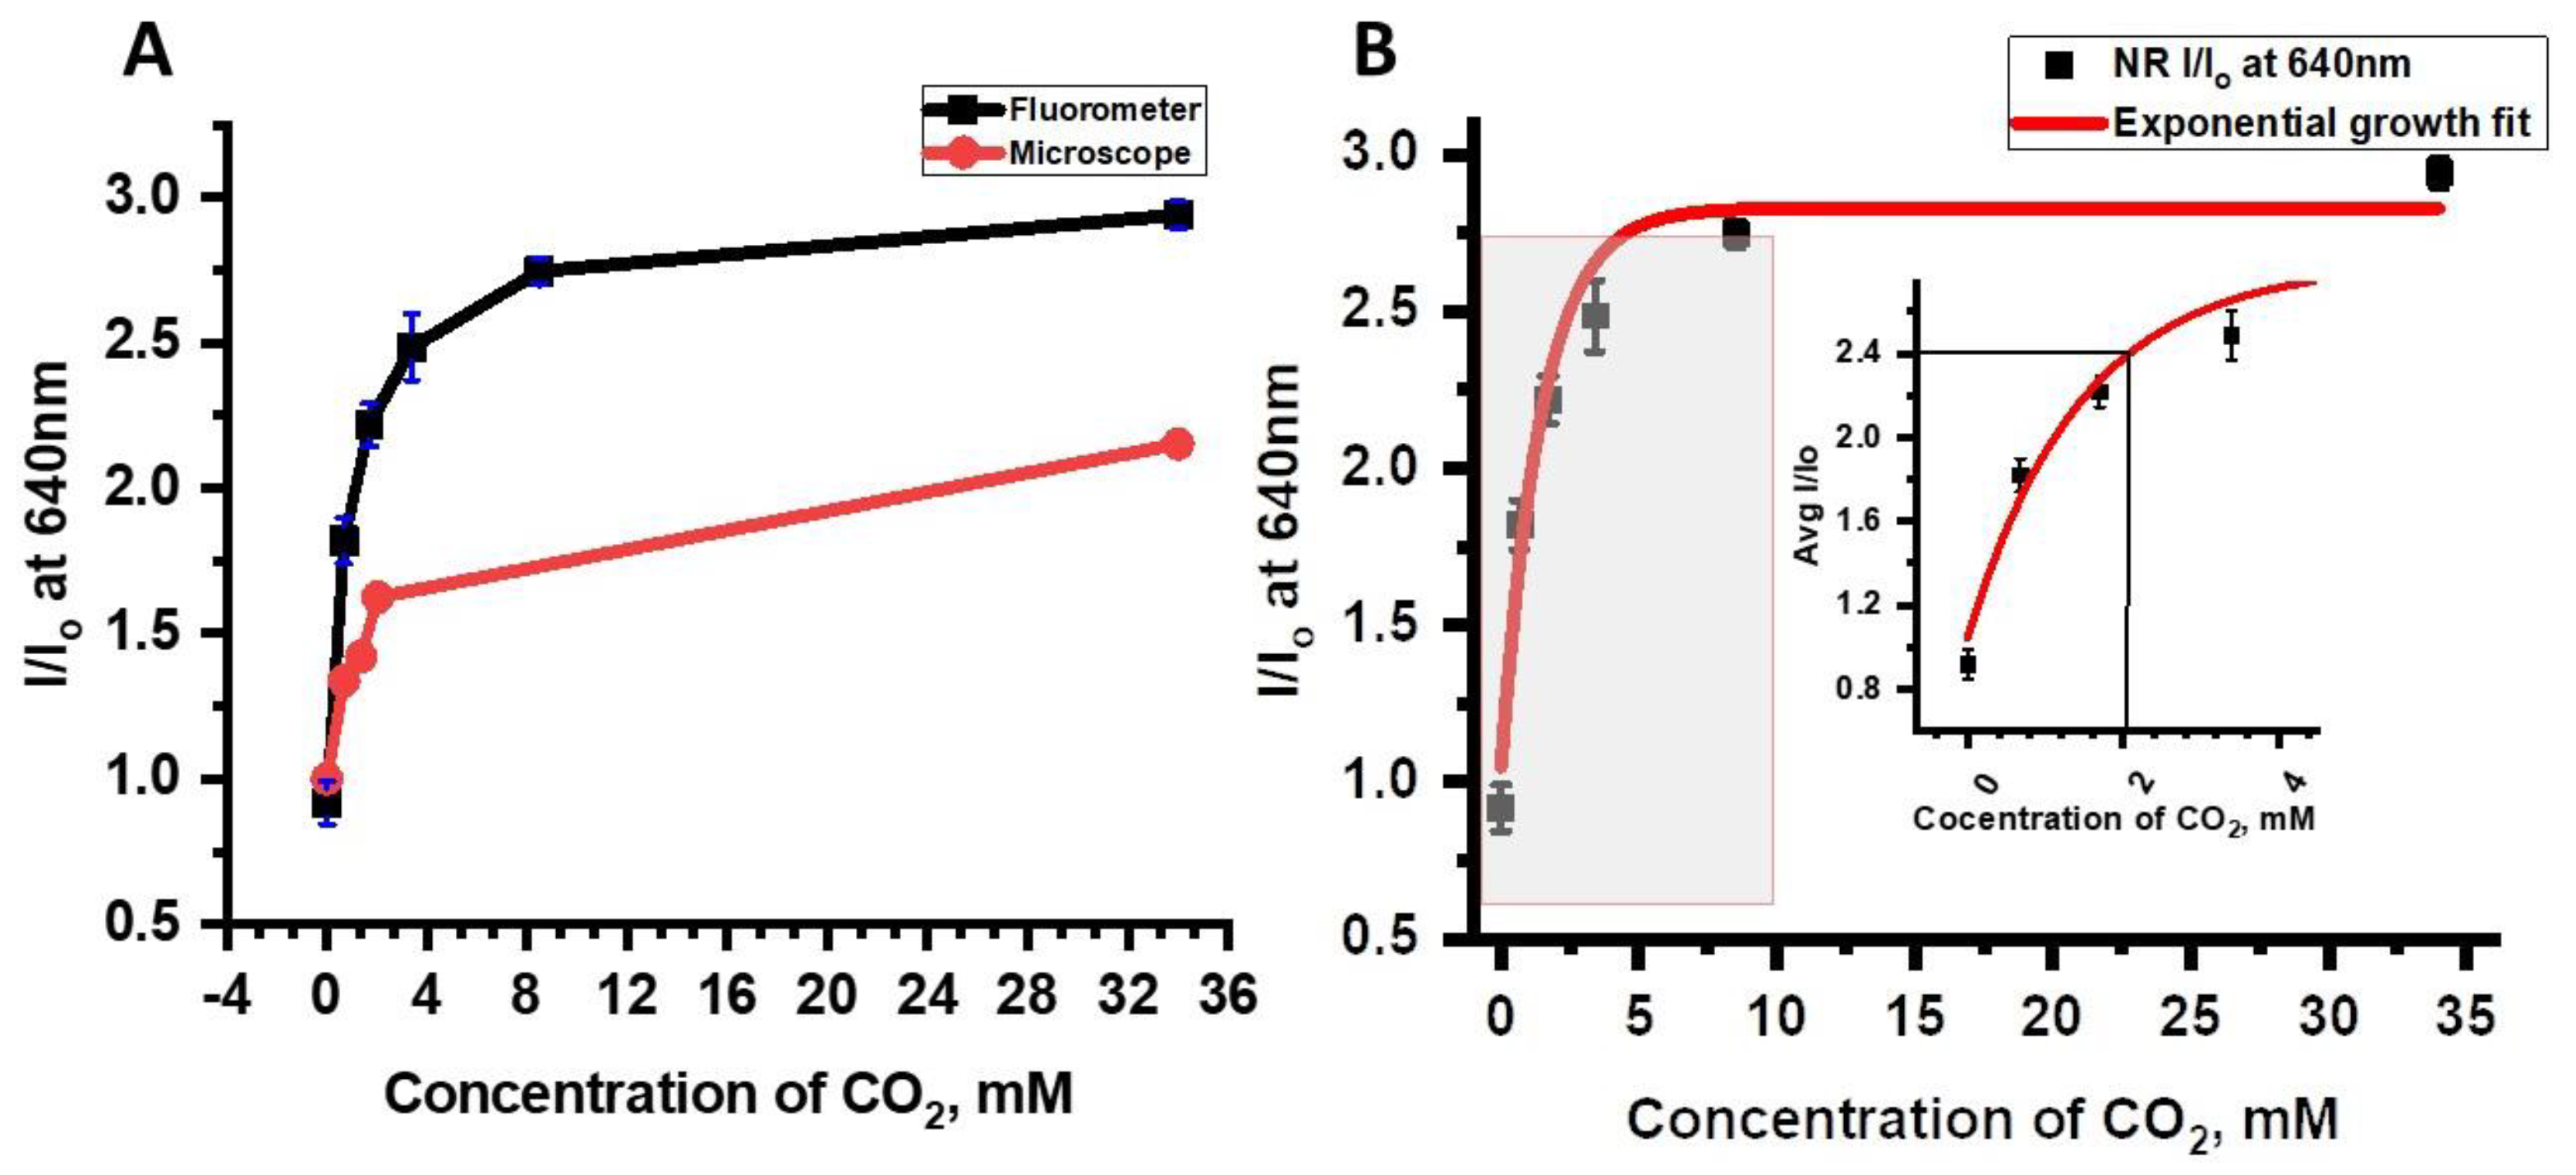
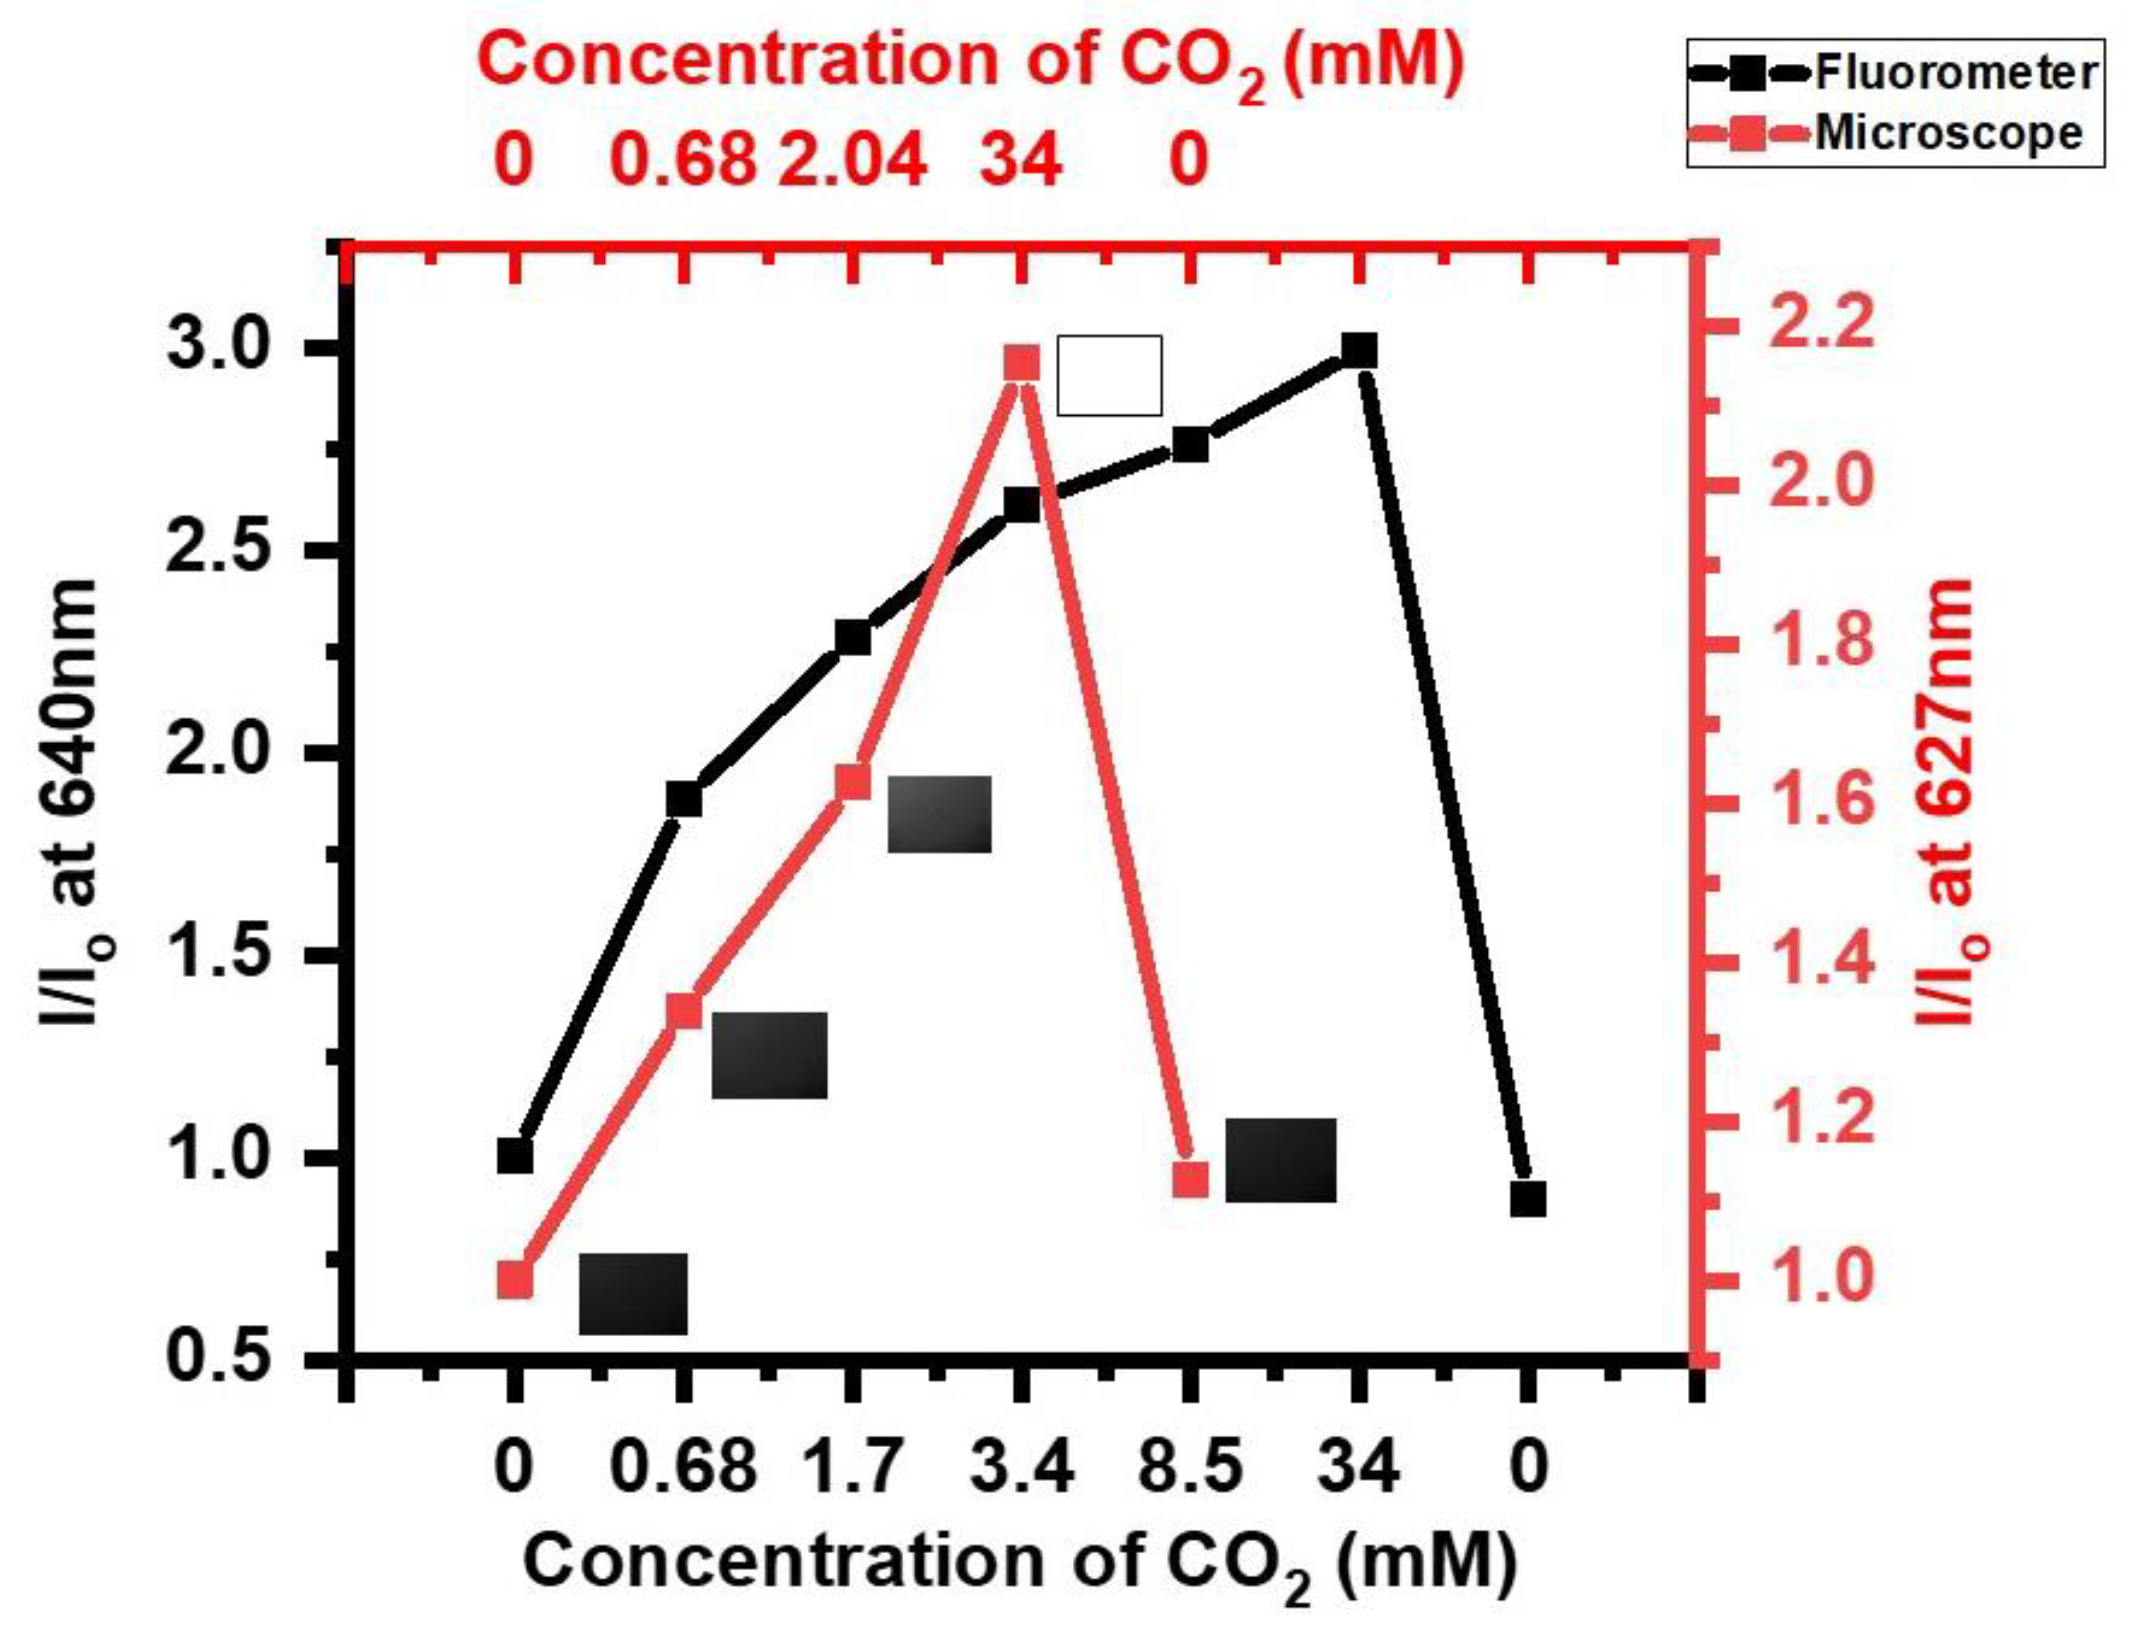
For the NR solution, emission results from both the fluorometer and the epifluorescence microscope studies showed that the NR has a high potential to be used as a CO
2 sensor in in vivo biological studies (
Figure 7). Data from the fluorometer and the epifluorescence microscope studies are compared to illustrate the differences in data calibration between the two instruments and to determine whether a single calibration can be used for both measurements. Data shown in
Table 2 illustrated quite clearly that the emission intensity signal changes at a given CO
2 concentration were much higher from the fluorometer than from the epifluorescence microscope. The higher emission intensity changes and better sensitivity measurements from the fluorometer resulted from the higher inherent sensitivity of the fluorometer and from differences in the CO
2 exposure method. In addition, the NR optical signal did not exhibit sensitivity to dissolved O
2 gas (refer to
Figure S4). This is important for an effective CO
2 sensor as interference caused by O
2 in the spectroscopic measurements is common due to the need for O
2 in all living aerobic systems.
After determining the CO
2 sensing properties of NR solution in phosphate buffer media, the sensing properties of NR solution were compared and benchmarked against HPTS in the same media and pH as NR (
Figure 8). For fluorescence measurements, HPTS was excited at 455 nm and changes in fluorescence emission signals were recorded for HPTS to compare response times, signal drift and percent emission signal changes with those of NR (
Table 3). Results showed that the NR solution optical signal exhibited faster responses and recovery times compared to HPTS. Specifically, the NR solution exhibited emission signal changes from 0 mM to 0.68 mM, 0.68 mM to 2.04 mM, 2.04 mM to 3.40 mM, 3.4 mM to 34.0 mM of dCO
2, in 1/4, 2/3, 1/6, and 1/4 less time, respectively, than HPTS.
Changes in signal drift with respect to different concentrations of dCO
2 of the NR solution compared to the HPTS solution as well as the percent (%) emission signal change data for both NR and HPTS and at any given dCO
2 concentration there was less percent signal change for NR than HPTS (
Table 4). For example, between the first and fourth N
2 cycle NR drifted down 24.2% percent while in contrast, HPTS drifted up by 13.5% and between the first and third 100% CO
2 cycle NR drifted up only 2.35% whereas HPTS drifted up to a much greater extent (43.7%). Further, it was clear that the NR exhibited enhancement in emission with increased carbon dioxide concentration while HPTS emission was quenching with respect to increased dCO
2 concentration at 455 nm excitation. In short, an increase in CO
2 concentration resulted in emission enhancement and thereby minimized noise-related issues in the NR system compared to HPTS. Several previous studies have shown that modifications or different formulations of HPTS can exhibit significant variations in sensitivity, response time, and stability [
1,
7,
12]. Yet, even without optimization, and under similar experimental conditions, HPTS exhibited higher sensitivity compared to the NR solution, however, the NR solution showed several other advantages over HPTS with respect to response time and signal drift. Therefore, from these results, we suggest that chemical modification of the NR molecule or variation of the formulation of the NR solution will result in a highly efficient dCO
2 sensor equal or better than that of HPTS [
1,
7]. Complete fluorescence data for these studies is given in
Figure S5.
Calibration curves were derived for emission changes (%∆) for data from the fluorometer and microscope, I/I
o values were plotted vs. dCO
2 concentrations (
Figure 9A). The best fit for the relationship between emission signal changes and dissolved CO
2, was found to be an exponential growth equation as determined by R
2 values (
Table 5).
Figure 9B provides the measurements for the calculation of the limit of detection for the NR solution when it was purged with different CO
2 and N
2 gases using Equation (1),
where, ‘S
y/x’ is the Residual Standard Deviation and ‘m’ is the slope of the calibration curve [
26]. The LoD was calculated using the fluorescence vs. CO
2 concentration plot followed by linear regression analysis. The resulting slope and residual standard deviation were then substituted in the above equation to get the LoD that was determined to be 2.11 mM dCO
2 concentration for which the signal-to-noise ratio (I/I
o) was found to be 2.398. The regression analysis is provided in
Table S2.
In summary, results from this comprehensive study provide evidence that NR may be used as a sensor to detect changes in CO
2 levels in the environment and may have the potential for measuring intracellular CO
2 levels within for biological analysis. The equilibrium concentration of bicarbonate (HCO
3−), carbonates (CO
32−) and dCO
2 in human blood is determined to be ~1.2 mM from the Henderson-Hasselback equation [
7]. At this CO
2 concentration and using data from
Figure 9, NR emission intensity would increase by 29.8% when using an epifluorescent microscope and by 126.07% using the fluorometer, therefore, it is probable that the percent signal change values can be easily differentiated from any background noise and even from high CO
2 concentrations in the medium, such as found in human blood. One of the largest disadvantages in Severinghaus electrodes for human blood analysis of dissolved carbon dioxide is the inability for continuous monitoring. Neutral Red has already shown the ability to stain lymphocytes of human blood [
27]. Optical sensors respond to pH changes due to changes in CO
2 concentrations in the medium, allows for continuous signal monitoring. Response times, and ionic buffer strength dependence would be important to consider for human blood analysis [
28]. In addition, the strong red emission and visible excitation offer numerous opportunities in the future for investigating the potential use of the NR to determine CO
2 concentrations in vitro or in vivo. When considering in vitro studies, it is important to note that neutral red has shown, when in concentrations smaller than 10
−4 M, it can intercalate with DNA and result in chromatin fluorescence [
15,
29]. Although, in vivo sensing studies must consider neutral red’s ability to absorb into acidic organelles, such as lysosomes [
14,
18]. Neutral Red also acts as a ligand upon complexation to riboflavin-binding protein [
30]. Based on this information from literature, optimization of NR formulation is required for overcoming interactions and interference while working with biological components, as expected. However, the strong red emission and visible excitation of the NR system should overcome any background autofluorescence from different biological components that are generally expected to emit in the UV, near-UV, blue and green regions.


 ,
, 


