Review

Novel Prostate Cancer Biomarkers: Aetiology, Clinical Performance and Sensing Applications

1
Glycanostics Ltd., Dubravska Cesta 9, 845 38 Bratislava, Slovakia
2
Institute of Chemistry, Slovak Academy of Sciences, Dubravska Cesta 9, 845 38 Bratislava, Slovakia
3
Center for Advanced Materials, Qatar University, Doha 2713, Qatar
*
Author to whom correspondence should be addressed.
Chemosensors 2021, 9(8), 205; https://doi.org/10.3390/chemosensors9080205
Submission received: 29 April 2021 / Revised: 6 June 2021 / Accepted: 30 June 2021 / Published: 4 August 2021
(This article belongs to the Section (Bio)chemical Sensing)

Abstract

:
The review initially provides a short introduction to prostate cancer (PCa) incidence, mortality, and diagnostics. Next, the need for novel biomarkers for PCa diagnostics is briefly discussed. The core of the review provides details about PCa aetiology, alternative biomarkers available for PCa diagnostics besides prostate specific antigen and their biosensing. In particular, low molecular mass biomolecules (ions and metabolites) and high molecular mass biomolecules (proteins, RNA, DNA, glycoproteins, enzymes) are discussed, along with clinical performance parameters.

1. Prostate Cancer

Prostate cancer (PCa) is the second most common type of cancer among men and the fifth most common cause of male mortality globally with up to 1.28 million new cases reported in 2018 worldwide and with 358,989 associated deaths [1,2]. PCa disease is quite often indolent and only requires active surveillance and therefore, in order to avoid overtreatment, PCa screening is recommended for men of 55+ years [1,2,3,4]. Since the PCa incidence will further increase to 2.1 million by 2035, accurate early stage PCa diagnostics is very important [5]. The traditional PCa biomarker, i.e., a level of prostate specific antigen (PSA), is not sufficiently reliable, affording high false negative and high false positive results. The analysis of PSA in serum provides the following diagnostic performance with AUC (area under the curve, i.e., receiver operating curve) of 0.68: (i) at a cut off value of 4.1 ng mL−1: sensitivity 20%, specificity 94%; (ii) at a cut off value of 2.6 ng mL−1: sensitivity 40%, specificity 81% [5]. This is why, in order to detect PCa at an early stage and to avoid unnecessary biopsies, several liquid biopsy-based approaches have been developed with a better clinical performance than PSA level analysis [6]. Small metabolites, mRNA, micro RNA (miRNA), tumour DNA, proteins and glycans as novel biomarkers have been used as promising biomarkers for PCa screening and disease management [7,8].
As already discussed elsewhere, serum levels of total PSA (tPSA) and any derived measurements (fPSA%, PHI, 4K score, PCA3; fPSA% stands for percentage of free PSA form (fPSA) divided by tPSA; PHI stands for Prostate Health Index) [9] are commonly applied to PCa diagnostics. For example, the diagnostic performance of PHI to discriminate between PCa patients (tPSA of 2.6–40.6 ng mL−1) and benign prostatic hyperplasia (BPH) patients (tPSA of 3.9–14.5 ng mL−1) showed an AUC of 0.74; sensitivity 84% and specificity 45% [5]. However, since PSA is more tissue-specific than cancer-specific, and increased levels are often associated with increased prostate volume, causing poor predictability of PCa in older men suffering from BPH, markers with higher positive/negative predictive values are needed. At the same time, there is an ongoing search for markers with high discrimination power in the “grey zone” (tPSA = 4–10 ng mL−1), while some markers, such as the neutrophil-to-lymphocyte ratio, are known to be elevated for clinically relevant PCa with tPSA levels ≥ 20 ng mL−1 [10,11].
This review provides an aetiological introduction to possible PCa biomarkers with a focus on detection of small metabolites and glycan-based biomarkers. Novel types of PCa biomarkers based on miRNA and proteins are also briefly discussed. The reader is advised to read a review paper with a focus on protein analysis [12] and on clinical challenges in PCa diagnostics [13].

2. Ions and Small Molecules as PCa Biomarkers

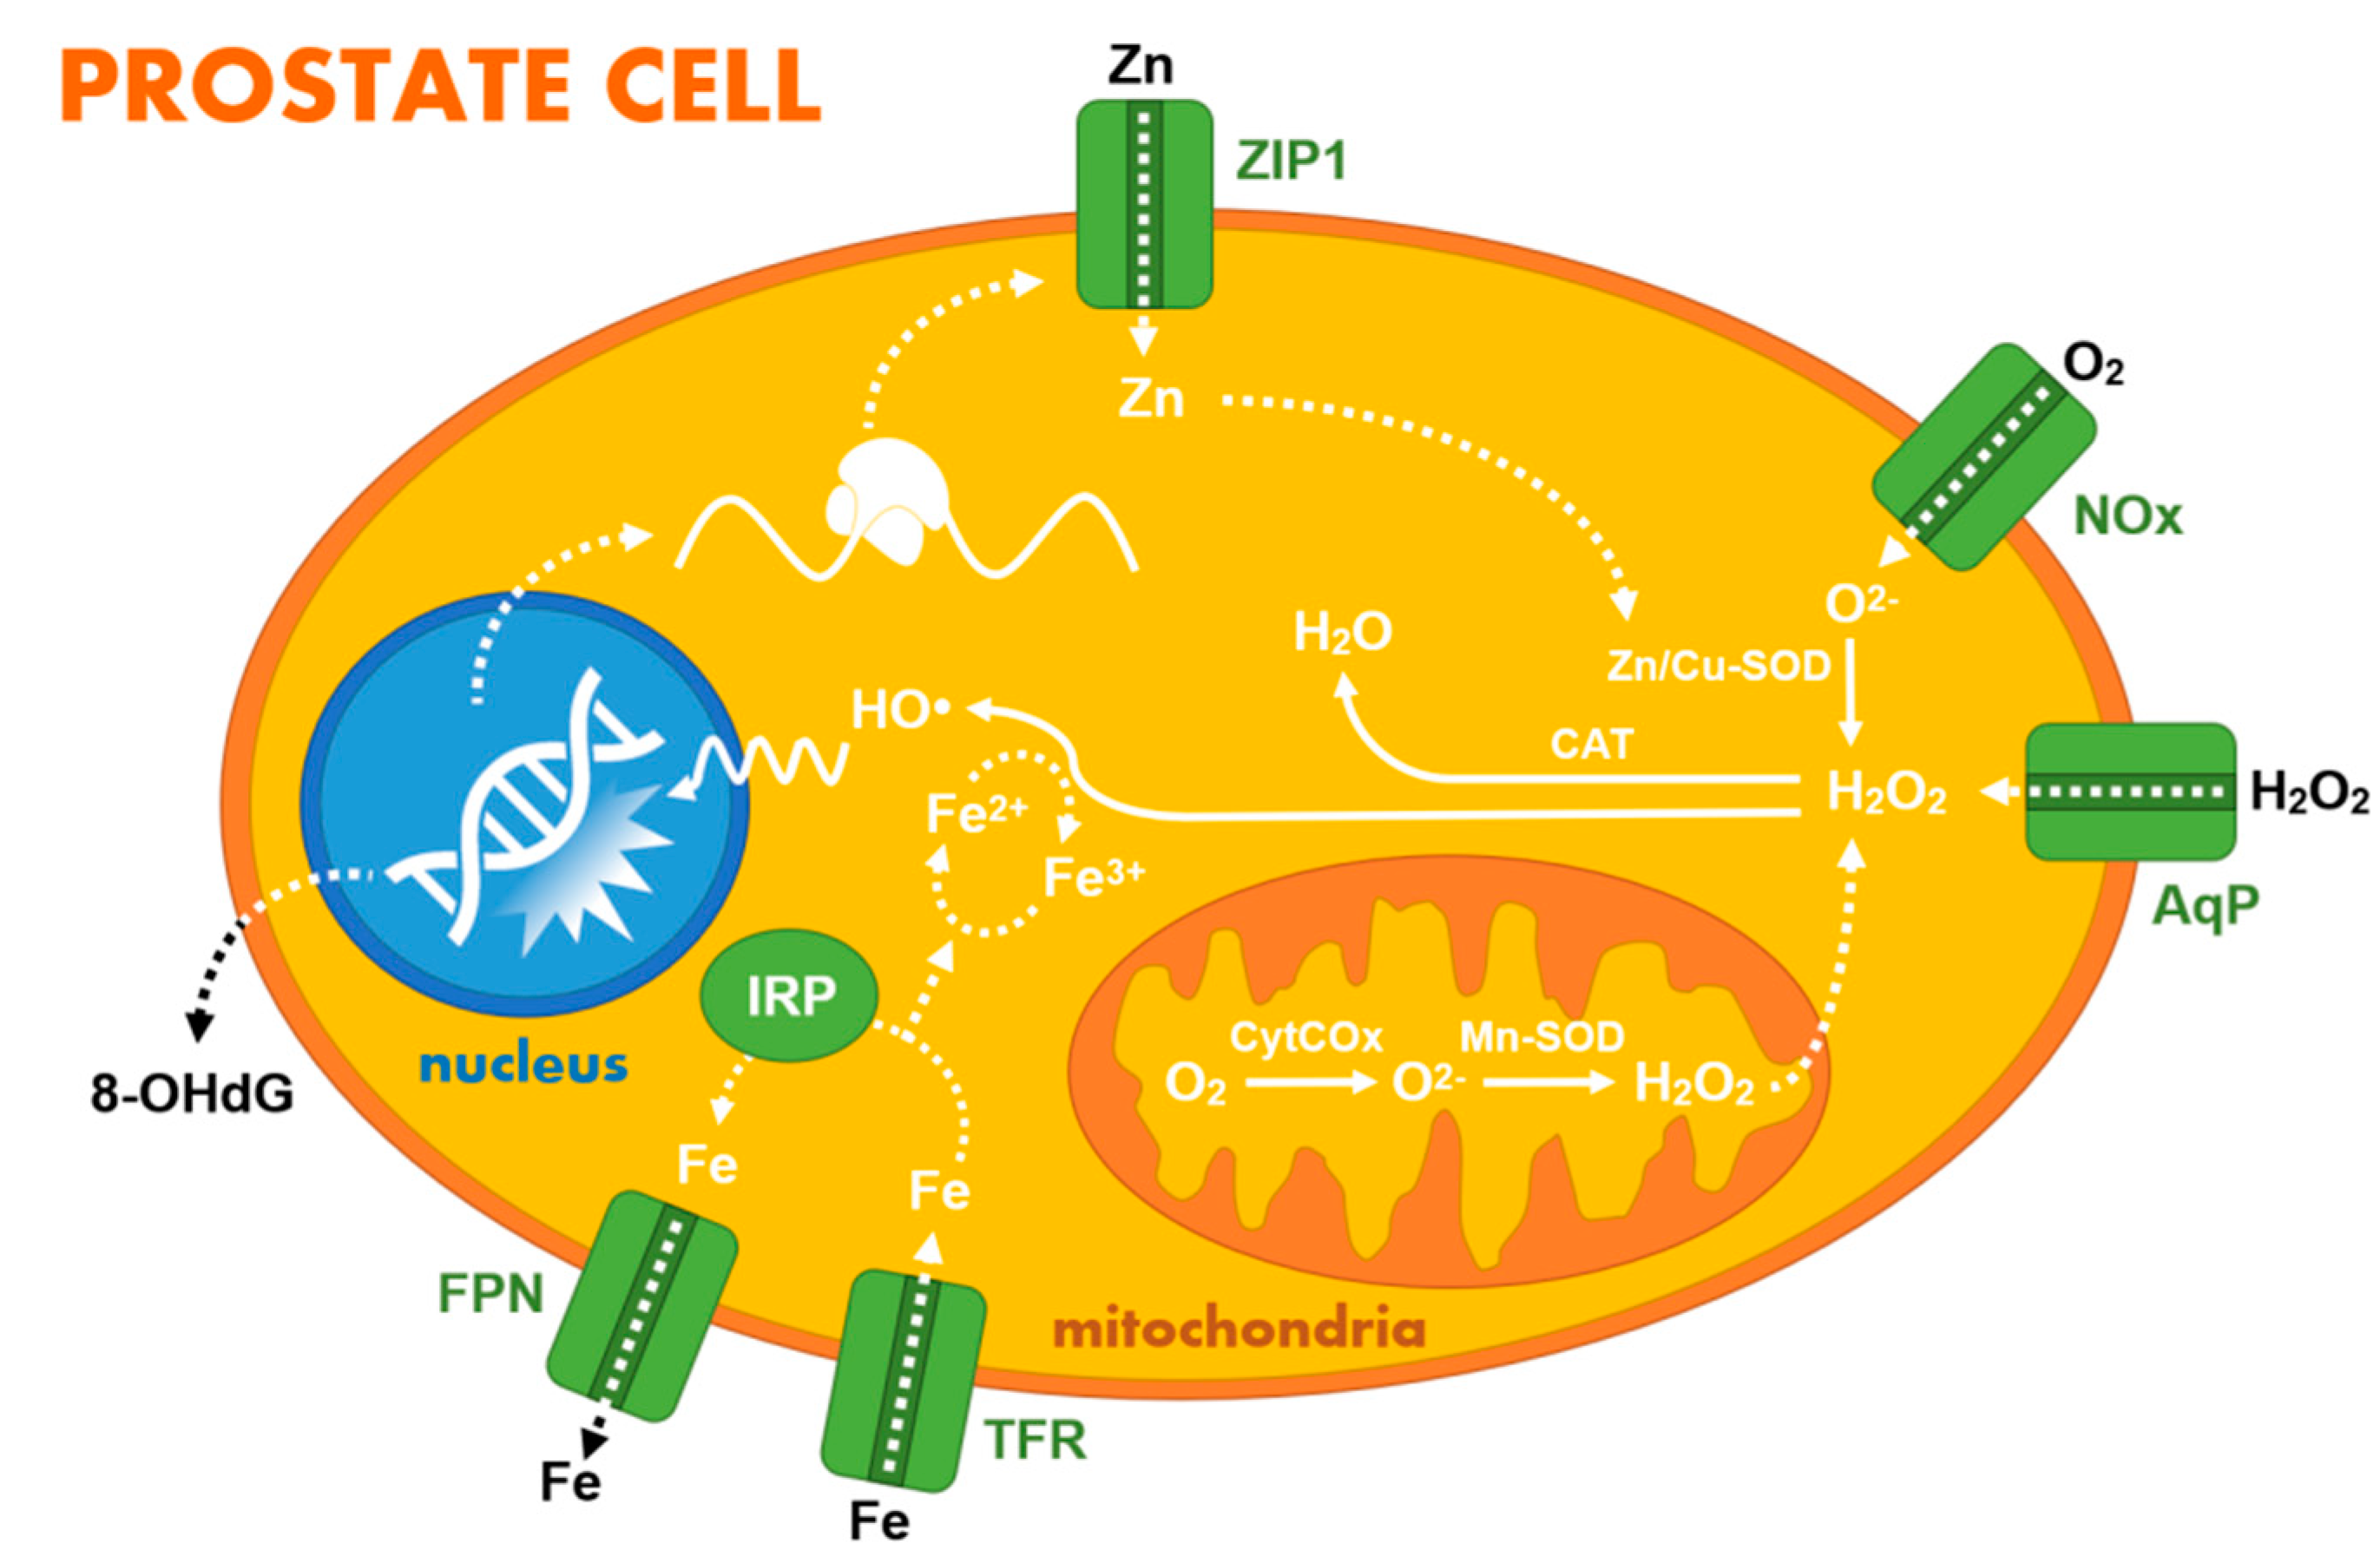
Although the most commonly used biomarker for the diagnostics and monitoring of prostate conditions, including cancer, is PSA and its different forms, there are others which may significantly contribute to differential diagnosis. Age and ethnicity are common risk factors for PCa, with 97% of incidence after 50 years of age and with the highest mortality rates in black men (about 2.5 times higher chance than in white men) [14,15]. Usually, the quantification of PSA in serum is involved in diagnostics using immunoassay techniques, which are less affordable in developing countries. Different PCa markers have already been described in blood, urine, semen, or tissue, with urine being the most sought-after matrix for PCa diagnostics due to the non-invasive nature of its collection [16]. Standardisation of protein concentration in urine samples is almost impossible due to the biological variation in urine composition and its dependence on different factors. For example, proteinuria is defined as a total protein concentration ≥150–300 mg L−1 [17]. Along with other proteins, PSA is also present in urine. Increased urinal PSA concentrations might be achieved after a prostate massage/DRE exam or due to disease progression. Very recently, the use of ionic liquid-based aqueous biphasic systems (biological Good’s buffers and K3C6H5O7 salt) has been introduced as an effective pre-treatment of human urine (a less complex, non-invasive matrix compared to human serum) for PSA detection and quantification [18]. This review summarises not only the clinical aspects of individual markers and the performance of devices and assays analysing these molecules, but also the biochemical pathways leading to their occurrence (Figure 1). This may be considered the other side of the same coin, since knowing these pathways may lead to an explanation as to why, in some cases, these markers offer only poor information about a particular disease, even though the diagnostic assay itself is quite reliable (or vice versa).

2.1. Zinc Homeostasis and Its Diagnostic Value

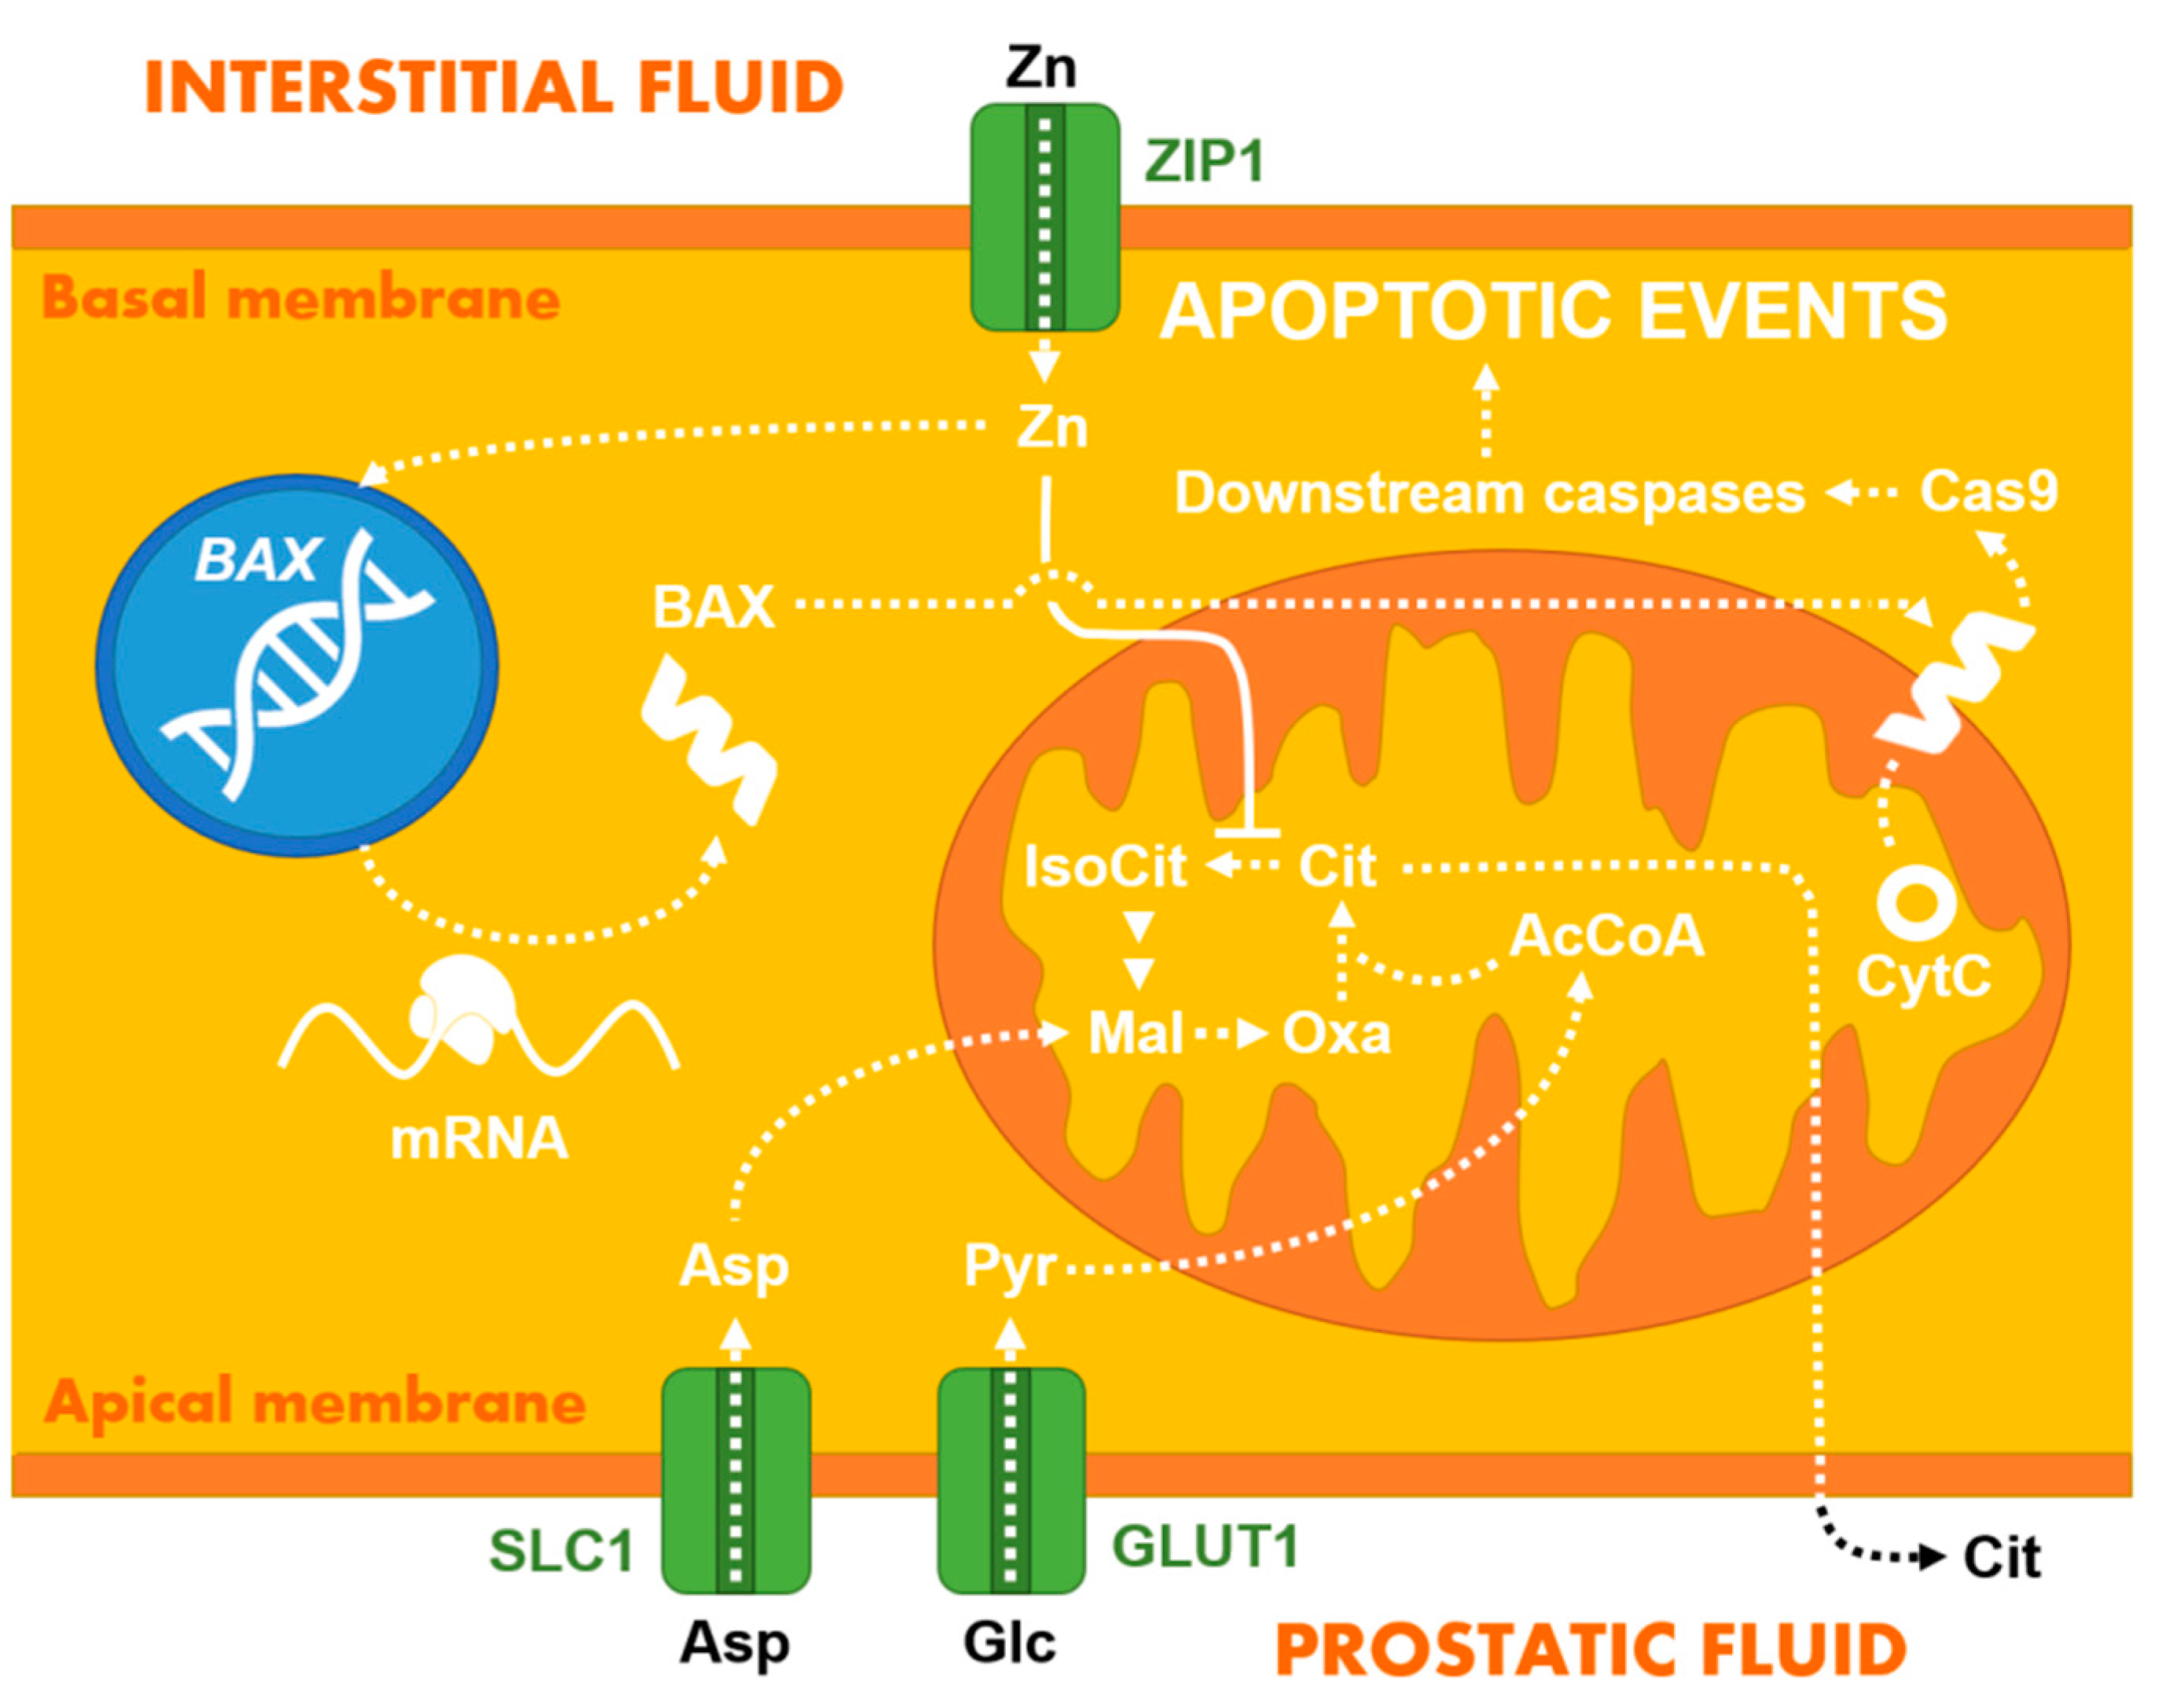
Urine is a mixture rich in many ions, small inorganic, and organic compounds. Among these, zinc cations might play an important role in cancer detection. Zinc is known to play an important role as a part of protein structures (e.g., zinc fingers) and a structural component of cell structures, cell proliferation, differentiation, DNA/RNA synthesis, redox regulation, and apoptosis or immune response (comprising innate, adaptive immunity and even autoimmune pathologies) [19,20]. Zinc homeostasis, critical for virtually all cells, is regulated by the influx/efflux of zinc ions by several transporters [21]. Prostatic tissue, along with other soft tissues in the human body, accumulates a huge amount of zinc. An increased intracellular zinc concentration leads to its accumulation in mitochondria and directly inhibits the conversion of citrate to cis aconitate, a reaction important for the Krebs cycle, causing citrate to occur in higher concentrations in a prostatic fluid. Diminishing any further reactions by this single step reaction leads to depletion of the energy supply for excessive cell proliferation with an inhibition of malignant transformation of prostate epithelial cells. Ultimately, PCa cells contain lower amounts of zinc than normal prostatic tissue [22,23]. Analysis of zinc concentration in serum samples is of great importance in PCa screening. A comparative meta analysis proved significantly lower serum zinc concentrations in human PCa patients compared to sera from individuals suffering from BPH [24].
The human ZIP1 gene for the zinc transporter 1 precursor is usually down-regulated in malignant prostate cells [23], hence the diminished ability of PCa cell lines to enrich in Zn2+. Other examples of membranous proteins with an aberrant expression in PCa cells include a prostate specific membrane antigen (PSMA, a transmembrane glycoprotein exhibiting a hydrolytic activity with a prognostic value also) [25,26] or the nuclear receptor superfamily of androgen receptors, playing an important role in castration-resistant prostate cancer [27]. Compared to non-malignant cell lines, in the RWPE-1 cell line (non-neoplastic adult human prostatic epithelial cells) a lower level of zinc content was detected [28]. This can be effectively used for in situ fluorescent zinc-sensing for early PCa diagnostics.
A good example is a dansyl-Gly-Pro-Trp-Gly-NH2-based fluorescent sensor, where a fluorophore (a dansyl group) is an electron acceptor, Gly-Pro is the linker, Trp is the binding group, and the rest of the molecule is hydrophilic. In a Zn-rich environment, usually quenched fluorescence is “turned on” due to interrupted electron transfer, with Zn concentration as low as 49.7 nM [29]. Endogenous Zn-sensing was also used by Fu et al., where the authors prepared a novel diketopyrrolopyrrole (DPP)-based fluorescent zinc ion probe designated as DPP-C2. The fluorescent intensity was directly proportional with the environmental zinc concentration and distinguished malignant DU145 and PC3 cells from normal prostate epithelial cells (RWPE-1) [28]. Photoactivation (UV light-induced removal of protecting groups) of Zn-binding sensor molecules and their application in vivo has also been reported [30]. An electrochemical method for selective mobile Zn2+ ions detection in real sera based on screen-printed electrodes (SPE) has been introduced recently [31]. SPEs modified with zincon and an electrochemically exfoliated graphite composite were able to detect Zn2+ down to 5 μg mL−1 using differential pulse voltammetry (DPV) with pre-concentration and electrodeposition steps. Although this sensor was cheap, reproducible (RSD ≤ 7%), and stable for several weeks, the measurement of Zn2+ currently remains useful only as an analysis complementary to that of other PCa markers, being especially useful for measuring intracellular zinc content (i.e., after initial prostate biopsy).

2.2. Other Ions, Hydrogen Peroxide, and Small Organic Molecules

While a clear association between levels of zinc and iron and biochemical recurrence in PCa was proved using tissues from prostatectomy, selenium and cadmium could not be effectively used to distinguish the cancerous tissue [32]. Another study also proposed other heavy metals, namely Mn, As, and Sb, to be significantly and positively associated with PCa [33]. It is worth noting, however, that iron dysmetabolism is a common feature of not only PCa (where iron plays an important role in tumour proliferation), but also of different types of cancer cells in general, involving changes in expression of iron importers (transferrin receptors, TFRs), intracellular regulators (responsive element binding proteins, IRPs) or exporters (ferroportin, FPN), which makes these proteins also a therapeutic target [34]. Divalent ions, along with glycosaminoglycans, play a crucial role in the central processes of cell migration, angiogenesis, and extracellular matrix remodelling, thus being associated with a metastatic potential of various tumours [35].
Usually, the information about iron concentration is extracted from the measurements of living cells or tissue samples, using for example an anthracene-based fluorescent probe containing benzothiazole group (BFA), which interacted with Fe3+ and Cr3+ even in vivo (using PC-3 PCa cell line) down to 450 and 460 nM, respectively. Although some novel devices have been developed to detect iron directly in serum samples, such as robust dry sensor strips based on colour change upon chemical reaction and smartphone application [36] or graphene-based field-effect transistors with anti-ferritin antibodies (detecting ferritin down to 10 fM, albeit measured in a buffer), these analyses are more suited to the diagnostics of nutritional disorders and iron deficiency [37].
It is well known that PCa cells/samples (e.g., LNCaP cell line) often overproduce H2O2 and overexpress NADPH oxidase (NOx), resulting in increased intracellular reactive oxygen species (ROS) levels [38]. Furthermore, increased ROS production is, similar to PCa itself, associated with increasing age, and thus ROS may help not just to initiate but also to advance tumour growth [39]. Since supraphysiological levels of H2O2 exhibit cytotoxic effects on cells, the results from a phase 1 clinical trial focusing on the effect of H2O2 with radiation therapy on breast cancer were published recently, showing that H2O2 is a well-tolerated enhancer to radiotherapy itself [40].
Electrochemical detection of H2O2 was performed using horseradish peroxidase (HRP) conjugate i.e., HRP-AuNPs-polyethylene glycol (PEG) polymerised onto Au electrodes in vitro. Due to the excellent antifouling properties of PEG and the diffusion of molecules into a hydrogel layer, production of H2O2 by PC3 cells was measured by cyclic voltammetry (due to a change in a cathodic current correlating with H2O2 concentration, with LOD = 10 nM) [41]. Another recent study suggests the use of a new pyrene-based compound (Py-VPB) as H2O2 fluorescent probe for intracellular detection in vitro and in vivo. Using HeLa cell line, H2O2 was visualised inside mitochondria [42]. The most significant ions and small molecules, including their importers and mechanisms of oxidative DNA damage, are shown in Figure 2.
Over the past decade, a novel class of inorganic 2D nanomaterials, MXenes (transition metal carbides, nitrides or carbonitrides), have been extensively studied. As shown recently, Ti3C2TX MXene could be effectively used to detect H2O2 down to nM level [43]. In addition, we coupled the H2O2 sensing with a simple reaction catalysed by sarcosine oxidase (SOx, FAD-containing enzyme) by converting sarcosine (N-methylglycine, non-proteinogenic amino acid, intermediate in glycine metabolism and a potential PCa marker) to glycine and HCOH, generating H2O2 subsequently detected by MXene/chitosan/SOx nanocomposite even in urine samples (LOD = 18 nM) [44]. Moreover, sarcosine was only recently shown to increase cellular methylation potential (increase in methylated CpG islands) exclusively in prostate cells, thus being an epigenetic modifier [45]. Since the study by Sreekumar et al. [46] was published, elevated levels of sarcosine (from 20 nM to 5 μM) have been recorded in PCa patients [47,48,49]. In the past, a number of attempts were made to detect sarcosine, mostly using SOx and a combination of different (nano)materials, by electrochemical (amperometric, potentiometric, or impedimetric) or optical (e.g., fluorimetric) methods. An overview of the different platforms, surface modifications and biosensor performance parameters are provided in Table 1. Common immobilisation strategies published to date include covalent attachment of the SOx enzyme on a solid support, bearing carboxy groups using common amine coupling (EDC/NHS) or crosslinking using glutaraldehyde [50]. For some materials, their biocompatibility must be taken into account, as well as their repeatability/long-term storage.
Despite some controversy and conflicting results surrounding sarcosine as a PCa biomarker [47], where its use was actually disproved as a reliable serum PCa marker (whether it was localised or metastasised castration-resistant PCa) [51], it can be effectively used for urine samples. On ~500 individuals cohort, AUC to distinguish PCa individuals from a control group yielded AUC of only 52.2%—even lower than a PSA marker in a range from 2 to 10 ng mL−1 (54.3%) [52]. Urinary sarcosine shows better results, however. Wang et al. also proposed the sarcosine/creatinine (Sar/Cre) ratio as a novel diagnostic and prognostic marker of PCa. While in a cohort of patients with tPSA ≤ 10 ng mL−1 the AUC value for Sar/Cre was highest, i.e., 0.855 (CI95% = 0.802–0.908), the AUCs for tPSA and fPSA% were 0.743 and 0.745, respectively. In addition, there was a significant difference in the urinary Sar/Cre ratio in PCa patients with Gleason score ≤ 6, 7, and ≥8, and between patients with metastatic and non-metastatic PCa [53]. Another study, however, showed that sarcosine or uracil levels in urine alone could not identify PCa patients, as opposed to kynurenic acid (L-tryptophan metabolism product) used as a biomarker, which outperformed PSA [54].
Besides sarcosine, other small inorganic, organic (even volatile) molecules, electroactive species and metabolites which are present in blood, urine and also in tissues were briefly considered as possible markers for PCa [55,56]. Prostate tissue is quite specific in some ways, since it produces a prostatic fluid rich in PSA, polyamines (such as spermin) and citrate. Citrate, normally oxidised in the Krebs cycle by mitochondrial aconitase (inhibited by high Zn concentrations, see above), is accumulated and secreted in prostate cells, making citrate concentrations a possible PCa marker, since PCa cells are unable to accumulate zinc [57]. Using MS/MS, metabolites from different metabolic pathways were identified (i.e., associated with taurine metabolism [58,59] and with metabolism of arginine and branched chain amino acids [60]). Fatty acid substances (acylcarnitines, choline) in blood could also be effectively used to distinguish PCa from BPH patients (with a sensitivity and specificity of 81.5% and 75.2%, respectively), when combined [61]. Although some metabolites are aetiology-related, citrullin was identified as a possible marker for subclinical PCa [62]. High serum homocysteine, cystathionine, cysteine or methionine levels independently predicted a risk of a disease recurrence and its aggressiveness [63], using 11C-methionine as a radiotracer [64] in imaging techniques. A combined marker—ratio of choline + spermine (as the main polyamine) + creatine over citrate [(Cho+(Spm+)Cr)/Cit] was successfully used as a PCa biomarker in (1)H MR spectroscopic imaging ((1)H-MRSI) of the prostate [65].
Table 1. Basic operational parameters for sensors detecting sarcosine.
DetectionSurface ModificationLOD
(nM)
Linear Range
(µM)
RT
(s)
Stability (h)ApplicationRefs.
Amper.PVA-Ag/AnNPs-pphTEOS-SOX/GE5000.5–7.517-Aq. media[66]
Amper.SOX/EDC/NHS/Au/ZnONPs/SPEs160.01–0.1-60 dSynth. urine[50]
Amper.SOX/CHIT/CuNPs/cMWCNT/AuE0.00010.1–1002180 dSerum[67]
Amper.SOXNPs/AuE100.1–1002180Urine[68]
Amper.SOX/Pt@ZIF8/GCE10605–30-3Aq. media[69]
Amper.Nafion-SOX/Pt/AAO500.05–100--Aq. media[70]
Amper.SOX/Pt/OIHMMP/GCE1301–70--Serum[71]
Amper.SOX/PAA/GCE0.40.001–0.05-15 dUrine[72]
Amper.SOX/Pt-Fe3O4@C/GCE4300.5–60--Serum[73]
Amper.SOX/chitosan/Ti3C2TX/GCE180.036–7.82-Synth. urine[44]
Amper.Fe3O4@ZIF-8@MIP/AuE0.00040.000001–0.0001-5 wUrine[74]
Potent.MIP-based sensor0.140.001–10<120>5 mAq. media[75]
Potent.GO based nanocomposite3.30.01–100603–4 mAq. media[76]
Potent.Non-GO based nanocomposite0.0050.001–10603–4 mAq. media[76]
Imped.MIP/AuNPs/SPCE8.50.011–17.9-~7 dAq. media[77]
Color.PdNPs based sensing platform5.00.01–50--Urine[78]
Color.NQS/GO/GCE7306.2–26.3--Aq. media[79]
Fluor.Nanomaghemite/AuNPs/QD/peptide0.050.005–0.05--Urine, cells[80]
Fluor.ssDNA aptamer-based sensor550.1–2--Urine[81]
Abbreviations: LOD—Limit of detection, RT—Response time, PVA—polyvinyl alcohol, pph-TEOS—partially pre-hydrolysed tetraethyl orthosilicate, CHIT—chitosan, cMWCNT—carboxylated multi-walled carbon nanotubes, Pt@ZIF8—nanoplatinum-loaded porous zeolitic imidazolate framework-8, AAO—anodised aluminium oxide, Pt/OIHMMP—platinum-supported mesoporous organic-inorganic hybrid molybdenum phosphonate, MIP—molecularly imprinted polymer, GO—graphene oxide, GO-based nanocomposite: Ab-GO@graphite-powder@dibutyl phthalate-electrode; NQS—1,2-naphthoquinone-4-sulphonic acid sodium salt.
Although urine commonly contains a mixture of low molecular mass and even volatile compounds, which can be detected by the senses (interestingly, also by using trained dogs) [82] or using a low-cost array of different electrodes (Ir, Rh, Pt, Au, Ag, Co and Cu, d = 2 mm)—so-called voltammetric electronic tongue (sensitivity 91% and a specificity 73% to detect PCa individuals) [83], the specific detection of a PCa biomarker is usually achieved by using a bioreceptive element. Citrate is an important part of a prostatic fluid, being produced by prostate cells with its level being affected directly by intracellular Zn concentration. Zn switches citrate from being accumulated to being processed further in the Krebs cycle, providing energy for the cell (e.g., for proliferation of cancer cells) and even controls apoptosis (i.e., also controls tumour survival, Figure 3) [23].
Another important metabolite (among some other amino acids) is aspartate, as its levels were also increased in ARCAP (androgen-repressed human prostate cancer) cells [84]. In vivo determination of citrate concentration in living cells (HeLa and INS-1) was elegantly achieved by directed protein evolution—by inserting a CitA sensing domain (citrate-responsive CitA protein from Klebsiella pneumoniae) into a green fluorescent protein (from Aequorea victoria)—by a so-called genetically-encoded biosensor. Conformational change in a receptor molecule upon an analyte-binding results in a change in fluorescent intensity [85].
A colorimetric paper-based nanoplatform to detect citrate in human urine samples to diagnose PCa early was also proposed by Abarghoei et al. Cysteine-capped gold nanoclusters (Cys-AuNCs) exhibit a peroxidase-like activity and are able to oxidise tetramethylbenzidine (TMB) in the presence of H2O2. Since citrate is able to bind to modified Cys-AuNCs by hydrogen bonds, it inhibits this activity, which leads to a decreased optical signal. LOD in this case was 100 nM, with a linear range up to 1 mM [86]. In recent years, lanthanide coordination polymers (LCPs) have gained some attention as promising materials in biosensing. Terbium ion (Tb3+) as a luminescence centre and guanosine-5′-monophosphate (GMP) as an organic ligand were used in combination with LCP to prepare a sensing platform (Tb–GMP LCP-based biosensor) for citrate detection down to 4 μM. Upon citrate binding, a 6.5-fold enhancement in fluorescence was achieved, compared to a weak natural fluorescence of Tb-GMP [87]. Urinary polyamines were also investigated as potential PCa diagnostic markers, where spermin was identified as the most promising marker (distinguishing PCa patients from BPH controls with AUC = 0.83) [88], which outperformed putrescine and spermidine, although spermidine dietary supplementation was associated with an increased survival among cancer patients at an early stage [89]. A hybrid hydrogel matrix for the detection of spermin was described recently, with LOD = 6 μM. A dye-enriched agarose matrix increases its fluorescence in the presence of spermin 27-fold in real samples analysis (such as blood or urine), since such a sensor performance is not compromised by interferents such as various metal ions, anions, monosaccharides and even basic amino acids such as histidine, arginine, lysine, ornithine, or glutamine [90]. Although there are quite a few molecules currently identified as possible PCa biomarkers, each of these were tested only for PCa diagnostics and their involvement in other pathological conditions was not studied, which limits their clinical performance. A common example is creatinine (a metabolic product of creatine phosphate, providing energy to muscles) and its serum levels are associated with a higher risk of PCa [91], while it commonly serves as an indicator of renal function after dialysis and is associated with some urinary tract diseases symptoms, thyroid malfunction, and also muscle damage [92,93]. Thus, an altered creatinine level in itself cannot be used in accurate and robust PCa diagnostics.

3. Nucleic Acid-Based PCa Biomarkers

Having their origin in the cell nucleus, in this section we describe different types, mechanism of synthesis and detection principles for the analysis of genes with changed expression profile, mutated genes, and aberrant gene products, as well as micro RNAs involved in PCa diagnostics and prognostics. Since the detection often relies on a relatively low amount of the markers present in the original sample, a polymerase chain reaction (PCR) is usually introduced prior to analysis by a genosensor platform [94,95].

3.1. PCA3 Gene RNA Product

The PCA3 score test is one of the PCa biomarkers applied in clinical practice. The product of a prostate cancer gene 3 (PCA3) is a non-coding RNA that can be collected non-invasively from urine samples. In prostatic tissue, PCA3 is highly overexpressed compared to other tissues, where it is not present at all, and its expression increases further in cancer cells (up to ~100×) [96]. It shows a higher diagnostic and also prognostic value than fPSA% and also correlates with the increasing Gleason’s score, also being a possible prognostic marker [97]. Moreover, it has been shown that patients with high-grade prostate intraepithelial neoplasia (HG PIN) have a higher PCA3 score than a control group. The PCA3 test should ideally be performed from the first-caught urine after a prostate massage during a digital rectal examination for one of the following cases: (i) individuals with elevated PSA levels and a negative initial biopsy; (ii) individuals with elevated PSA levels and prostatitis; or (iii) individuals undergoing active surveillance with low-grade tumour or presumed microfocal disease [96]. In the studies published, the PCA3 test outperformed the tPSA or fPSA% tests, providing quite a wide range of assay sensitivities and specificities (58–94.9% and 41.8–72% [97,98,99], respectively, for a cut off value of 35), most likely due to different or unknown inclusion/exclusion criteria, as discussed in a recent meta analysis study [100]. Wang et al. proposed a combination of PCA3 and PSA RNA transcripts (PCA3/PSA RNA) to be a more reliable PCa biomarker, as suggested by the area under receiver operating characteristic curves: AUC(PCA3) = 0.717, AUC(PSA) = 0.444 and AUC(PCA3/PSA) = 0.916 [101].
As for point-of-care diagnostics, an electrochemical genosensor was recently proposed for the detection of PCA3 using a PCA3 single-stranded -NH2-containing DNA probe immobilised via amine coupling on layer-by-layer (LbL) modified interdigitated gold electrodes by chitosan and multi-walled carbon nanotubes [102]. LOD in this case was as low as 0.128 nM [102]. Electrochemical impedance spectroscopy is known to be one of the most sensitive label-free electrochemical techniques [103,104]. Modifying carbon-printed electrodes or quartz with layer-by-layer deposited films of gold nanoparticles (AuNPs) and chondroitin sulphate, PCA3 complementary DNA sequence as a probe could be immobilised on a surface, affording LOD as low as 83 pM (2000 pM in the event of using cyclic voltammetry for the detection) [105].
Optical detection platforms have also become popular in low resource settings affording such excellent operational parameters as simplicity of use, low cost, and short detection time. Among others, lateral flow assay (LFA) biosensors are also a popular choice for the possibility to easily expand to mass production. An impressive detection limit of 3 fM of PCA3 mimic DNA (with detection range from 0.01 to 50,000 pM) was achieved by a SERS-based competitive LFA assay using malachite green isothiocyanate and AuNPs. In addition, no significant differences were observed when compared not just to a blank and a non-complementary strain but also to a single-base mismatched DNA, suggesting high selectivity [106]. For different optical platforms, nanoparticles (NPs) are often used to (i) provide the detectable signal; or for (ii) enrichment prior to any signal generation. Use of an up-conversion NPs-graphene sensor platform affords early diagnostics based on the specific detection of oligonucleotide sequences in complex matrices (such as cell lysates or plasma) [107]. These lanthanide-doped NPs serve as a fluorescence donor—by absorbing two or more low energy photons, they emit fluorescence at a shorter wavelength. Upon the hybridisation of a probe immobilised on NPs, graphene oxide (GO) is added and, following laser irradiation (λ = 980 nm), a fluorescent signature of NPs is observed. GO affords many unique properties for this array, such as high surface area, water solubility, quenching properties and the fact that single-stranded (ss) oligonucleotides preferentially bind to GO via π-π interactions, while double-stranded (ds) do not exhibit such behaviour. In contrast, magnetic NPs for target analyte enrichment have been used for an enzyme-linked oligonucleotide assay to overcome any drawback of a common electrophoretic detection of PCR products. Running a RT-PCR assay in a tube with forward and reverse primers attached to magnetic NPs and biotin, respectively, using HRP and a common TMB/H2O2 system, a sensitive optical detection of PCA3 in urine was achieved. Moreover, PCa patients were readily distinguishable, not just from healthy controls, but also from BPH patients, suggesting that PCA3 remains one of the most PCa-specific markers available to date [108].

3.2. miRNA PCa Biomarkers

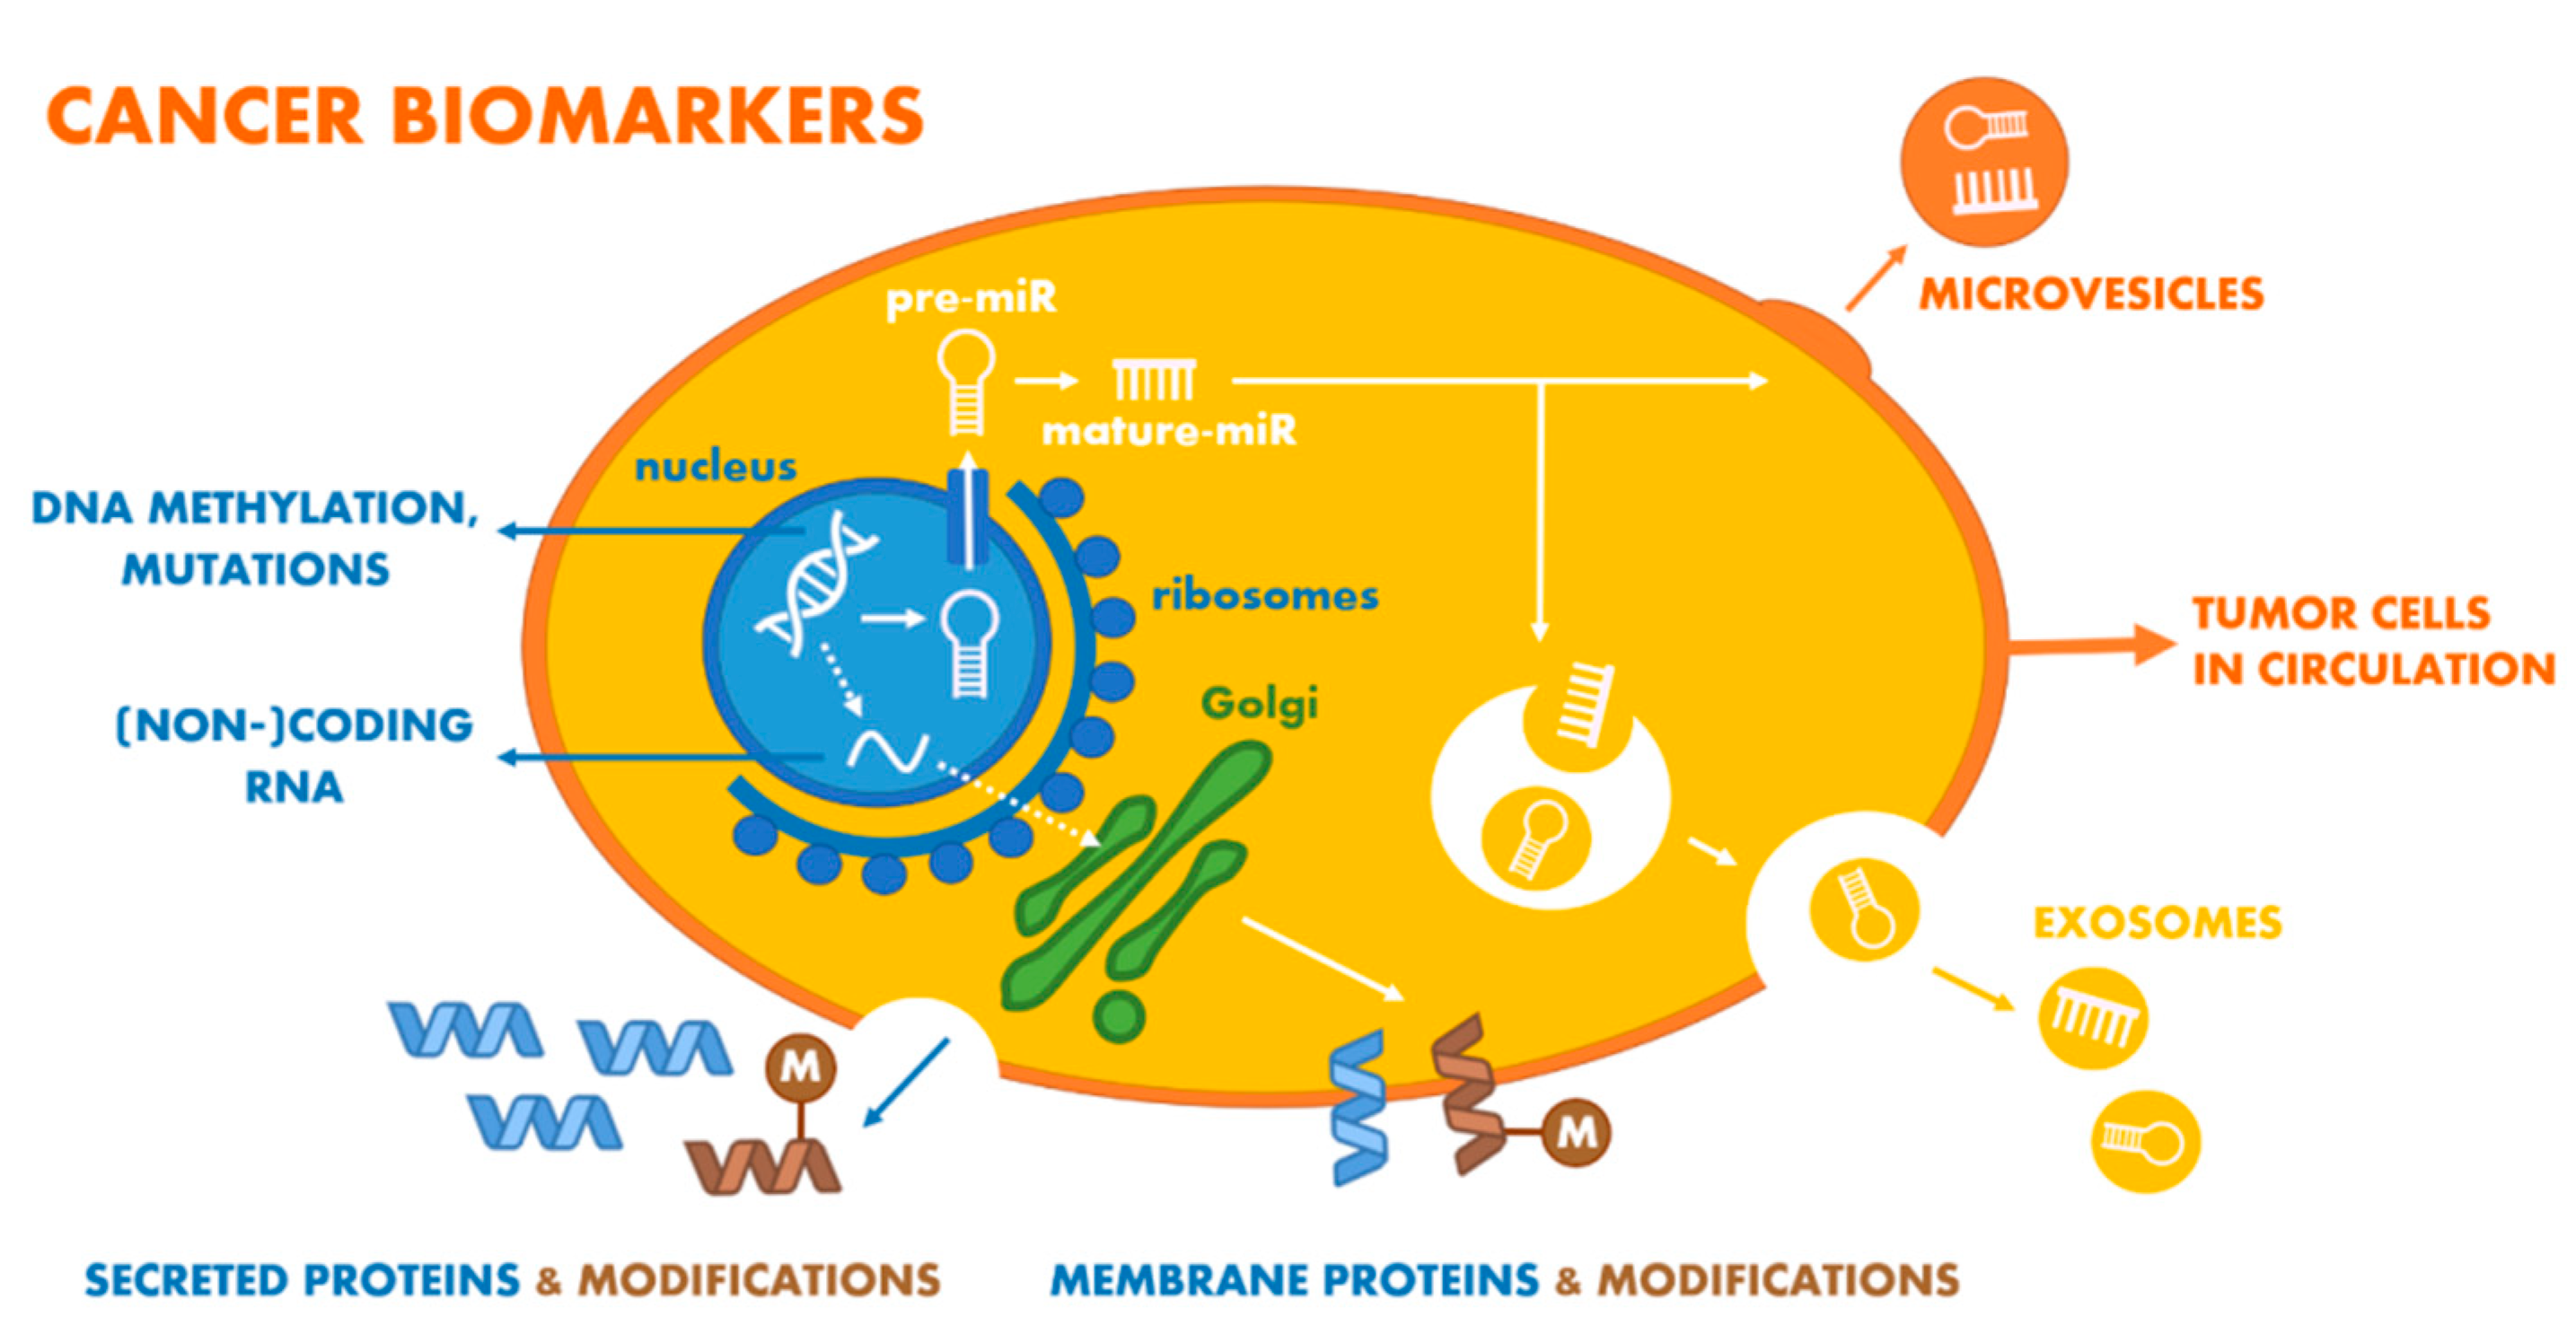
MicroRNAs (miRNA, miR) are small ~22 nucleotides, transcribed as RNA hairpins, endogenously expressed non-coding RNAs, as opposed to small interfering RNAs—siRNAs, which are produced by exogenous long double-stranded RNA, that negatively regulate the expression of protein-coding genes at the translational level by selectively targeting mRNA [109]. miRs are expressed by the transcription of miR genes (introns) [110] and target different genes, thereby regulating different signalling pathways and, moreover, the expression signature often differs between cancer and normal tissues [111], which makes miRs possible biomarkers for early stage liquid biopsy (non-invasive analysis of urine) or disease recurrence (analysis of tissue-markers). Based on perfect or imperfect complementarity to a target sequence, a translation repression of mRNA or mRNA degradation, respectively, is obtained [112]. In PCa, miRs affect the basic metabolism, such as glucose uptake, glycolysis, and lactate secretion, lipid metabolism (de novo fatty acids synthesis) and interaction with signalling pathways [113]. Different types of oncomarkers potentially being analysed in early PCa diagnostics are shown in Figure 4, while miRs are present in plasma or serum in the range of several ng·mL−1, and are quite stable due to the fact they are often packaged inside membranous vesicles, such as exosomes, oncosomes, apoptotic bodies or microvesicles and associated with RNA-binding proteins [114].
The detection of miRs is more complicated than that of protein-based biomarkers—there is a need to isolate the template RNAs from a sample and to use RT-qPCR to prepare cDNA for further analysis. Furthermore, DNAse/RNAse-free reagents and environment are needed for analysis. However, adding, e.g., PHI (Prostate Health Index,) value to miRs significantly increases diagnostic accuracy in plasmas for commonly investigated miRs associated with PCa, such as miR-21 [115,116] (sensitivity ≤ 95% and specificity = 100% for miR-21 and miR-221 [117] in combination with PHI. For diagnostic and prognostic purposes, miR-182-5p and miR-375-3p were isolated from tissues and plasmas and subsequently detected. Although miR-375-3p could not be reliably used for PCa diagnostics, the higher circulating levels of both the above miRs were associated with more pathological stages and miR-375-3p could even be associated with patients more prone to develop a metastatic PCa [118]. In addition, miR-375-3p could be associated (significantly overexpressed together with miRs 141 and 378*) with castration-resistant PCa, as shown in another study [119]. In the case of PCa itself, there are many miR-based tissue biomarkers with a diagnostic or a prognostic value. As reported in a microarray-based study of 470 human miRs, 10 of these miRs were downregulated, 5 upregulated, and some even correlated with a Gleason score parameter (miR-31, 96 and 205) [120]. On the basis of this study, the best miR biomarker for PCa was miR-205 (diagnostic accuracy of 72%, AUC = 0.82). Using all miRs and a logistic regression, accuracy increased to 82% and AUC value only slightly to 0.86 [120]. miR-141 and miR-375 usually detected in tissues (e.g., after radical prostatectomy in untreated PCa patients) are also present in serum samples in higher amounts in metastatic PCa patients (in microvesicles or exosomes), miR-107 and miR-574-3p were identified as potential urinary markers (with best AUC = 0.74 for miR-107 on cohorts, where PCA3 yielded an AUC = 0.61) [121]. Besides the two above-mentioned miRs, miR-21-5p, miR-141-3p, and miR-375 were most recently proposed for consideration as potential urinary biomarkers for non-invasive PCa diagnostics [122]. Except for a single biomarker approach, Fredsøe et al. showed an impressive performance of their three miR-based model for urinary detection of PCa (miR-222-3p*miR-24-3p/miR-30c-5p), distinguishable from a BPH cohort with an AUC = 0.89–0.95 [123]. Similarly, another model (miR-125b-5p*let-7a-5p/miR-151-5p) predicted time to biochemical recurrence after radical prostatectomy (distinguished low- and high-risk groups with high statistical significance, p = 0.0176) [123].
In discussing miRs detection using sensors, electrochemical detection is by far one of the most popular methods. In a recent review paper published by El Aamri et al., the authors proposed five different classes of electrochemical biosensors: (i) biosensors comprising one or two labelled probes (including elimination of these probes upon hybridisation, thus a decrease in the electrochemical signal was observed, due to the action of a duplex-specific nuclease) [124]; (ii) biosensors comprising a catalyst (an enzyme, chemical or DNAzyme); (iii) biosensors comprising intercalating species (direct or template-driven); (iv) label-free detection platforms; and (v) other detection principles, such as oxidation of guanine [125]. The different configurations commonly used are schematically depicted in Figure 5. Because of the biogenetic process of mature miRs (from primary miRs, so-called pri-miR of ~1–3 kb and pre-miR of ~70–100 nt loop structures, which are transported to a cytoplasm and enzymatically processed further), sequences with a high degree of homology are often produced, rendering the design of the sensor sensitisers (probes) quite challenging. Moreover, variance in GC content results in a variance in melting temperatures [112]. Other challenges involve sample preparation and extraction methods [110]. One final feature, specific to biosensing, is that the biosensor surface/interface needs to be stable over time, otherwise any changes need to be taken into account after long term storage and prior to analysis, such as nanowire biosensor based on silicon-on-insulator structures for detection of DNA probes complementary to the sequences of miR-183 and miR-484 down to 10−16 M, where the device offered an inversed signal (sensitivity) after a two-year storage [126]. Other than the different biosensors, commonly used methods for miR detection are Northern blot, RT-qPCR, and microarrays.
Electrochemical biosensors provide a platform readily transferable to an array format, which is easy to miniaturise, but deals with some problems such as selectivity due to non-specific interactions and output signal inconsistencies. Jolly et al. proposed a dual mode platform based on gold nanoparticles and EIS/SWV measurements for the detection of miR-145 down to 0.37 fM. Moreover, two mismatches in a strain were not significantly different in their response compared to a blank, which makes this kind of platform highly selective toward specific sequences [128]. Furthermore, besides a Nyquist plot in a label-free format, a Cole-Cole (-C″ vs. C′) plot might be used if an electrochemical probe is attached to the electrode surface, such as ferrocene derivatives.

3.3. Changes in DNA Level (DNA-Based and Derived Oncomarkers)

Although PCa is known to have a different epidemiology across different ethnic groups, genetic/hereditary factors are also known to play an important role in the disease occurrence. The Nordic Twin Study estimated the risk of the development of PCa due to inheritability at 57% (CI95% = 51–63%), making it one of the most inheritable cancers together with melanoma and non-melanoma skin cancers [129]. By means of genetic variations, different loci were identified (~170) as being more or less susceptible to changes due to PCa development, while more common genetic variants of some genes may confer a lower risk for PCa [130,131]. Examples involve mutations in tumour suppressor/DNA repair genes, such as BRCA1, BRCA2, ATM, CHEK2, RAD51D or PALB2 [132] and also more rare variations, such as HOXB13 (G84E variant, 1.4% in Europe, being more common for PCa with an early onset)—a transcription factor gene important in prostate development [133]. Although commonly used as a marker for breast and ovarian cancer (with 85% and 63% lifetime risks of hereditary cancer in women, respectively) [134], recent efforts to detect BRCA1 changes involve mostly nanomaterial-supported electrochemical detection, e.g., thermally reduced GO with functional groups still used to immobilise streptavidin and subsequently to bind a PCR product with a biotin-labelled primer entering the reaction (a biosensor response was measured in real time as a decrease in resistance in MΩ range with LOD = 0.2 nM) [135] or thiol-modified DNA tetrahedral-structured probe and AuNP-modified reporter DNA, creating a typical sandwich with BRCA1 sequence and generating an electrochemical (amperometry, voltammetry) signal using HRP and TMB/H2O2 for analyte concentrations much lower than in the previous case—down to 0.1 fM [136].
Different types of gene-associated changes in PCa, further discussed in this section, are depicted in Figure 6. Fusion of transmembrane protease serine 2:v-ets erythroblastosis virus E26 oncogene homologue (TMPRSS2:ERG) is often associated with PCa. Furthermore, through lentiviral-mediated gene-silencing, the mRNA product of ERG and protein expression was significantly reduced, which resulted in cell-cycle arrest at G0/G1 phase for VCaP cells (Vertebral-Cancer of the Prostate) [137]. Besides chromosomal rearrangements creating fusion genes, RNA sequencing technology proved that fusion is also mediated at a transcription level [138]. ERG gene rearrangements are quite common in prostate adenocarcinomas, while less data is available for small-cell prostate carcinomas (a rare neuroendocrine tumour variant), which manifest themselves quite early (including metastases), are not accompanied by an increase in serum PSA and are resistant to androgen ablation. In addition, TMPRSS2:ERG and PCA3 were shown to have an independent positive predictive value to detect PCa [139]. A rapid, low-cost (~5 USD/test), and a robust (isothermal reverse transcriptase-recombinase polymerase amplification-based) approach has been developed for the detection of the fusion gene in urine, detecting as low as 105 copies of transcripts. Naked eye detection was possible due to the formation of cDNA amplicons exclusively in the presence of fusion genes in urine, providing a non-invasive matrix. These amplicons then bind to MPs and spontaneous flocculation occurs [140]. Another important gene associated with PCa is glutathione S-transferase P1 (GSTP1), expressed in some human tissues. This enzyme detoxifies the cell from endogenous and exogenous toxic compounds using glutathione or by acting as a ligandin (also via protein-protein interactions) [141,142], exhibiting quite impressive substrate promiscuity. In PCa, the promoter of GSTP1 is hypermethylated, which leads to a loss of expression levels and possibly to DNA damage due to increased oxidative stress. Induction of GSTP1 activity in LNCaP (human prostate adenocarcinoma cells derived from the left supraclavicular lymph node metastasis) cells with a silenced GSTP1 gene lowered endogenous (ROS) levels when exposed to H2O2 [143,144]. Additionally, miRs 133-a/b, 144, 144*, 153-1, 590-3p and 590-5p were shown to regulate GSTP1, being another class of possible PCa markers [145]. Biosensors detecting GSTP1 hypermethylation, which are stable for a long time, could be successfully designed based on a hybridisation strategy with a probe immobilised on a single-use graphite carbon electrode or multi-walled carbon nanotubes screen printed electrodes. In both cases, LODs down to pM level were achieved based on changes in guanine oxidations using differential pulse voltammetry (DPV) [146,147].
If oxidative stress (in the form of a ROS attack) is not prevented, it might directly damage cellular DNA. Predominantly, bases in DNA structure are hydroxylated with guanine being the most prone to such an oxidation. Hence, for several decades, the most studied and abundant lesion is most likely 8-hydroxydeoxyguanosine (8-OHdG), which occurs in urine as a product of mismatch repair mechanism [148]. Moreover, 8-OHdG concentration (controlled by local antioxidant capacity) in urine was shown to refer not only to increased oxidative damage but also to be associated with some diseases, including breast, bladder and prostate cancers [149]—which could even be distinguished from benign hyperplasia using a tissue-staining microarray (10 adenocarcinoma patients vs. 70 controls) [150]. 8-OHdG might be directly electrochemically oxidised on modified surfaces with sufficient electrocatalytic activities (on carbon surfaces, 8-OHdG exhibits a 2-electron transfer reaction), such as electrochemically reduced GO and multi-walled carbon nanotubes-modified glassy carbon electrode, where a limit of detection of 35 nM was achieved (with linear range from 3 to 75 μM), as well as analysis in the presence of common interferents (ascorbic and uric acid, xanthine, and hypoxanthine) and in urine [151]. Similarly, LOD = 28 nM (with linear range from 0.5 to 100 μM) was achieved at the edge plane surface of a pyrolytic graphite electrode [152]. A molecularly-imprinted sensor has also been fabricated using edge plane pyrolytic graphite and glutaraldehyde/poly-1,5-diaminonaphthalene bioreceptive interface; however LOD = 3 nM and a linear range from 20 nM up to 3 μM was not significantly different from the less complicated assays mentioned above [153]. For point-of-care diagnostics, an interesting concept using 8-OHdG oxidation on carbon ink-modified paper substrate coupled with DPV readings was used [154]. LOD in this case was once again in nM range (~50 nM, i.e., 14.4 ng mL−1). Since this device might be readily miniaturised and mass-produced at a low price with a performance comparable with previous devices, it is an ideal candidate for in situ testing of biological samples. The parameters of this paper-based sensor could be further tailored using different additives in the carbon ink, such as (carboxylated) MWCNTs or PEDOT (poly(3,4-ethylenedioxythiophene)) nanoparticles. Mohd Azmi et al. [155] developed a biosensor employing silicon nanowire (SiNW) for investigating 8-hydroxydeoxyguanosine (8-OHdG) as a potential biomarker. The functionalisation of the SiNW surface with antibodies was performed by electrochemical diazotisation grafting in such a way that nitro-phenyl was attached and, after reduction of the nitro group to an amine, aniline was attached. The measurable decrease in the SiNW channel resistance after attachment of the 8-OHdG biomarker to the SiNW-bound antibody was evaluated and resulted in the LOD of 1 ng mL−1 (3.5 nM) in a linear range of 1 to 40 ng mL−1 [155].
In addition to all the above-mentioned processes (i.e., gene fusion, epigenetic mechanisms—such as methylation and DNA damage due to ROS action), single nucleotide polymorphisms (point mutations) might significantly contribute to express disease-related proteins. These mutations might even alter any post-translational modification and thereby affect protein activity, stability, or even immunoassay-based diagnostic results [156].

4. Protein-Based PCa Biomarkers

4.1. Osteopontin

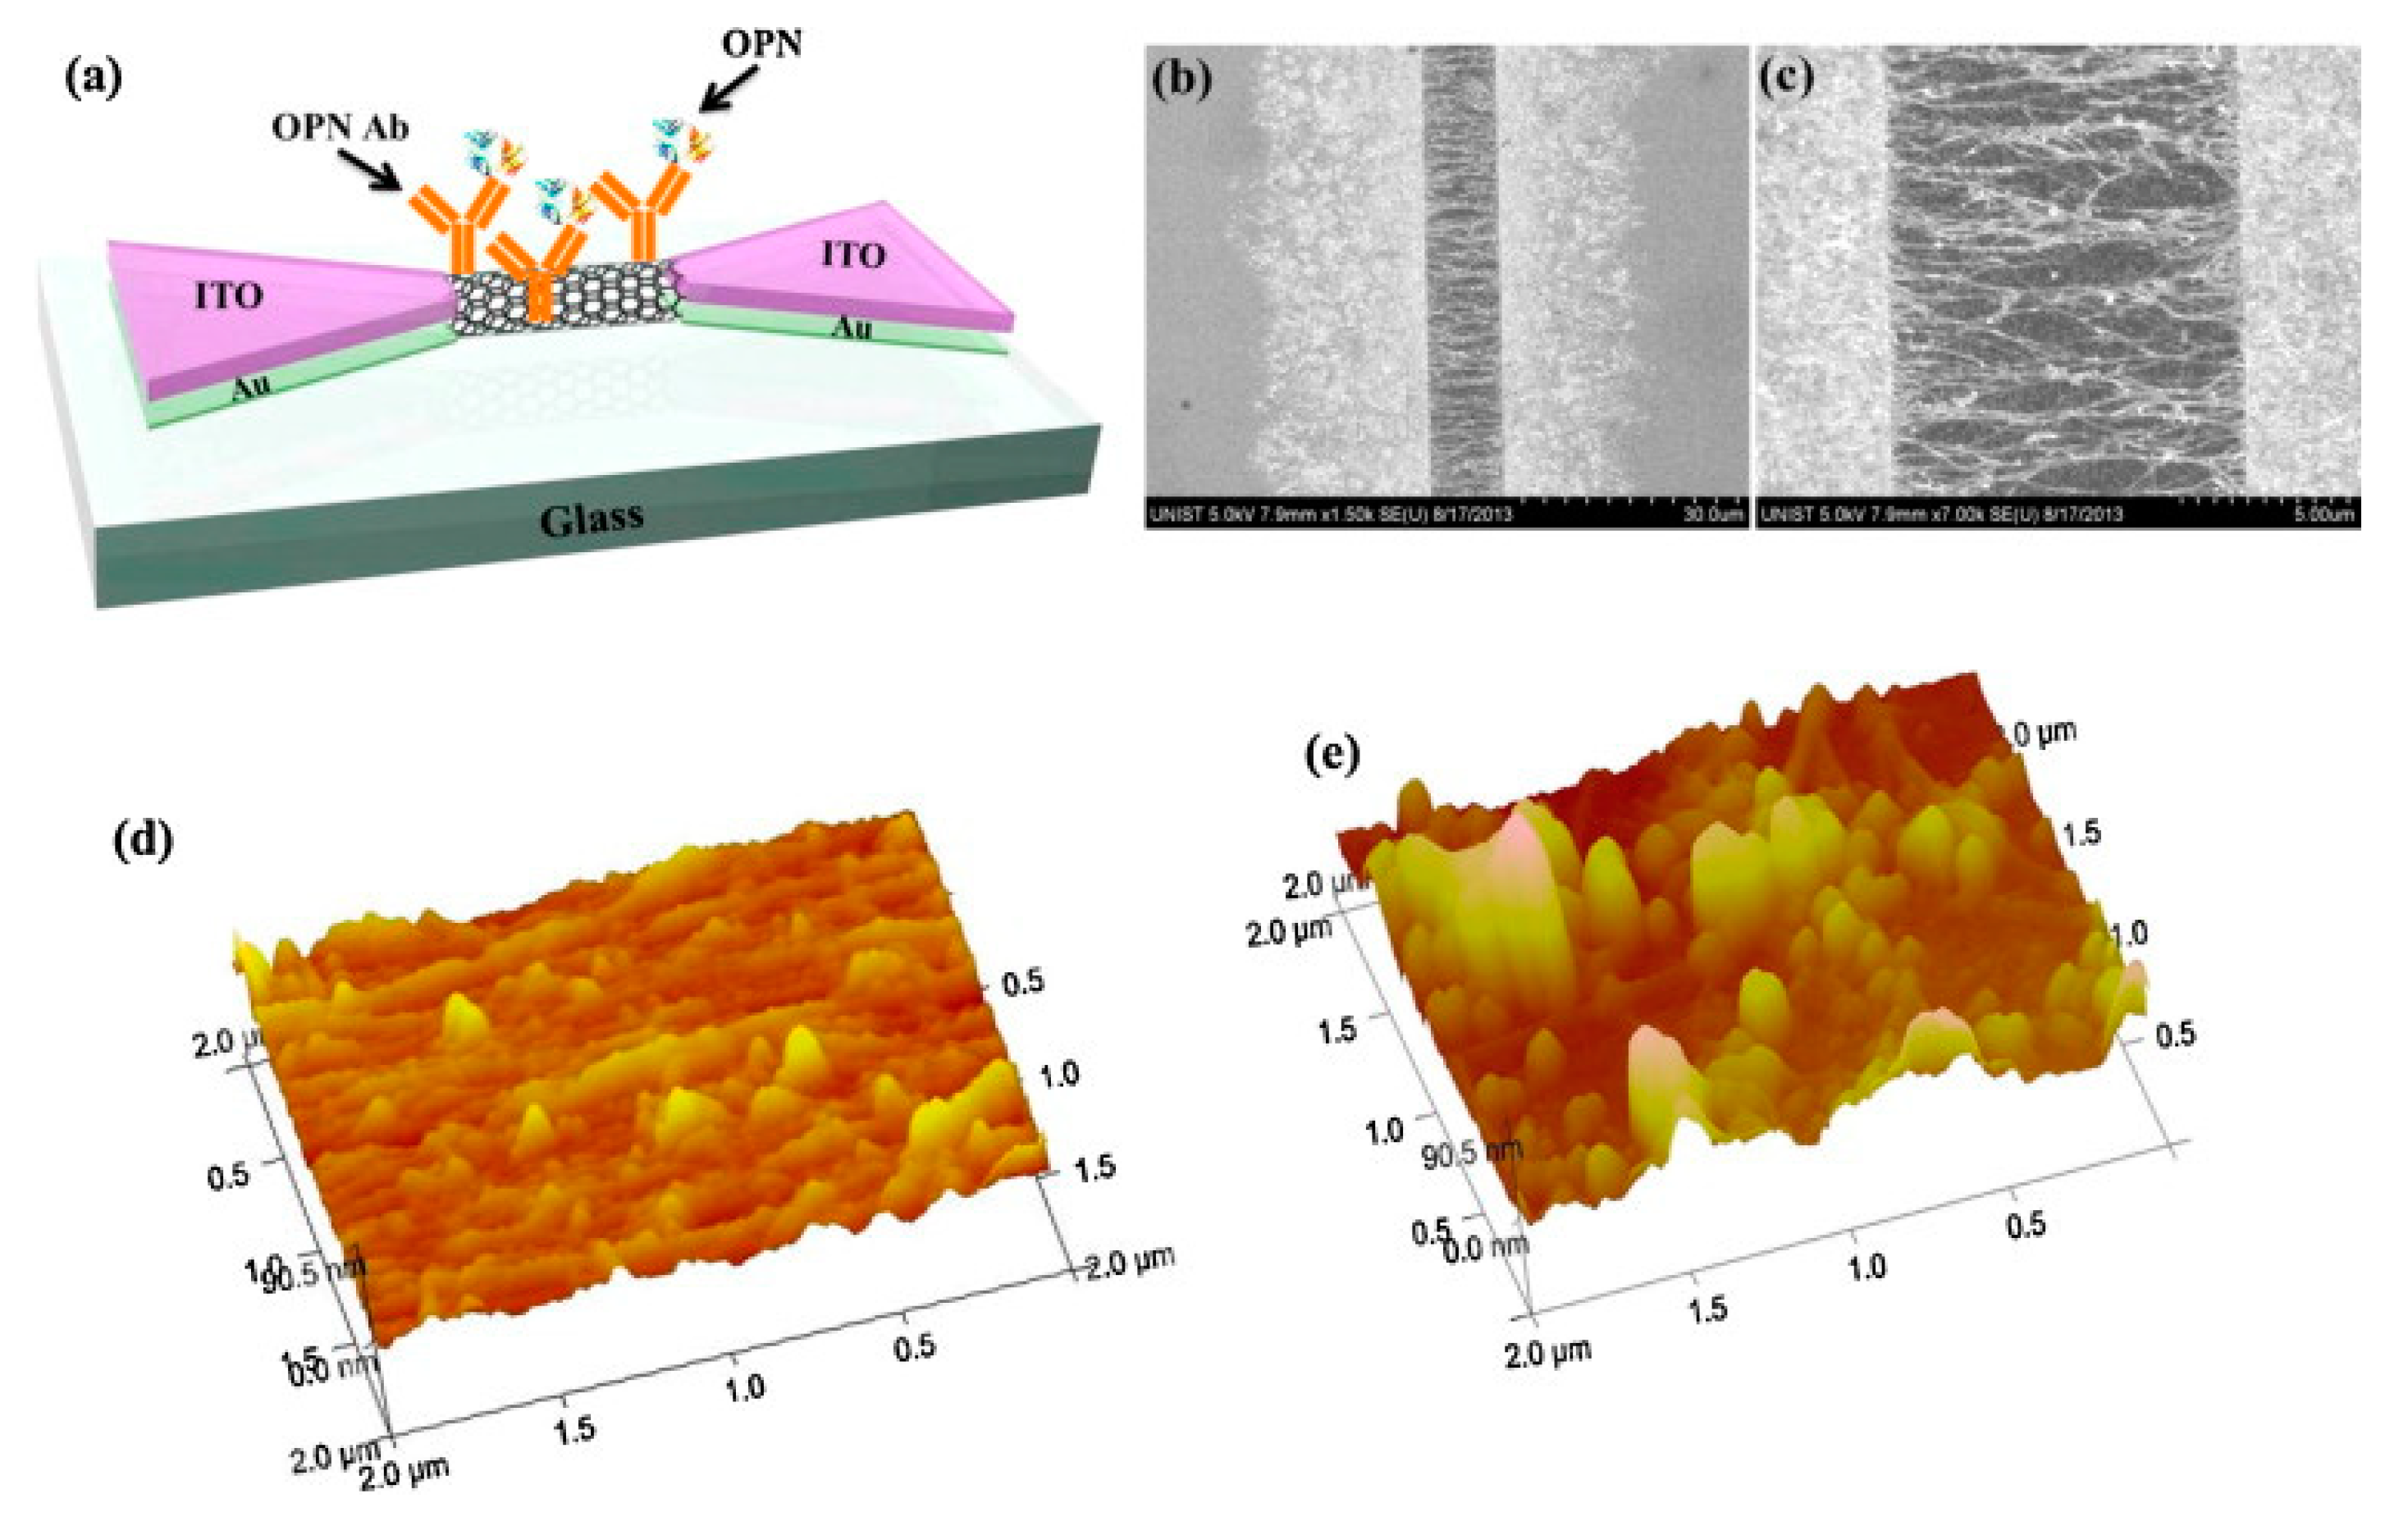
Osteopontin (a bone sialoprotein1, OPN), as a secreted phosphoprotein (60 kDa), is a pro-inflammatory and pro-fibrotic molecule [157] that can be expressed in a variety of tissues such as brain [158], breast, bones, kidney, lung, and liver and, moreover, can be applied as a potential diagnostic, prognostic and therapeutic tool [159] to the investigation of PCa [160]. The strategy of Sharma and co-workers [161] included utilisation of SWCNTs deposited between two gold/indium tin oxide (Au/ITO) electrodes on a glass substrate by dielectrophoresis, which were modified with Abs through EDC/NHS coupling to fabricate a label-free and transparent electrical immunosensor for OPN detection (Figure 7). LOD of 0.3 pg mL−1 was achieved via evaluating a relative resistance change in the immunosensors with a linear range up to 1 mg mL−1 [161].

4.2. Engrailed-2 Protein (EN2)

The development of an in vitro diagnostic method based on novel biomarkers leading to more sensitive, specific, and early stage diagnostics is currently attracting attention. Various diseases (inflammation, cancer) can be caused by dysregulation in the transcription of DNA to messenger RNA and hence abnormal expression of the transcription factors can be applicable in diagnostics. The engrailed-2 (EN2) protein, as one of these factors containing the homeobox domain, which is significant for an early embryonic development, can be used for diagnostics of various types of cancer diseases (breast, bladder, ovarian, prostate). Additionally, EN2 binding to a specific DNA sequence (5′-TAATTA-3′) to regulate transcription can be effective for diagnostics due to high specificity and sensitivity not only of PCa tissues but also the non-invasive detection of urine samples of PC patients, in which a high level of EN2 was observed [162]. EN2 as a urinary non-invasive biomarker for early stage diagnostics was determined by ELISA, achieving a specificity of 89.3% and sensitivity of 66.7% (413 BRCA1 and BRCA2 mutation carriers and controls) [163].
EN2 levels in urine samples, related to the Gleason score and tumour stage, were cardinally affected by prostate massage (1.25 ng mL−1 in the PCa group and 0.34 ng mL−1 in the BPH) [164]. The EN2 protein is present in the cell membrane and within microvesicles and, when taken up by normal cells from the stroma, EN2 induces the expression of MX2 (MxB), a key protein in the innate immune response to viruses. Hence, it was concluded that EN2 secretion by tumours might be a way of preventing a viral-mediated immune invasion of tissue immediately adjacent to the tumour [165]. Lee et al. [166] took advantage of this interaction between homeodomain and specific DNA probes to fabricate an ultrasensitive impedimetric biosensor for EN2 determination with LOD of 5.62 fM. The incubation of different concentrations of EN2 (10 fM–1 nM) onto a pre-treated gold electrode electrodeposited with Au NPs and subsequently modified with poly(A)10-hpDNA3 probe and 6-mercapto-1-hexanol was performed. The specificity of the biosensor thus developed was further verified through examination with artificial urine medium (AUM) and other proteins (bovine serum albumin (BSA), human serum albumin (HSA), lysozyme, thrombin, and TATA-binding protein (TBP)) [166].

4.3. Epidermal Growth Factor Receptor (EGFR)

The epidermal growth factor receptor (EGFR), belonging to the family of receptor tyrosine kinases, is a transmembrane tyrosine kinase receptor promoting the proliferation and survival of both normal and cancer cells. The amplification of EGFR or gain of function mutations of EGFR in its tyrosine kinase domain results in some of the abnormal activation of EGFR in cancer cells.
Takaaki Hiragun et al. [167] employed surface plasmon resonance (SPR) as a detection technique observing intracellular signalling events as a function of the angle of resonance. The LNCaP cells showed a unique pattern of signal change in response to EGF stimulation. Through evaluation of the SPR signals, the presence of a single LNCaP cell among normal or even other malignant tumour cells can be identified in real-time without labelling [167].

4.4. Alpha-Methylacyl-CoA Racemase (AMACR)

Ying et al. [168] focused on the determination of alpha-methylacyl-CoA racemase (AMACR, also noted as P504S protein) presenting a further potential biomarker for PCa diagnostics in clinical practice. This metabolic enzyme is localised intracellularly in the mitochondria and peroxisomes and is associated with the peroxisomal β-oxidation of dietary branched-chain fatty acids. The differentiation/discrimination progress of benign to malignant prostate tumours through AMACR can be achieved with high sensitivity and specificity. The sensing interface was based on a Pt nanowires (Pt NWs) array providing an efficient mass diffusion and electron transfer and a 2D nanomaterial MoS2 matrix (Pt NWs array@MoS2). The disposable screen-printed amperometric sensor detected AMACR with LOD of 0.5 pg μL−1 (signal to noise ratio S/N = 3) in a linear range from 0.70 to 12.50 ng μL−1 (correlation coefficient R2 = 0.9597) at −0.45 V.
Lin et al. [169] employed an electrochemical biosensor based on a metallic nanoparticle-based catalyst for investigating AMACR levels requiring a small volume of plasma samples (9 healthy males, 10 patients with high grade prostatic intraepithelial neoplasia (HGPIN), and 5 prostate cancer patients) and achieving 100% accuracy in separating PCa patients from controls.
In an effort to improve the anti-fouling properties of a final impedimetric aptasensor detecting AMACR [170], PPy film electropolymerised onto an Au electrode was patterned with PEG molecules due to amine groups and a further Nα,Nα-Bis(carboxymethyl)-L-lysine ANTA(N-(5-Amino-1-carboxypentyl)iminodiacetic acid)/Cu2+ redox complex was covalently attached. Finally, histidine-tagged AMACR-specific DNA aptamers were attached and LODs of 0.15 fM and 1.4 fM for AMACR were obtained in a buffer and in spiked human plasma, respectively, by applying the SWV method.

4.5. Prostatic Acid Phosphatase (PAP)

In addition, Fernandes et al. [171] employed a time-effective approach without labelling by applying impedance-derived immittance functions (ImFs, inverse of imaginary capacitance, 1/C”) in combination with a SAM consisting of thiol-containing polyethylene glycol (PEG thiol, HS–(CH2)11–(EG)3–OCH2–COOH as a low-fouling material) and 11-ferrocenyl undecanethiol (11FcC as a redox probe) to investigate the level of an enzyme human prostatic acid phosphatase (PAP) in human blood serum. The columnar secretory epithelia of the prostate gland biosynthesise human PAP, which is considered as a major phosphatase enzyme with plasma levels in the range 10–30 pM (1–3 ng mL−1) in healthy individuals. In this concept, the specificity of interaction between an antibody (anti-PAP) as a biorecognition element functionalising a gold disk electrode surface covered with the mixed SAM and the target biomarker was detected using an impedance-derived capacitance technique termed electrochemical capacitance spectroscopy with LOD of 11.2 ± 2.6 pM (a linear range from 50 pM to 104 pM) in a real sample.

4.6. Acid Phosphatase (ACP)

Kamel et al. [172] introduced ion association complexes of α-naphthyl acid phosphate (1-NAP) with cetylpyridinium chloride (CP) and iron (II)—4,7-bathophenanthroline [Fe(bphen)3]2+ as state-of-the-art electroactive materials dispersed in o-nitrophenyloctyl ether (o-NPOE) plasticiser to design an ionometric sensor. The acid phosphatase enzyme (ACP) is present in the lysosomal compartment of the cells and as a non-specific esterase is catalytically active in the hydrolysis of many monoesters of phosphoric acid in an acidic environment. The activity of ACP was estimated through the decrease in a fixed concentration of 1-NAP under optimised conditions of pH (3.8–5.7) and temperature (25 °C).
The planar chip biosensors for potentiometric immunoassay exhibited a good potential response stability of ±3 mV, high accuracy and precision of ~(98.3 ± 0.6)%, and, moreover, a long life-span of 6–8 weeks. The LOD value of 0.01 IU L−1 was achieved with a linear signal response in a range of 0.01–4.3 IU L−1 for the ACP enzyme employing a potentiometric biosensor affording better durability, decreased diffusion area, small sample volume, and time-effectiveness. The early stage PCa diagnostics, human prostatic diseases, and hypophosphatasia can be performed through observation of the level of ACP activity in a blood sample.
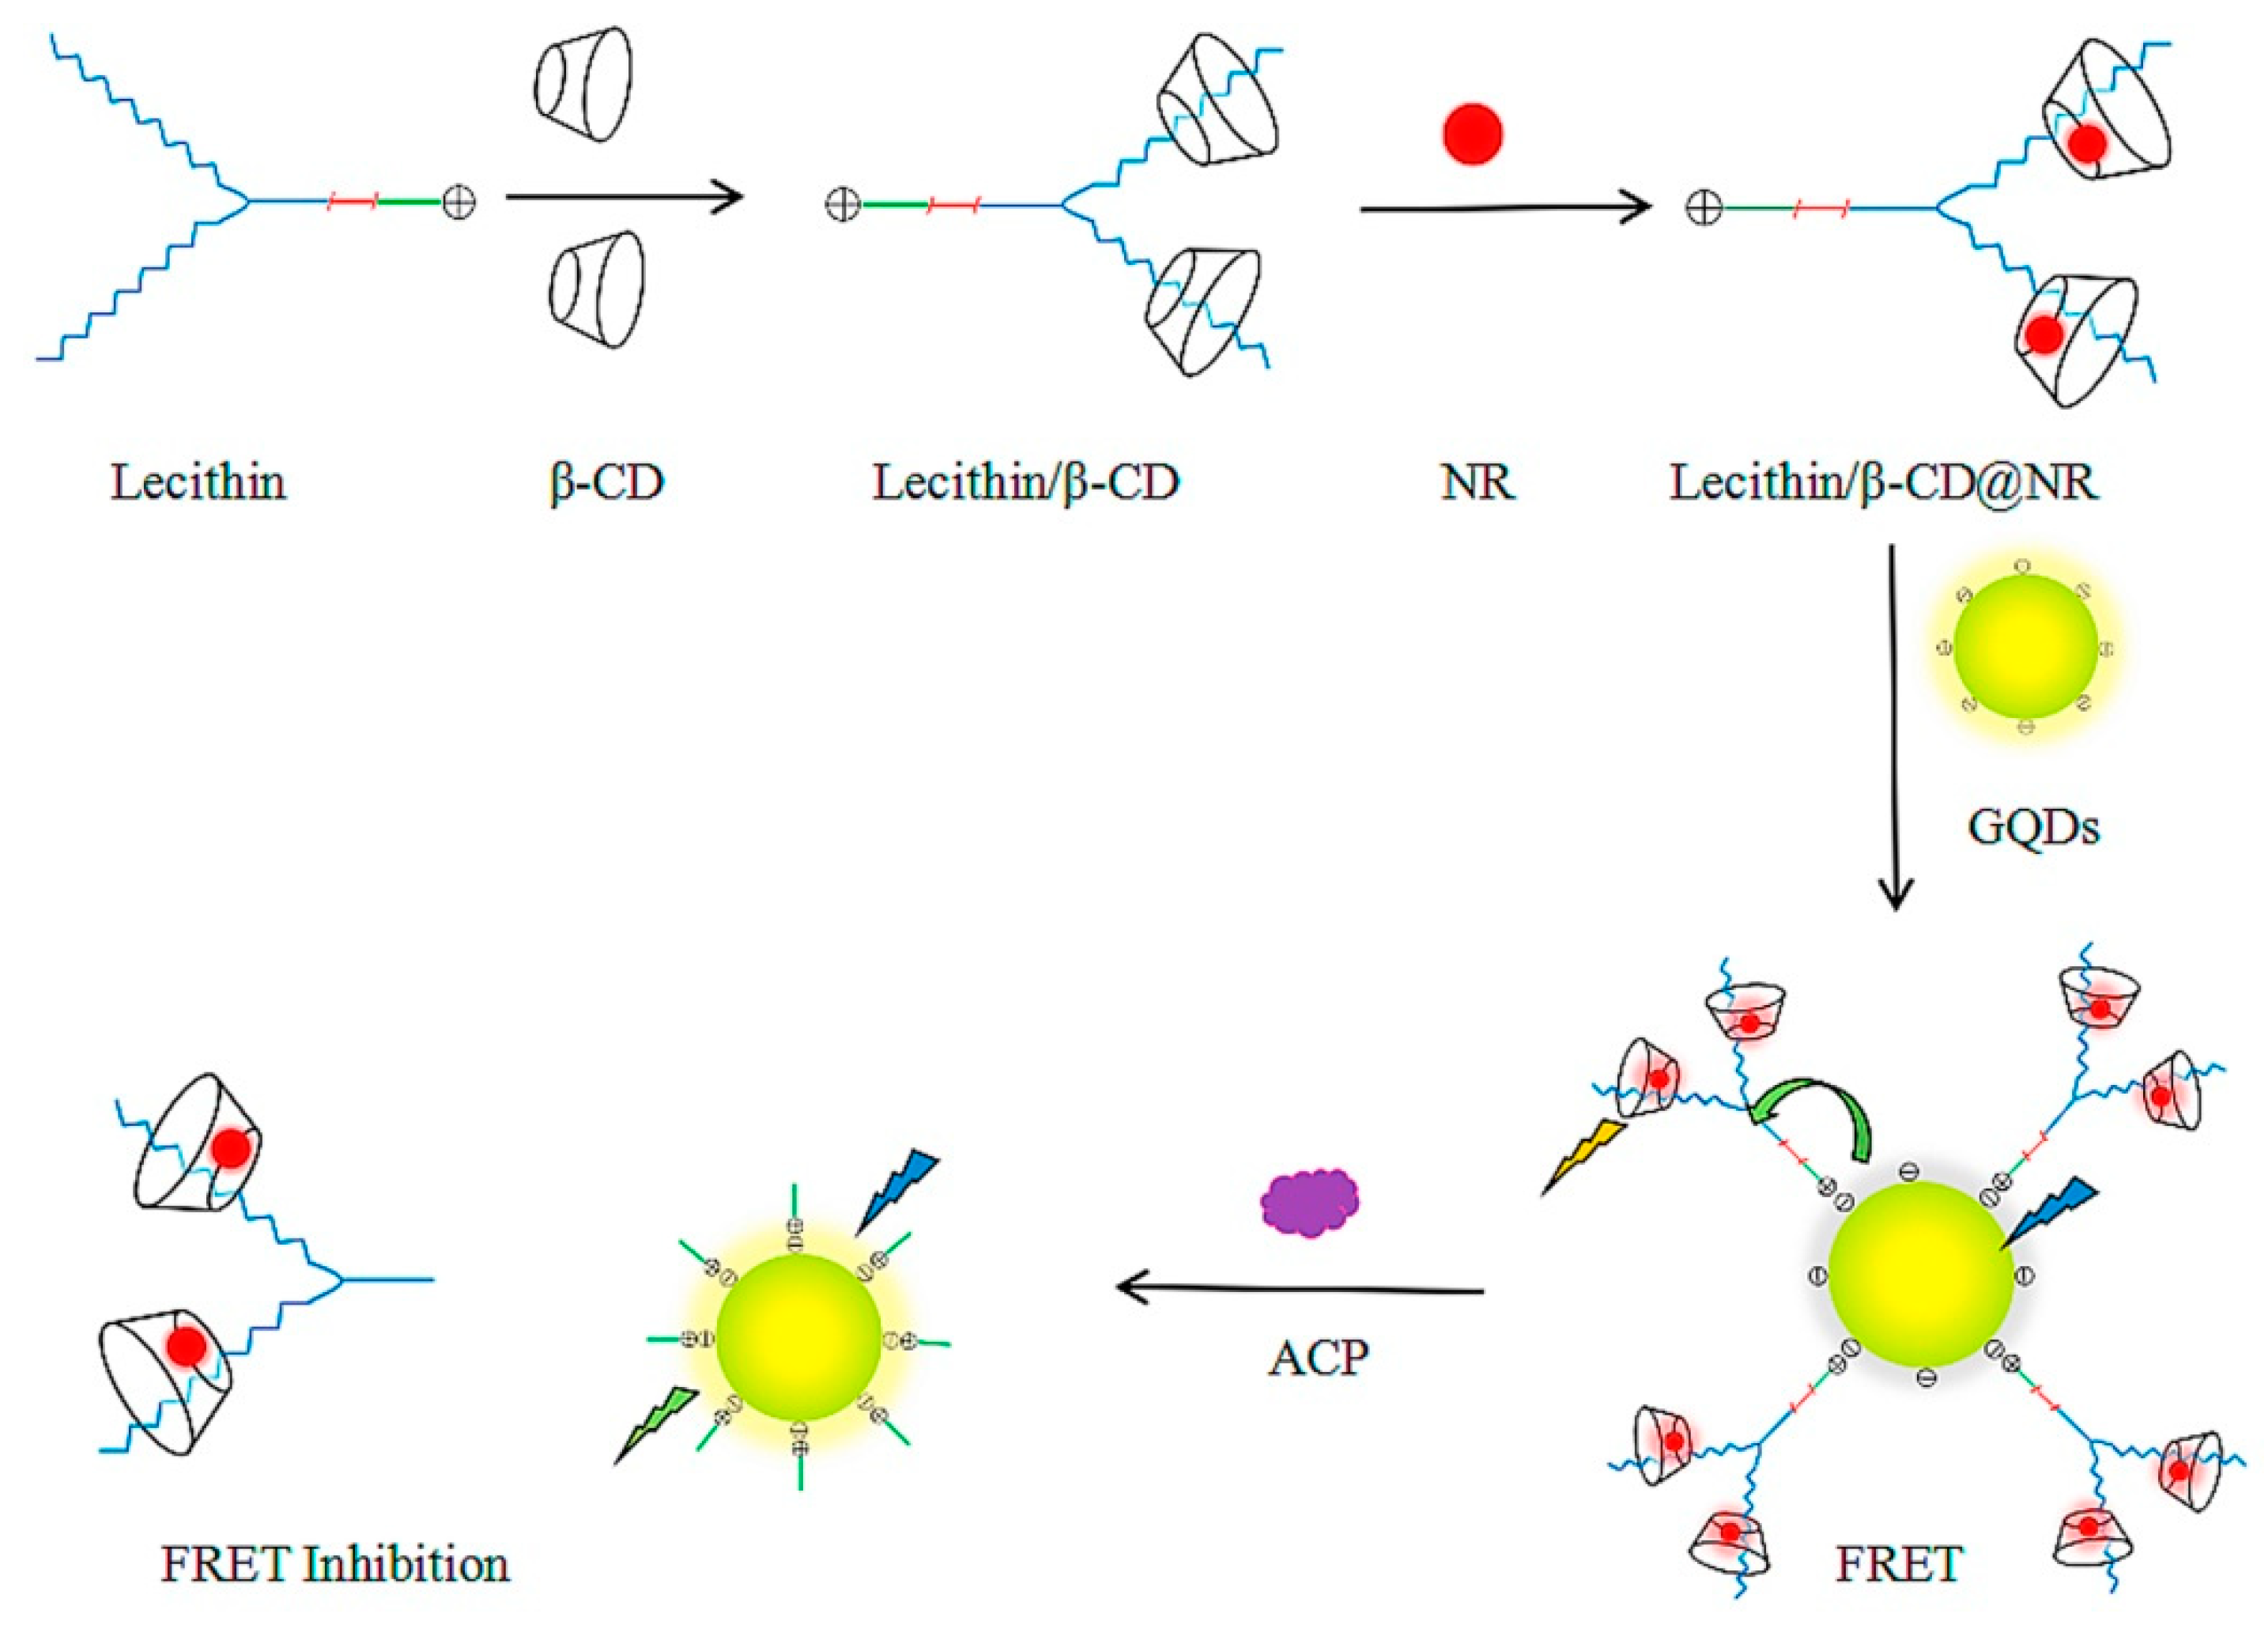
Na et al. [173] took advantage of a lecithin/β-Cyclodextrin (lecithin/β-CD) complex as the linker for attachment of Nile red (NR, acceptor) to graphene quantum dots (GQDs, donor) through electrostatic and hydrophobic interaction in a Förster resonance energy transfer (FRET) biosensor detecting ACP with LOD of 28 µU mL−1 (Figure 8). The level of ACP can provide information about disorders related to kidneys, veins, and bones. The GQDs-based fluorescence biosensor facilitated in vitro imaging of human prostate cancer cells.

4.7. Spondin-2 (SPON2)

In an effort to achieve a more specific PCa diagnostics, Parra-Cabrera et al. [174], in a real-time analysis, simultaneously examined two biomarkers such as PSA and spondin-2 (SPON2) within the clinically relevant range. Photolithography and a cast-moulding method were employed for fabrication of the lab-on-a-chip device with the integrated two sets of gold electrodes into the microfluidic channel. The blocking step was performed with 11-Mercaptoundecyl tetra(ethylene glycol) (PEG-Thiol) in ethanol. In the next step, biotinylated alkyl thiols with a polyethyleneglycol linker (biotin-thiol) were employed to form a layer. Subsequently, a biotin layer was covered with a streptavidin layer and in-situ immobilisation of biotinylated specific antibodies over this layer was performed to design the sensor. Both analytes could be detected in a clinically relevant concentration range of 1–10 ng mL−1 [174].

4.8. Prostate Membrane-Specific Antigen (PSMA)

A label-free and real-time detection approach was used by Park et al. [175] via monitoring of the signal of a dual-gate ion-sensitive field-effect transistor (ISFET) consisting of a FET device and a sensing part as the response on protein-blocking layers (PBLs) with intended interfacial charges. The interfacial charge of PBLs reducing non-specific protein interactions was controlled by applying charged precursors, especially lysozyme as a positively-charged neutral haemoglobin and BSA as a negatively-charged protein. The hydroxyl groups were brought onto the surface via O2 plasma, -NH2 groups via APTES layer and glutaraldehyde was also useful for forming an amide bond for attachment of the antibodies. The incorporation of neutral PBLs into ISFET was found to be the most suitable technique for monitoring PSMA as a PSA in serum without any post-treatment required, with the analyte detectable in a concentration range of 1 fg mL−1–100 ng mL−1.

4.9. Vascular Endothelial Growth Factor (VEGF)

In addition, the vascular endothelial growth factor (VEGF, 18–27 kDa) [176], as another potential candidate related to PCa diagnostics, can also be overexpressed in other types of cancer (brain, breast, gastrointestinal, lung, urinary tract).
Pan et al. [177] focused on the determination of VEGF and PSA in a serum sample from a PCa patient. The simultaneous detection of VEGF and PSA was demonstrated by a graphene oxide (GO)/ssDNA/PLLA (poly-L-lactide) nanoparticles-based electrochemical label-free biosensor with LODs of 50 pg mL−1 (a linear range of 0.05–100 ng mL−1) and 1 ng/mL (1–100 ng/mL), respectively. The same aim of simultaneously determining VEGF (LOD = 0.15 ng/mL) and PSA (LOD = 0.08 ng/mL) as target biomarkers released from cells (RWPE-1, LNCaP and PC3) was achieved by Crulhas et al. [178] using a biosensor with an interface formed by thiolated aptamers self-assembled on gold electrodes.

5. Glycan-Based PCa Biomarkers

5.1. Lectin-Based Glycan Analysis

In a series of publications we focused on the specific glycoprofiling of proteins such as PSA using electrochemical impedance spectroscopy (EIS) [179,180,181,182] or chronopotentiometry [183] as a sensing principle. In the initial two studies, the EIS-based biosensor based on an immobilised anti-PSA antibody was employed for a bio-affinity capture of PSA and finally the PSA was glycoprofiled using lectins (Figure 9, left) [179,182]. The EIS-based approach for PSA glycoprofiling (Figure 9) was validated using mass spectrometry, which confirmed the presence of 2,6-linked sialic acid (recognised by Sambucus nigra agglutinin—SNA) and fucose (recognised by Lotus tetragonolobus agglutinin—LTA) and a minor level of 2,3-linked sialic acid (recognised by Maackia amurensis agglutinin—MAA) within the glycan structure present on the PSA protein [179]. In the next study, our group showed that such an EIS-based biosensor was able to distinguish serum samples from 3 healthy individuals and serum samples from 3 PCa patients using MAA lectin, while SNA lectin was not able to provide such a good discrimination [180]. The last EIS-based paper investigated various immobilisation strategies on the electrode surface when, instead of a full anti-PSA antibody, an antibody fragment recognising PSA was immobilised. The study showed that the EIS-based biosensor for glycoprofiling of PSA was much more sensitive (i.e., 4-fold) for glycoprofiling of PSA when an antibody fragment rather than a full anti-PSA antibody was immobilised on the electrode surface [181]. The results obtained by EIS-based glycoprofiling of PSA were in excellent agreement with the results obtained using chronopotentiometric detection, indicating low binding of MAA to PSA and strong interaction of SNA with PSA [183]. Optimal platforms of detection were also employed for the selective glycoprofiling of PSA [184].
Surface plasmon field-enhanced fluorescence spectrometry was used for specific glycoprofiling of PSA using one particular lectin, i.e., Wisteria floribunda agglutinin (WFA) recognising the LacdiNAc glycan epitope (GalNAcβ1−4GlcNAc) on PSA. The biosensor was constructed on a disposable sensor chip by immobilisation of an anti-PSA antibody used for selective capture of PSA. Finally, the sensing was completed by incubation of the chip with fluorescently-labelled WFA. The biosensor could glycoprofile as low as 0.01 ng mL−1 of PSA. Analysis of PCa serum samples (n = 44) and BPH serum samples (n = 27) with the PSA level in the slightly extended grey zone (4–20 ng/mL) revealed AUC of 0.851, while detecting the LacdiNAc glycan epitope on PSA using WFA [184]. The clinical usefulness of detection of the LacdiNAc glycan epitope on PSA for PCa diagnostics was also confirmed in other studies [9,185,186]. Enhancement of EIS-based PSA glycoprofiling was achieved using hybrid (magnetic core with a golden shell) magnetic particles with immobilised anti-PSA antibodies [187,188]. PSA bio-captured on magnetic beads was incubated with a lectin-modified electrode (Figure 10). A large complex of magnetic beads accommodated by anti-PSA antibodies and PSA molecules attached to the electrode interface significantly increased the charge-transfer resistance and thus also the EIS-based sensing with a sensitivity enhancement of 43-fold [187].
Besides using antibodies against PSA, the PSA protein can be glycoprofiled in a sandwich configuration using lectins and immobilised DNA aptamers [189]. The chemiluminescent biosensor operating in a microfluidic format can glycoprofile PSA down to 3 ng mL−1 using SNA lectin, while MAA lectin did not interact with the PSA standard [189] (Figure 11). Another optical method for glycoprofiling PSA using lectins was developed in a lateral flow assay format (pregnancy-like tests) [190]. The proof-of-concept device was successfully constructed, but the device was not sufficiently sensitive to glycoprofile PSA at the level present in serum with LOD of 2 μg mL−1; however, the device could provide results within 10 min [190].
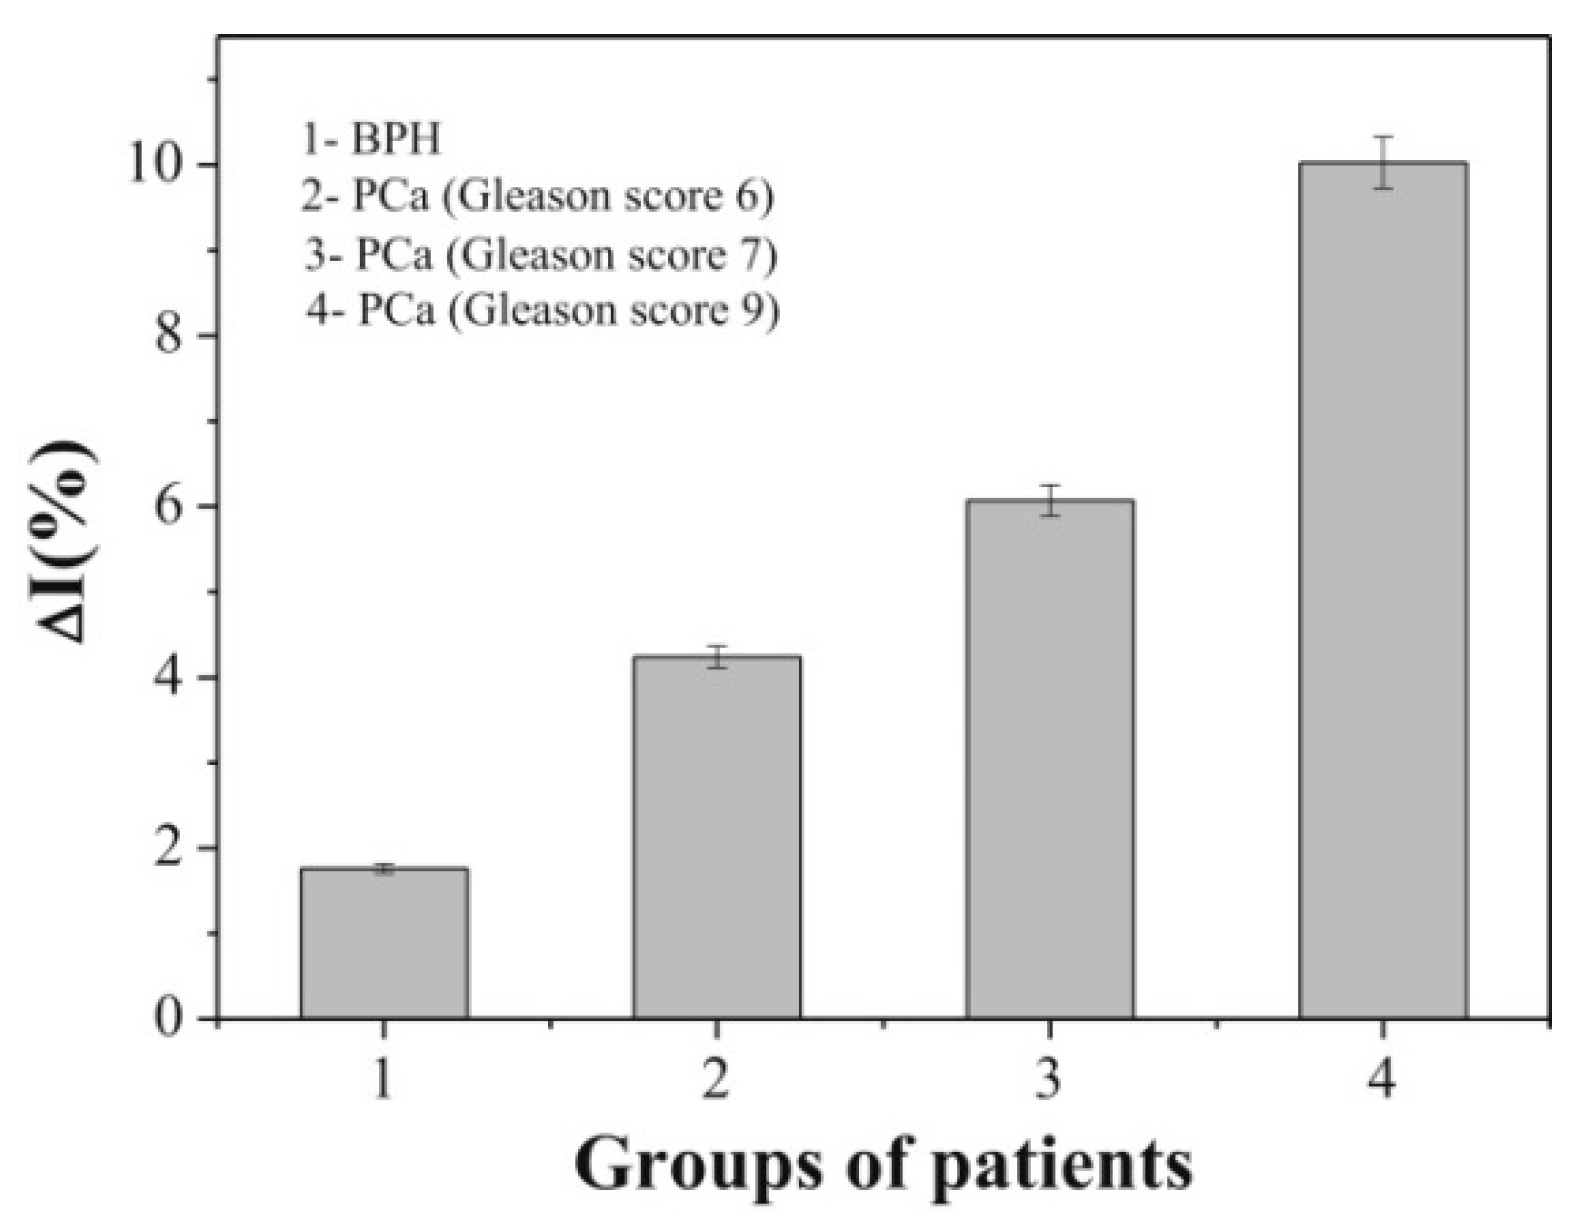
Cratylia mollis lectin recognising mannose glycan units was employed in the analysis of serum samples from PCa patients and patients with BPH [191]. In that case, whole serum glycoprofiling was used for the analysis of serum samples without the involvement of antibodies or DNA aptamers recognising a specific protein (such as PSA). The lectin was immobilised on an electrode modified with CNTs using passive adsorption and the SWV-based electrochemical biosensor was calibrated using fetuin as a model glycoprotein (Figure 12). The analyte was detected down to 0.017 μg mL−1 with a linear range of up to 25 μg mL−1 and the assay was highly reproducible and selective. The biosensor was finally employed in analysis of serum samples, exhibiting significant discrimination power for the analysis of 4 distinct groups of patients (BPH patients, PCa with Gleason score (GS) 6, PCa with GS 7 and PCa with GS 9) (Figure 13) [191].

5.2. Molecularly-Imprinted Polymers (MIPs) for Glycan Analysis

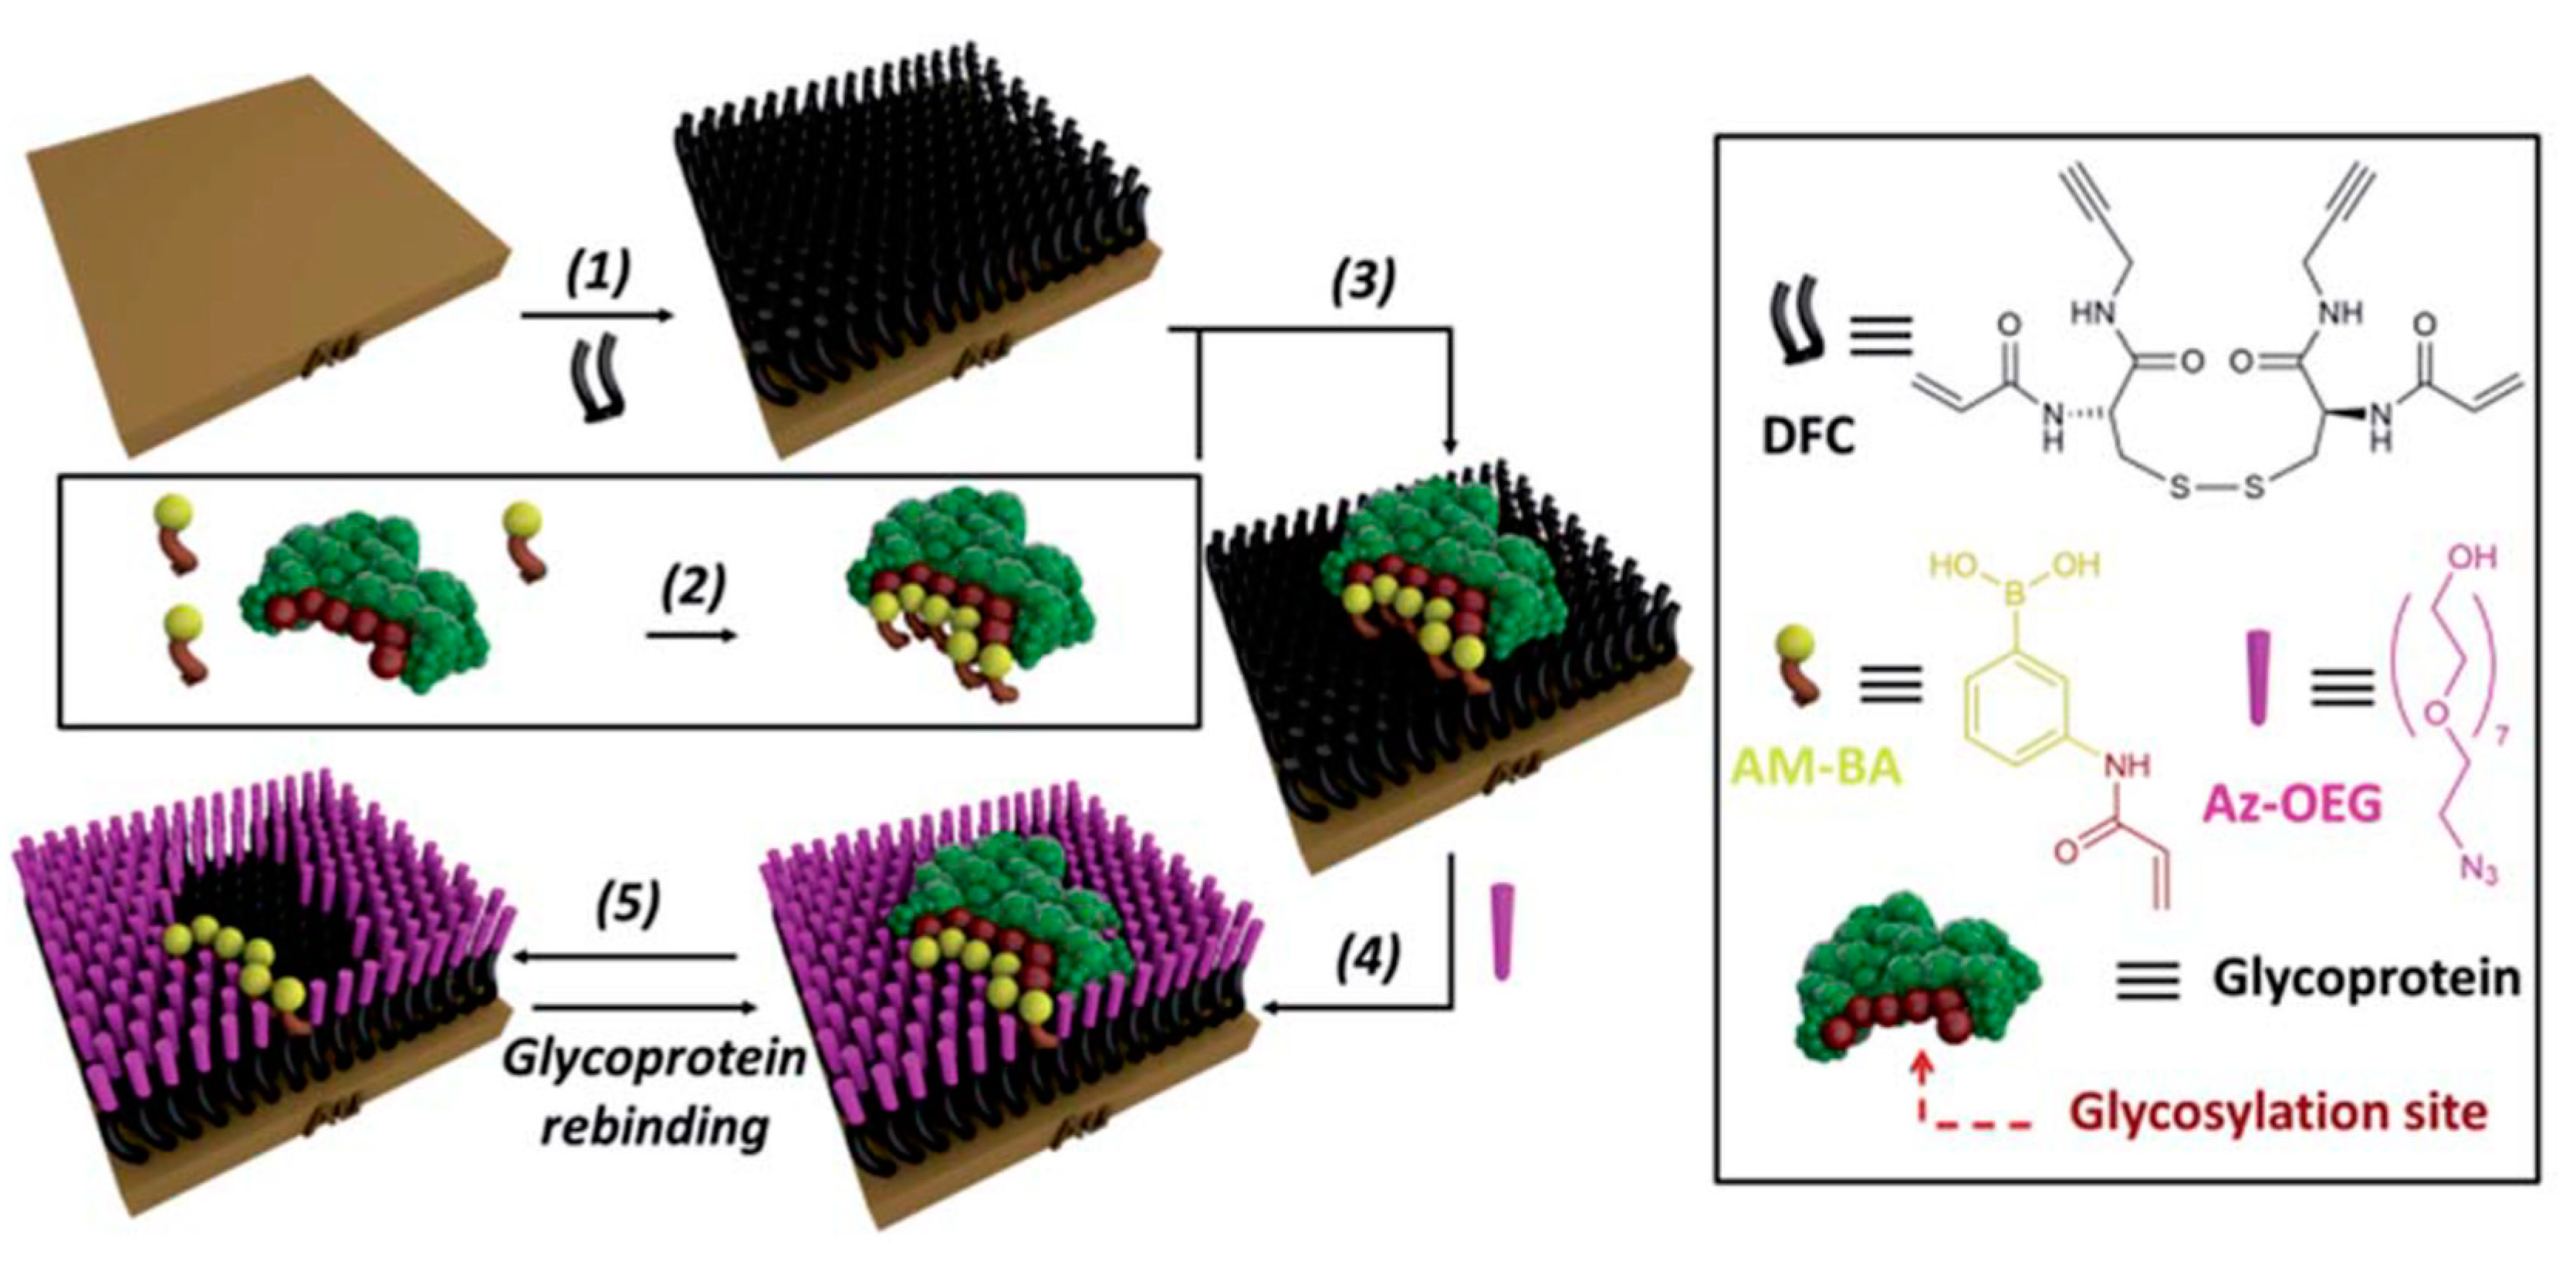
The concept of using molecularly-imprinted polymers (MIPs) for the detection of glycoproteins was pioneered in 2015 for the analysis of PSA [192]. The approach is versatile and efficient, and provides surfaces with strong affinities and high specificities. A sensor platform with a 30-fold selectivity for PSA over other glycoproteins was employed. A pre-formed complex of PSA-acrylamidoboronic acids was grafted onto a functionalised gold surface, providing the immobilisation of the synthetic receptors in spatial arrangements specific to the target glycoprotein. In addition, functionalisation of the surface around the template glycoprotein with oligoethylene glycol moieties facilitated the creation of PSA-shaped cavities (Figure 14). Surface plasmon resonance (SPR) binding studies showed that the nanocavities were specific to PSA, providing high affinity (Kd = 1.8 mM), and detection at nM level [192].
Although a dual-recognition strategy for increasing the selectivity of glycoprotein detection using two types of MIPs was designed for the detection of a carcinoembryonic antigen (CEA), which is a biomarker of other cancer types (but not of PCa), it is worth briefly describing this interesting strategy [193] (Figure 15). This new strategy entitled an orthogonal dual molecularly-imprinted polymer-based plasmonic immuno-sandwich assay (odMIP-PISA) is based on the integration of one MIP (MIP1) recognising the CEA protein epitope, while the second MIP (MIP2) recognises the glycan part of CE via a boronate-imprinted layer. Using this dual-recognition strategy, non-selective binding decreased from 14.4% (protein recognition) or from 15.2% (glycan recognition) to 8.2% while affording LOD of 56 fM. Moreover, the assay exhibited much better operational parameters (linear range, LOD, assay time, sample required, and cost per analysis) than the commercially available ELISA. This assay [193] and a similar one [194] were not, however, employed for the detection of different protein glycoforms. The detection of specific protein glycoforms can, however, be resolved using an array of MIP2s designed to use different glycan templates (Figure 16) [195]. Another strategy to increase the selectivity for detection of a glycoprotein of interest is to block boronate moieties on the MIP outside the cavity, which accommodates the protein [196]. In this particular case, PSA is present within the MIP cavity and all the boronate moieties not occupied by the PSA´s glycan are de-activated using a blocking protocol (i.e., by a capping treatment) [196]. Further details about MIP-based sensing strategies involving glycan recognition are discussed in a review paper [197].

5.3. Detection of Glycoproteins Using Specific Aptamers

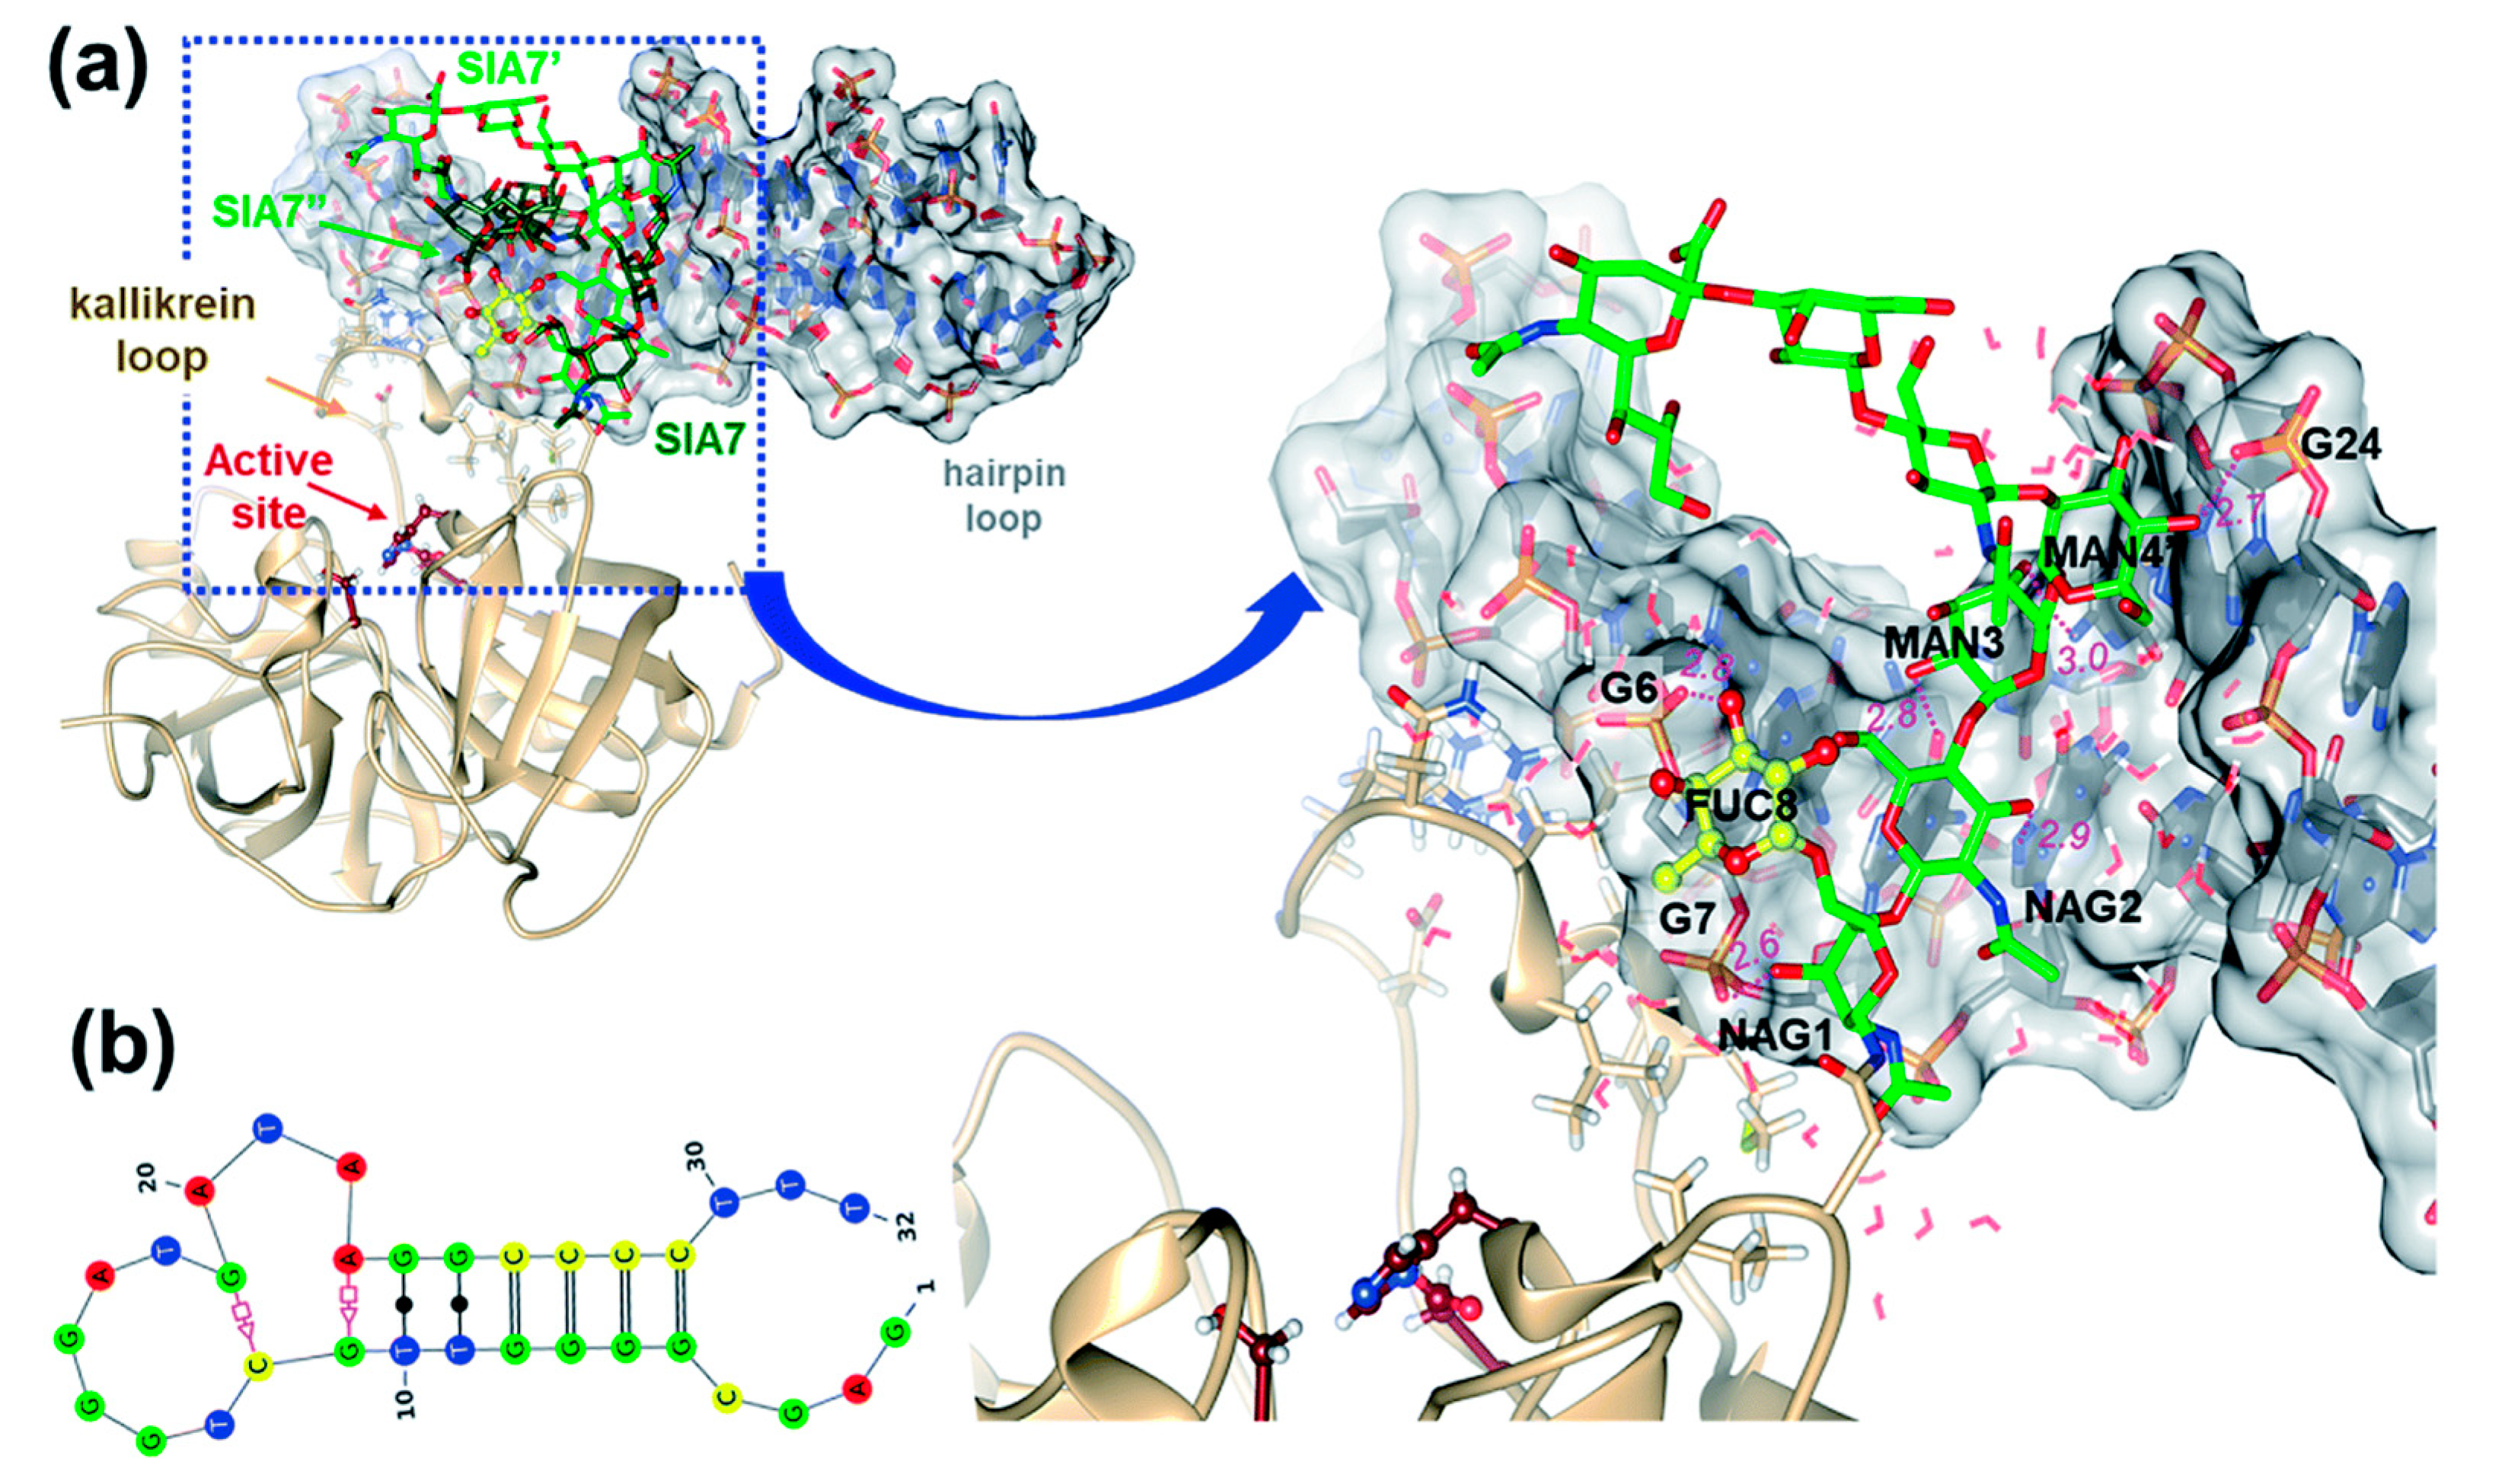
In order to extend the range of glycans that can be recognised by biorecognition elements, it is worth identifying DNA aptamers strongly interacting with glycans. To identify glycan-recognising aptamers, several routes have been employed to date. One is based on the use of glycosylated peptides for the isolation of glycan-binding aptamers [198]. Glycopeptides released from the glycoprotein of interest were imprinted on MPs and those particles were used for positive selection, while MPs with peptides without any glycans were used for negative selection (Figure 17). The authors aimed to select aptamers against a glycan structure to which neither lectins or anti-glycan binding antibodies are currently known, and they identified the two most prospective aptamers recognising a bi-antennary glycan [198].
Lobo-Castanon et al. described in a series of publications the preparation of aptamers recognising a glycan part of the glycoprotein for the selective detection of glycan changes on PSA [199,200,201]. Díaz-Fernández et al. [200] focused on the selection of an aptamer (PSA-1) binding the glycan moiety of PSA with a reasonably high affinity of (177 ± 65) nM. This approach used rationally-designed counter-selections [200]. In order to select an aptamer against a glycan part of PSA, two types of modified magnetic particles were prepared—one with immobilised glycosylated human PSA (hPSA) for positive selection and one with a recombinant form of PSA without any glycosylation (rPSA) as a negative control [199]. At the same time, aptamers recognising BSA, used to block the surface of magnetic beads, were eliminated to obtain specific aptamers PSA-1, which selectively recognise the glycan part of PSA (Figure 18) [199].
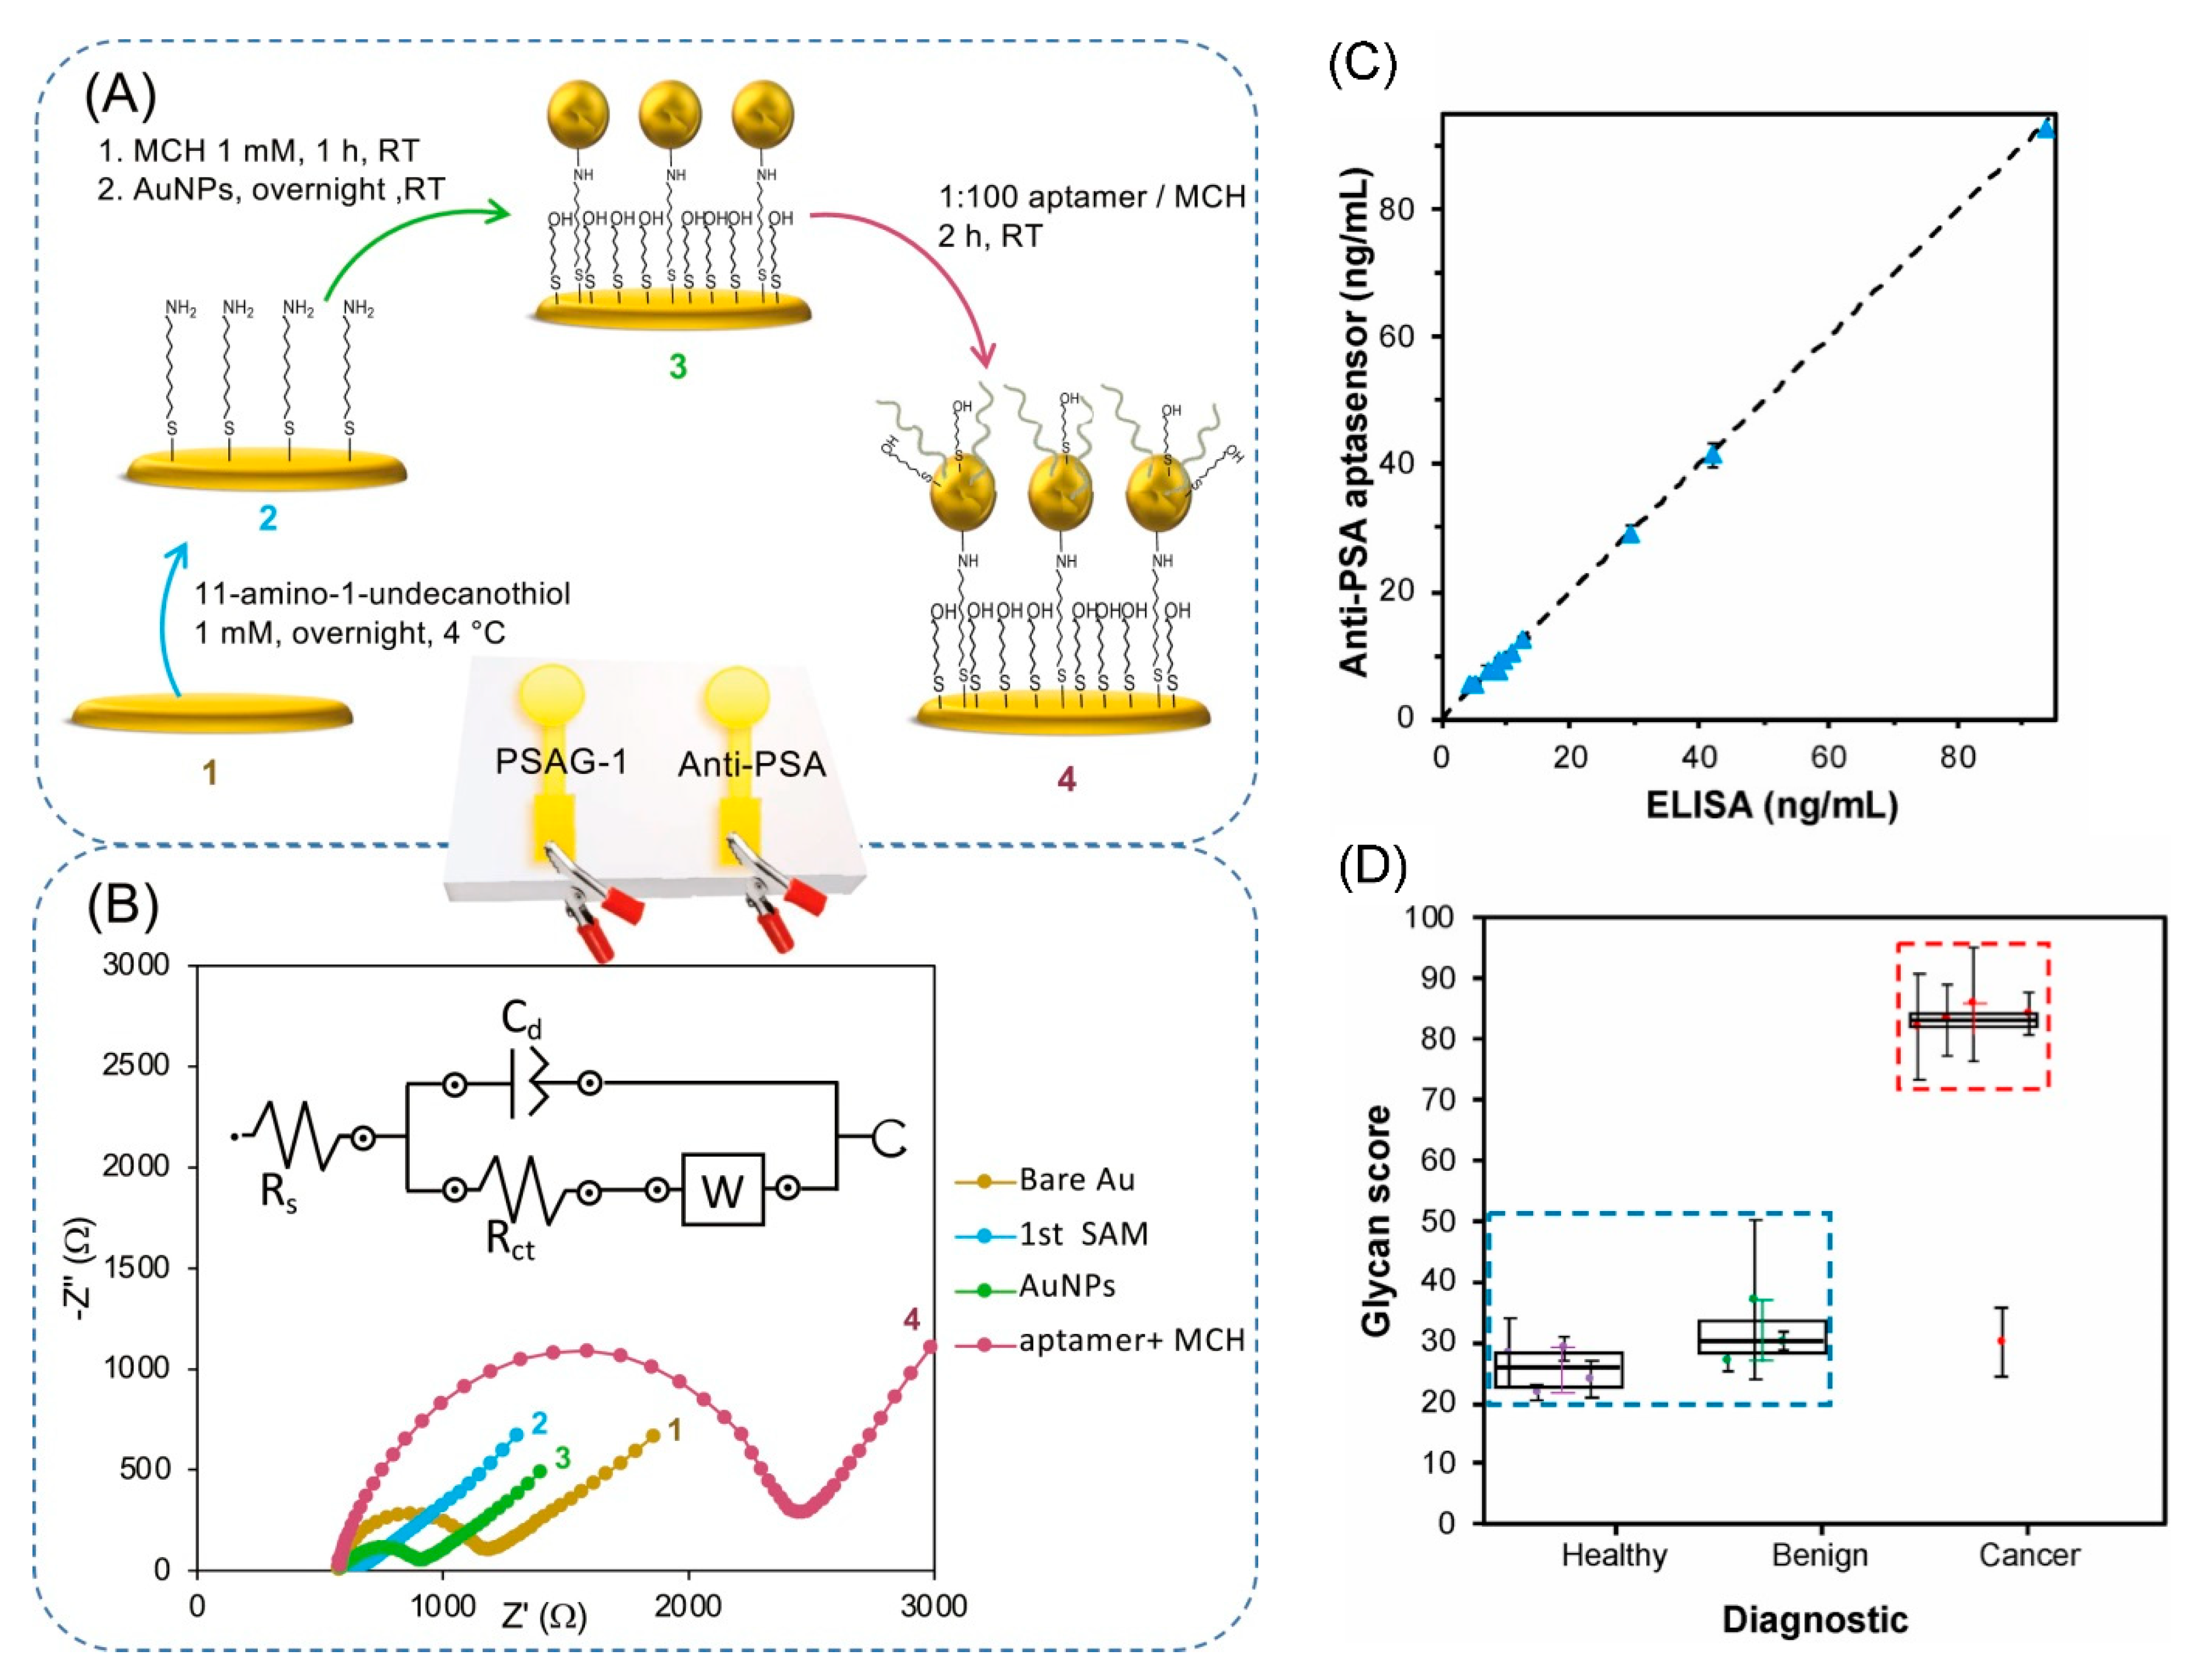
The assay was performed in a sandwich configuration with a PSA aptamer-recognising peptide backbone on PSA immobilised on a SAM-modified interface using a biotin-streptavidin coupling [200]. Next, the PSA was bioaffinity-captured on the interface followed by incubation with a fluorescein-modified PSA1 aptamer recognising the glycan part on PSA. Finally, the electrochemical signal was generated by incubating the interface with a peroxidase-labelled anti-fluorescein antibody and using TMB and H2O2 (Figure 19). The biosensor was able to distinguish the human PSA from the aglycosylated protein with LOD of 0.66 ng mL−1 and the biosensor also worked in serum [200]. In the following paper from the same group, an EIS-biosensor was developed for the detection of PSA (using aptamer-recognising peptide backbone of PSA) and for the detection of glycosylated PSA (using PSA1 aptamer) immobilised onto two adjacent nanostructured gold electrodes (Figure 20) [201]. The biosensor was able to detect the level of PSA in serum across a wide dynamic range (0.64–62.5 ng mL−1) and the level of the glycosylated form of PSA in serum across a wide dynamic range (0.26–62.5 ng mL−1) with high reproducibility (5.4%). The analysis of PSA in serum using the PSA aptamer was in excellent agreement with ELISA, and the PSA1 aptamer biosensor for the detection of glycosylated forms of PSA was able to distinguish the cohort of healthy individuals and the patients with a benign condition from the cohort of PCa patients [201].

6. Conclusions

The first part of the review provides in-depth information about disease aetiology describing molecular aspects of the disease and interplay between such biomolecules. A need for novel and more accurate PCa biomarkers was shortly discussed, as well. Several types of biomarkers have the potential to replace PSA for PCa diagnostics. The main reason for replacing PSA as a diagnostic biomarker is the high false negative rate (resulting in the development and advancement of PCa) or the high false positive rate (resulting in a substantial number of avoidable biopsies). This review proves the high potential of novel biomarkers for performing PCa diagnostics with a high accuracy. However, there is a need for such novel, alternative biomarkers to be fully validated by robust clinical validation studies by the analysis of some hundreds of samples. We found it especially interesting to focus on PCa diagnostics via glycan-based analysis of glycoproteins since this approach has a strong commercial potential and is currently implemented within our start-up Glycanostics.

Author Contributions

Conceptualization, T.B. and J.T.; resources, T.B., J.T. and P.K.; writing—original draft preparation, T.B., A.B., S.H., E.C., N.S., L.L., P.K. and J.T; writing—review and editing, T.B., A.B., S.H., E.C., N.S., L.L, P.K. and J.T; supervision, J.T.; project administration, T.B., P.K and J.T.; funding acquisition, T.B., P.K. and J.T. All authors have read and agreed to the published version of the manuscript.

Funding

The authors would like to acknowledge the financial support received from the Slovak Research and Development Agency APVV 20-0476 and to acknowledge the support received from the Ministry of Health of the Slovak Republic under the project registration number 2019/68-CHÚSAV-1. This publication was jointly supported by Qatar University and Chemical Institute, Slovak Academy of Sciences-IRCC-2020-004. The finding achieved herein is solely the responsibility of the authors. The statements made herein are solely the responsibility of the authors.

Conflicts of Interest

The authors declare no conflict of interest.

References

  1. Bray, F.; Ferlay, J.; Soerjomataram, I.; Siegel, R.L.; Torre, L.A.; Jemal, A. Global cancer statistics 2018: GLOBOCAN estimates of incidence and mortality worldwide for 36 cancers in 185 countries. CA Cancer J. Clin. 2018, 68, 394–424. [Google Scholar] [CrossRef] [PubMed] [Green Version]
  2. Rawla, P. Epidemiology of Prostate Cancer. World J. Oncol. 2019, 10, 63–89. [Google Scholar] [CrossRef] [PubMed] [Green Version]
  3. Kensler, K.H.; Pernar, C.H.; Mahal, B.A.; Nguyen, P.L.; Trinh, Q.-D.; Kibel, A.S.; Rebbeck, T.R. Racial/ethnic variation in PSA testing and prostate cancer incidence following the 2012 U.S.P.S.T.F. recommendation. J. Natl. Cancer Inst. 2020. [Google Scholar] [CrossRef] [PubMed]
  4. Johnson, J.A.; Moser, R.P.; Ellison, G.L.; Martin, D.N. Associations of Prostate-Specific Antigen (PSA) Testing in the US Population: Results from a National Cross-Sectional Survey. J. Community Health 2020. [Google Scholar] [CrossRef]
  5. Tkac, J.; Gajdosova, V.; Hroncekova, S.; Bertok, T.; Hires, M.; Jane, E.; Lorencova, L.; Kasak, P. Prostate-specific antigen glycoprofiling as diagnostic and prognostic biomarker of prostate cancer. Interface Focus 2019, 9. [Google Scholar] [CrossRef] [Green Version]
  6. Mattox, A.K.; Bettegowda, C.; Zhou, S.; Papadopoulos, N.; Kinzler, K.W.; Vogelstein, B. Applications of liquid biopsies for cancer. Sci. Transl. Med. 2019, 11, eaay1984. [Google Scholar] [CrossRef] [Green Version]
  7. Tkac, J.; Bertok, T.; Hires, M.; Jane, E.; Lorencova, L.; Kasak, P. Glycomics of prostate cancer: Updates. Exp. Rev. Proteom. 2019, 16, 65–76. [Google Scholar] [CrossRef]
  8. Gratacós-Mulleras, A.; Duran, A.; Asadi Shehni, A.; Ferrer-Batallé, M.; Ramírez, M.; Comet, J.; de Llorens, R.; Saldova, R.; Llop, E.; Peracaula, R. Characterisation of the main PSA glycoforms in aggressive prostate cancer. Sci. Rep. 2020, 10, 18974. [Google Scholar] [CrossRef] [PubMed]
  9. Bertok, T.; Jane, E.; Bertokova, A.; Lorencova, L.; Zvara, P.; Smolkova, B.; Kucera, R.; Klocker, H.; Tkac, J. Validating fPSA Glycoprofile as a Prostate Cancer Biomarker to Avoid Unnecessary Biopsies and Re-Biopsies. Cancers 2020, 12, 2988. [Google Scholar] [CrossRef]
  10. Murray, N.P.; Fuentealba, C.; Reyes, E.; Lopez, M.A.; Salazar, A.; Minzer, S.; Munoz, L.; Orrego, S.; Guzman, E.; Arzeno, L. Predictive Value of Neutrophil to Lymphocyte Ratio in the Diagnosis of Significant Prostate Cancer at Initial Biopsy: A Comparison with Free Percent Prostate Specific Antigen, Prostate Specific Antigen Density and Primary Circulating Prostate Cells. Asian Pac. J. Cancer Prev. 2019, 20, 3385–3389. [Google Scholar] [CrossRef] [PubMed]
  11. Kawahara, T.; Fukui, S.; Sakamaki, K.; Ito, Y.; Ito, H.; Kobayashi, N.; Izumi, K.; Yokomizo, Y.; Miyoshi, Y.; Makiyama, K.; et al. Neutrophil-to-lymphocyte ratio predicts prostatic carcinoma in men undergoing needle biopsy. Oncotarget 2015, 6. [Google Scholar] [CrossRef] [Green Version]
  12. Dejous, C.; Krishnan, U.M. Sensors for diagnosis of prostate cancer: Looking beyond the prostate specific antigen. Biosens. Bioelectron. 2021, 173, 112790. [Google Scholar] [CrossRef]
  13. Sharma, S.; Zapatero-Rodríguez, J.; O’Kennedy, R. Prostate cancer diagnostics: Clinical challenges and the ongoing need for disruptive and effective diagnostic tools. Biotechnol. Adv. 2017, 35, 135–149. [Google Scholar] [CrossRef]
  14. Hodson, R. Small organ, big reach. Nature 2015, 528, S118–S119. [Google Scholar] [CrossRef]
  15. Siegel, R.L.; Miller, K.D.; Jemal, A. Cancer statistics, 2015. CA Cancer J. Clin. 2015, 65, 5–29. [Google Scholar] [CrossRef]
  16. McNally, C.J.; Ruddock, M.W.; Moore, T.; McKenna, D.J. Biomarkers That Differentiate Benign Prostatic Hyperplasia from Prostate Cancer: A Literature Review. Cancer Manag. Res. 2020, 12, 5225–5241. [Google Scholar] [CrossRef]
  17. Martin, H. Laboratory measurement of urine albumin and urine total protein in screening for proteinuria in chronic kidney disease. Clin. Biochem. Rev. 2011, 32, 97–102. [Google Scholar]
  18. Pereira, M.M.; Calixto, J.D.; Sousa, A.C.A.; Pereira, B.J.; Lima, Á.S.; Coutinho, J.A.P.; Freire, M.G. Towards the differential diagnosis of prostate cancer by the pre-treatment of human urine using ionic liquids. Sci. Rep. 2020, 10, 14931. [Google Scholar] [CrossRef]
  19. Maywald, M.; Wessels, I.; Rink, L. Zinc Signals and Immunity. Int. J. Mol. Sci. 2017, 18, 2222. [Google Scholar] [CrossRef] [Green Version]
  20. Wessels, I.; Maywald, M.; Rink, L. Zinc as a Gatekeeper of Immune Function. Nutrients 2017, 9, 1286. [Google Scholar] [CrossRef] [Green Version]
  21. Kambe, T.; Matsunaga, M.; Takeda, T.-A. Understanding the Contribution of Zinc Transporters in the Function of the Early Secretory Pathway. Int. J. Mol. Sci. 2017, 18, 2179. [Google Scholar] [CrossRef] [Green Version]
  22. Li, D.; Stovall, D.B.; Wang, W.; Sui, G. Advances of Zinc Signaling Studies in Prostate Cancer. Int. J. Mol. Sci. 2020, 21, 667. [Google Scholar] [CrossRef] [Green Version]
  23. Costello, L.C.; Franklin, R.B. A comprehensive review of the role of zinc in normal prostate function and metabolism; and its implications in prostate cancer. Arch. Biochem. Biophys. 2016, 611, 100–112. [Google Scholar] [CrossRef] [Green Version]
  24. Zhao, J.; Wu, Q.; Hu, X.; Dong, X.; Wang, L.; Liu, Q.; Long, Z.; Li, L. Comparative study of serum zinc concentrations in benign and malignant prostate disease: A Systematic Review and Meta-Analysis. Sci. Rep. 2016, 6, 25778. [Google Scholar] [CrossRef] [Green Version]
  25. Hupe, M.C.; Philippi, C.; Roth, D.; Kümpers, C.; Ribbat-Idel, J.; Becker, F.; Joerg, V.; Duensing, S.; Lubczyk, V.H.; Kirfel, J.; et al. Expression of Prostate-Specific Membrane Antigen (PSMA) on Biopsies Is an Independent Risk Stratifier of Prostate Cancer Patients at Time of Initial Diagnosis. Front. Oncol. 2018, 8. [Google Scholar] [CrossRef]
  26. Wüstemann, T.; Haberkorn, U.; Babich, J.; Mier, W. Targeting prostate cancer: Prostate-specific membrane antigen based diagnosis and therapy. Med. Res. Rev. 2019, 39, 40–69. [Google Scholar] [CrossRef] [Green Version]
  27. Fujita, K.; Nonomura, N. Role of Androgen Receptor in Prostate Cancer: A Review. World J. Men Health 2019, 37, 288–295. [Google Scholar] [CrossRef]
  28. Fu, S.; Wan, X.; Du, C.; Wang, H.; Zhou, J.; Wang, Z. A novel fluorescent probe for the early detection of prostate cancer based on endogenous zinc sensing. Prostate 2019, 79, 1378–1385. [Google Scholar] [CrossRef]
  29. An, Y.; Chang, W.; Wang, W.; Wu, H.; Pu, K.; Wu, A.; Qin, Z.; Tao, Y.; Yue, Z.; Wang, P.; et al. A novel tetrapeptide fluorescence sensor for early diagnosis of prostate cancer based on imaging Zn(2+) in healthy versus cancerous cells. J. Adv. Res. 2020, 24, 363–370. [Google Scholar] [CrossRef]
  30. Goldberg, J.M.; Wang, F.; Sessler, C.D.; Vogler, N.W.; Zhang, D.Y.; Loucks, W.H.; Tzounopoulos, T.; Lippard, S.J. Photoactivatable Sensors for Detecting Mobile Zinc. J. Am. Chem. Soc. 2018, 140, 2020–2023. [Google Scholar] [CrossRef]
  31. Teng, Y.; Singh, C.K.; Sadak, O.; Ahmad, N.; Gunasekaran, S. Electrochemical detection of mobile zinc ions for early diagnosis of prostate cancer. J. Electroanal. Chem. 2019, 833, 269–274. [Google Scholar] [CrossRef]
  32. Sarafanov, A.G.; Todorov, T.I.; Centeno, J.A.; Macias, V.; Gao, W.; Liang, W.M.; Beam, C.; Gray, M.A.; Kajdacsy-Balla, A.A. Prostate cancer outcome and tissue levels of metal ions. Prostate 2011, 71, 1231–1238. [Google Scholar] [CrossRef] [PubMed]
  33. Lim, J.T.; Tan, Y.Q.; Valeri, L.; Lee, J.; Geok, P.P.; Chia, S.E.; Ong, C.N.; Seow, W.J. Association between serum heavy metals and prostate cancer risk—A multiple metal analysis. Environ. Int. 2019, 132, 105109. [Google Scholar] [CrossRef]
  34. Vela, D. Iron Metabolism in Prostate Cancer; From Basic Science to New Therapeutic Strategies. Front. Oncol. 2018, 8, 547. [Google Scholar] [CrossRef]
  35. Stelling, M.P.; Motta, J.M.; Mashid, M.; Johnson, W.E.; Pavão, M.S.; Farrell, N.P. Metal ions and the extracellular matrix in tumor migration. FEBS J. 2019, 286, 2950–2964. [Google Scholar] [CrossRef] [Green Version]
  36. Serhan, M.; Jackemeyer, D.; Long, M.; Sprowls, M.; Diez Perez, I.; Maret, W.; Chen, F.; Tao, N.; Forzani, E. Total Iron Measurement in Human Serum with a Novel Smartphone-Based Assay. IEEE J. Trans. Eng. Health Med. 2020, 8, 2800309. [Google Scholar] [CrossRef]
  37. Oshin, O.; Kireev, D.; Hlukhova, H.; Idachaba, F.; Akinwande, D.; Atayero, A. Graphene-Based Biosensor for Early Detection of Iron Deficiency. Sensors 2020, 20, 3688. [Google Scholar] [CrossRef] [PubMed]
  38. Lim, S.D.; Sun, C.; Lambeth, J.D.; Marshall, F.; Amin, M.; Chung, L.; Petros, J.A.; Arnold, R.S. Increased Nox1 and hydrogen peroxide in prostate cancer. Prostate 2005, 62, 200–207. [Google Scholar] [CrossRef] [PubMed]
  39. Han, C.; Wang, Z.; Xu, Y.; Chen, S.; Han, Y.; Li, L.; Wang, M.; Jin, X. Roles of Reactive Oxygen Species in Biological Behaviors of Prostate Cancer. Biomed. Res. Int. 2020, 2020, 1269624. [Google Scholar] [CrossRef]
  40. Nimalasena, S.; Gothard, L.; Anbalagan, S.; Allen, S.; Sinnett, V.; Mohammed, K.; Kothari, G.; Musallam, A.; Lucy, C.; Yu, S.; et al. Intratumoral Hydrogen Peroxide with Radiation Therapy in Locally Advanced Breast Cancer: Results from a Phase 1 Clinical Trial. Int. J. Rad. Oncol. Biol. Phys. 2020, 108, 1019–1029. [Google Scholar] [CrossRef] [PubMed]
  41. Crulhas, B.P.; Ramos, N.P.; Castro, G.R.; Pedrosa, V.A. Detection of hydrogen peroxide releasing from prostate cancer cell using a biosensor. J. Solid State Electrochem. 2016, 20, 2427–2433. [Google Scholar] [CrossRef] [Green Version]
  42. Chen, Q.; Cheng, K.; Wang, W.; Yang, L.; Xie, Y.; Feng, L.; Zhang, J.; Zhang, H.; Sun, H. A pyrene-based ratiometric fluorescent probe with a large Stokes shift for selective detection of hydrogen peroxide in living cells. J. Pharm. Anal. 2020, 10, 490–497. [Google Scholar] [CrossRef]
  43. Lorencova, L.; Bertok, T.; Dosekova, E.; Holazova, A.; Paprckova, D.; Vikartovska, A.; Sasinkova, V.; Filip, J.; Kasak, P.; Jerigova, M.; et al. Electrochemical performance of Ti(3)C(2)T(x) MXene in aqueous media: Towards ultrasensitive H2O2 sensing. Electrochim. Acta 2017, 235, 471–479. [Google Scholar] [CrossRef] [Green Version]
  44. Hroncekova, S.; Bertok, T.; Hires, M.; Jane, E.; Lorencova, L.; Vikartovska, A.; Tanvir, A.; Kasak, P.; Tkac, J. Ultrasensitive Ti3C2TX MXene/Chitosan Nanocomposite-Based Amperometric Biosensor for Detection of Potential Prostate Cancer Marker in Urine Samples. Processes 2020, 8, 580. [Google Scholar] [CrossRef]
  45. Strmiska, V.; Michalek, P.; Lackova, Z.; Guran, R.; Krizkova, S.; Vanickova, L.; Zitka, O.; Stiborova, M.; Eckschlager, T.; Klejdus, B.; et al. Sarcosine is a prostate epigenetic modifier that elicits aberrant methylation patterns through the SAMe-Dnmts axis. Mol. Oncol. 2019, 13, 1002–1017. [Google Scholar] [CrossRef] [Green Version]
  46. Sreekumar, A.; Poisson, L.M.; Rajendiran, T.M.; Khan, A.P.; Cao, Q.; Yu, J.; Laxman, B.; Mehra, R.; Lonigro, R.J.; Li, Y.; et al. Metabolomic profiles delineate potential role for sarcosine in prostate cancer progression. Nature 2009, 457, 910–914. [Google Scholar] [CrossRef] [PubMed] [Green Version]
  47. Cernei, N.; Heger, Z.; Gumulec, J.; Zitka, O.; Masarik, M.; Babula, P.; Eckschlager, T.; Stiborova, M.; Kizek, R.; Adam, V. Sarcosine as a potential prostate cancer biomarker—A review. Int. J. Mol. Sci. 2013, 14, 13893–13908. [Google Scholar] [CrossRef] [PubMed] [Green Version]
  48. Jornet-Martínez, N.; Henderson, C.J.; Campíns-Falcó, P.; Daly, R.; Hall, E.A.H. Towards sarcosine determination in urine for prostatic carcinoma detection. Sens. Actuators B Chem. 2019, 287, 380–389. [Google Scholar] [CrossRef]
  49. Heger, Z.; Merlos Rodrigo, M.A.; Michalek, P.; Polanska, H.; Masarik, M.; Vit, V.; Plevova, M.; Pacik, D.; Eckschlager, T.; Stiborova, M.; et al. Sarcosine Up-Regulates Expression of Genes Involved in Cell Cycle Progression of Metastatic Models of Prostate Cancer. PLoS ONE 2016, 11, e0165830. [Google Scholar] [CrossRef]
  50. Rebelo, T.S.; Pereira, C.M.; Sales, M.G.; Noronha, J.P.; Costa-Rodrigues, J.; Silva, F.; Fernandes, M.H. Sarcosine oxidase composite screen-printed electrode for sarcosine determination in biological samples. Anal. Chim. Acta 2014, 850, 26–32. [Google Scholar] [CrossRef] [PubMed] [Green Version]
  51. Struys, E.A.; Heijboer, A.C.; van Moorselaar, J.; Jakobs, C.; Blankenstein, M.A. Serum sarcosine is not a marker for prostate cancer. Ann. Clin. Biochem. 2010, 47, 282. [Google Scholar] [CrossRef] [Green Version]
  52. Ankerst, D.P.; Liss, M.; Zapata, D.; Hoefler, J.; Thompson, I.M.; Leach, R.J. A case control study of sarcosine as an early prostate cancer detection biomarker. BMC Urol. 2015, 15, 99. [Google Scholar] [CrossRef] [Green Version]
  53. Wang, M.; Zou, L.; Liang, J.; Wang, X.; Zhang, D.; Fang, Y.; Zhang, J.; Xiao, F.; Liu, M. The Urinary Sarcosine/Creatinine Ratio is a Potential Diagnostic and Prognostic Marker in Prostate Cancer. Med. Sci. Monit. 2018, 24, 3034–3041. [Google Scholar] [CrossRef]
  54. Gkotsos, G.; Virgiliou, C.; Lagoudaki, I.; Sardeli, C.; Raikos, N.; Theodoridis, G.; Dimitriadis, G. The Role of Sarcosine, Uracil, and Kynurenic Acid Metabolism in Urine for Diagnosis and Progression Monitoring of Prostate Cancer. Metabolites 2017, 7, 9. [Google Scholar] [CrossRef] [Green Version]
  55. Kdadra, M.; Höckner, S.; Leung, H.; Kremer, W.; Schiffer, E. Metabolomics Biomarkers of Prostate Cancer: A Systematic Review. Diagnostics 2019, 9, 21. [Google Scholar] [CrossRef] [Green Version]
  56. Spur, E.-M.; Decelle, E.A.; Cheng, L.L. Metabolomic imaging of prostate cancer with magnetic resonance spectroscopy and mass spectrometry. Eur. J. Nucl. Med. Mol. Imaging 2013, 40, 60–71. [Google Scholar] [CrossRef] [Green Version]
  57. Lima, A.R.; Bastos, M.d.L.; Carvalho, M.; Guedes de Pinho, P. Biomarker Discovery in Human Prostate Cancer: An Update in Metabolomics Studies. Transl. Oncol. 2016, 9, 357–370. [Google Scholar] [CrossRef] [Green Version]
  58. Chatzakos, V.; Slätis, K.; Djureinovic, T.; Helleday, T.; Hunt, M.C. N-acyl taurines are anti-proliferative in prostate cancer cells. Lipids 2012, 47, 355–361. [Google Scholar] [CrossRef]
  59. Fernández-Peralbo, M.A.; Gómez-Gómez, E.; Calderón-Santiago, M.; Carrasco-Valiente, J.; Ruiz-García, J.; Requena-Tapia, M.J.; Luque de Castro, M.D.; Priego-Capote, F. Prostate Cancer Patients–Negative Biopsy Controls Discrimination by Untargeted Metabolomics Analysis of Urine by LC-QTOF: Upstream Information on Other Omics. Sci. Rep. 2016, 6, 38243. [Google Scholar] [CrossRef] [Green Version]
  60. Dereziński, P.; Klupczynska, A.; Sawicki, W.; Pałka, J.A.; Kokot, Z.J. Amino Acid Profiles of Serum and Urine in Search for Prostate Cancer Biomarkers: A Pilot Study. Int. J. Med. Sci. 2017, 14, 1–12. [Google Scholar] [CrossRef] [Green Version]
  61. Giskeødegård, G.F.; Hansen, A.F.; Bertilsson, H.; Gonzalez, S.V.; Kristiansen, K.A.; Bruheim, P.; Mjøs, S.A.; Angelsen, A.; Bathen, T.F.; Tessem, M.B. Metabolic markers in blood can separate prostate cancer from benign prostatic hyperplasia. Br. J. Cancer 2015, 113, 1712–1719. [Google Scholar] [CrossRef] [PubMed]
  62. Schmidt, J.A.; Fensom, G.K.; Rinaldi, S.; Scalbert, A.; Appleby, P.N.; Achaintre, D.; Gicquiau, A.; Gunter, M.J.; Ferrari, P.; Kaaks, R.; et al. Pre-diagnostic metabolite concentrations and prostate cancer risk in 1077 cases and 1077 matched controls in the European Prospective Investigation into Cancer and Nutrition. BMC Med. 2017, 15, 122. [Google Scholar] [CrossRef] [PubMed]
  63. Stabler, S.; Koyama, T.; Zhao, Z.; Martinez-Ferrer, M.; Allen, R.H.; Luka, Z.; Loukachevitch, L.V.; Clark, P.E.; Wagner, C.; Bhowmick, N.A. Serum methionine metabolites are risk factors for metastatic prostate cancer progression. PLoS ONE 2011, 6, e22486. [Google Scholar] [CrossRef] [Green Version]
  64. Schuster, D.M.; Nanni, C.; Fanti, S. Evaluation of Prostate Cancer with Radiolabeled Amino Acid Analogs. J. Nucl. Med. 2016, 57, 61s–66s. [Google Scholar] [CrossRef] [Green Version]
  65. Kobus, T.; Wright, A.J.; Weiland, E.; Heerschap, A.; Scheenen, T.W.J. Metabolite ratios in 1H MR spectroscopic imaging of the prostate. Magn. Res. Med. 2015, 73, 1–12. [Google Scholar] [CrossRef]
  66. Lad, U.; Kale, G.M.; Bryaskova, R. Sarcosine Oxidase Encapsulated Polyvinyl Alcohol-Silica-AuNP Hybrid Films for Sarcosine Sensing Electrochemical Bioelectrode. J. Electrochem. Soc. 2014, 161, B98–B101. [Google Scholar] [CrossRef]
  67. Narwal, V.; Kumar, P.; Joon, P.; Pundir, C.S. Fabrication of an amperometric sarcosine biosensor based on sarcosine oxidase/chitosan/CuNPs/c-MWCNT/Au electrode for detection of prostate cancer. Enzym. Microb. Technol. 2018, 113, 44–51. [Google Scholar] [CrossRef]
  68. Kumar, P.; Narwal, V.; Jaiwal, R.; Pundir, C.S. Construction and application of amperometric sarcosine biosensor based on SOxNPs/AuE for determination of prostate cancer. Biosens. Bioelectron. 2018, 122, 140–146. [Google Scholar] [CrossRef]
  69. Yang, H.; Wang, J.; Yang, C.; Zhao, X.; Xie, S.; Ge, Z. Nano Pt@ZIF8 Modified Electrode and Its Application to Detect Sarcosine. J. Electrochem. Soc. 2018, 165, H247–H250. [Google Scholar] [CrossRef]
  70. Hu, J.; Wei, W.; Ke, S.; Zeng, X.; Lin, P. A novel and sensitive sarcosine biosensor based on organic electrochemical transistor. Electrochim. Acta 2019, 307, 100–106. [Google Scholar] [CrossRef]
  71. Wang, Q.; Zhao, Y.; Yang, Q.; Du, D.; Yang, H.; Lin, Y. Amperometric sarcosine biosensor with strong anti-interference capabilities based on mesoporous organic-inorganic hybrid materials. Biosens. Bioelectron. 2019, 141, 111431. [Google Scholar] [CrossRef]
  72. Li, J.; Ma, J.; Zhang, Y.; Zhang, Z.; He, G. An amperometric biosensor for the assay of sarcosine based on the cross coupled chemical and electrochemical reactions with practical applications. J. Electroanal. Chem. 2019, 833, 568–572. [Google Scholar] [CrossRef]
  73. Yang, Q.; Li, N.; Li, Q.; Chen, S.; Wang, H.-L.; Yang, H. Amperometric sarcosine biosensor based on hollow magnetic Pt–Fe3O4@C nanospheres. Anal. Chim. Acta 2019, 1078, 161–167. [Google Scholar] [CrossRef]
  74. Tang, P.; Wang, Y.; He, F. Electrochemical sensor based on super-magnetic metal–organic framework@molecularly imprinted polymer for Sarcosine detection in urine. J. Saudi Chem. Soc. 2020, 24, 620–630. [Google Scholar] [CrossRef]
  75. Özkütük, E.B.; Diltemiz, S.E.; Avcı, Ş.; Uğurağ, D.; Aykanat, R.B.; Ersöz, A.; Say, R. Potentiometric sensor fabrication having 2D sarcosine memories and analytical features. Mat. Sci. Eng. C 2016, 69, 231–235. [Google Scholar] [CrossRef] [PubMed]
  76. Altunkök, N.; Biçen Ünlüer, Ö.; Birlik Özkütük, E.; Ersöz, A. Development of potentıometrıc bıosensor for dıagnosıs of prostate cancer. Mat. Sci. Eng. B 2021, 263, 114789. [Google Scholar] [CrossRef]
  77. Nguy, T.P.; Van Phi, T.; Tram, D.T.N.; Eersels, K.; Wagner, P.; Lien, T.T.N. Development of an impedimetric sensor for the label-free detection of the amino acid sarcosine with molecularly imprinted polymer receptors. Sens. Actuator B Chem. 2017, 246, 461–470. [Google Scholar] [CrossRef]
  78. Lan, J.; Xu, W.; Wan, Q.; Zhang, X.; Lin, J.; Chen, J.; Chen, J. Colorimetric determination of sarcosine in urine samples of prostatic carcinoma by mimic enzyme palladium nanoparticles. Anal. Chim. Acta 2014, 825, 63–68. [Google Scholar] [CrossRef]
  79. Xue, Z.; Yin, B.; Wang, H.; Li, M.; Rao, H.; Liu, X.; Zhou, X.; Lu, X. An organic indicator functionalized graphene oxide nanocomposite-based colorimetric assay for the detection of sarcosine. Nanoscale 2016, 8, 5488–5496. [Google Scholar] [CrossRef]
  80. Heger, Z.; Cernei, N.; Krizkova, S.; Masarik, M.; Kopel, P.; Hodek, P.; Zitka, O.; Adam, V.; Kizek, R. Paramagnetic Nanoparticles as a Platform for FRET-Based Sarcosine Picomolar Detection. Sci. Rep. 2015, 5, 8868. [Google Scholar] [CrossRef] [Green Version]
  81. Luo, Y.; Wang, J.; Yang, L.; Gao, T.; Pei, R. In vitro selection of DNA aptamers for the development of fluorescent aptasensor for sarcosine detection. Sens. Actuator B Chem. 2018, 276, 128–135. [Google Scholar] [CrossRef]
  82. Cornu, J.-N.; Cancel-Tassin, G.; Ondet, V.; Girardet, C.; Cussenot, O. Olfactory Detection of Prostate Cancer by Dogs Sniffing Urine: A Step Forward in Early Diagnosis. Eur. Urol. 2011, 59, 197–201. [Google Scholar] [CrossRef] [PubMed]
  83. Pascual, L.; Campos, I.; Vivancos, J.-L.; Quintás, G.; Loras, A.; Martínez-Bisbal, M.C.; Martínez-Máñez, R.; Boronat, F.; Ruiz-Cerdà, J.L. Detection of prostate cancer using a voltammetric electronic tongue. Analyst 2016, 141, 4562–4567. [Google Scholar] [CrossRef] [PubMed] [Green Version]
  84. Chen, Y.; Wang, K.; Liu, T.; Chen, J.; Lv, W.; Yang, W.; Xu, S.; Wang, X.; Li, L. Decreased glucose bioavailability and elevated aspartate metabolism in prostate cancer cells undergoing epithelial-mesenchymal transition. J. Cell. Physiol. 2020, 235, 5602–5612. [Google Scholar] [CrossRef] [PubMed]
  85. Zhao, Y.; Shen, Y.; Wen, Y.; Campbell, R.E. High-Performance Intensiometric Direct- and Inverse-Response Genetically Encoded Biosensors for Citrate. ACS Cent. Sci. 2020, 6, 1441–1450. [Google Scholar] [CrossRef]
  86. Abarghoei, S.; Fakhri, N.; Borghei, Y.S.; Hosseini, M.; Ganjali, M.R. A colorimetric paper sensor for citrate as biomarker for early stage detection of prostate cancer based on peroxidase-like activity of cysteine-capped gold nanoclusters. Spectrochim. Acta A Mol. Biomol. Spectrosc. 2019, 210, 251–259. [Google Scholar] [CrossRef] [PubMed]
  87. Shen, H.; Liu, B.; Liu, D.; Zhu, X.; Wei, X.; Yu, L.; Shen, Q.; Qu, P.; Xu, M. Lanthanide coordination polymer-based biosensor for citrate detection in urine. Anal. Methods 2019, 11, 1405–1409. [Google Scholar] [CrossRef]
  88. Tsoi, T.H.; Chan, C.F.; Chan, W.L.; Chiu, K.F.; Wong, W.T.; Ng, C.F.; Wong, K.L. Urinary Polyamines: A Pilot Study on Their Roles as Prostate Cancer Detection Biomarkers. PLoS ONE 2016, 11, e0162217. [Google Scholar] [CrossRef] [Green Version]
  89. Fan, J.; Feng, Z.; Chen, N. Spermidine as a target for cancer therapy. Pharmacol. Res. 2020, 159, 104943. [Google Scholar] [CrossRef]
  90. Nair, R.R.; Debnath, S.; Das, S.; Wakchaure, P.; Ganguly, B.; Chatterjee, P.B. A Highly Selective Turn-On Biosensor for Measuring Spermine/Spermidine in Human Urine and Blood. ACS Appl. Bio Mater. 2019, 2, 2374–2387. [Google Scholar] [CrossRef]
  91. Weinstein, S.J.; Mackrain, K.; Stolzenberg-Solomon, R.Z.; Selhub, J.; Virtamo, J.; Albanes, D. Serum creatinine and prostate cancer risk in a prospective study. Cancer Epidemiol. Biomark. Prev. 2009, 18, 2643–2649. [Google Scholar] [CrossRef] [Green Version]
  92. Pundir, C.S.; Kumar, P.; Jaiwal, R. Biosensing methods for determination of creatinine: A review. Biosens. Bioelectron. 2019, 126, 707–724. [Google Scholar] [CrossRef]
  93. Rule, A.D.; Jacobson, D.J.; Roberts, R.O.; Girman, C.J.; McGree, M.E.; Lieber, M.M.; Jacobsen, S.J. The association between benign prostatic hyperplasia and chronic kidney disease in community-dwelling men. Kidney Int. 2005, 67, 2376–2382. [Google Scholar] [CrossRef] [Green Version]
  94. Moura-Melo, S.; Miranda-Castro, R.; de-Los-Santos-Álvarez, N.; Miranda-Ordieres, A.J.; Dos Santos Junior, J.R.; da Silva Fonseca, R.A.; Lobo-Castañón, M.J. A Quantitative PCR-Electrochemical Genosensor Test for the Screening of Biotech Crops. Sensors 2017, 17, 881. [Google Scholar] [CrossRef] [PubMed] [Green Version]
  95. Rosario, R.; Mutharasan, R. Nucleic acid electrochemical and electromechanical biosensors: A review of techniques and developments. Rev. Anal. Chem 2014, 33, 213–230. [Google Scholar] [CrossRef]
  96. Marks, L.S.; Bostwick, D.G. Prostate Cancer Specificity of PCA3 Gene Testing: Examples from Clinical Practice. Rev. Urol. 2008, 10, 175–181. [Google Scholar]
  97. Merola, R.; Tomao, L.; Antenucci, A.; Sperduti, I.; Sentinelli, S.; Masi, S.; Mandoj, C.; Orlandi, G.; Papalia, R.; Guaglianone, S.; et al. PCA3 in prostate cancer and tumor aggressiveness detection on 407 high-risk patients: A National Cancer Institute experience. J. Exp. Clin. Cancer Res. 2015, 34, 15. [Google Scholar] [CrossRef] [Green Version]
  98. Barbera, M.; Pepe, P.; Paola, Q.; Aragona, F. PCA3 score accuracy in diagnosing prostate cancer at repeat biopsy: Our experience in 177 patients. Arch. Ital. Urol. Androl. 2012, 84, 227–229. [Google Scholar]
  99. Marks, L.S.; Fradet, Y.; Deras, I.L.; Blase, A.; Mathis, J.; Aubin, S.M.; Cancio, A.T.; Desaulniers, M.; Ellis, W.J.; Rittenhouse, H.; et al. PCA3 molecular urine assay for prostate cancer in men undergoing repeat biopsy. Urology 2007, 69, 532–535. [Google Scholar] [CrossRef]
  100. Qin, Z.; Yao, J.; Xu, L.; Xu, Z.; Ge, Y.; Zhou, L.; Zhao, F.; Jia, R. Diagnosis accuracy of PCA3 level in patients with prostate cancer: A systematic review with meta-analysis. Int. Braz. J. Urol. 2020, 46, 691–704. [Google Scholar] [CrossRef] [PubMed]
  101. Wang, T.; Qu, X.; Jiang, J.; Gao, P.; Zhao, D.; Lian, X.; Li, X. Diagnostic significance of urinary long non-coding PCA3 RNA in prostate cancer. Oncotarget 2017, 8, 58577–58586. [Google Scholar] [CrossRef] [Green Version]
  102. Soares, J.C.; Soares, A.C.; Rodrigues, V.C.; Melendez, M.E.; Santos, A.C.; Faria, E.F.; Reis, R.M.; Carvalho, A.L.; Oliveira, O.N. Detection of the Prostate Cancer Biomarker PCA3 with Electrochemical and Impedance-Based Biosensors. ACS Appl. Mater. Interf. 2019, 11, 46645–46650. [Google Scholar] [CrossRef]
  103. Bertok, T.; Lorencova, L.; Chocholova, E.; Jane, E.; Vikartovska, A.; Kasak, P.; Tkac, J. Electrochemical Impedance Spectroscopy Based Biosensors: Mechanistic Principles, Analytical Examples and Challenges towards Commercialization for Assays of Protein Cancer Biomarkers. ChemElectroChem 2019, 6, 989–1003. [Google Scholar] [CrossRef] [Green Version]
  104. Gajdosova, V.P.; Lorencova, L.; Blsakova, A.; Kasak, P.; Bertok, T.; Tkac, J. Challenges for impedimetric affinity sensors targeting proteins detection. Curr. Opin. Electrochem. 2021, 28, 100717. [Google Scholar] [CrossRef]
  105. Rodrigues, V.C.; Soares, J.C.; Soares, A.C.; Braz, D.C.; Melendez, M.E.; Ribas, L.C.; Scabini, L.F.S.; Bruno, O.M.; Carvalho, A.L.; Reis, R.M.; et al. Electrochemical and optical detection and machine learning applied to images of genosensors for diagnosis of prostate cancer with the biomarker PCA3. Talanta 2021, 222, 121444. [Google Scholar] [CrossRef]
  106. Fu, X.; Wen, J.; Li, J.; Lin, H.; Liu, Y.; Zhuang, X.; Tian, C.; Chen, L. Highly sensitive detection of prostate cancer specific PCA3 mimic DNA using SERS-based competitive lateral flow assay. Nanoscale 2019, 11, 15530–15536. [Google Scholar] [CrossRef]
  107. Vilela, P.; El-Sagheer, A.; Millar, T.M.; Brown, T.; Muskens, O.L.; Kanaras, A.G. Graphene Oxide-Upconversion Nanoparticle Based Optical Sensors for Targeted Detection of mRNA Biomarkers Present in Alzheimer’s Disease and Prostate Cancer. ACS Sens. 2017, 2, 52–56. [Google Scholar] [CrossRef] [PubMed] [Green Version]
  108. Yamkamon, V.; Htoo, K.P.P.; Yainoy, S.; Suksrichavalit, T.; Tangchaikeeree, T.; Eiamphungporn, W. Urinary PCA3 detection in prostate cancer by magnetic nanoparticles coupled with colorimetric enzyme-linked oligonucleotide assay. EXCLI J. 2020, 19, 501–513. [Google Scholar]
  109. Ashrafizadeh, M.; Hushmandi, K.; Rahmani Moghadam, E.; Zarrin, V.; Hosseinzadeh Kashani, S.; Bokaie, S.; Najafi, M.; Tavakol, S.; Mohammadinejad, R.; Nabavi, N.; et al. Progress in Delivery of siRNA-Based Therapeutics Employing Nano-Vehicles for Treatment of Prostate Cancer. Bioengineering 2020, 7, 91. [Google Scholar] [CrossRef] [PubMed]
  110. Tavallaie, R.; De Almeida, S.R.; Gooding, J.J. Toward biosensors for the detection of circulating microRNA as a cancer biomarker: An overview of the challenges and successes. Wiley Interdiscip. Rev. Nanomed. Nanobiotechnol. 2015, 7, 580–592. [Google Scholar] [CrossRef]
  111. Kim, W.T.; Kim, W.-J. MicroRNAs in prostate cancer. Prostate Int. 2013, 1, 3–9. [Google Scholar] [CrossRef] [PubMed] [Green Version]
  112. D’Agata, R.; Spoto, G. Advanced methods for microRNA biosensing: A problem-solving perspective. Anal. Bioanal. Chem. 2019, 411, 4425–4444. [Google Scholar] [CrossRef]
  113. Kasomva, K.; Sen, A.; Paulraj, M.G.; Sailo, S.; Raphael, V.; Puro, K.-U.; Assumi, S.R.; Ignacimuthu, S. Roles of microRNA in prostate cancer cell metabolism. Int. J. Biochem. Cell Biol. 2018, 102, 109–116. [Google Scholar] [CrossRef] [PubMed]
  114. Mompeón, A.; Ortega-Paz, L.; Vidal-Gómez, X.; Costa, T.J.; Pérez-Cremades, D.; Garcia-Blas, S.; Brugaletta, S.; Sanchis, J.; Sabate, M.; Novella, S.; et al. Disparate miRNA expression in serum and plasma of patients with acute myocardial infarction: A systematic and paired comparative analysis. Sci. Rep. 2020, 10, 5373. [Google Scholar] [CrossRef]
  115. Sabahi, A.; Salahandish, R.; Ghaffarinejad, A.; Omidinia, E. Electrochemical nano-genosensor for highly sensitive detection of miR-21 biomarker based on SWCNT-grafted dendritic Au nanostructure for early detection of prostate cancer. Talanta 2020, 209, 120595. [Google Scholar] [CrossRef]
  116. Smith, D.A.; Newbury, L.J.; Drago, G.; Bowen, T.; Redman, J.E. Electrochemical detection of urinary microRNAs via sulfonamide-bound antisense hybridisation. Sens. Actuators B Chem. 2017, 253, 335–341. [Google Scholar] [CrossRef]
  117. Ibrahim, N.H.; Abdellateif, M.S.; Thabet, G.; Kassem, S.H.; El-Salam, M.A.; El-Leithy, A.A.; Selim, M.M. Combining PHI and miRNAs as Biomarkers in Prostate Cancer Diagnosis and Prognosis. Clin. Lab. 2019, 65. [Google Scholar] [CrossRef]
  118. Bidarra, D.; Constâncio, V.; Barros-Silva, D.; Ramalho-Carvalho, J.; Moreira-Barbosa, C.; Antunes, L.; Maurício, J.; Oliveira, J.; Henrique, R.; Jerónimo, C. Circulating MicroRNAs as Biomarkers for Prostate Cancer Detection and Metastasis Development Prediction. Front. Oncol. 2019, 9. [Google Scholar] [CrossRef] [Green Version]
  119. Nguyen, H.C.N.; Xie, W.; Yang, M.; Hsieh, C.-L.; Drouin, S.; Lee, G.-S.M.; Kantoff, P.W. Expression differences of circulating microRNAs in metastatic castration resistant prostate cancer and low-risk, localized prostate cancer. Prostate 2013, 73, 346–354. [Google Scholar] [CrossRef] [Green Version]
  120. Schaefer, A.; Jung, M.; Mollenkopf, H.-J.; Wagner, I.; Stephan, C.; Jentzmik, F.; Miller, K.; Lein, M.; Kristiansen, G.; Jung, K. Diagnostic and prognostic implications of microRNA profiling in prostate carcinoma. Int. J. Cancer 2010, 126, 1166–1176. [Google Scholar] [CrossRef]
  121. Bryant, R.J.; Pawlowski, T.; Catto, J.W.F.; Marsden, G.; Vessella, R.L.; Rhees, B.; Kuslich, C.; Visakorpi, T.; Hamdy, F.C. Changes in circulating microRNA levels associated with prostate cancer. Br. J. Cancer 2012, 106, 768–774. [Google Scholar] [CrossRef] [Green Version]
  122. Paiva, R.M.; Zauli, D.A.G.; Neto, B.S.; Brum, I.S. Urinary microRNAs expression in prostate cancer diagnosis: A systematic review. Clin. Transl. Oncol. 2020, 22, 2061–2073. [Google Scholar] [CrossRef]
  123. Fredsøe, J.; Rasmussen, A.K.I.; Thomsen, A.R.; Mouritzen, P.; Høyer, S.; Borre, M.; Ørntoft, T.F.; Sørensen, K.D. Diagnostic and Prognostic MicroRNA Biomarkers for Prostate Cancer in Cell-free Urine. Eur. Urol. Focus 2018, 4, 825–833. [Google Scholar] [CrossRef] [Green Version]
  124. Yang, C.; Dou, B.; Shi, K.; Chai, Y.; Xiang, Y.; Yuan, R. Multiplexed and Amplified Electronic Sensor for the Detection of MicroRNAs from Cancer Cells. Anal. Chem. 2014, 86, 11913–11918. [Google Scholar] [CrossRef]
  125. El Aamri, M.; Yammouri, G.; Mohammadi, H.; Amine, A.; Korri-Youssoufi, H. Electrochemical Biosensors for Detection of MicroRNA as a Cancer Biomarker: Pros and Cons. Biosensors 2020, 10, 186. [Google Scholar] [CrossRef] [PubMed]
  126. Ivanov, Y.; Pleshakova, T.; Malsagova, K.; Kurbatov, L.; Popov, V.; Glukhov, A.; Smirnov, A.; Enikeev, D.; Potoldykova, N.; Alekseev, B.; et al. Detection of Marker miRNAs, Associated with Prostate Cancer, in Plasma Using SOI-NW Biosensor in Direct and Inversion Modes. Sensors 2019, 19, 5248. [Google Scholar] [CrossRef] [Green Version]
  127. Zheng, J.; Yang, R.; Shi, M.; Wu, C.; Fang, X.; Li, Y.; Li, J.; Tan, W. Rationally designed molecular beacons for bioanalytical and biomedical applications. Chem. Soc. Rev. 2015, 44, 3036–3055. [Google Scholar] [CrossRef]
  128. Jolly, P.; Batistuti, M.R.; Miodek, A.; Zhurauski, P.; Mulato, M.; Lindsay, M.A.; Estrela, P. Highly sensitive dual mode electrochemical platform for microRNA detection. Sci. Rep. 2016, 6, 36719. [Google Scholar] [CrossRef] [PubMed]
  129. Mucci, L.A.; Hjelmborg, J.B.; Harris, J.R.; Czene, K.; Havelick, D.J.; Scheike, T.; Graff, R.E.; Holst, K.; Möller, S.; Unger, R.H.; et al. Familial Risk and Heritability of Cancer Among Twins in Nordic Countries. JAMA 2016, 315, 68–76. [Google Scholar] [CrossRef] [Green Version]
  130. Benafif, S.; Kote-Jarai, Z.; Eeles, R.A. A Review of Prostate Cancer Genome-Wide Association Studies (GWAS). Cancer Epidemiol. Biomark. Prev. 2018, 27, 845–857. [Google Scholar] [CrossRef] [Green Version]
  131. Schumacher, F.R.; Al Olama, A.A.; Berndt, S.I.; Benlloch, S.; Ahmed, M.; Saunders, E.J.; Dadaev, T.; Leongamornlert, D.; Anokian, E.; Cieza-Borrella, C.; et al. Association analyses of more than 140,000 men identify 63 new prostate cancer susceptibility loci. Nat. Genet. 2018, 50, 928–936. [Google Scholar] [CrossRef] [Green Version]
  132. Wang, G.; Zhao, D.; Spring, D.J.; DePinho, R.A. Genetics and biology of prostate cancer. Genes Dev. 2018, 32, 1105–1140. [Google Scholar] [CrossRef] [PubMed] [Green Version]
  133. Ewing, C.M.; Ray, A.M.; Lange, E.M.; Zuhlke, K.A.; Robbins, C.M.; Tembe, W.D.; Wiley, K.E.; Isaacs, S.D.; Johng, D.; Wang, Y.; et al. Germline Mutations in HOXB13 and Prostate-Cancer Risk. N. Engl. J. Med. 2012, 366, 141–149. [Google Scholar] [CrossRef] [PubMed] [Green Version]
  134. Eftekhari-Sis, B.; Karaminejad, S.; Karimi, F. A Nano-Biosensor for the Detection of 185delAG Mutation in BRCA1 Gene, Leading to Breast Cancer. Cancer Investig. 2016, 34, 431–439. [Google Scholar] [CrossRef] [PubMed]
  135. Filippidou, M.K.; Loukas, C.M.; Kaprou, G.; Tegou, E.; Petrou, P.; Kakabakos, S.; Tserepi, A.; Chatzandroulis, S. Detection of BRCA1 gene on partially reduced graphene oxide biosensors. Microelectron. Eng. 2019, 216, 111093. [Google Scholar] [CrossRef]
  136. Feng, D.; Su, J.; He, G.; Xu, Y.; Wang, C.; Zheng, M.; Qian, Q.; Mi, X. Electrochemical DNA Sensor for Sensitive BRCA1 Detection Based on DNA Tetrahedral-Structured Probe and Poly-Adenine Mediated Gold Nanoparticles. Biosensors 2020, 10, 78. [Google Scholar] [CrossRef]
  137. Wang, Z.; Wang, Y.; Zhang, J.; Hu, Q.; Zhi, F.; Zhang, S.; Mao, D.; Zhang, Y.; Liang, H. Significance of the TMPRSS2:ERG gene fusion in prostate cancer. Mol. Med. Rep. 2017, 16, 5450–5458. [Google Scholar] [CrossRef] [Green Version]
  138. Zhao, S.; Løvf, M.; Totland Carm, K.; Cathrine Bakken, A.; Hoff, A.M.; Skotheim, R.I. Novel transcription-induced fusion RNAs in prostate cancer. Oncotarget 2017, 8. [Google Scholar] [CrossRef] [Green Version]
  139. Yang, Z.; Yu, L.; Wang, Z. PCA3 and TMPRSS2-ERG gene fusions as diagnostic biomarkers for prostate cancer. Chin. J. Cancer Res. 2016, 28, 65–71. [Google Scholar]
  140. Koo, K.M.; Wee, E.J.H.; Mainwaring, P.N.; Trau, M. A simple, rapid, low-cost technique for naked-eye detection of urine-isolated TMPRSS2:ERG gene fusion RNA. Sci. Rep. 2016, 6, 30722. [Google Scholar] [CrossRef] [Green Version]
  141. Bocedi, A.; Noce, A.; Marrone, G.; Noce, G.; Cattani, G.; Gambardella, G.; Di Lauro, M.; Di Daniele, N.; Ricci, G. Glutathione Transferase P1-1 an Enzyme Useful in Biomedicine and as Biomarker in Clinical Practice and in Environmental Pollution. Nutrients 2019, 11, 1741. [Google Scholar] [CrossRef] [Green Version]
  142. Pljesa-Ercegovac, M.; Savic-Radojevic, A.; Matic, M.; Coric, V.; Djukic, T.; Radic, T.; Simic, T. Glutathione Transferases: Potential Targets to Overcome Chemoresistance in Solid Tumors. Int. J. Mol. Sci. 2018, 19, 3785. [Google Scholar] [CrossRef] [Green Version]
  143. Kanwal, R.; Pandey, M.; Bhaskaran, N.; Maclennan, G.T.; Fu, P.; Ponsky, L.E.; Gupta, S. Protection against oxidative DNA damage and stress in human prostate by glutathione S-transferase P1. Mol. Carcinog. 2014, 53, 8–18. [Google Scholar] [CrossRef] [PubMed] [Green Version]
  144. Gurioli, G.; Martignano, F.; Salvi, S.; Costantini, M.; Gunelli, R.; Casadio, V. GSTP1 methylation in cancer: A liquid biopsy biomarker? Clin. Chem. Lab. Med. 2018, 56, 702–717. [Google Scholar] [CrossRef] [Green Version]
  145. Singh, S.; Shukla, G.C.; Gupta, S. MicroRNA Regulating Glutathione S-Transferase P1 in Prostate Cancer. Curr. Pharm. Rep. 2015, 1, 79–88. [Google Scholar] [CrossRef] [PubMed] [Green Version]
  146. Topkaya, S.N.; Ozkan-Ariksoysal, D.; Kosova, B.; Ozel, R.; Ozsoz, M. Electrochemical DNA biosensor for detecting cancer biomarker related to glutathione S-transferase P1 (GSTP1) hypermethylation in real samples. Biosens. Bioelectron. 2012, 31, 516–522. [Google Scholar] [CrossRef] [PubMed]
  147. Nur Topkaya, S.; Ozkan-Ariksoysal, D. Prostate Cancer Biomarker Detection with Carbon Nanotubes Modified Screen Printed Electrodes. Electroanal 2016, 28, 1077–1084. [Google Scholar] [CrossRef]
  148. Chiou, C.C.; Chang, P.Y.; Chan, E.C.; Wu, T.L.; Tsao, K.C.; Wu, J.T. Urinary 8-hydroxydeoxyguanosine and its analogs as DNA marker of oxidative stress: Development of an ELISA and measurement in both bladder and prostate cancers. Clin. Chim. Acta 2003, 334, 87–94. [Google Scholar] [CrossRef]
  149. Sova, H.; Jukkola-Vuorinen, A.; Puistola, U.; Kauppila, S.; Karihtala, P. 8-Hydroxydeoxyguanosine: A new potential independent prognostic factor in breast cancer. Br. J. Cancer 2010, 102, 1018–1023. [Google Scholar] [CrossRef] [Green Version]
  150. Ohtake, S.; Kawahara, T.; Ishiguro, Y.; Takeshima, T.; Kuroda, S.; Izumi, K.; Miyamoto, H.; Uemura, H. Oxidative stress marker 8-hydroxyguanosine is more highly expressed in prostate cancer than in benign prostatic hyperplasia. Mol. Clin. Oncol. 2018, 9, 302–304. [Google Scholar] [CrossRef] [Green Version]
  151. Rosy Goyal, R.N. Determination of 8-Hydroxydeoxyguanosine: A potential biomarker of oxidative stress, using carbon-allotropic nanomaterials modified glassy carbon sensor. Talanta 2016, 161, 735–742. [Google Scholar] [CrossRef]
  152. Gupta, P.; Oyama, M.; Goyal, R.N. Electrochemical investigations of 8-hydroxydeoxyguanosine and its determination at an edge plane pyrolytic graphite electrode. RSC Adv. 2016, 6, 1722–1728. [Google Scholar] [CrossRef]
  153. Kumar, N.; Rosy Goyal, R.N. A melamine based molecularly imprinted sensor for the determination of 8-hydroxydeoxyguanosine in human urine. Talanta 2017, 166, 215–222. [Google Scholar] [CrossRef] [PubMed]
  154. Martins, G.V.; Tavares, A.P.M.; Fortunato, E.; Sales, M.G.F. Paper-Based Sensing Device for Electrochemical Detection of Oxidative Stress Biomarker 8-Hydroxy-2′-deoxyguanosine (8-OHdG) in Point-of-Care. Sci. Rep. 2017, 7, 14558. [Google Scholar] [CrossRef]
  155. Mohd Azmi, M.A.; Tehrani, Z.; Lewis, R.P.; Walker, K.A.D.; Jones, D.R.; Daniels, D.R.; Doak, S.H.; Guy, O.J. Highly sensitive covalently functionalised integrated silicon nanowire biosensor devices for detection of cancer risk biomarker. Biosens. Bioelectron. 2014, 52, 216–224. [Google Scholar] [CrossRef] [Green Version]
  156. Song, E.; Hu, Y.; Hussein, A.; Yu, C.-Y.; Tang, H.; Mechref, Y. Characterization of the Glycosylation Site of Human PSA Prompted by Missense Mutation using LC–MS/MS. J. Proteome Res. 2015, 14, 2872–2883. [Google Scholar] [CrossRef] [PubMed] [Green Version]
  157. Popovics, P.; Awadallah, W.N.; Kohrt, S.E.; Case, T.C.; Miller, N.L.; Ricke, E.A.; Huang, W.; Ramirez-Solano, M.; Liu, Q.; Vezina, C.M.; et al. Prostatic osteopontin expression is associated with symptomatic benign prostatic hyperplasia. Prostate 2020, 80, 731–741. [Google Scholar] [CrossRef]
  158. Gajdosova, V.; Lorencova, L.; Kasak, P.; Tkac, J. Electrochemical Nanobiosensors for Detection of Breast Cancer Biomarkers. Sensors 2020, 20, 4022. [Google Scholar] [CrossRef]
  159. Khodavirdi, A.C.; Song, Z.; Yang, S.; Zhong, C.; Wang, S.; Wu, H.; Pritchard, C.; Nelson, P.S.; Roy-Burman, P. Increased Expression of Osteopontin Contributes to the Progression of Prostate Cancer. Cancer Res. 2006, 66, 883–888. [Google Scholar] [CrossRef] [PubMed] [Green Version]
  160. Moorman, H.R.; Poschel, D.; Klement, J.D.; Lu, C.; Redd, P.S.; Liu, K. Osteopontin: A Key Regulator of Tumor Progression and Immunomodulation. Cancers 2020, 12, 3379. [Google Scholar] [CrossRef] [PubMed]
  161. Sharma, A.; Hong, S.; Singh, R.; Jang, J. Single-walled carbon nanotube based transparent immunosensor for detection of a prostate cancer biomarker osteopontin. Anal. Chim. Acta 2015, 869, 68–73. [Google Scholar] [CrossRef] [PubMed]
  162. Li, Q.; Shi, Y.; Sa, R.; Hao, J.; Hu, J.; Xiao, M.; Wang, C.; Yan, L.; Qiao, B.; Chen, G. Altered staining patterns and expression level of Engrailed-2 in benign prostatic hyperplasia and prostate Cancer predict prostatic disease progression. BMC Cancer 2020, 20. [Google Scholar] [CrossRef] [PubMed]
  163. Killick, E.; Morgan, R.; Launchbury, F.; Bancroft, E.; Page, E.; Castro, E.; Kote-Jarai, Z.; Aprikian, A.; Blanco, I.; Clowes, V.; et al. Role of Engrailed-2 (EN2) as a prostate cancer detection biomarker in genetically high risk men. Sci. Rep. 2013, 3, 2059. [Google Scholar] [CrossRef] [PubMed] [Green Version]
  164. Marszałł, M.P.; Sroka, W.; Adamowski, M.; Słupski, P.; Jarzemski, P.; Siódmiak, J.; Odrowąż-Sypniewska, G. Engrailed-2 protein as a potential urinary prostate cancer biomarker: A comparison study before and after digital rectal examination. Eur. J. Cancer Prev. 2015, 24, 51–56. [Google Scholar] [CrossRef]
  165. Punia, N.; Primon, M.; Simpson, G.R.; Pandha, H.S.; Morgan, R. Membrane insertion and secretion of the Engrailed-2 (EN2) transcription factor by prostate cancer cells may induce antiviral activity in the stroma. Sci. Rep. 2019, 9. [Google Scholar] [CrossRef] [PubMed]
  166. Lee, S.; Jo, H.; Her, J.; Lee, H.Y.; Ban, C. Ultrasensitive electrochemical detection of engrailed-2 based on homeodomain-specific DNA probe recognition for the diagnosis of prostate cancer. Biosens. Bioelectron. 2015, 66, 32–38. [Google Scholar] [CrossRef]
  167. Hiragun, T.; Yanase, Y.; Kose, K.; Kawaguchi, T.; Uchida, K.; Tanaka, S.; Hide, M. Surface plasmon resonance-biosensor detects the diversity of responses against epidermal growth factor in various carcinoma cell lines. Biosens. Bioelectron. 2012, 32, 202–207. [Google Scholar] [CrossRef] [PubMed] [Green Version]
  168. Ying, Z.; Feng, L.; Ji, D.; Zhang, Y.; Chen, W.; Dai, Y.; Janyasupab, M.; Li, X.; Wen, W.; Liu, C.-C. Phase-Regulated Sensing Mechanism of MoS2 Based Nanohybrids toward Point-of-Care Prostate Cancer Diagnosis. Small 2020, 16, 2000307. [Google Scholar] [CrossRef]
  169. Lin, P.Y.; Cheng, K.L.; McGuffin-Cawley, J.D.; Shieu, F.S.; Samia, A.C.; Gupta, S.; Cooney, M.; Thompson, C.L.; Liu, C.C. Detection of Alpha-Methylacyl-CoA Racemase (AMACR), a Biomarker of Prostate Cancer, in Patient Blood Samples Using a Nanoparticle Electrochemical Biosensor. Biosensors 2012, 2, 377–387. [Google Scholar] [CrossRef] [Green Version]
  170. Jolly, P.; Miodek, A.; Yang, D.-K.; Chen, L.-C.; Lloyd, M.D.; Estrela, P. Electro-Engineered Polymeric Films for the Development of Sensitive Aptasensors for Prostate Cancer Marker Detection. ACS Sens. 2016, 1, 1308–1314. [Google Scholar] [CrossRef] [Green Version]
  171. Fernandes, F.C.B.; Bueno, P.R. Optimized electrochemical biosensor for human prostatic acid phosphatase. Sens. Actuator B Chem. 2017, 253, 1106–1112. [Google Scholar] [CrossRef] [Green Version]
  172. Kamel, A.H.; Galal, H.R.; Hanna, A.A. Novel planar chip biosensors for potentiometric immunoassay of acid phosphatase activity based on the use of ion association complexes as novel electroactive materials. Int. J. Electrochem. Sci. 2014, 9, 5776–5787. [Google Scholar]
  173. Na, W.; Liu, Q.; Sui, B.; Hu, T.; Su, X. Highly sensitive detection of acid phosphatase by using a graphene quantum dots-based förster resonance energy transfer. Talanta 2016, 161, 469–475. [Google Scholar] [CrossRef] [PubMed]
  174. Parra-Cabrera, C.; Samitier, J.; Homs-Corbera, A. Multiple biomarkers biosensor with just-in-time functionalization: Application to prostate cancer detection. Biosens. Bioelectron. 2016, 77, 1192–1200. [Google Scholar] [CrossRef] [PubMed]
  175. Park, S.; Kim, M.; Kim, D.; Kang, S.H.; Lee, K.H.; Jeong, Y. Interfacial charge regulation of protein blocking layers in transistor biosensor for direct measurement in serum. Biosens. Bioelectron. 2020, 147, 111737. [Google Scholar] [CrossRef] [PubMed]
  176. Lin, C.-W.; Wei, K.-C.; Liao, S.-s.; Huang, C.-Y.; Sun, C.-L.; Wu, P.-J.; Lu, Y.-J.; Yang, H.-W.; Ma, C.-C.M. A reusable magnetic graphene oxide-modified biosensor for vascular endothelial growth factor detection in cancer diagnosis. Biosens. Bioelectron. 2015, 67, 431–437. [Google Scholar] [CrossRef]
  177. Pang, J.; Mendes, R.G.; Bachmatiuk, A.; Zhao, L.; Ta, H.Q.; Gemming, T.; Liu, H.; Liu, Z.; Rummeli, M.H. Applications of 2D MXenes in energy conversion and storage systems. Chem. Soc. Rev. 2019, 48, 72–133. [Google Scholar] [CrossRef] [PubMed]
  178. Crulhas, B.P.; Karpik, A.E.; Delella, F.K.; Castro, G.R.; Pedrosa, V.A. Electrochemical aptamer-based biosensor developed to monitor PSA and VEGF released by prostate cancer cells. Anal. Bioanal. Chem. 2017, 409, 6771–6780. [Google Scholar] [CrossRef] [Green Version]
  179. Pihikova, D.; Pakanova, Z.; Nemcovic, M.; Barath, P.; Belicky, S.; Bertok, T.; Kasak, P.; Mucha, J.; Tkac, J. Sweet characterisation of prostate specific antigen using electrochemical lectin-based immunosensor assay and MALDI TOF/TOF analysis: Focus on sialic acid. Proteomics 2016, 16, 3085–3095. [Google Scholar] [CrossRef] [Green Version]
  180. Pihikova, D.; Kasak, P.; Kubanikova, P.; Sokol, R.; Tkac, J. Aberrant sialylation of a prostate-specific antigen: Electrochemical label-free glycoprofiling in prostate cancer serum samples. Anal. Chim. Acta 2016, 934, 72–79. [Google Scholar] [CrossRef] [Green Version]
  181. Belicky, S.; Damborsky, P.; Zapatero-Rodriguez, J.; O’Kennedy, R.; Tkac, J. Full-length antibodies versus single-chain antibody fragments for a selective impedimetric lectin-based glycoprofiling of prostate specific antigen. Electrochim. Acta 2017, 246, 399–405. [Google Scholar] [CrossRef] [PubMed]
  182. Pihíková, D.; Belicky, Š.; Kasák, P.; Bertok, T.; Tkac, J. Sensitive detection and glycoprofiling of a prostate specific antigen using impedimetric assays. Analyst 2016, 141, 1044–1051. [Google Scholar] [CrossRef] [PubMed] [Green Version]
  183. Belicky, S.; Cernocka, H.; Bertok, T.; Holazova, A.; Reblova, K.; Palecek, E.; Tkac, J.; Ostatna, V. Label-free chronopotentiometric glycoprofiling of prostate specific antigen using sialic acid recognizing lectins. Bioelectrochemistry 2017, 117, 89–94. [Google Scholar] [CrossRef]
  184. Kaya, T.; Kaneko, T.; Kojima, S.; Nakamura, Y.; Ide, Y.; Ishida, K.; Suda, Y.; Yamashita, K. High-Sensitivity Immunoassay with Surface Plasmon Field-Enhanced Fluorescence Spectroscopy Using a Plastic Sensor Chip: Application to Quantitative Analysis of Total Prostate-Specific Antigen and GaINAc beta 1-4GIcNAc-Linked Prostate-Specific Antigen for Prostate Cancer Diagnosis. Anal. Chem. 2015, 87, 1797–1803. [Google Scholar] [PubMed]
  185. Haga, Y.; Uemura, M.; Baba, S.; Inamura, K.; Takeuchi, K.; Nonomura, N.; Ueda, K. Identification of Multisialylated LacdiNAc Structures as Highly Prostate Cancer Specific Glycan Signatures on PSA. Anal. Chem. 2019, 91, 2247–2254. [Google Scholar] [CrossRef]
  186. Bertokova, A.; Bertok, T.; Jane, E.; Hires, M.; Ďubjaková, P.; Novotná, O.; Belan, V.; Fillo, J.; Tkac, J. Detection of N, N-diacetyllactosamine (LacdiNAc) containing free prostate-specific antigen for early stage prostate cancer diagnostics and for identification of castration-resistant prostate cancer patients. Biorg. Med. Chem. 2021, 116156. [Google Scholar] [CrossRef]
  187. Bertok, T.; Lorencova, L.; Hroncekova, S.; Gajdosova, V.; Jane, E.; Hires, M.; Kasak, P.; Kaman, O.; Sokol, R.; Bella, V.; et al. Advanced impedimetric biosensor configuration and assay protocol for glycoprofiling of a prostate oncomarker using Au nanoshells with a magnetic core. Biosens. Bioelectron. 2019, 131, 24–29. [Google Scholar] [CrossRef]
  188. Bertok, T.; Lorencova, L.; Hroncekova, S.; Gajdosova, V.; Jane, E.; Hires, M.; Kasak, P.; Kaman, O.; Sokol, R.; Bella, V.; et al. Synthesis and characterization of Au nanoshells with a magnetic core and betaine derivatives. Methodsx 2019, 6, 1999–2012. [Google Scholar] [CrossRef] [PubMed]
  189. Jolly, P.; Damborsky, P.; Madaboosi, N.; Soares, R.R.G.; Chu, V.; Conde, J.P.; Katrlik, J.; Estrela, P. DNA aptamer-based sandwich microfluidic assays for dual quantification and multi-glycan profiling of cancer biomarkers. Biosens. Bioelectron. 2016, 79, 313–319. [Google Scholar] [CrossRef] [Green Version]
  190. Damborsky, P.; Koczula, K.M.; Gallotta, A.; Katrlik, J. Lectin-based lateral flow assay: Proof-of-concept. Analyst 2016, 141, 6444–6448. [Google Scholar] [CrossRef]
  191. Silva, P.M.S.; Lima, A.L.R.; Silva, B.V.M.; Coelho, L.; Dutra, R.F.; Correia, M.T.S. Cratylia mollis lectin nanoelectrode for differential diagnostic of prostate cancer and benign prostatic hyperplasia based on label-free detection. Biosens. Bioelectron. 2016, 85, 171–177. [Google Scholar] [CrossRef] [PubMed]
  192. Stephenson-Brown, A.; Acton, A.L.; Preece, J.A.; Fossey, J.S.; Mendes, P.M. Selective glycoprotein detection through covalent templating and allosteric click-imprinting. Chem. Sci. 2015, 6, 5114–5119. [Google Scholar] [CrossRef] [Green Version]
  193. Zhou, L.; Wang, Y.; Xing, R.; Chen, J.; Liu, J.; Li, W.; Liu, Z. Orthogonal dual molecularly imprinted polymer-based plasmonic immunosandwich assay: A double characteristic recognition strategy for specific detection of glycoproteins. Biosens. Bioelectron. 2019, 145, 111729. [Google Scholar] [CrossRef] [PubMed]
  194. Duan, R.; Peng, C.; Sun, L.; Zhang, L.-X.; Bai, C.-C.; Dong, L.-Y.; Wang, X.-H. Integrating boronate affinity controllable-oriented surface imprinting nylon wire and pH-triggered allochroic-graphene oxide for ultrasensitive detection of glycoprotein. Sens. Actuator B Chem. 2021, 330, 129310. [Google Scholar] [CrossRef]
  195. Tommasone, S.; Tagger, Y.K.; Mendes, P.M. Targeting Oligosaccharides and Glycoconjugates Using Superselective Binding Scaffolds. Adv. Funct. Mater. 2020, 30, 2002298. [Google Scholar] [CrossRef]
  196. Matsumoto, H.; Sunayama, H.; Kitayama, Y.; Takano, E.; Takeuchi, T. Site-specific post-imprinting modification of molecularly imprinted polymer nanocavities with a modifiable functional monomer for prostate cancer biomarker recognition. Sci. Technol. Adv. Mater. 2019, 20, 305–312. [Google Scholar] [CrossRef] [Green Version]
  197. Tommasone, S.; Allabush, F.; Tagger, Y.K.; Norman, J.; Kopf, M.; Tucker, J.H.R.; Mendes, P.M. The challenges of glycan recognition with natural and artificial receptors. Chem. Soc. Rev. 2019, 48, 5488–5505. [Google Scholar] [CrossRef] [Green Version]
  198. Li, W.; Ma, Y.Y.; Guo, Z.C.; Xing, R.R.; Liu, Z. Efficient Screening of Glycan-Specific Aptamers Using a Glycosylated Peptide as a Scaffold. Anal. Chem. 2021, 93, 956–963. [Google Scholar] [CrossRef] [PubMed]
  199. Diaz-Fernandez, A.; Miranda-Castro, R.; Diaz, N.; Suarez, D.; de-los-Santos-Alvarez, N.; Jesus Lobo-Castanon, M. Aptamers targeting protein-specific glycosylation in tumor biomarkers: General selection, characterization and structural modeling. Chem. Sci. 2020, 11, 9402–9413. [Google Scholar] [CrossRef] [PubMed]
  200. Diaz-Fernandez, A.; Miranda-Castro, R.; de-los-Santos-Alvarez, N.; Rodriguez, E.F.; Lobo-Castanon, M.J. Focusing aptamer selection on the glycan structure of prostate-specific antigen: Toward more specific detection of prostate cancer. Biosens. Bioelectron. 2019, 128, 83–90. [Google Scholar] [CrossRef] [PubMed]
  201. Diaz-Fernandez, A.; Miranda-Castro, R.; de-los-Santos-Alvarez, N.; Lobo-Castanon, M.J.; Estrela, P. Impedimetric aptamer-based glycan PSA score for discrimination of prostate cancer from other prostate diseases. Biosens. Bioelectron. 2021, 175, 7. [Google Scholar] [CrossRef] [PubMed]
  202. Diaz-Fernandez, A.; Lorenzo-Gomez, R.; Miranda-Castro, R.; de-los-Santos-Alvarez, N.; Lobo-Castanon, M.J. Electrochemical aptasensors for cancer diagnosis in biological fluids—A review. Anal. Chim. Acta 2020, 1124, 1–19. [Google Scholar] [CrossRef] [PubMed]
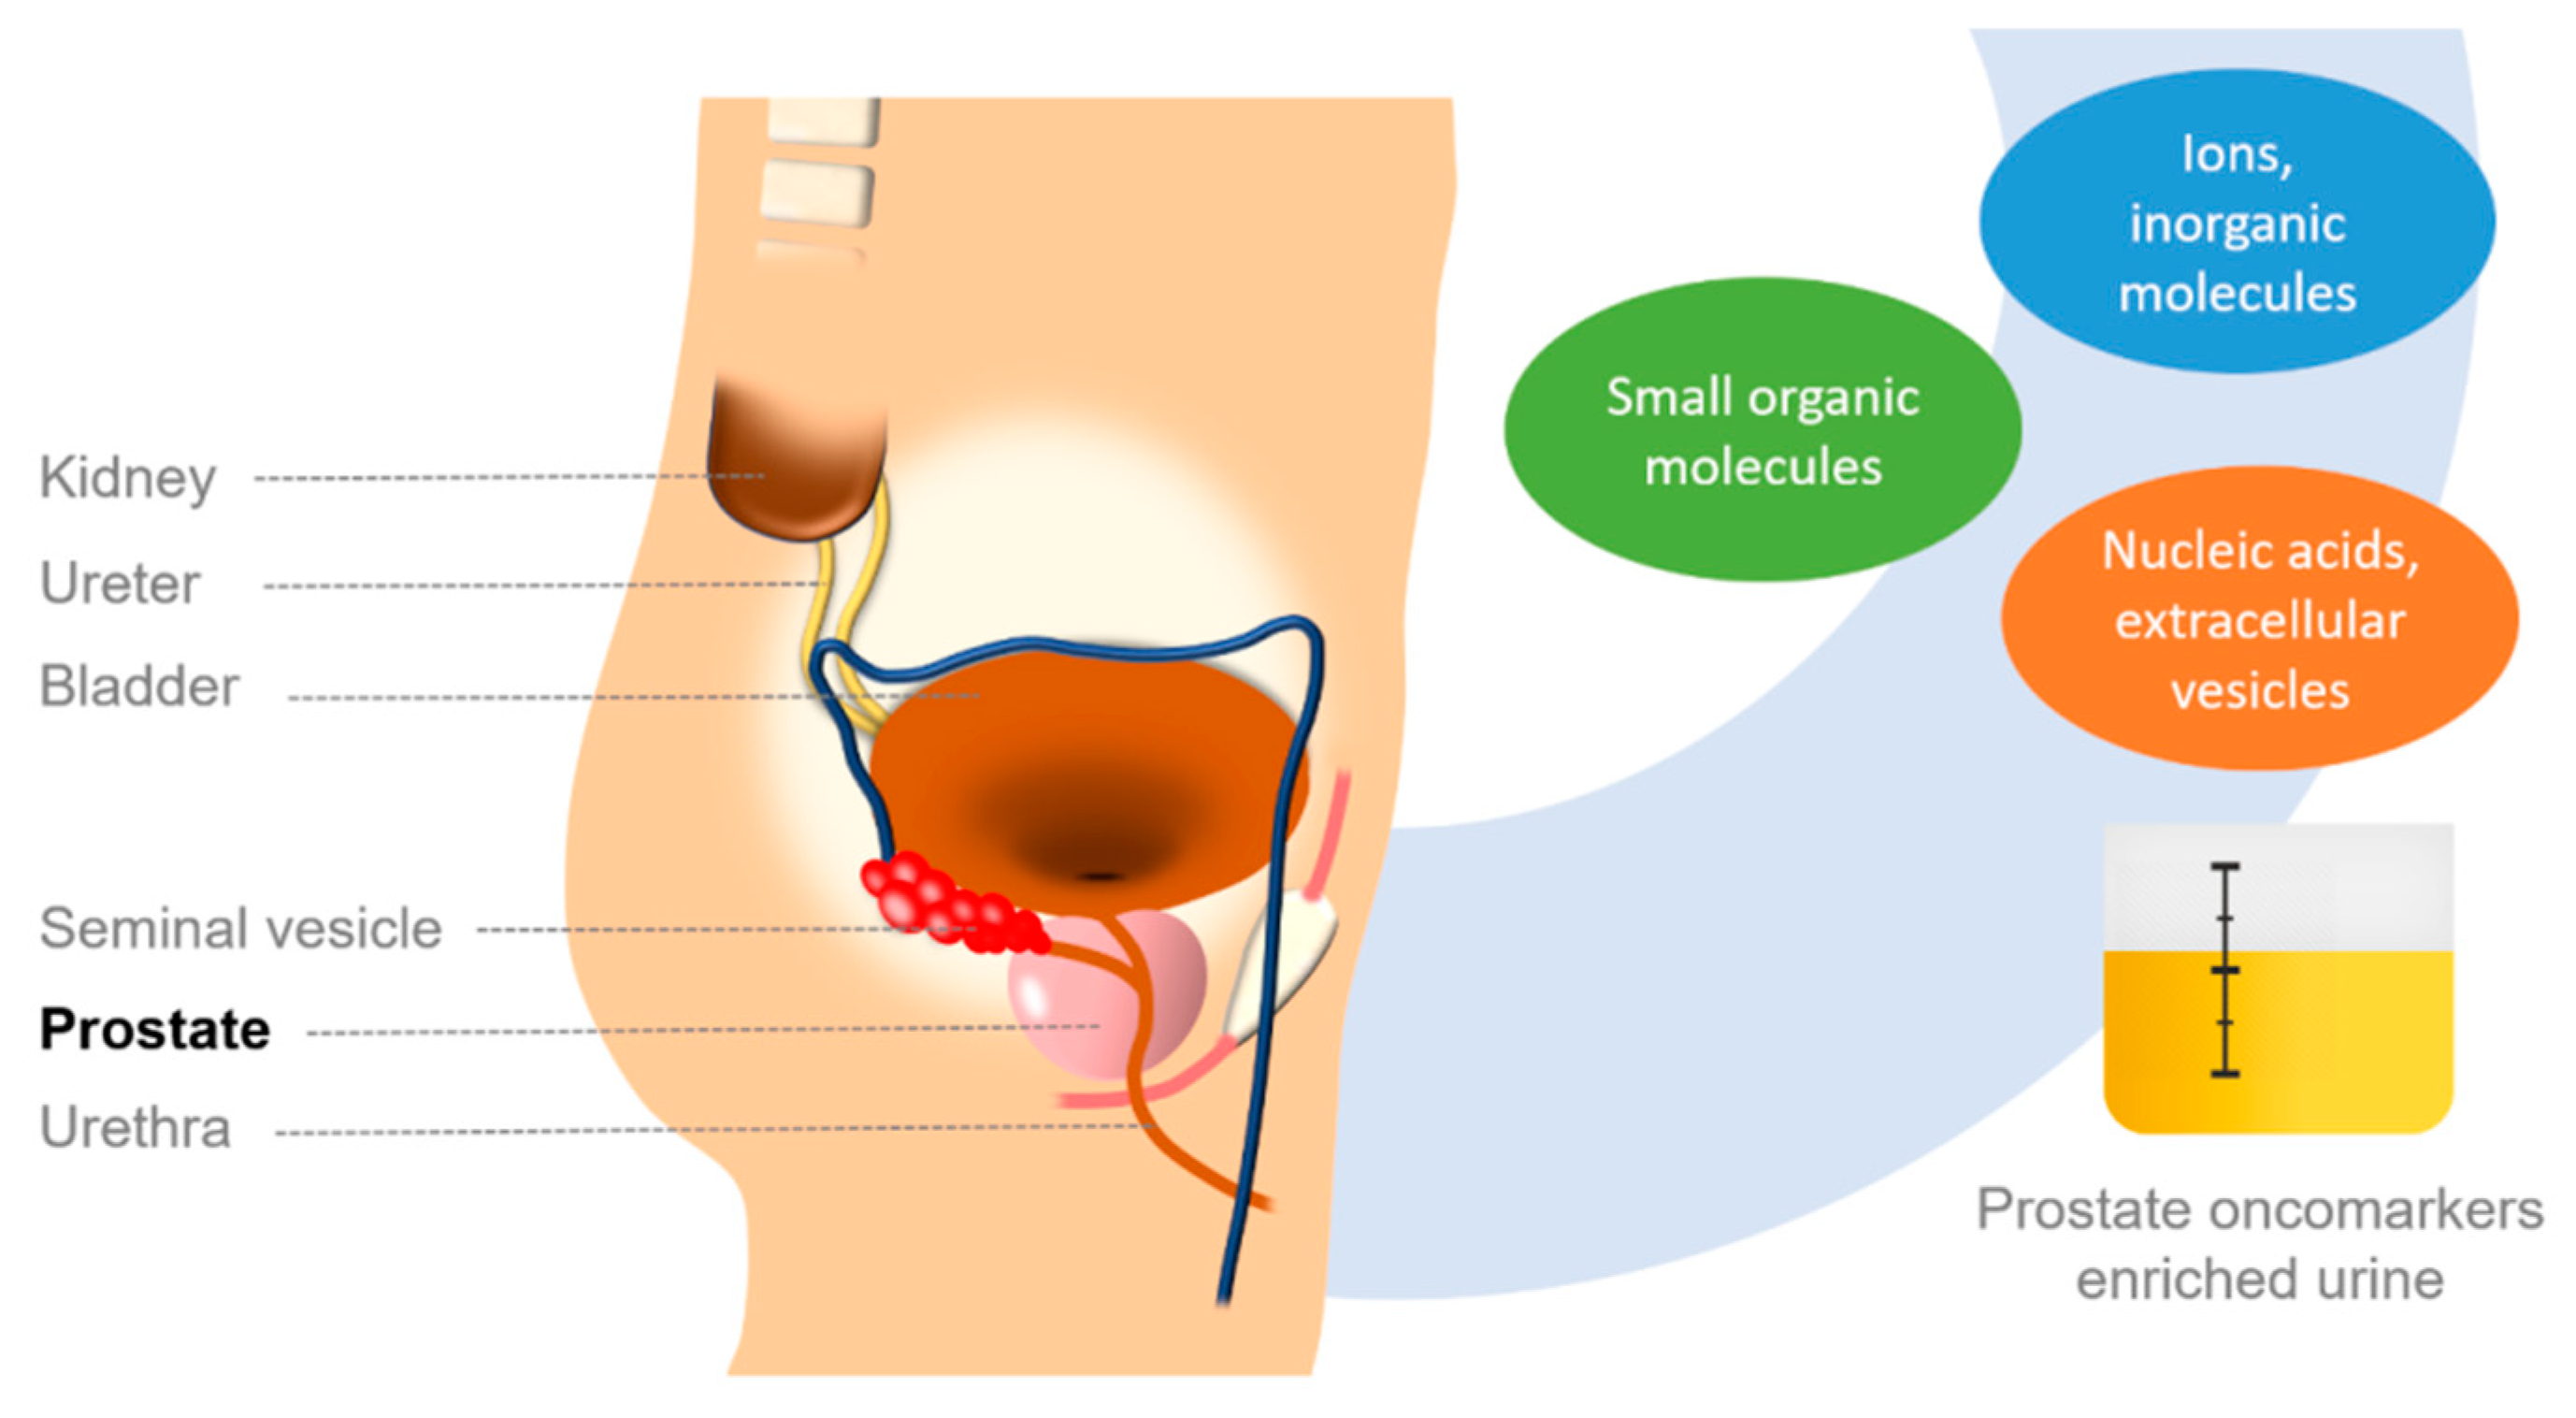
Figure 1. Human genito-urinary system with the prostate located right below the bladder, making urine an accessible source of many precious (not just) prostate oncomarkers compared to more complex biological matrices, such as serum, plasma, or cell lysate to be used in sensing applications.
Chemosensors 09 00205 g001
Figure 2. Molecules involved in oxidation stress within a prostate cell. Schematic presentation of a prostate cell (with nucleus and mitochondria as the only organelles) and ions/simple inorganic molecules involved in oxidation stress and possible DNA damage discussed in this review, as appearing prior to/during PCa progression. ZIP1—Zinc transporter, NOx—NADPH oxidase, AqP—Aquaporin, TFR—Transferrin receptor, FPN—Ferroportin, IRP—iron-responsive element-binding protein, CytCOx—Cytochrome C oxidase, CAT—Catalase, SOD—Superoxide dismutase, 8-OHdG—8-hydroxydeoxyguanosine.
Chemosensors 09 00205 g002
Figure 3. Zinc regulating citrate levels and apoptotic events in PCa. Schematic presentation of a prostate epithelial cell introducing different roles of zinc ions in regulation of citrate levels in a prostatic fluid and even controlling apoptotic events in PCa tissues. In PCa, while the levels of Zn are decreased, Zn ions no longer inhibit aconitase enzyme in the Krebs cycle, so the cycle proceeds further and the cell gains energy necessary e.g., for proliferation. As a result, levels of citrate in PCa decrease in a prostatic fluid. Interstitial fluid is also depicted, as a rich source of low molecular mass Zn-ligands (Zn-citrate, Zn-aspartate, Zn-histidine, etc.). Abbreviations: ZIP1—Zinc transporter, SLC1—Membrane transport protein for some amino acids, GLUT1—Glucose transporter, Asp—Aspartate, Glc—Glucose, Pyr—Pyruvate, AcCoA—Acetyl-CoA, Mal—Malate, Oxa—Oxalacetate, Cit—Citrate, IsoCit—Isocitrate, CytC—Cytochrome C, Cas9—Caspase 9, BAX (product of a BAX gene)—apoptosis regulator bcl-2-like protein 4. Image redrawn from ref. [23]. Copyright (2016) with permission from Elsevier.
Chemosensors 09 00205 g003
Figure 4. Schematic presentation of a cancer cell synthesising different types of cancer markers: (i) intracellular markers—DNA methylations and mutations (present in nucleus); (ii) surface (membrane) markers present on cell surface; and (iii) extracellular markers—secreted (soluble) proteins, extracellular vesicles, exosomes and circulating tumour cells also.
Chemosensors 09 00205 g004
Figure 5. Schematic presentation of different configurations of miR (orange) detection platforms, based on hybridization with a complementary sequence (probe, blue). (1) Interaction of miR analyte with a redox-labelled complementary probe on an electrode surface, while (a) probe is a hairpin which unfolds upon binding, leading to a decreased signal; (b) a product is specifically cleaved, leading to a decreased signal, (c) a secondary probe (green) is used for the detection, leading to a signal generation. (2) Hybridization of miR with an unlabelled probe leads to desorption of a non-covalently adsorbed probe from an electrode surface, leading to a decreased signal. (3) A signal is generated due to introduction of an additional component, e.g., by an intercalating species via (d) a direct or (e) a template-directed way; (f) a signal is generated using a catalyst molecule. (4) A label-free detection, using for example electrochemical impedance spectroscopy and a charge transfer resistance parameter as an evaluated signal; inset: Nyquist plots for a bioreceptive layer and after a biorecognition/hybridization took place. Redrawn with permission from ref. [127], Copyright (2015), Royal Society for Chemistry.
Chemosensors 09 00205 g005
Figure 6. DNA changes associated with PCa. Schematic presentation of changes associated with PCa on DNA level (right) compared to normal conditions (left): (a) changes associated with a single nucleotide change (point mutation), possibly leading to another amino acid present in the protein primary structure and occurrence of new glycosylation site (amino acid sequence), (b) regulation of gene expression by hypermethylation of target gene, (c) occurrence of fusion genes and (d) occurrence of oxidised products, such as 8-hydroxydeoxyguanosine, produced by oxidative stress (dark circle) and found in urine.
Chemosensors 09 00205 g006
Figure 7. Electrical immunosensor for detection of osteopontin (OPN). (a) Schematic of the transparent SWCNT based immunosensors for OPN detection, where OPN antibodies were immobilized on the SWCNT surface between the source and the drain electrodes on a glass substrate, (b) FE-SEM micrographs of SWCNTs between Au/ITO electrodes, (c) FE-SEM micrographs of SWCNTs at higher magnification, (d) AFM images of the SWCNTs deposited between two Au/ITO electrodes, and (e) AFM images of OPN antibody covalently attached to -COOH functionalized SWCNT surfaces. Reprinted from ref. [161]. Copyright (2015) with permission from Elsevier.
Chemosensors 09 00205 g007
Figure 8. Illustration of the optical biosensor for the detection of ACP based on FRET between donor GQDs and acceptor Nile Red. Reprinted from ref. [173]. Copyright (2016) with permission from Elsevier.
Chemosensors 09 00205 g008
Figure 9. Glycoprofiling of PSA using lectins. (Left image) A scheme showing anti-PSA immobilized on the electrode surface for a bioaffinity capture of PSA, followed by a PSA glycoprofiling using a lectin. (A) A Nyquist plot showing change of the Rct (a diameter of a semicircle) upon incubation of the biosensor with various proteins. Ab means the biosensor after immobilization of anti-PSA antibody, +PSA means the biosensor after incubation with 10 ng mL−1 of PSA and +MAA means the biosensor with a final incubation with MAA lectin. (B) Glycoprofiling of PSA attached to anti-PSA modified biosensor surface from 10 ng mL−1 PSA solution. For glycoprofiling of PSA´s glycan three different lectins (SNA, LTA and MAA) were applied by incubation of the biosensor with PSA attached. Typical glycan structures recognized by lectins are shown in the figure according to CFG nomenclature. Reprinted from refs. [179,182], Copyright (2016) with permission from Wiley and Sons. Copyright (2016) with permission from Royal Society for Chemistry.
Chemosensors 09 00205 g009
Figure 10. Sensitivity enhancement of electrochemical impedance spectroscopy-based PSA glycoprofiling using hybrid magnetic particles. (Left image) Modification of Au electrode (upper row) using carboxybetaine aryldiazonium derivative (CB) and lectin (SNA-I). In the first step, carboxybetaine-bearing SAM layer was formed using cyclic voltammetry, and subsequently served for the covalent immobilization of a lectin. The lower row shows hybrid magnetic nanoparticle spontaneously modified with CB-derivative and subsequently with an antibody (Ab, anti-PSA). After enrichment of PSA from the human sample by magnetic particles using a permanent magnet, a sandwich was prepared, and the signal was evaluated electrochemically. (Right image) A response towards 0.1 ng mL−1 PSA in 10× diluted real human serum is shown (red curves). A calibration curve for PSA (blue) for a sandwich configuration is shown in the inset (error bars are too small to be visible). According to the slopes of calibration curves in the linear response range for both configurations, an amplification factor of 43 was calculated. Reprinted from ref. [187]. Copyright (2019) with permission from Elsevier.
Chemosensors 09 00205 g010
Figure 11. Lectin-based lateral flow assay test design. (A) Components required for the construction of a lectin-based strip. (B) Depiction of a lectin-based test strip. Reprinted from ref. [190]. Copyright (2016) with permission from Royal Society for Chemistry.
Chemosensors 09 00205 g011
Figure 12. Schematic illustration of the stepwise modification of the lectin-based nanobiosensor. Reprinted from ref. [191]. Copyright (2016) with permission from Elsevier.
Chemosensors 09 00205 g012
Figure 13. Electrochemical response of the lectin-based nanobiosensor for analysis of serum samples of patients with (1) BPH, (2) PCa (Gleason score (GS) 6), (3) PCa (GS 7) and (4) PCa (GS 9). Reprinted from ref. [191]. Copyright (2016) with permission from Elsevier.
Chemosensors 09 00205 g013
Figure 14. Selective glycoprotein detection using boronate-based imprinting approach. Strategy for the fabrication of glycoprotein-imprinted surfaces using acrylamido-boronic acids (AM-BAs); (1) self-assembled monolayer (SAM) formation on a gold surface with DFC molecule; (2) incubation of the AM-BA receptors with the template target glycoprotein; (3) grafting of the preformed boronic acid–glycoprotein complex on the SAM via acrylamide co-polymerization; (4) azide-terminated oligoethylene glycol (Az-OEG) functionalization to provide glycoprotein-shaped cavities; (5) removal of the template protein, affording a nanocavity specific for the target glycoprotein. Reproduced from ref. [192] under a Creative Commons Attribution License.
Chemosensors 09 00205 g014
Figure 15. Schematic illustration of odMIP-PISA approach for detection of trace target glycoprotein in complex sample. Reprinted from ref. [193]. Copyright (2019) with permission from Elsevier.
Chemosensors 09 00205 g015
Figure 16. Method for creating synthetic materials with superselective glycan recognition. (1) Acrylamide-terminated monolayer formation; (2) formation of a pure, high-order glycan:oligomer complex (containing phenylboronic acid cyclic monoester (APB)); (3) fixation of the complex on the surface and construction of a molecular scaffold around the glycan; (4) removal of the glycan template. Reprinted from ref. [195] under a Creative Commons Attribution License.
Chemosensors 09 00205 g016
Figure 17. Principle of SELEX selection of glycan-binding aptamers on peptide-imprinted MNPs. Reprinted from ref. [198]. Copyright (2021) with permission from American Chemical Society.
Chemosensors 09 00205 g017
Figure 18. Graphical representation of binding between DNA aptamer recognising glycan part on PSA glycoprotein. hPSA/T-PSAG-1 MD simulation (a) Ribbon and stick representations of the hPSA glycoprotein in complex with T-PSAG-1. The structure shown corresponds to a cluster representative from the hPSA/T-PSAG-1 MD trajectory. The sugar residues and specific protein residues (numbered as in the 3QUM crystal structure) are shown in stick models. The T-PSAG-1 aptamer is shown in stick representation with filled nucleobases and enclosed by its transparent molecular surface. For the sake of clarity, the coordinates of the α1,6–β1,2 and α1,6–β1,6 sugar antennas are removed in the enlarged view. MD-averaged interatomic distances between heavy atoms for selected contacts are indicated in Å. (b) Secondary structure of the complexed T-PSAG-1 aptamer obtained from the same cluster representative. Reprinted from ref. [199] under a Creative Commons Attribution License.
Chemosensors 09 00205 g018
Figure 19. (A) Scheme of the sandwich assay; (B) calibration plots of PSA in buffer (TBS) and in diluted serum; and (C) sensor response to 25 ng mL−1 of hPSA, rPSA and the glycoprotein lipocalin-2 (NGAL, used as a nonspecific probe). Reprinted from ref. [202], Copyright (2020) with permission from Elsevier and reprinted from ref. [200]. Copyright (2019) with permission from Elsevier.
Chemosensors 09 00205 g019
Figure 20. (A) Steps involved in the construction of the dual impedimetric aptamer-based platform for the sequential measurement of PSAG-1 reactive PSA and total PSA. (B) Nyquist plot recorded in a PBS solution with 5 mM [Fe(CN)6]3-/4- during the stepwise aptasensors fabrication. The inset shows the Randles equivalent circuit used to fit the experimental data. Results of the analysis of serum samples with the impedimetric dual-platform. (C) Correlation between total PSA serum levels found by a standard ELISA and those obtained with the anti-PSA aptamer-based sensor. (D) Correlation between the glycan score, obtained as the ratio between PSAG-1 reactive PSA and total PSA, and the diagnosed pathology. Reprinted from ref. [201]. Copyright (2021) with permission from Elsevier.
Chemosensors 09 00205 g020
Publisher’s Note: MDPI stays neutral with regard to jurisdictional claims in published maps and institutional affiliations.