Article

A Magnetic Nanocomposite Modifier for Improved Ultrasensitive Detection of Hexavalent Chromium in Water Samples

1
Laboratory for Analytical Chemistry and Industrial Analysis, Faculty of Chemistry and Chemical Engineering, University of Maribor, Smetanova 17, 2000 Maribor, Slovenia
2
Laboratory for Characterization and Processing of Polymers, Faculty of Mechanical Engineering, University of Maribor, Smetanova 17, 2000 Maribor, Slovenia
*
Author to whom correspondence should be addressed.
Chemosensors 2021, 9(8), 189; https://doi.org/10.3390/chemosensors9080189
Submission received: 24 June 2021 / Revised: 20 July 2021 / Accepted: 21 July 2021 / Published: 22 July 2021
(This article belongs to the Collection Sustainable Metal Oxide Materials for Sensing Applications)

Abstract

:
In this work, different electrodes were employed for the determination of Cr(VI) by the cathodic square-wave voltammetry (SWV) technique and the square-wave adsorptive stripping voltammetry (SWAdSV) technique in combination with diethylenetriaminepentaacetic acid. Using SWV, a comparison of the analytical performance of the bare glassy carbon electrode (GCE), ex situ electrodes (antimony-film—SbFE, copper-film—CuFE, and bismuth-film—BiFE), and the GCE modified with a new magnetic nanocomposite (MNC) material was performed. First, the MNC material was synthesized, i.e., MNPs@SiO2@Lys, where MNPs stands for magnetic maghemite nanoparticles, coated with a thin amorphous silica (SiO2) layer, which was additionally functionalized with derived lysine (Lys). The crystal structure of the prepared MNCs was confirmed by X-ray powder diffraction (XRD), while the morphology and nano-size of the MNCs were investigated by field emission scanning electron microscopy (FE-SEM) and transmission electron microscopy (TEM), where TEM was additionally used to observe the MNP core and silica layer thickness. The presence of functional groups of the MNCs was investigated by attenuated total reflection Fourier transform infrared spectroscopy (ATR-FTIR) and surface analysis was performed by X-ray photoelectron spectroscopy (XPS). The hydrophilicity of the modified electrodes was also tested by static contact angle measurements. Then, MNPs@SiO2@Lys was applied onto the electrodes and used with the SWV and SWAdSV techniques. All electrodes tested with the SWV technique were effective for Cr(VI) trace determination. On the other hand, the SWAdSV technique was required for ultra-trace determination of Cr(VI). Using the SWAdSV technique, it was shown that a combination of ex situ BiFE with the deposited MNPs@SiO2@Lys resulted in excellent analytical performance (LOQ = 0.1 µg/L, a linear concentration range of 0.2–2.0 µg/L, significantly higher sensitivity compared to the SWV technique, an RSD representing reproducibility of 9.0%, and an average recovery of 98.5%). The applicability of the latter system was also demonstrated for the analysis of a real sample.

Graphical Abstract

1. Introduction

The determination of chromium ions in environmental samples at trace levels is an important area of research because they are toxic to living organisms and cause severe damage [1]. Cr(VI) is considered more toxic than Cr(III). It has high oxidation potential, high solubility, and mobility through membranes in living organisms [2]. The World Health Organization (WHO) sets the guideline value for Cr(VI) in tap water at 50 µg/L [3]. Moreover, it has been shown that a Cr(VI) concentration even lower than 50 µg/L poses a hazard to environmental systems due to its accumulation [4]. Conventionally, spectroscopic and chromatographic techniques are used to determine Cr(VI) [5,6,7]. However, these techniques are time-consuming and require expensive instrumentation [8]. On the other hand, electrochemical techniques, especially adsorptive stripping voltammetry (AdSV), appear to be a suitable alternative to spectroscopic and chromatographic techniques for Cr(VI) determination due to their ease of use, low instrumentation cost, low detection limit (LOD), and selectivity for chromium speciation [9,10].
AdSV techniques for chromium ion determination are based on the absorption of surface-active complexes formed with chromium ion and various ligands, such as pyrocatechol violet [11,12], hydroxyethyl-ethylenediaminetriacetic acid [12], ammonium pyrrolidine dithiocarbamate [13], ethylenediaminetetraacetic acid (EDTA) [14], triethylenetetraaminehexaacetic acid (TTHA) [15], diethylenetriaminepentaacetic acid (DTPA) [14,15,16,17,18,19,20,21,22,23,24,25], and cupferron [15,26,27].
AdSV measurements for chromium ion determination have been performed previously, i.e., using hanging mercury-drop [18,28,29] and mercury-film electrodes [24,26]. However, less toxic electrode materials are currently being sought, to replace mercury and avoid environmental contamination. To this end, some countries have completely banned the use of mercury to comply with the Minamata Convention on Mercury [30]. Based on this, various metal-film electrodes have been used for heavy metal determination. Among them, bismuth-film (BiFE) deposited on a glassy carbon electrode (GCE) has been most widely used [31,32]. Bi is deemed to be an environmentally friendly element due to its very low toxicity [16,33]. Recently, antimony-film (SbFE) and copper-film (CuFE) electrodes have also been introduced [34,35,36,37], which have shown some advantages compared with BiFE [38,39]. Currently, other modifications of BiFE are being sought to improve the electroanalytical performance for Cr(VI) determination [9,40,41], e.g., surface modification with nanoparticles (NPs) has received much attention.
Nanomaterials exhibit exceptional physicochemical properties, such as a high surface-to-volume ratio, high adsorption capacity, and various other advantageous properties not present in their bulk counterparts. BiFE surfaces have mainly been modified with nanomaterials, which include graphene [42,43], carbon nanotubes [44,45,46], metallic nanoparticles [43,47,48], and copolymer composite [49]. When using NPs in electroanalytical research, a key factor for improving the performance of the electrode is to achieve the desired hydrophilicity, and to avoid the agglomeration and generated defects of the NPs. As presented in this study, the latter can be achieved by using magnetic NPs (MNPs) with specific functional groups on the (metal-film-modified) GCE. In this work, an MNP nanocomposite of MNPs@SiO2@Lys was used (Lys represents derived lysine having amino and carboxylic functionalities) [50], which also showed great efficiency in removing chromium ions from a sludge suspension, among other of the most critical heavy metals. So far, only a few MNP-modified electrodes have been presented for Cr(VI) determination [51,52,53,54], e.g., the modification of the GCE with Fe3O4/MoS2 showed good electroanalytical performances for Cr(VI) determination, such as a wide linear concentration range from 52.0 μg/L to 136.8 mg/L and an LOD of 26.0 μg/L [52]).
The aim of this study was to develop new voltametric electroanalytical techniques for the determination of Cr(VI) traces. First, the bare GCE, ex-situ film electrodes (BiFE, SbFE, and CuFE), and the GCEs modified with MNCs (hereinafter GCE/MNPs@SiO2@Lys) were employed in combination with cathodic square-wave voltammetry (SWV). To the best of the authors’ knowledge, the use of CuFE, SbFE, and GCE/MNPs@SiO2@Lys for Cr(VI) determination has not been reported previously. MNPs@SiO2@Lys was synthesized, and its morphology was characterized by field-emission scanning electron microscopy (FE-SEM) and transmission electron microscopy (TEM). The material’s structural analysis was performed by X-ray powder diffraction (XRD), attenuated total reflection-Fourier transform infrared (ATR-FTIR) spectroscopy, and X-ray photoelectron (XPS) spectroscopy. The hydrophilicity of the modified electrodes was also tested by static contact angle measurements. Since the BiFE showed the best analytical performance among the tested ex-situ electrodes, this electrode was further used and modified with MNCs (hereinafter referred to as BiFE/MNPs@SiO2@Lys) in combination with adsorptive cathodic stripping square-wave voltammetry (SWAdSV). The preconcentration step involved the adsorption of Cr(III)-H2DTPA complex, which formed after the reduction of Cr(VI) to Cr(III), which chelates with DTPA. For comparison, non-MNP-modified ex-situ BiFE was used in combination with the SWAdSV technique for Cr(VI) determination. Finally, the applicability of the newly developed technique using BiFE/MNPs@SiO2@Lys was demonstrated for a real sample analysis. Hitherto, to the best of the authors’ knowledge, no such modification of the surface of an electrode has been reported previously.

2. Experimental

2.1. Solutions

Solutions of standard (1000 mg/L) Bi(III), Sb(III), and Cu(II) were supplied by Merck (Darmstadt, Germany). DTPA (≥99.0%) was supplied by Sigma Aldrich (St. Louis, MO, USA). The solutions of Cr(VI) were prepared by dissolving the required amount of (NH4)2Cr2O7 standard (1000 mg/L), which was supplied by Sigma Aldrich (St. Louis, MO, USA). The solution of Cr(VI) was prepared daily. All solutions were prepared with ultrapure water (>18.2 MΩ cm) obtained using the ELGA water purification system (Lane End, UK).
MNPs@SiO2@Lys MNCs were prepared using the following chemicals: FeSO4·7H2O, NaOH (˃98%), NH4OH (25% aqueous solution), and acetone (≥99.5%) supplied by Honeywell (Seelze, Germany); Fe2(SO4)3·7H2O, tetraethylorthosilicate (TEOS, ≥98%), HCl (≥37%), L-lysine crystallized (≥98%), and 3-glycidoxypropyltrimethoxysilane (GOPTS, 98%) supplied by Sigma-Aldrich (St. Louis, MO, USA); citric acid (CA, ≥99.5%, anhydrous) supplied by Roth, (Karlsruhe, Germany); absolute EtOH (anhydrous) and KCl (pro analysis) supplied by CarloErba (Val de Reuil, France).

2.2. Preparation of MNPs@SiO2@Lys

The detailed procedure for the preparation of MNPs@SiO2@Lys is described in the reference [50]. Briefly, maghemite MNPs were prepared by the co-precipitation of Fe2+ and Fe3+ ions under an air atmosphere. In order to prepare a stable dispersion of the MNPs, CA was adsorbed onto the MNPs (i.e., MNPs@CA), which imparted a strong negative charge to the MNPs. MNPs with adsorbed CA (used as 2 wt.% aqueous dispersion; in this way, the silica layer thickness was controlled by varying the ratio of MNPs@CA/precursor TEOS) were then coated with a thin silica layer to improve the surface reactivity of the MNPs using the modified Stöber sol-gel method. Finally, the amino acid lysine was derivatized with epoxy organosilane and covalently bonded to the silica-coated MNPs.

2.3. Techniques for the Characterization of MNPs@SiO2@Lys and the Hydrophilicity of Electrodes

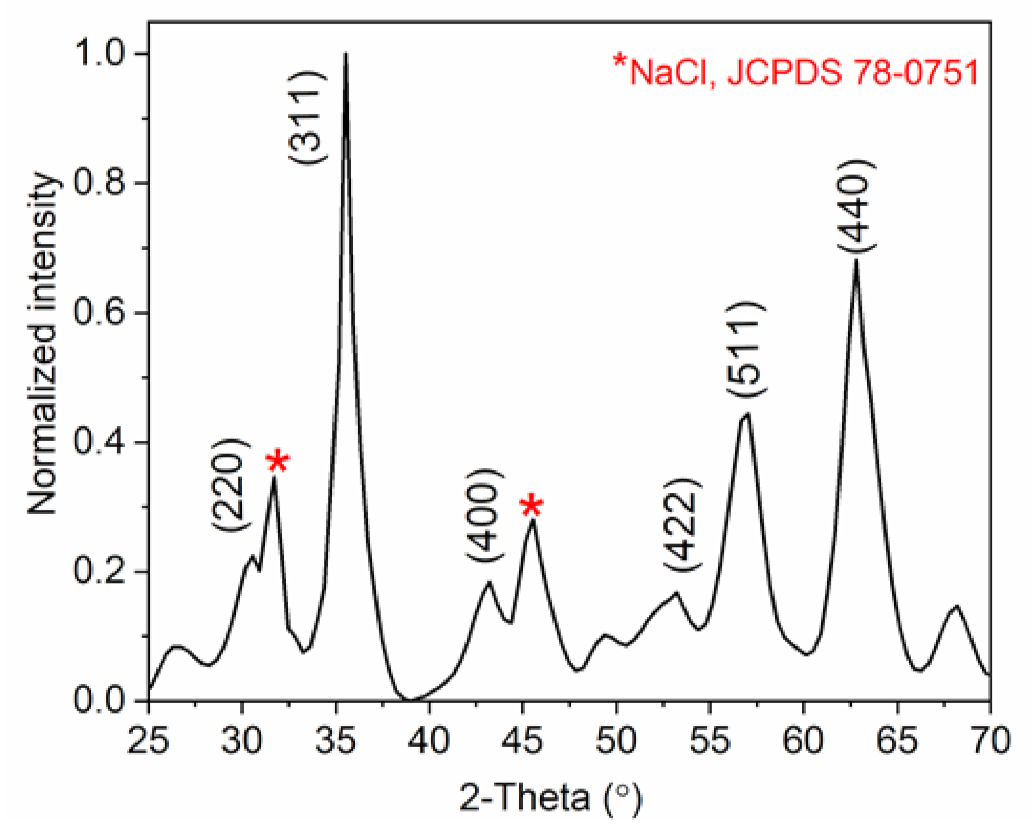
2.3.1. Structural Analysis Using XRD

The XRD measurement of MNPs@SiO2@Lys was carried out on a PANalytical X’ Pert PRO instrument (Malvern Pananalytical, Almelo, The Netherlands) with Cu Kα radiation (λCuKα = 1.5406 Å) and a 25 to 70° 2θ range at a scan rate of 0.385° min–1.

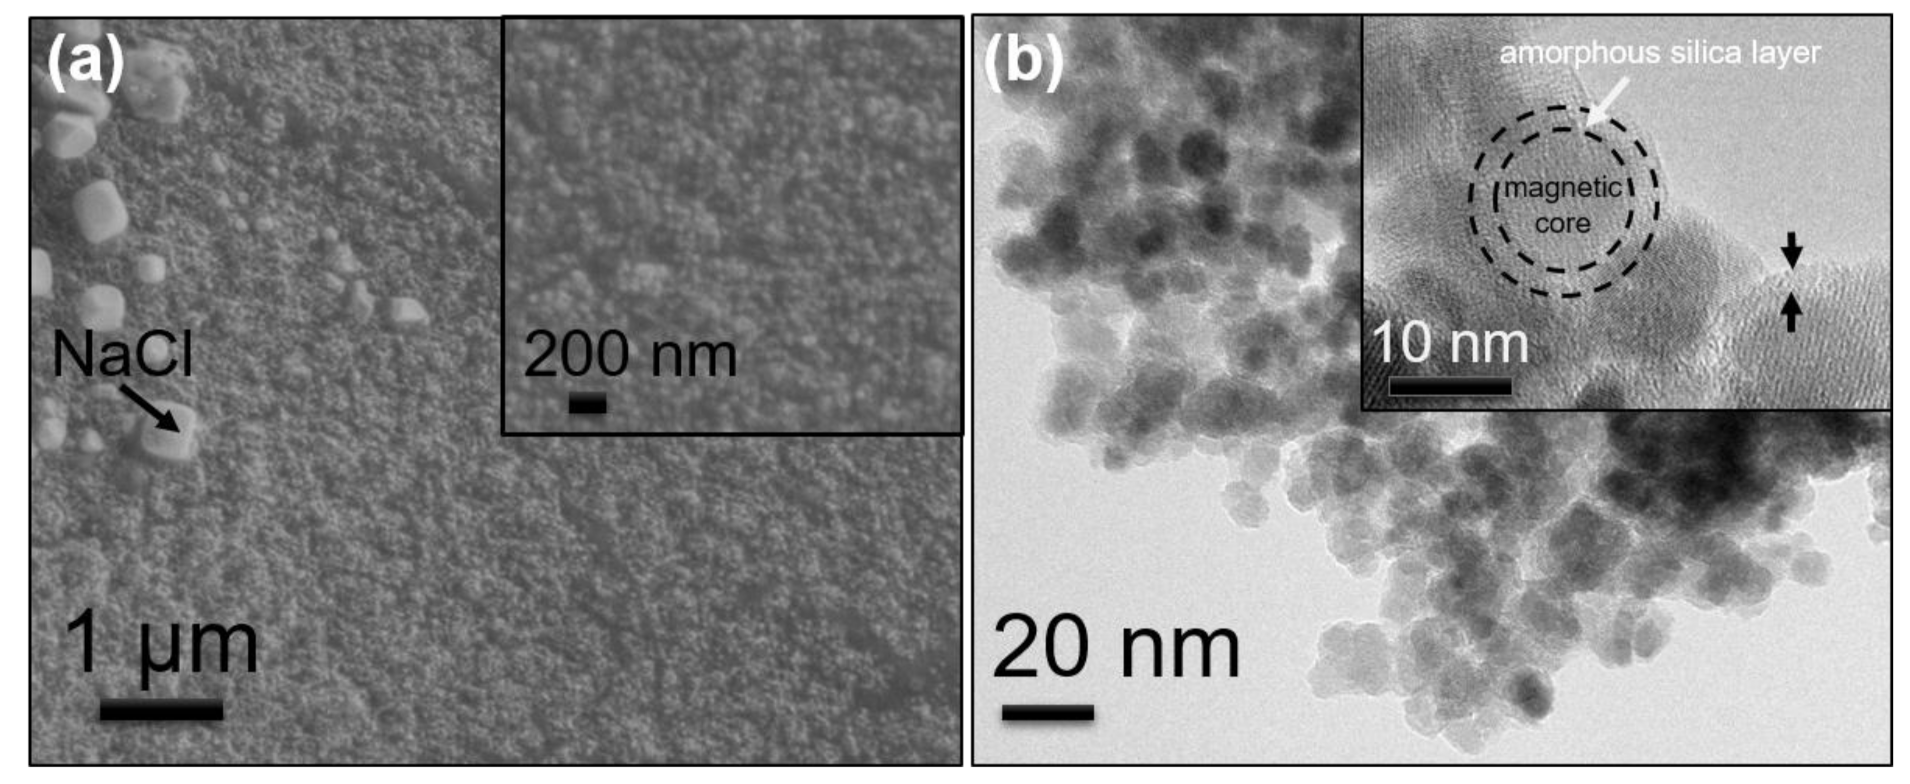
2.3.2. Morphology Measurements of MNPs@SiO2@Lys

An FE-SEM device (Carl Zeiss SUPRA 35 VP with a GEMINI field emission module, Jena, Germany) was employed for the morphology measurements. The stable aqueous dispersion of MNPs@SiO2@Lys at a pH of around 6 was applied to a double-sided adhesive conductive carbon tape, which was placed on an aluminum sample holder and dried in air at room temperature. Morphology measurements were performed at an accelerating voltage of 1 keV. SEM images were acquired in secondary electron mode using an in-lens detector to improve resolution. The more detailed morphology of the MNCs was analyzed using TEM (JEM-2100, Jeol, Tokyo, Japan) at an accelerating voltage of 200 kV. To perform the TEM measurements, the MNPs@SiO2@Lys MNCs were deposited on a perforated transparent carbon film supported by a copper grid. The equivalent diameter of the magnetic core and the silica shell thickness were estimated from various TEM images using Gatan Digital Micrograph software.

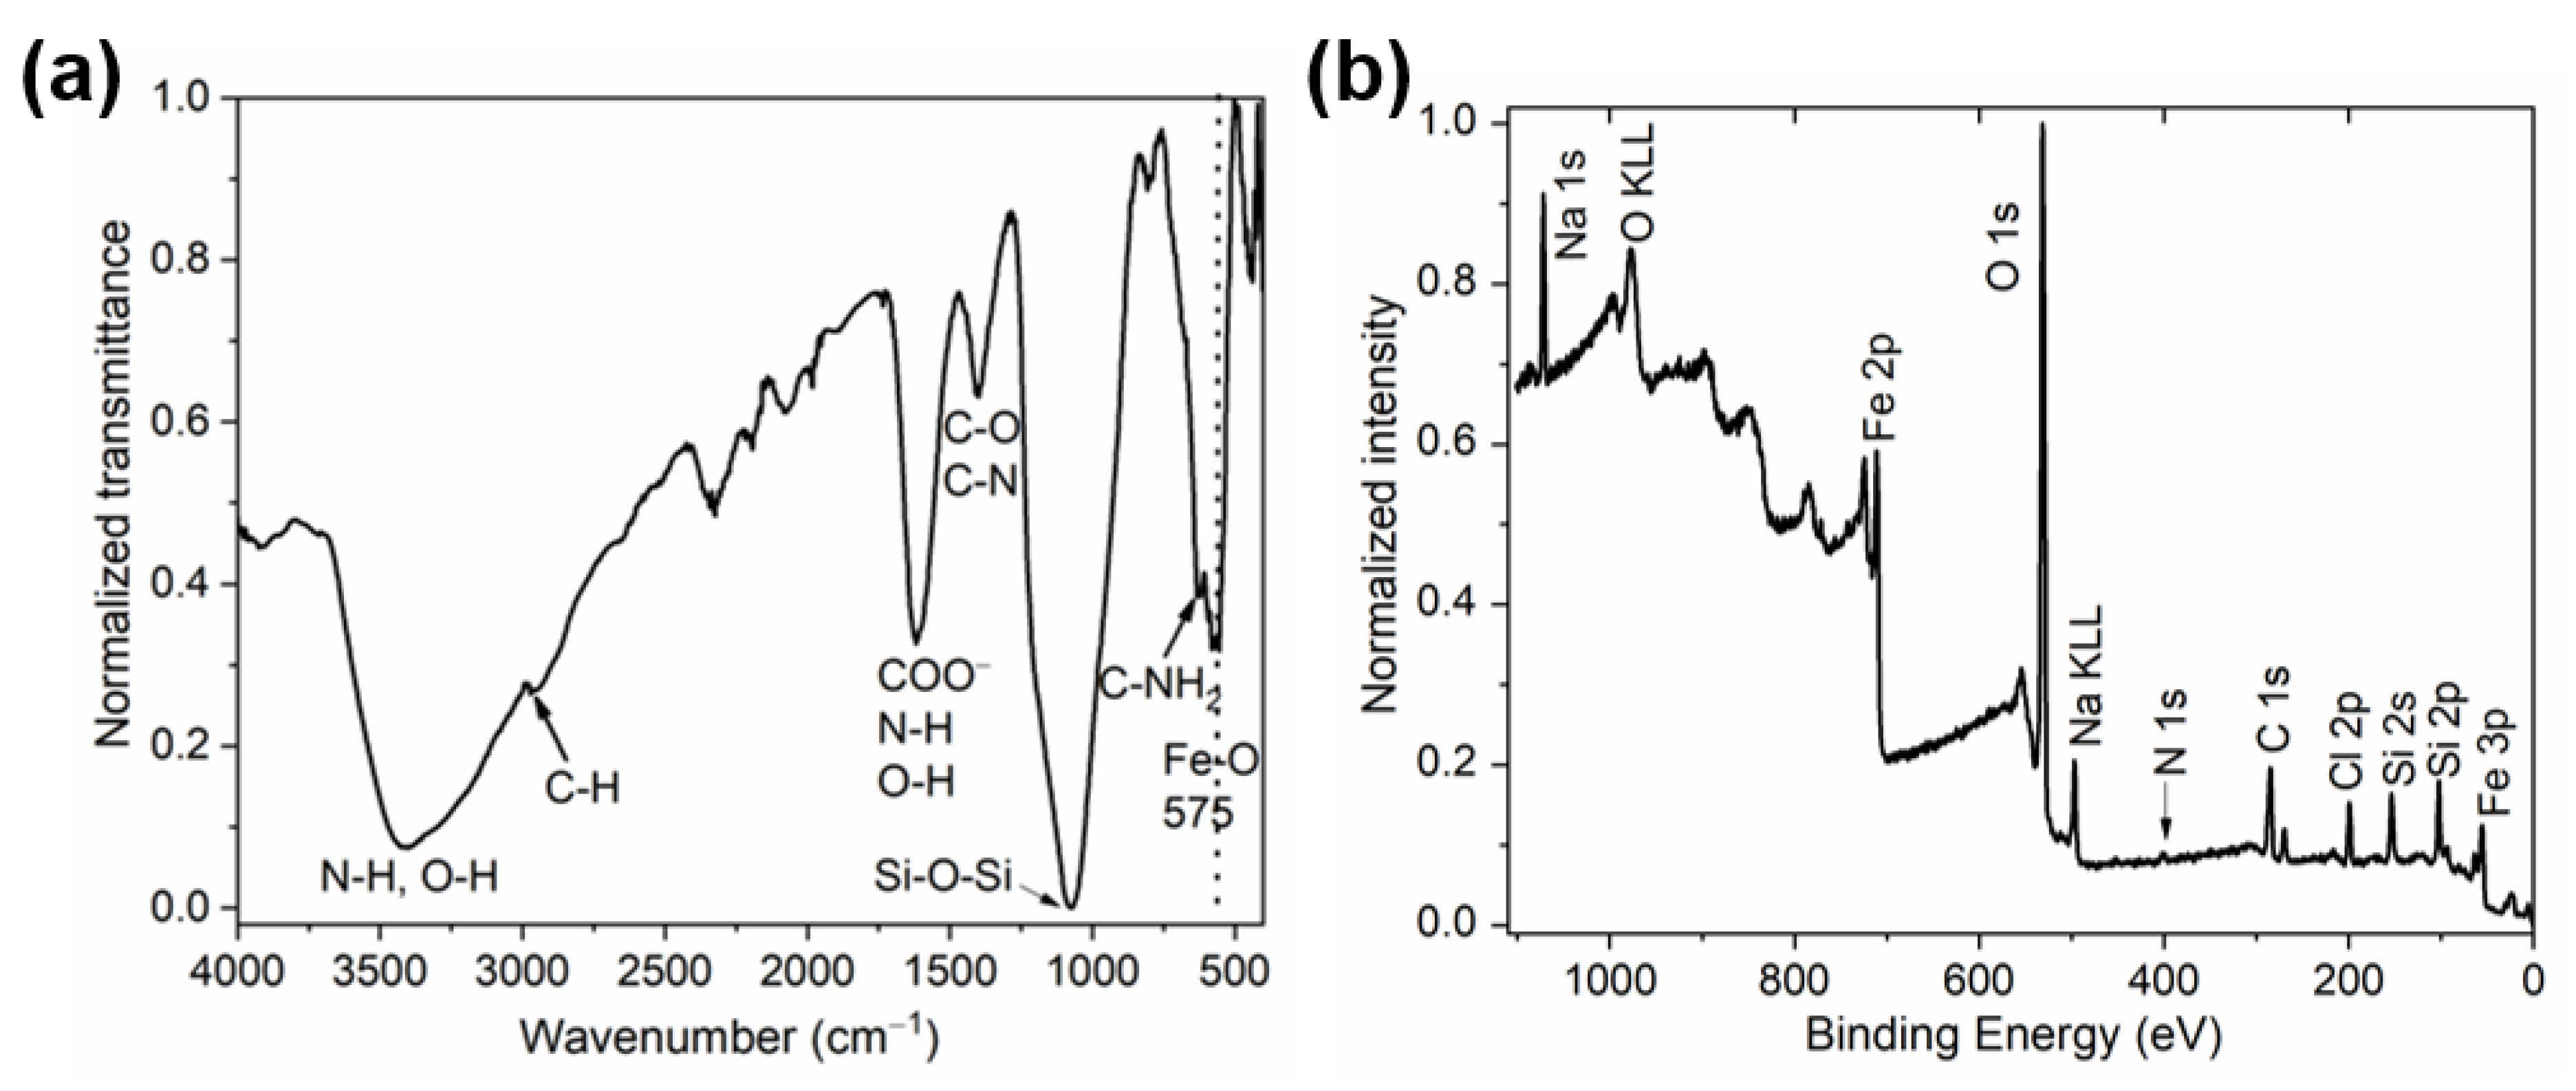
2.3.3. Surface Analysis Using ATR-FTIR Spectroscopy and XPS Analysis

ATR-FTIR spectra were measured with a PerkinElmer Spectrum GX (Waltham, MA, USA) in the wavenumber range of 400−4000 cm–1 at room temperature with a resolution of 1 cm–1. XPS measurements were performed using a PHI-TFA 5600 XPS spectrometer from Physical Electronics Inc. (Chanhassen, MN, USA). The base pressure in the XPS analysis chamber was approximately 6 × 10⁻⁸ Pa. The samples were excited by X-rays using monochromatic Al Kα radiation (1486.6 eV), operated at 200 W. The photoelectrons were measured at a take-off angle of 45°. The radius of the analyzed area was 400 μm. An electron gun was used to compensate for the possible charging effect. A C-C/C-H peak at 284.8 eV in the C 1s spectrum was used to correct the binding energy scale of the XPS spectrum.

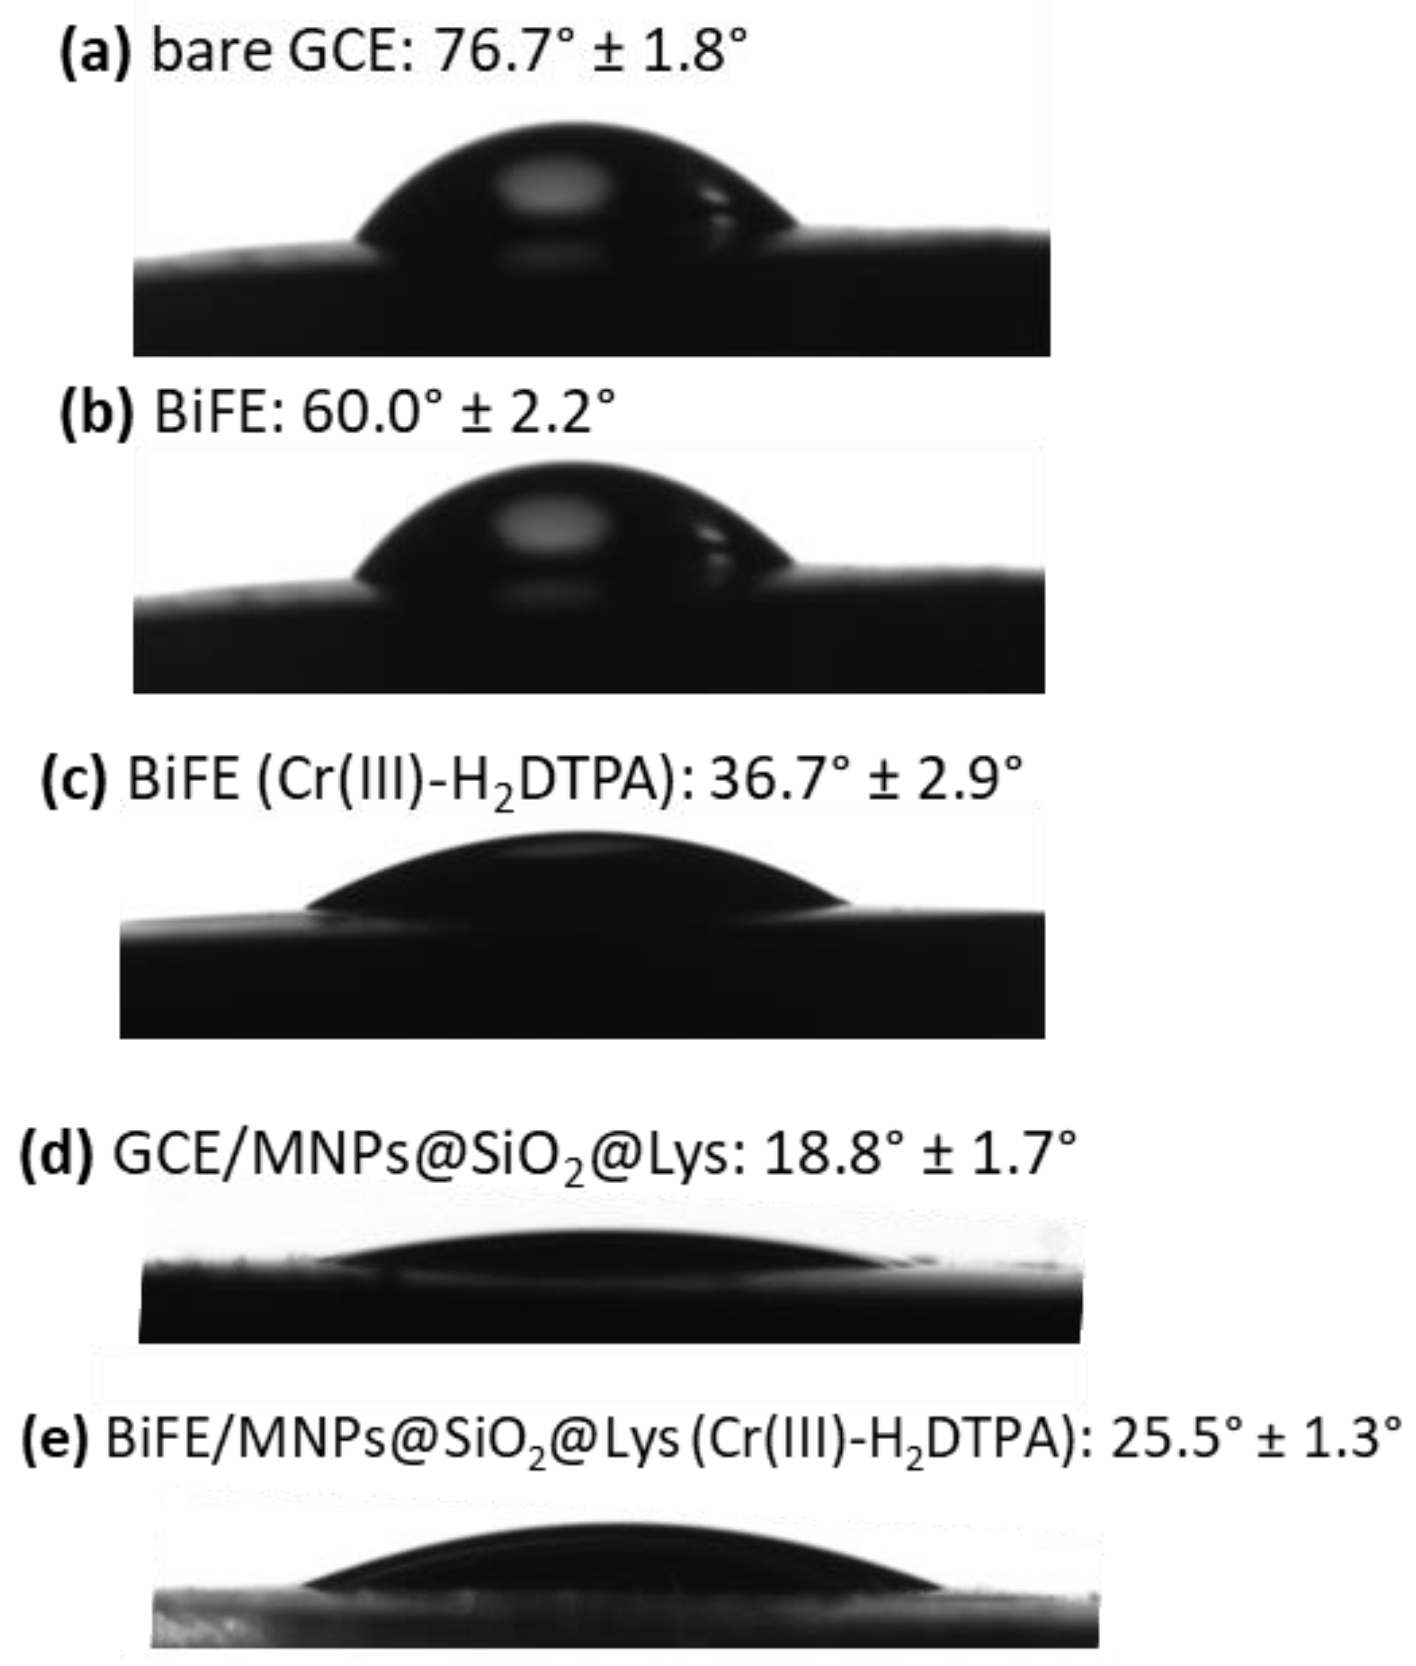
2.3.4. Goniometry Measurements

To determine the surface wettability (or hydrophilicity) of the bare GCE, ex-situ Bi-film electrodes, and MNC-modified electrodes, contact angle measurements were performed using a model OCA 35 optical goniometer (DataPhysics, Filderstadt, Germany) and Static Contact Angle 20 software (DataPhysics). A droplet of 1 μL of ultrapure water was pipetted onto the surface of the electrode, and the static contact angle was determined at room temperature. The droplet was pipetted onto the center of the GCE or the surface of the modified electrodes. Three replicates were performed, and the average contact angle value was calculated and reported.

2.4. Electrochemical Measurements

Voltametric measurements were carried out using a PalmSens potentiostat/galvanostat, model PalmSens4 (PalmSens, Houten, The Netherlands), controlled by PSTrace 5.8 software (PalmSens, Houten, The Netherlands). The cell setup consisted of the bare or modified GCE as a working electrode (the diameter of the working electrode was 3 mm, model ItalSens IS-3 MM.GC.WE), an Ag/AgCl(3M KCl) reference electrode, and a platinum wire as a counter electrode. These electrodes were supplied by PalmSens. All potentials reported in this work refer to the Ag/AgCl(3M KCl) reference electrode. The electrodes were placed in an electrochemical cell (model IS-MRS.1 Mini-Retort Stand, supplied by PalmSens). Stirring was performed with a Topolino stirrer (IKA, Staufen im Breisgau, Germany). The GCE electrode was polished with 0.05 µm Al2O3 (Buehler, Lake Bluff, IL, USA), washed with ultrapure water, and finally cleaned in an ultrasonic bath (containing ultrapure water) for 3 min. All measurements were repeated at least three times, and the data were checked for possible outliers using Dixon’s and Grubbs’ statistical tests at 95% confidence [55].

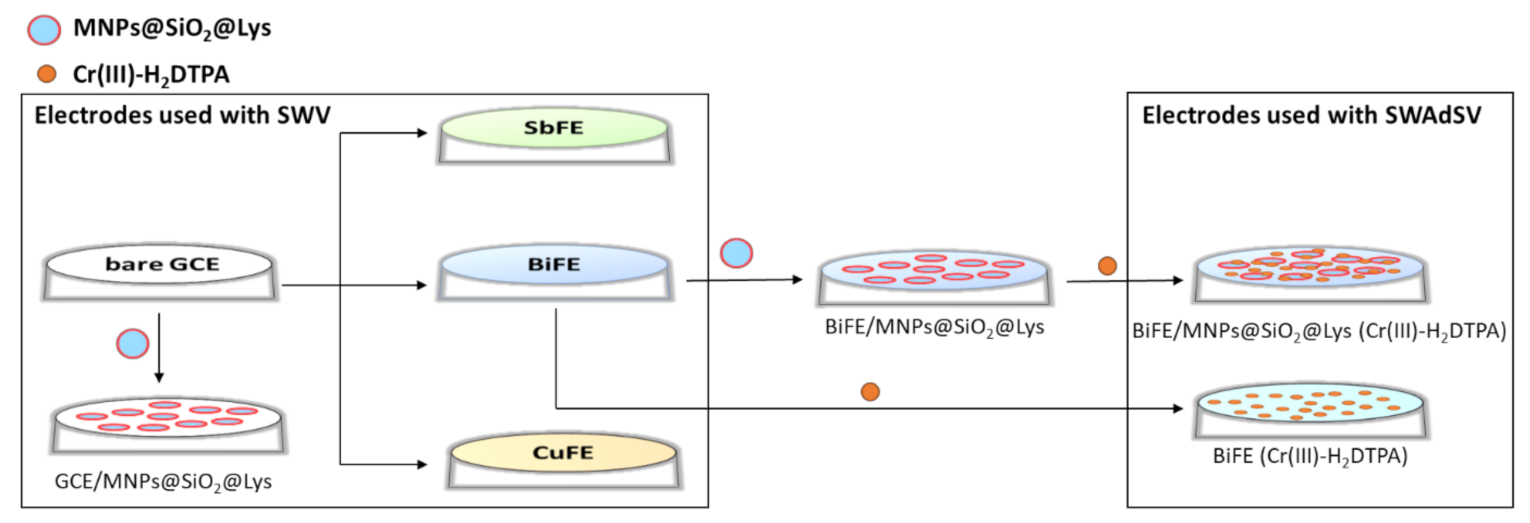
2.4.1. Preparation of the Ex-Situ Electrodes

Ex-situ BiFE, SbFE, and CuFE were prepared in 0.1 M acetate buffer (pH 4.4) containing 0.5 mg/L Bi(III) or 0.5 mg/L Sb(III) or 0.5 mg/L Cu(II), respectively. All these metal-film electrodes were deposited at an accumulation potential of −1.20 V and an accumulation time of 120 s with constant stirring using a magnetic bar.
The ex-situ metal-film electrode was removed from the GCE surface by immersion in 0.1 M HCl solution and an applied potential of 0.60 V for 300 s.

2.4.2. Cathodic SWV Measurements of Cr(VI) Using Ex Situ Electrodes

Cathodic SW voltammograms were measured in a deaerated 0.1 M acetate buffer (pH 4.4). Deaeration was performed by purging the solution with pure N2 for 10 min before each analysis. SWV and SWAdSV were performed in the potential range from 0.00 V to −0.90 V with a potential step of 2 mV, an amplitude of 40 mV, and a frequency of 25 Hz.

2.4.3. SWAdSV Measurements Using DTPA as a Complexing Agent

SWAdSV measurements were performed in 0.1 M acetate buffer containing 0.2 M KCl. The addition of KCl (compared with the supporting electrolyte used for SWV) resulted in well-shaped stripping peaks. DTPA was added to a final concentration of 5 mM for all SWAdSV measurements [27]. Before each SWAdSV measurement, the solution was purged with pure N2 for 10 min.
First, a preconcentration (accumulation) of Cr(III)-H2DTPA at the working electrode was performed at an accumulation potential (Eacc) of −0.40 V with an accumulation time (tacc) of 60 s [56]. In this preconcentration period, Cr(VI) is reduced to Cr(III), which chelates with DTPA. The formed Cr(III)-H2DTPA adsorbs and accumulates on the surface of the electrode. The solution was stirred during the accumulation step. Then the stirring was stopped for a 10 s equilibration period, followed by an SW voltammogram measurement in the potential range from −0.60 V to −1.45 V. During the negative-going potential scan, the reduction from Cr(III)-H2DTPA to Cr(II)-H2DTPA takes place at the electrode surface, which serves as an analytical signal in the SWAdSV techniques. The voltammograms showed a well-defined stripping peak around −1.02 V. The working electrode was cleaned after the SWAdSV measurement in 0.1 M acetic buffer solution by applying −1.20 V for 15 s to avoid memory effects [56]. A schematic representation of the electrode modifications for all electrodes is given in Figure 1.

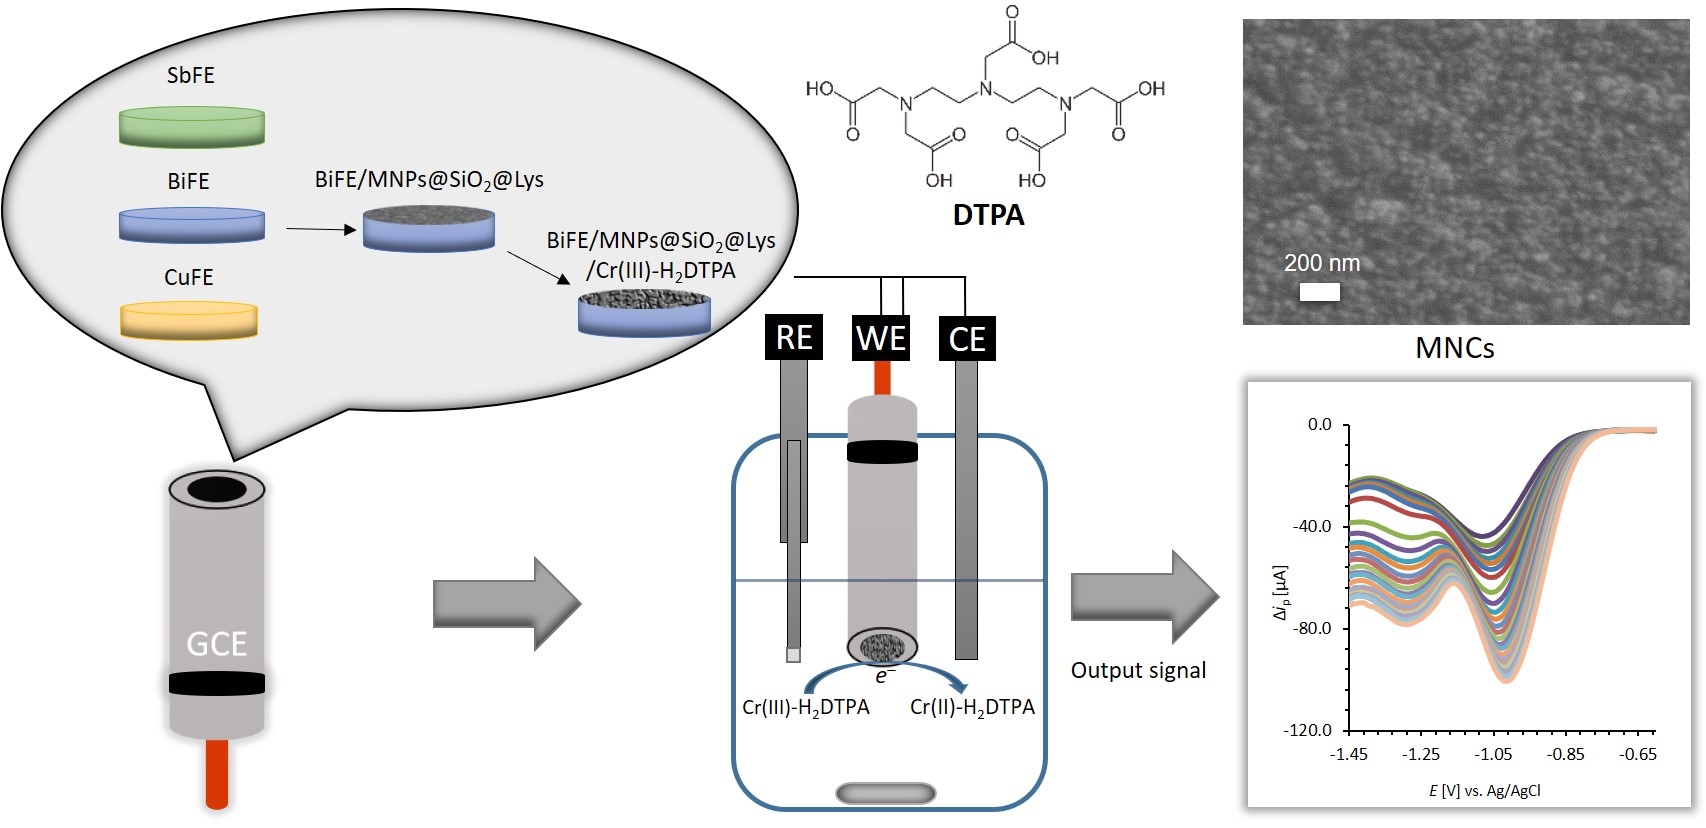
2.4.4. Modification of the GCE or Ex-Situ BiFE with MNPs@SiO2@Lys

A 10 μL dispersion of MNPs@SiO2@Lys with a pH of 6 and a concentration of MNCs of approximately 3 mg/mL (corresponding to 1.1 × 10¹³ MNCs/mm2 on the active surface area of the GCE) was pipetted onto the bare GCE surface or ex-situ BiFE and allowed to dry at room temperature to obtain GCE/MNPs@SiO2@Lys or BiFE/MNPs@SiO2@Lys, respectively.

3. Results and Discussion

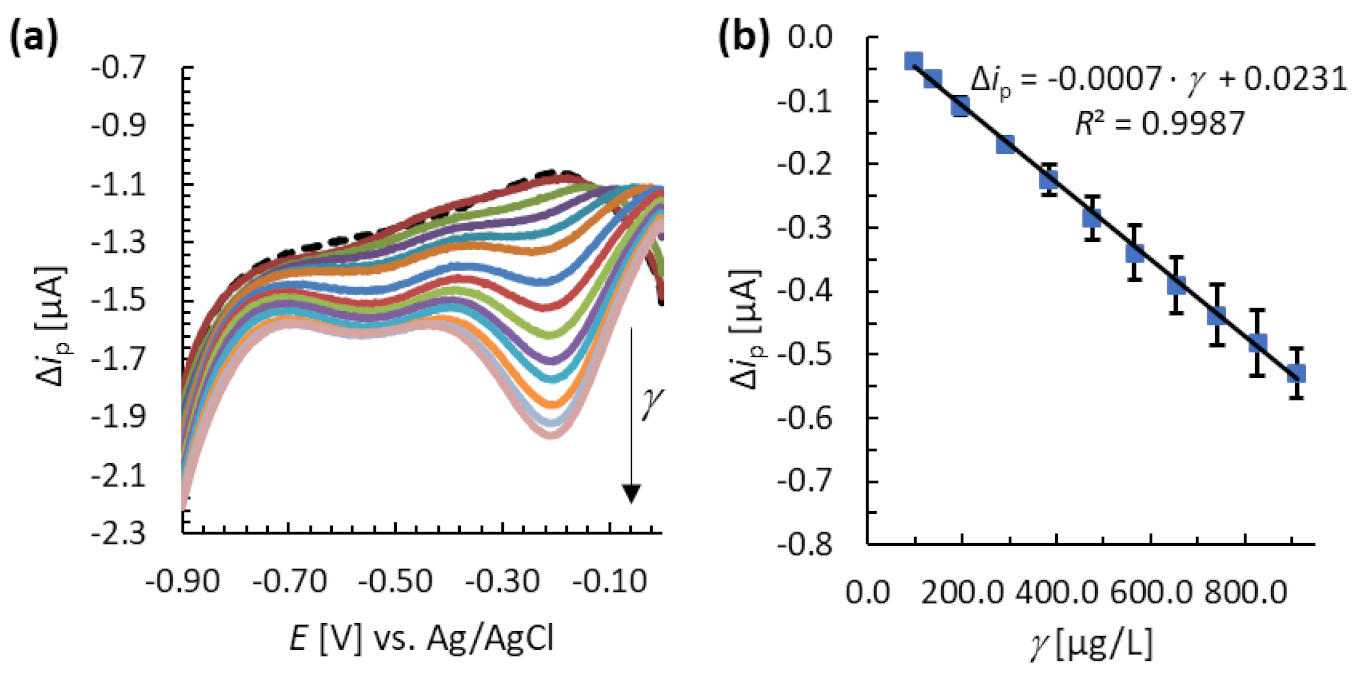
3.1. Analytical Performance of Different Electrodes

Various electrodes were used for partial method validation to determine the LOD, the limit of quantification (LOQ), the linear concentration range, sensitivity, precision (reproducibility), and accuracy. Cathodic SW voltammograms measured in 0.1 M acetate buffer solution using different electrodes show the characteristic peak representing the reduction of Cr(VI) to Cr(III). An example of these measurements using ex-situ BiFE is shown in Figure 2a. The analytical signal for the SWV technique represents the current peak that develops at approximately –0.20 V (Figure 2a) [9,40].
The LOD and LOQ were determined experimentally based on the signal-to-noise ratio (S/N), where S represents the height of the current peak (Δip) and N represents the baseline noise. The LOD and LOQ were determined by measuring the cathodic SW voltammograms by increasing the Cr(VI) concentration. When the S/N was equal to (or higher than) 3, but lower than 10, the concentration of Cr(VI) that was analyzed to obtain the corresponding voltammogram was considered to be the LOD of the technique. The same approach was employed for LOQ determination, whereas S/N was equal to or higher than 10 [57].
In order to determine the linear concentration range of the techniques, two criteria were applied, i.e., the square of the correlation coefficient (R2) should be higher than 0.995, and the quality coefficient should be lower than 5.0% [58]. The sensitivity of the technique was evaluated by the slope of the linear calibration curve; the higher it is, the higher the sensitivity is. The precision and accuracy were evaluated by means of the relative standard deviation in percentage (RSD) and the average recovery in percentage, respectively. All RSD values describing precision in this work were determined in terms of reproducibility, with the electrode freshly prepared before each measurement [59,60,61]. The technique was considered accurate if the average recovery was within an 80.0–120.0% recovery interval, while the technique was considered precise if the RSD was ≤20.0% [62].
Table 1 shows the summary of analytical performances with different electrodes using the SWV and SWAdSV techniques. First, the electroanalytical performance of the electrodes using the SWV technique is discussed, followed by the characterization of MNPs@SiO2@Lys, while the SWAdSV technique is presented last.
For SWV techniques, the linear concentration ranges for the metal-film electrodes (ex-situ CuFE, SbFE, and BiFE) were wider compared to the bare GCE. The widest linear concentration range among the metal-film electrodes tested was obtained with ex-situ BiFE. However, the lower limit of the linear concentration range was lower for the bare GCE compared with the metal-film electrodes. The lower limit of the linear concentration range decreased even more when the bare GCE was modified with MNPs@SiO2@Lys, i.e., when the GCE/MNPs@SiO2@Lys system was used. The highest sensitivity (the highest slope value) among the metal-film electrodes was obtained with ex-situ BiFE compared with ex-situ SbFE and CuFE. On the other hand, the sensitivity of ex-situ BiFE is the same as for GCE/MNPs@SiO2@Lys, while the sensitivity for the bare GCE was even higher. All SWV techniques showed acceptable precision (RSD ≤ 20.0% [62]) apart from the bare GCE, where the RSD was 20.1%. The lowest RSD, and thus the technique with the best precision, was obtained with ex-situ CuFE (RSD = 0.8%). Moreover, all SWV techniques showed satisfactory accuracy with average recoveries between the 80.0–120.0% recovery interval [62]. The best accuracy, with the lowest deviation of the average recovery from 100.0%, was obtained with ex-situ BiFE (Table 1).
Since the ex-situ BiFE showed better analytical performance, in terms of the linear concentration range, sensitivity, and average recovery, compared with ex-situ CuFE and SbFE, it was further used non-modified or modified with MNPs@SiO2@Lys. These two electrodes were then employed in combination with the SWAdSV technique, in which the organometallic complex of Cr(III)-H2DTPA is adsorbed onto the surface of the electrode in the accumulation step (described in Section 2.4.3). The results are presented below in Section 3.4.

3.2. Characterization of the MNCs

A few studies have been reported on the promising application of different MNP-based nanocomposites to improve the electroanalytical performance of the GCE [51,52,53,54], which have great potential for novel electrode designs. In this study, the application of MNPs@SiO2@Lys for the determination of Cr(VI) is presented. First, a detailed characterization of synthesized MNCs was performed, and then they were deposited on the bare GCE and BiFE.
Structural XRD analysis was performed to determine the crystal structure of the prepared MNPs@SiO2@Lys MNCs. The indexed diffraction peaks from the XRD diffractogram (Figure 3) revealed that the crystal structure of MNPs@SiO2@Lys corresponds to maghemite, which has a cubic spinel crystal structure (JCPDS 39-1346, cubic space group P4132). In addition to the spinel crystal structure, some traces of NaCl were also identified. Furthermore, the nanocrystallinity was assumed based on the broad diffraction peaks and the latter was confirmed with the TEM analysis presented below.
The FE-SEM image of the MNCs layer morphology deposited on the carbon type is shown in Figure 4a. These measurements showed that the MNPs@SiO2@Lys were evenly and uniformly distributed on the carbon tape with a low degree of agglomeration. However, some large cubic structures were also present, most likely corresponding to NaCl (NaCl was also detected by XRD, see Figure 3).
To confirm the core-shell structure of the MNCs, TEM measurements were performed (Figure 4b). The inset in Figure 4b at higher magnification shows the core of the maghemite MNP. The size of these MNPs was determined to be 13 ± 3 nm (average diameter ± standard deviation). The individual MNPs are covered with an amorphous silica layer approximately 2 nm thick, forming the core-shell structure. This can be seen as a contrast difference where the darker crystalline quasi-spherical MNPs are surrounded by the brighter amorphous SiO2 layer (the inset in Figure 4b).
In addition, ATR-FTIR analysis revealed the presence of MNPs@SiO2@Lys constituents, i.e., maghemite, the amorphous silica layer, and derived lysine on the MNCs (Figure 5a). The peak at 575 cm–1 (Figure 5a) corresponds to the Fe-O vibrations in Fe2O3, which represents the magnetic core [63] and again confirms the presence of MNPs. The presence of a SiO2 layer in MNPs@SiO2 was confirmed by the asymmetric Si-O-Si stretching vibrations with a peak at about 1080 cm–1 [64]. The peak at 627 cm–1 is assigned to the C-NH2 vibrations from the derived lysine backbone, while the peak at 1404 cm–1 is attributed to the C-O and C-N groups, both from the derived Lys [65,66]. The latter indicates the presence of the derived lysine layer. The peak at 1625 cm–1 corresponds to the -OH vibrations of the silanol groups of Si-OH, while the -(C=O)-O and N-H functional groups demonstrate the presence of the derived Lys [50].
The XPS survey spectrum of MNPs@SiO2@Lys is shown in Figure 5b. The Fe 2p and Fe 3p signals originate from the Fe in the MNPs core. The presence of the Si 2s and Si 2p signals comes from the SiO2 layer. The N 1s signal originates from N atoms in lysine, which again confirms lysine binding to the MNPs@SiO2 surface. Na 1s and Cl 2p originate from NaCl (as explained above). The O 1s signal is mainly from lysine, SiO2, and maghemite, while the C 1s signal is from lysine and adventitious carbonaceous species.

3.3. The Hydrophilicity of the Surface of the Bare GCE and Differently Modified GCEs

The hydrophilicity (wetting properties) of electrode surfaces can play an important role in the heavy metal analysis. Electrodes with higher surface hydrophilicity may be more favorable for analytical Cr(VI) determination in aqueous media. The hydrophilicity of the electrode surface was determined by measuring the static contact angles. Figure 6 shows the wetting properties of the different electrodes.
The average contact angle for the bare GCE was 76.7° ± 1.8° (±value represents the standard deviation, Figure 6a). The ex-situ BiFE had a lower contact angle of 60° ± 2.2° (Figure 6b), indicating higher hydrophilicity compared to the bare GCE. The wetting property of the BiFE was also tested after the accumulation step of the SWAdSV technique when Cr(III)-H2DTPA was adsorbed on the surface. In this case, the contact angle further decreased to 36.7° ± 2.9° (Figure 6c).
The application of MNPs@SiO2@Lys on the bare GCE significantly decreased the contact angle, resulting in the lowest value among all tested electrodes, i.e., 18.8° ± 1.7° (Figure 6d). The latter shows the excellent hydrophilicity of the MNPs@SiO2@Lys dispersion used. Moreover, a low contact angle (25.5° ± 1.3°, Figure 6e) was also measured for the BiFE/MNPs@SiO2@Lys system, indicating an improved ability to detect analytes in water matrices compared to ex-situ BiFE (Figure 6c vs. Figure 6e).

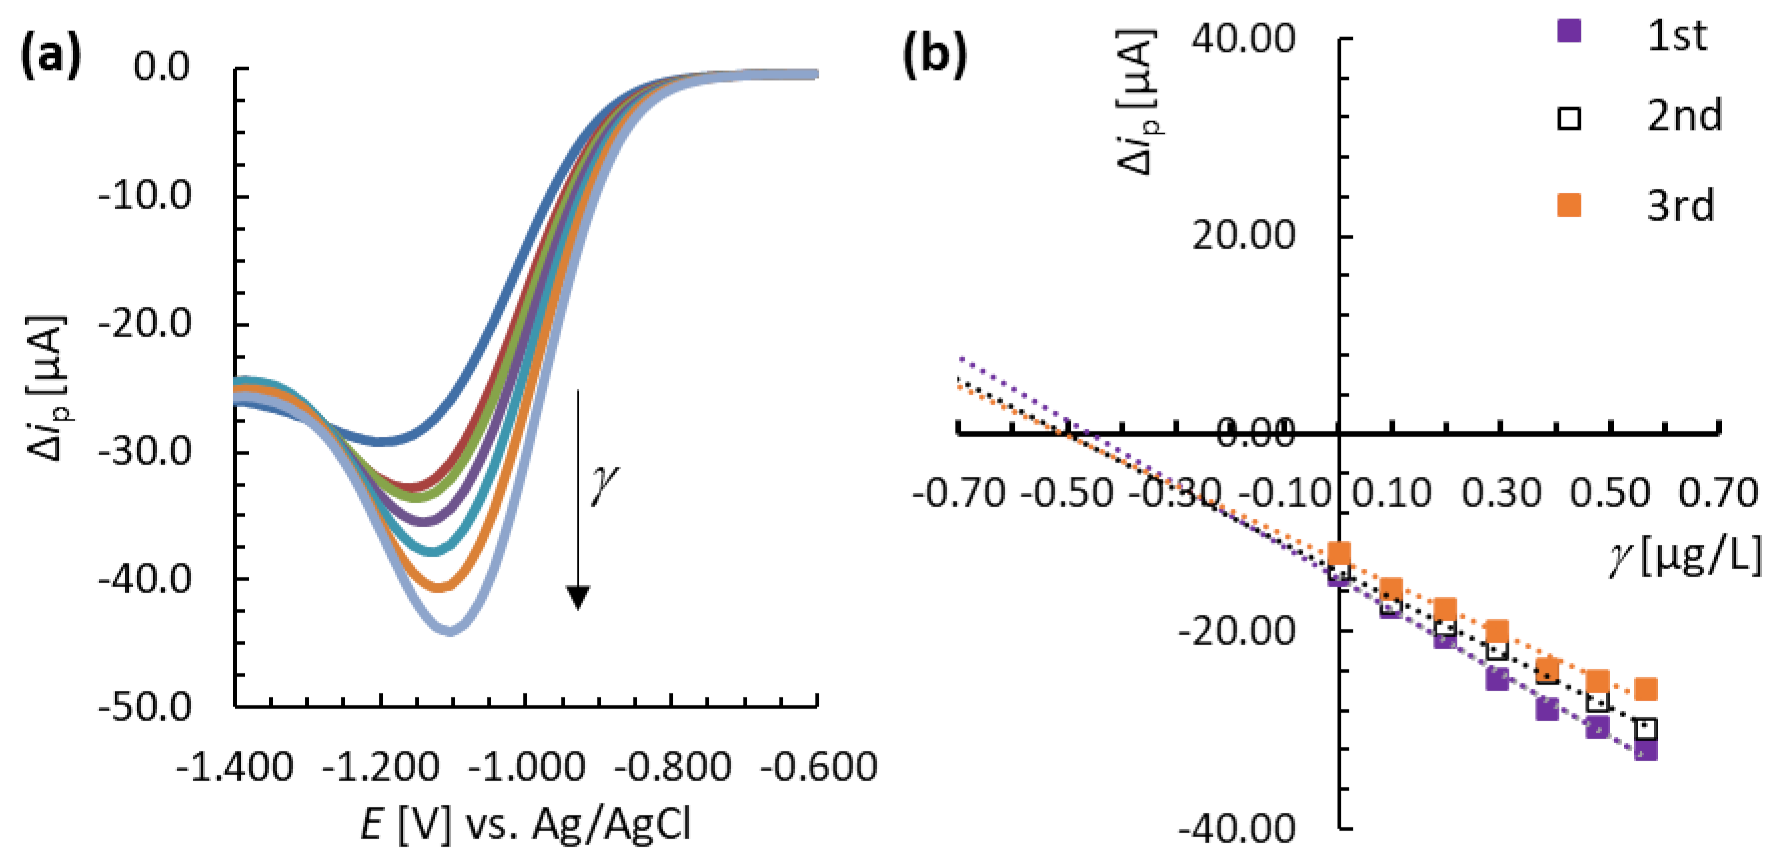
3.4. Analytical Performance of the MNC-Modified Electrodes

SWAdSV measurements and the corresponding linear calibration curve using BiFE/MNPs@SiO2@Lys are shown in Figure 7. For the SWAdSV technique using both electrodes (BiFE and BiFE/MNPs@SiO2@Lys), it was not possible to determine the LOD, because the S/N ratio at which it was first feasible to distinguish the S (Δip) from the background N (when a clear stripping peak was formed) was already ≥10. Therefore, at this tested concentration, this value represents the LOQ and no longer the LOD (thus the LOD values were not reported in Table 1). Compared to the SWV technique, the SWAdSV technique significantly improves the LOQ. For both electrodes used in combination with the SWAdSV technique (BiFE and BiFE/MNPs@SiO2@Lys), the LOQ was 0.1 µg/L, which is about two orders of magnitude lower than the LOQ obtained by the SWV technique (Section 3.1). Therefore, both electrodes used with the SWAdSV technique allow an ultra-trace analysis of Cr(VI). Moreover, the linear concentration range for the SWAdSV technique for both electrodes was at significantly lower concentrations. The advantage of BiFE/MNPs@SiO2@Lys compared with BiFE is its wider linear concentration range (0.2–2.0 µg/L vs. 0.2–0.5 µg/L). Both SWAdSV techniques had significantly higher sensitivities compared with the SWV techniques (represented by slope values in Table 1). For the SWAdSV technique, the system without BiFE was more sensitive compared with the system with BiFE (the former has a higher slope value). Moreover, both electrodes in combination with the SWAdSV technique had satisfactory precision, with RSD ≤ 20.0% [62]. On the other hand, the average accuracy for BiFE/MNPs@SiO2@Lys was acceptable (the average recovery was 98.5%), whereas the system with BiFE resulted in lower average recovery of 65.5%, which is not within the acceptable interval of 80.0–120.0% [62].
The better analytical performance of the MNC-modified electrode (BiFE/MNPs@SiO2@Lys) compared with the non-MNC-modified electrode (BiFE) is attributed to the larger specific surface area of the former. Moreover, the presence of the functional groups and magnetic crystal structure of MNPs@SiO2@Lys resulted in more active sites for analysis. Furthermore, the hydrophilicity was higher for the systems with MNPs@SiO2@Lys (Figure 6), which improved the performance of electroanalysis in aqueous media.
Table 2 shows a comparison of the analytical performances of the present work using BiFE/MNPs@SiO2@Lys with previous studies for the determination of Cr(VI). Most of these studies, apart from BiFE [16], presented voltametric techniques that have a narrower linear concentration range compared to BiFE/MNPs@SiO2@Lys. Most of the electrodes employed previously were applicable to determine Cr(VI) in river water, as reported in Table 2.

3.5. Analysis of a Real Sample

The applicability of the SWAdSV technique using BiFE/MNPs@SiO2@Lys for the determination of Cr(VI) in a real sample was tested using the tap water matrix. No sample pretreatment was performed before analyzing the tap water. The tap water was obtained in our laboratory. When this sample was analyzed, no Cr(VI) was detected (either there was no Cr(VI), or the content was below LOD). Then, the tap water sample was spiked to obtain a final concentration of 0.5 µg/L of Cr(VI). The measured voltammograms show well-shaped stripping peaks (Figure 8a), which represent the reduction of Cr(III)-H2DTPA to Cr(II)-H2DTPA. A multiple standard addition technique was used to determine the Cr(VI) concentration. Figure 8b shows excellent electroanalytical performance, as the deviation from the required 0.5 µg/L with BiFE/MNPs@SiO2@Lys was not significant. Three replica measurements resulted in RSD = 5.7% and an average Re = 98.0% showing the great accuracy and precision of the BiFE/MNPs@SiO2@Lys system. Therefore, using the BiFE/MNPs@SiO2@Lys system, the detection of Cr(VI) can be performed at significantly lower concentrations compared to the concentration limit for Cr(VI) set by the World Health Organization (WHO), i.e., 50 µg/L [3].

4. Conclusions

In this work, two different series of measurements for Cr(VI) determination are presented, in the first case by cathodic square-wave voltammetry (SWV) and in the second case by adsorptive stripping square-wave voltammetry (SWAdSV) in combination with diethylenetriaminepentaacetic acid (DTPA) as the complexing agent.
The focus was on method development using electrodes that were modified with magnetic nanocomposite (MNC) material, which was newly synthesized, to improve their electroanalytical performance. The MNC material was based on magnetic maghemite nanoparticles coated with a thin amorphous silica (SiO2) layer and functionalized with derived lysine (Lys) to obtain MNPs@SiO2@Lys. The prepared MNPs@SiO2@Lys MNCs had a maghemite spinel crystal structure, which was confirmed by structural XRD analysis. FE-SEM analysis revealed nano-sized and uniformly distributed MNCs, while TEM confirmed the formed core-shell crystal structure and individual size of MNCs. The presence of functional groups on the MNCs was confirmed by ATR-FTIR. Moreover, the XPS technique confirmed the elemental structure of the MNCs. With the application of this MNC material on the bare GCE or ex-situ BiFE, the hydrophilicity of the surface of the electrode increased significantly.
The SWV technique was applied with five different electrodes: the bare GCE, ex-situ metal-film electrodes (antimony-film—SbFE, copper-film—CuFE, and bismuth-film—BiFE), and the GCE modified with MNPs@SiO2@Lys. It was shown that these electrodes were effective for the determination of Cr(VI). However, the limit of quantification (LOQ) for these electrodes was relatively high (from 59.6 µg/L for GCE/MNPs@SiO2@Lys to 79.4 µg/L for the bare GCE, 99.0 µg/L for ex-situ BiFE, and 138.1 µg/L for ex-situ SbFE and ex-situ CuFE). In order to significantly decrease the LOQ of the electroanalytical technique, the SWAdSV technique must be used. On this basis, the bare GCE and ex-situ BiFE were modified with MNPs@SiO2@Lys and used in SWAdSV measurements. The latter allowed the analysis of significantly lower Cr(VI) concentrations, i.e., the linear concentration range of the SWAdSV technique was in the range of 0.2–2.0 µg/L using BiFE modified with MNPs@SiO2@Lys (for comparison, a narrower linear concentration range was obtained with the bare GCE modified with MNPs@SiO2@Lys). Moreover, the precision (RSD = 9.0%, n = 6) and accuracy (an average recovery of 98.5%, n = 6) were satisfactory with the BiFE modified with MNPs@SiO2@Lys using the SWAdSV technique. The latter system was also used for the analysis of a real sample (tap water), which gave excellent analytical results.

Author Contributions

Conceptualization O.P., M.F.; Data curation N.H., O.P.; Formal analysis N.H., O.P.; Funding acquisition M.F.; Investigation O.P., N.H., M.F.; Methodology O.P., M.F.; Project administration M.F.; Resources M.F.; Software M.F.; Supervision M.F.; Validation N.H., M.F.; Visualization O.P., N.H., M.F.; Roles/Writing—original draft O.P., M.F.; Writing—review & editing M.F. All authors have read and agreed to the published version of the manuscript.

Funding

The authors would like to thank the Ministry of Education, Science and Sport of Slovenia for financially supporting the present work through the operation C3330-19-952024, and the Slovenian Research Agency (Research Core Funding Nos. P2-0118 and P2-0046).

Institutional Review Board Statement

Not applicable.

Informed Consent Statement

Not applicable.

Data Availability Statement

The data presented in this study are available on request. The data are not publicly available due to technical limitations.

Acknowledgments

The authors would like to thank the Ministry of Education, Science and Sport of Slovenia for financially supporting the present work through the operation C3330-19-952024, and the Slovenian Research Agency (Research Core Funding Nos. P2-0118 and P2-0046). The authors also acknowledge the use of equipment at the Nanocenter—Centre of Excellence in Nanoscience and Nanotechnology, and thank Sašo Gyergyek, for performing the TEM analysis. We also thank Alenka Vesel, for her assistance with the XPS analyses.

Conflicts of Interest

The authors declare no conflict of interest.

References

  1. De Flora, S. Threshold mechanisms and site specificity in chromium(VI) carcinogenesis. Carcinogenesis 2000, 21, 533–541. [Google Scholar] [CrossRef] [PubMed] [Green Version]
  2. Oliveira, H. Chromium as an Environmental Pollutant: Insights on Induced Plant Toxicity. J. Bot. 2012, 2012, 375843. [Google Scholar] [CrossRef]
  3. World Health Organization. Chemical Hazards in Drinking-Water: Chromium; WHO Press: Geneva, Switzerland, 2004. [Google Scholar]
  4. Almeida, J.C.; Cardoso, C.E.D.; Tavares, D.S.; Freitas, R.; Trindade, T.; Vale, C.; Pereira, E. Chromium removal from contaminated waters using nanomaterials—A review. TrAC Trends Anal. Chem. 2019, 118, 277–291. [Google Scholar] [CrossRef]
  5. Bobrowski, A.; Królicka, A.; Zarębski, J. Characteristics of Voltammetric Determination and Speciation of Chromium—A Review. Electroanalysis 2009, 21, 1449–1458. [Google Scholar] [CrossRef]
  6. Gómez, V.; Callao, M.P. Chromium determination and speciation since 2000. TrAC Trends Anal. Chem. 2006, 25, 1006–1015. [Google Scholar] [CrossRef]
  7. Karosi, R.; Andruch, V.; Posta, J.; Balogh, J. Separation of chromium (VI) using complexation and its determination with GFAAS. Microchem. J. 2006, 82, 61–65. [Google Scholar] [CrossRef]
  8. Zhao, W.R.; Kang, T.F.; Lu, L.P.; Shen, F.X.; Cheng, S.Y. A novel electrochemical sensor based on gold nanoparticles and molecularly imprinted polymer with binary functional monomers for sensitive detection of bisphenol A. J. Electroanal. Chem. 2017, 786, 102–111. [Google Scholar] [CrossRef]
  9. Tyszczuk-Rotko, K.; Madejska, K.; Domańska, K. Ultrasensitive hexavalent chromium determination at bismuth film electrode prepared with mediator. Talanta 2018, 182, 62–68. [Google Scholar] [CrossRef]
  10. Ariño, C.; Serrano, N.; Díaz-Cruz, J.M.; Esteban, M. Voltammetric determination of metal ions beyond mercury electrodes. A review. Anal. Chim. Acta 2017, 990, 11–53. [Google Scholar] [CrossRef] [Green Version]
  11. Domínguez, O.; Arcos, M.J. Speciation of Chromium by Adsorptive Stripping Voltammetry Using Pyrocatechol Violet. Electroanalysis 2000, 12, 449–458. [Google Scholar] [CrossRef]
  12. Domínguez, O.; Julia Arcos, M. Simultaneous determination of chromium(VI) and chromium(III) at trace levels by adsorptive stripping voltammetry. Anal. Chim. Acta 2002, 470, 241–252. [Google Scholar] [CrossRef]
  13. Domínguez, O.; Asunción Alonso, M.; Arcos, M.J. Application of an Optimization Procedure in Adsorptive Stripping Voltammetry for the Determination of Chromium with Ammonium Pyrrolidine Dithiocarbamate. Electroanalysis 2002, 14, 1083–1089. [Google Scholar] [CrossRef]
  14. Grabarczyk, M. Speciation Analysis of Chromium by Adsorptive Stripping Voltammetry in Tap and River Water Samples. Electroanalysis 2008, 20, 2217–2222. [Google Scholar] [CrossRef]
  15. Domínguez, O.; Sanllorente, S.; Arcos, M.J. Application of an Optimization Procedure of Adsorptive Stripping Voltammetry for the Determination of Chromium in Wine. Electroanalysis 1999, 11, 1273–1279. [Google Scholar] [CrossRef]
  16. Lin, L.; Lawrence, N.S.; Thongngamdee, S.; Wang, J.; Lin, Y. Catalytic adsorptive stripping determination of trace chromium (VI) at the bismuth film electrode. Talanta 2005, 65, 144–148. [Google Scholar] [CrossRef]
  17. Torrance, K.; Gatford, C. Determination of soluble chromium in simulated PWR coolant by differential-pulse adsorptive stripping voltammetry. Talanta 1987, 34, 939–944. [Google Scholar] [CrossRef]
  18. Boussemart, M.; van den Berg, C.M.G.; Ghaddaf, M. The determination of the chromium speciation in sea water using catalytic cathodic stripping voltammetry. Anal. Chim. Acta 1992, 262, 103–115. [Google Scholar] [CrossRef]
  19. Li, Y.; Xue, H. Determination of Cr(III) and Cr(VI) species in natural waters by catalytic cathodic stripping voltammetry. Anal. Chim. Acta 2001, 448, 121–134. [Google Scholar] [CrossRef]
  20. Sander, S.; Navrátil, T.; Novotný, L. Study of the Complexation, Adsorption and Electrode Reaction Mechanisms of Chromium(VI) and (III) with DTPA Under Adsorptive Stripping Voltammetric Conditions. Electroanalysis 2003, 15, 1513–1521. [Google Scholar] [CrossRef]
  21. Grabarczyk, M.; Kaczmarek, L.; Korolczuk, M. Determination of Cr(VI) in the Presence of Complexing Agents and Humic Substances by Catalytic Stripping Voltammetry. Electroanalysis 2007, 19, 1183–1188. [Google Scholar] [CrossRef]
  22. Bobrowski, A.; Baś, B.; Dominik, J.; Niewiara, E.; Szalińska, E.; Vignati, D.; Zarębski, J. Chromium speciation study in polluted waters using catalytic adsorptive stripping voltammetry and tangential flow filtration. Talanta 2004, 63, 1003–1012. [Google Scholar] [CrossRef]
  23. Dobney, A.M.; Greenway, G.M. On-line determination of chromium by adsorptive cathodic stripping voltammetry. Analyst 1994, 119, 293–297. [Google Scholar] [CrossRef]
  24. Wang, J.; Wang, J.; Lu, J.; Tian, B.; MacDonald, D.; Olsen, K. Flow probe for in situ electrochemical monitoring of trace chromium. Analyst 1999, 124, 349–352. [Google Scholar] [CrossRef]
  25. Yong, L.; Armstrong, K.C.; Dansby-Sparks, R.N.; Carrington, N.A.; Chambers, J.Q.; Xue, Z.-L. Quantitative analysis of trace chromium in blood samples. Combination of the advanced oxidation process with catalytic adsorptive stripping voltammetry. Anal. Chem. 2006, 78, 7582–7587. [Google Scholar] [CrossRef] [Green Version]
  26. Brett, C.M.A.; Filipe, O.M.S.; Susanna Neves, C. Determination of Chromium(VI) by Batch Injection Analysis and Adsorptive Stripping Voltammetry. Anal. Lett. 2003, 36, 955–969. [Google Scholar] [CrossRef]
  27. Chatzitheodorou, E.; Economou, A.; Voulgaropoulos, A. Trace Determination of Chromium by Square-Wave Adsorptive Stripping Voltammetry on Bismuth Film Electrodes. Electroanalysis 2004, 16, 1745–1754. [Google Scholar] [CrossRef]
  28. Gao, Z.; Siow, K.S. Catalytic-adsorptive stripping voltammetric determination of chromium in environmental materials. Electroanalysis 1996, 8, 602–606. [Google Scholar] [CrossRef]
  29. Vukomanovic, D.V.; Vanloon, G.W.; Nakatsu, K.; Zoutman, D.E. Determination of Chromium (VI) and (III) by Adsorptive Stripping Voltammetry with Pyrocatechol Violet. Microchem. J. 1997, 57, 86–95. [Google Scholar] [CrossRef]
  30. Minamata Convention on Mercury. Available online: http://www.mercuryconvention.org/ (accessed on 8 March 2021).
  31. Jovanovski, V.; Hočevar, S.B.; Ogorevc, B. Bismuth electrodes in contemporary electroanalysis. Curr. Opin. Electrochem. 2017, 3, 114–122. [Google Scholar] [CrossRef]
  32. Švancara, I.; Prior, C.; Hočevar, S.B.; Wang, J. A Decade with Bismuth-Based Electrodes in Electroanalysis. Electroanalysis 2010, 22, 1405–1420. [Google Scholar] [CrossRef]
  33. Wang, J. Stripping Analysis at Bismuth Electrodes: A Review. Electroanalysis 2005, 17, 1341–1346. [Google Scholar] [CrossRef]
  34. Jovanovski, V.; Hrastnik, N.I.; Hočevar, S.B. Copper film electrode for anodic stripping voltammetric determination of trace mercury and lead. Electrochem. Commun. 2015, 57, 1–4. [Google Scholar] [CrossRef]
  35. Bobrowski, A.; Putek, M.; Zarębski, J. Antimony Film Electrode Prepared In Situ in Hydrogen Potassium Tartrate in Anodic Stripping Voltammetric Trace Detection of Cd(II), Pb(II), Zn(II), Tl(I), In(III) and Cu(II). Electroanalysis 2012, 24, 1071–1078. [Google Scholar] [CrossRef]
  36. Bobrowski, A.; Maczuga, M.; Królicka, A.; Konstanteli, E.; Sakellaropoulou, C.; Economou, A. Determination of Copper(II) Through Anodic Stripping Voltammetry in Tartrate Buffer Using an Antimony Film Screen-printed Carbon Electrode. Anal. Lett. 2017, 50, 2920–2936. [Google Scholar] [CrossRef]
  37. Maczuga, M.; Economou, A.; Bobrowski, A.; Prodromidis, M.I. Novel screen-printed antimony and tin voltammetric sensors for anodic stripping detection of Pb(II) and Cd(II). Electrochim. Acta 2013, 114, 758–765. [Google Scholar] [CrossRef]
  38. Zhu, W.W.; Li, N.B.; Luo, H.Q. Simultaneous determination of chromium(III) and cadmium(II) by differential pulse anodic stripping voltammetry on a stannum film electrode. Talanta 2007, 72, 1733–1737. [Google Scholar] [CrossRef] [PubMed]
  39. Li, B.L.; Wu, Z.L.; Xiong, C.H.; Luo, H.Q.; Li, N.B. Anodic stripping voltammetric measurement of trace cadmium at tin-coated carbon paste electrode. Talanta 2012, 88, 707–710. [Google Scholar] [CrossRef]
  40. Xu, S.; Wang, X.; Zhou, C. A micro electrochemical sensor based on bismuth-modified mesoporous carbon for hexavalent chromium detection. In Proceedings of the 2015 IEEE Sensors, Busan, Korea, 1–4 November 2015; pp. 1–4. [Google Scholar]
  41. Li, M.; He, R.; Wang, S.; Feng, C.; Wu, H.; Mei, H. Visible light driven photoelectrochemical sensor for chromium(VI) by using BiOI microspheres decorated with metallic bismuth. Microchim. Acta 2019, 186, 345. [Google Scholar] [CrossRef] [PubMed]
  42. Santhosh, C.; Saranya, M.; Ramachandran, R.; Felix, S.; Velmurugan, V.; Nirmala Grace, A. Graphene/Gold Nanocomposites-Based Thin Films as an Enhanced Sensing Platform for Voltammetric Detection of Cr(VI) Ions. J. Nanotechnol. 2014, 2014, 304526. [Google Scholar] [CrossRef] [Green Version]
  43. Sari, T.K.; Takahashi, F.; Jin, J.; Zein, R.; Munaf, E. Electrochemical Determination of Chromium(VI) in River Water with Gold Nanoparticles—Graphene Nanocomposites Modified Electrodes. Anal. Sci. 2018, 34, 155–160. [Google Scholar] [CrossRef] [Green Version]
  44. Ouyang, R.; Zhang, W.; Zhou, S.; Xue, Z.-L.; Xu, L.; Gu, Y.; Miao, Y. Improved Bi film wrapped single walled carbon nanotubes for ultrasensitive electrochemical detection of trace Cr(VI). Electrochim. Acta 2013, 113, 686–693. [Google Scholar] [CrossRef] [PubMed] [Green Version]
  45. Salimi, A.; Pourbahram, B.; Mansouri-Majd, S.; Hallaj, R. Manganese oxide nanoflakes/multi-walled carbon nanotubes/chitosan nanocomposite modified glassy carbon electrode as a novel electrochemical sensor for chromium (III) detection. Electrochim. Acta 2015, 156, 207–215. [Google Scholar] [CrossRef]
  46. Rosolina, S.M.; Bragg, S.A.; Ouyang, R.; Chambers, J.Q.; Xue, Z.-L. Highly sensitive detection of hexavalent chromium utilizing a sol-gel/carbon nanotube modified electrode. J. Electroanal. Chem. 2016, 781, 120–125. [Google Scholar] [CrossRef] [PubMed] [Green Version]
  47. Ouyang, R.; Bragg, S.A.; Chambers, J.Q.; Xue, Z.-L. Flower-like self-assembly of gold nanoparticles for highly sensitive electrochemical detection of chromium(VI). Anal. Chim. Acta 2012, 722, 1–7. [Google Scholar] [CrossRef] [Green Version]
  48. Tu, J.; Gan, Y.; Liang, T.; Wan, H.; Wang, P. A miniaturized electrochemical system for high sensitive determination of chromium(VI) by screen-printed carbon electrode with gold nanoparticles modification. Sens. Actuators B Chem. 2018, 272, 582–588. [Google Scholar] [CrossRef]
  49. Sari, T.K.; Jin, J.; Zein, R.; Munaf, E. Anodic Stripping Voltammetry for the Determination of Trace Cr(VI) with Graphite/Styrene-Acrylonitrile Copolymer Composite Electrodes. Anal. Sci. 2017, 33, 801–806. [Google Scholar] [CrossRef] [Green Version]
  50. Plohl, O.; Simonič, M.; Kolar, K.; Gyergyek, S.; Fras Zemljič, L. Magnetic nanostructures functionalized with a derived lysine coating applied to simultaneously remove heavy metal pollutants from environmental systems. Sci. Technol. Adv. Mater. 2021, 22, 55–71. [Google Scholar] [CrossRef]
  51. Hilali, N.; Mohammadi, H.; Amine, A.; Zine, N.; Errachid, A. Recent Advances in Electrochemical Monitoring of Chromium. Sensors 2020, 20, 5153. [Google Scholar] [CrossRef]
  52. Zhang, Y.; Chen, P.; Wen, F.; Yuan, B.; Wang, H. Fe3O4 nanospheres on MoS2 nanoflake: Electrocatalysis and detection of Cr(VI) and nitrite. J. Electroanal. Chem. 2016, 761, 14–20. [Google Scholar] [CrossRef]
  53. Sanchayanukun, P.; Muncharoen, S. Chitosan coated magnetite nanoparticle as a working electrode for determination of Cr(VI) using square wave adsorptive cathodic stripping voltammetry. Talanta 2020, 217, 121027. [Google Scholar] [CrossRef]
  54. Fu, L.; Liu, Z.; Ge, J.; Guo, M.; Zhang, H.; Chen, F.; Su, W.; Yu, A. (001) plan manipulation of α-Fe2O3 nanostructures for enhanced electrochemical Cr(VI) sensing. J. Electroanal. Chem. 2019, 841, 142–147. [Google Scholar] [CrossRef]
  55. Massart, D.L.; Vandeginste, B.G.M.; Buydens, L.M.; Jong, S.D.; Lewi, P.J.; Smeyers-Verbeke, J. Handbook of Chemometrics and Qualimetrics: Part A; Elsevier: Amsterdam, The Netherlands, 1997. [Google Scholar]
  56. Jorge, E.O.; Rocha, M.M.; Fonseca, I.T.E.; Neto, M.M.M. Studies on the stripping voltammetric determination and speciation of chromium at a rotating-disc bismuth film electrode. Talanta 2010, 81, 556–564. [Google Scholar] [CrossRef] [PubMed]
  57. Guideline, I.H.T. Validation of Analytical Procedures. Available online: https://onlinelibrary.wiley.com/doi/10.1002/9781118971147.ch5 (accessed on 22 July 2021).
  58. Van Loco, J.; Elskens, M.; Croux, C.; Beernaert, H. Linearity of calibration curves: Use and misuse of the correlation coefficient. Accredit. Qual. Assur. 2002, 7, 281–285. [Google Scholar] [CrossRef]
  59. Rojas-Romo, C.; Aliaga, M.E.; Arancibia, V. Determination of molybdenum(VI) via adsorptive stripping voltammetry using an ex‒situ bismuth screen‒printed carbon electrode. Microchem. J. 2020, 154, 104589. [Google Scholar] [CrossRef]
  60. Pérez-Ràfols, C.; Serrano, N.; Díaz-Cruz, J.M.; Ariño, C.; Esteban, M. New approaches to antimony film screen-printed electrodes using carbon-based nanomaterials substrates. Anal. Chim. Acta 2016, 916, 17–23. [Google Scholar] [CrossRef] [Green Version]
  61. Gajdár, J.; Barek, J.; Fischer, J. Antimony film electrodes for voltammetric determination of pesticide trifluralin. J. Electroanal. Chem. 2016, 778, 1–6. [Google Scholar] [CrossRef]
  62. Laboratory and Scientific Section United Nations Office on Drugs and Crime, V. Guidance for the Validation of Analytical Methodology and Calibration of Equipment Used for Testing of Illicit Drugs in Seized Materials and Biological Specimens, A Commitment to Quality nd Continuous Improvement; United Nations: New York, NY, USA, 2009. [Google Scholar]
  63. Cornell, R.M.; Schwertmann, U. The Iron Oxides: Structure, Reactions, Occurrences and Uses, 2nd ed.; WILEY-VCH: Weinheim, Germany, 2003. [Google Scholar] [CrossRef]
  64. Quy, D.V.; Hieu, N.M.; Tra, P.T.; Nam, N.H.; Hai, N.H.; Thai Son, N.; Nghia, P.T.; Anh, N.T.V.; Hong, T.T.; Luong, N.H. Synthesis of Silica-Coated Magnetic Nanoparticles and Application in the Detection of Pathogenic Viruses. J. Nanomater. 2013, 2013, 603940. [Google Scholar] [CrossRef] [Green Version]
  65. Larkin, P. IR and Raman Spectroscopy-Principles and Spectral Interpretation; Elsevier: Oxford, UK, 2011. [Google Scholar] [CrossRef]
  66. Kitadai, N.; Yokoyama, T.; Nakashima, S. ATR-IR spectroscopic study of L-lysine adsorption on amorphous silica. J. Colloid Interface Sci. 2009, 329, 31–37. [Google Scholar] [CrossRef]
  67. Saturno, J.; Valera, D.; Carrero, H.; Fernández, L. Electroanalytical detection of Pb, Cd and traces of Cr at micro/nano-structured bismuth film electrodes. Sens. Actuators B Chem. 2011, 159, 92–96. [Google Scholar] [CrossRef]
Figure 1. Schematic representation of the electrode modifications.
Chemosensors 09 00189 g001
Figure 2. (a) Cathodic SW voltammograms measured with ex-situ BiFE in 0.1 M acetate buffer containing 99.0–909.1 µg/L Cr(VI) (measurement of the blank is shown with dashed line) and (b) the corresponding linear calibration curve (γ represents the mass concentration in µg/L and error bars denote standard deviation of replicate measurements).
Chemosensors 09 00189 g002
Figure 3. XRD diffractogram for MNPs@SiO2@Lys.
Chemosensors 09 00189 g003
Figure 4. (a) FE-SEM image and (b) TEM image at lower and higher magnification (shown in the inset) for MNPs@SiO2@Lys. The black arrows in the inset of (b) denote the silica coating.
Chemosensors 09 00189 g004
Figure 5. (a) The ATR-FTIR spectrum and (b) XPS survey spectrum of MNPs@SiO2@Lys.
Chemosensors 09 00189 g005
Figure 6. The shape of a drop of ultrapure water on the surface of different electrodes and the corresponding contact angles.
Chemosensors 09 00189 g006
Figure 7. (a) SWAdSV measurements with increasing Cr(VI) concentration using BiFE/MNPs@SiO2@Lys (measurement of the blank is shown with the dashed line) and (b) the corresponding linear calibration curve (error bars represent standard deviation of replicate measurements). The measurements were performed in 0.1 M acetate buffer containing 0.2 M KCl and 5mM DTPA. The accumulation step, in which the Cr(III)-H2DTPA reduction product is formed and adsorbed, was performed at Eacc = −0.40 V and tacc = 60 s.
Chemosensors 09 00189 g007
Figure 8. (a) SWAdSV measurements using BiFE/MNPs@SiO2@Lys for a real sample analysis (tap water spiked with 0.5 µg/L Cr(VI)) and (b) using the multiple standard addition methodology (3 replicate measurements). The same conditions as in Figure 7 were used.
Chemosensors 09 00189 g008
Table 1. A comparison of results obtained for the determination of Cr(VI) by various electrodes (the RSD and average recovery values were obtained at the concentration reported in brackets for the average recovery).
Electrode DesignationLOD
[µg/L],
S/N ≥ 3
LOQ
[µg/L],
S/N ≥ 10
Linear Concentration Range
[µg/L]
Slope of the Calibration Curve
[µA/(µg/L)]
RSD
(%)
(n = 6) **
Average Recovery
(%)
(n = 6) **
SWV techniques
bare GCE39.879.479.4–548.2–0.000920.195.0 (at 200.0 µg/L)
ex situ SbFE99.0138.1138.1–825.7–0.000612.9113.1 (at LOQ)
ex situ CuFE99.0138.1138.1–825.7–0.00050.8118.6 (at LOQ)
ex situ BiFE59.699.099.0–909.1–0.000717.7102.1 (at LOQ)
GCE/MNPs@SiO2@Lys39.859.659.6–384.6–0.000715.3103.3 (at LOQ)
SWAdSV techniques (see Section 3.4)
BiFE *0.10.2–0.5–37.5727.165.5 (at 0.5 µg/L)
BiFE/MNPs@SiO2@Lys *0.10.2–2.0–23.0769.098.5 (at 0.5 µg/L)
* The LOD value could not be determined because when a distinguishable current peak was formed (from the baseline), the S/N value exceeded a value of 10, which already represents the LOQ. ** n stands for the number of repeated measurements.
Table 2. A summary of the SWAdSV technique using BiFE/MNPs@SiO2@Lys with previously reported electroanalytical techniques using DTPA as a complexing agent (Bi/SWNTs/GCE stands for the Bi-film wrapped single-walled carbon nanotubes-modified GCE).
Electrode UsedLinear Concentration Range
[µg/L]
Applied for Real Sample AnalysisReferences
BiFE0.3–2.6River water[16]
Rotating-disc BiFE 0.1–0.5River water[56]
Micro/nanoparticle BiFE0.1–0.5/[67]
ex situ BiFE 0.1–0.5/[67]
Bi/SWNTs/GCE0–1.3
(reported
LOD = 0.036 nM)
River water[44]
BiFE/MNPs@SiO2@Lys0.2–2.0Tap waterherein
Publisher’s Note: MDPI stays neutral with regard to jurisdictional claims in published maps and institutional affiliations.

