Article

Carboxylated Graphene Nanoribbons for Highly-Selective Ammonia Gas Sensors: Ab Initio Study

by
Pavel V. Barkov
1 and
Olga E. Glukhova
2,*
1
Institute of Physics, Saratov State University, 410012 Saratov, Russia
2
Institute for Bionic Technologies and Engineering, I.M. Sechenov First Moscow State Medical University (Sechenov University), 119991 Moscow, Russia
*
Author to whom correspondence should be addressed.
Chemosensors 2021, 9(4), 84; https://doi.org/10.3390/chemosensors9040084
Submission received: 15 March 2021 / Revised: 12 April 2021 / Accepted: 16 April 2021 / Published: 18 April 2021
(This article belongs to the Special Issue Gustatory and Olfactory Sensing Technologies and Applications)

Abstract

:
The character and degree of influence of carboxylic acid groups (COOH) on the sensory properties (particularly on the chemoresistive response) of a gas sensor based on zigzag and armchair graphene nanoribbons are shown. Using density functional theory (DFT) calculations, it is found that it is more promising to use a carboxylated zigzag nanoribbon as a sensor element. The chemoresistive response of these nanoribbons is higher than uncarboxylated and carboxylated nanoribbons. It is also revealed that the wet nanoribbon reacts more noticeably to the adsorption of ammonia. In this case, carboxyl groups primarily attract water molecules, which are energetically favorable to land precisely on these regions and then on the nanoribbon’s basal surface. Moreover, the COOH groups with water are adsorption centers for ammonia molecules. That is, the carboxylated zigzag nanoribbon can be the most promising.

1. Introduction

Currently, graphene-based materials are widely used to create sensitive elements of various sensors [1,2,3,4,5,6]. Many theoretical studies are devoted to the adsorption of various molecules on pure graphene [7,8,9]. The emergence of new technologies facilitates the intensive development of sensorics on graphene for modifying graphene structures by various groups, such as carbonyl and carboxyl [10,11,12,13]. The edges of graphene layers, nanoflakes, ribbons, holes in graphene monolayers are modified. Indeed, the presence of extended open edges in graphene structures opens up great prospects for their enrichment with various functional groups that enhance graphene properties. Further, functional groups act as active elements of graphene, which are capable of adsorbing various molecules, and, in turn, can be additionally functionalized. The graphene nanoflakes decorated with mainly COOH groups show excellent dispersion properties. Herewith, the COOH groups can be easily functionalized using carboxylate chemistry [14]. Functionalized graphene was the basis to detect a wide range of chemical and biochemical species, such as H2O2 [15], dopamine [16], ascorbic acid [17], glucose [18], DNA [19] or antigens [20]. It has been theoretically proved that the reactions of the formation of complexes of graphene with hydroxyl and carboxyl groups are thermodynamically favorable in solutions [21]. R. Ziółkowski et al. demonstrated the outstanding selectivity of a sensor for the electrochemical detection of uranyl ions using carboxyl-modified graphene (GCOOH) as the sensing element [22]. Moreover, GCOOH can be considered as promising electrode material for sensor, e.g., with the additional use of nucleic acids as the receptor layer [23,24]. Technologies for obtaining functionalized graphene structures continue to improve. For example, it has been shown that the graphene oxide films with the restored conjugated network and many edges terminated with carboxyl groups can be obtained using the photoreduction process in the argon atmosphere. Carboxylated graphene films can be used in several applications, such as the production of gas sensors and organic light-emitting devices [25]. An approach such as the modification of edges with functional groups, allows one to control the electronic and electrophysical properties of graphene. In particular, the bandgap can be controlled by the number of epoxides [26]; the electrochemical properties of graphene can be controlled by the number of hydroxyls [27,28].
Regardless of the material used as a sensitive element of sensors, DFT methods are actively used to clarify the physicochemical phenomena that form the chemoresistive response. In [29], the high sensitivity of the surface of a two-dimensional (2D) metal–organic frameworks (MOF) material to CO2 molecules was explained by the formation of adsorption centers and redistribution of the surface charge using an ab initio method, which provided high-precision calculations of energy and density of electronic states (DOS). The chemoresistive response was not calculated, but the theoretical contribution to the study was important and effective. In addition, an electron transfer scheme at the interface between silver grains and the surface of a sensor based on SnO2 was discovered using the DFT method, which made it possible to reveal the large role of surface modification [30]. In [31], the sensory response of MPcFx films (M = Cu, Co, Zn; x = 0, 4, 16) to gaseous NH₃ (10–50 ppm) was investigated by the chemoresistive method. Using the DFT method, from the standpoint of the energy approach, it was explained why the sensory response of MPcF₄ films to ammonia is noticeably higher than that of MPc films. The use of various approximations of the DFT method has shown that they can successfully solve similar problems and answer questions from sensor developers [32,33,34]. In particular, a numerical experiment using DFT methods makes it possible to determine the activation barrier, the change in free energy and the position of the Fermi level when gas molecules land on the sensor surface, and to predict the effect of moisture and other types of surface modification. DFT methods in various approximations in combination with the apparatus of non-equilibrium green’s functions (NEGFs) are actively used in predictive modeling of sensory properties based on the analysis of the dynamics of charge transfer between the surface of a sensitive element and analyte. Despite the high requirements for computing resources in such problems, this physical and mathematical apparatus is successfully used in the search for physically correct solutions to the problem of increasing the efficiency of the sensitive element of a gas sensor based on metal oxides [35]. The standard approach in all such works is the analysis of the energy profile of the interaction of the adsorbed object with the working surface of the sensor, as well as the calculation of the map of the adsorbing centers of the surface based on the calculation of the distribution of the electron charge density. However, the calculation of the chemoresistive response S based on a numerical experiment was not carried out in any such work. The pioneering work in the field of calculating the chemoresistive response S of a gas sensor is a work [36] carried out with the participation of one of the team members of this paper. The chemoresistive response mechanism for a gas sensor based on Co3O4 oxide was investigated in [36].
This paper is devoted to a quantum mechanical study of the effect of functionalization of edge atoms of zigzag/armchair graphene nanoribbons by COOH groups on their electronic properties and chemoresistive response.

2. Materials and Methods

The search for equilibrium atomic configurations of supercells of carboxylated graphene nanoribbons was carried out using the DFT method implemented in the SIESTA software package [37,38]. The DZP (double-ζ-polarized) basis was used. This basis set includes polarization functions. The finite mesh in coordinate space is used in SIESTA to calculate integrals and represent charge densities and potentials. The speed and accuracy of calculations are determined by the value of plane-wave cutoff (Mesh Cutoff), which is set externally. The tradeoff between speed and accuracy is 350 Ry, which is used for most systems with no more than a thousand atoms. To relax the structure’s geometry, we used a 24 × 1 × 1 Monkhorst–Pack k-mesh [39]. The convergence conditions of the geometry optimization were set at an atomic force smaller than 10−3 eV/Å. To perform the crystal lattice’s geometric optimization and its tetragonal distortion, the “smearing” and “tetrahedra” modes were used, respectively. To consider the electron–ion interaction, the projection augmented wave (PAW) method was used. The exchange-correlation interaction was described in the generalized gradient approximation (GGA) in the Perdew–Burke–Ernzerhof (PBE) parameterization [40].
To study the interaction of a surface with an analyte, the van der Waals density functional approximation (vdW-DF) with the exchange-correlation functional by K. Berland and P. Hyldgaard (BH) was used [41]. This exchange-correlation functional is the newest in the series of functionals of the van der Waals density functional method vdW-DF and is reliably used both for calculating the topology of the structure and for calculating the quantum transport of electrons [42,43].
To calculate the chemoresistive response, the electrical resistances were calculated before and after the landing of the analyte. For this, we used TranSIESTA—a method for calculating the electronic structure formed by a finite subsystem sandwiched between two endless conducting contacts. The TranSIESTA method is closely related to the SIESTA code since the TranSIESTA calculations involve the calculation of the electron density from the DFT Hamiltonian using the NEGFs method instead of the usual diagonalization procedure. The calculation of transport properties includes the calculation of electrodes and scattering regions for the object under the study/electrodes system. Calculation of the scattering region by TranSIESTA begins with the usual SIESTA procedure, which generates a density matrix using the Kohn–Sham scheme for periodic systems. This solution is used as the initial one for the self-consistent cycle of the NEGF method. The result of calculating by TranSIESTA, as well as calculating by SIESTA, is an equilibrium density matrix. To calculate the transport properties, a transmission function is required. This function can be calculated using the scattering matrix formalism and obtained from the green’s function using the generalized Fisher–Lee relation or the Lippmann–Schwinger equation. Within the SIESTA code, the transmission function is calculated in the TBtrans program included in the software package.

3. Results

3.1. Atomic Models of Carboxylated Graphene Nanoribbons (GRNR–COOH)

As is known, all zigzag GRNR (ZGRNR) exhibit metallic conductivity properties. Due to edge localized states, these nanoribbons are distinguished by the presence of a high-intensity peak of the DOS at the Fermi level. Since we use the DFT approach, the supercells of nanoribbons were selected within a few hundred atoms to be able to apply the complete DZP basis set in calculations of energy and atomic structure.
First of all, we considered such supercells as the supercells of the 16ZGRNR–2COOH nanoribbon containing 16 carbon atoms and two COOH groups attached to nanoribbon edge atoms. This nanoribbon has two isomers: cis and trans, as shown in Figure 1a (left figure). Carboxyl groups are highlighted in green in the figure. The optimization of the supercells of these isomers showed that these structures are energetically favorable since the heat of formation ΔHf for them has a negative value. Table 1 shows energy characteristics, such as ΔHf, energy gap Egap, and Fermi level EF. Both cis and trans isomers are practically indistinguishable in all energy parameters. From the standpoint of geometric characteristics, these two isomers differ in the bond length between the COOH group and the edge C-atom of the nanoribbon and the magnitude of the translation vector. As shown in Figure 1, the translation vector is directed along the X-axis.
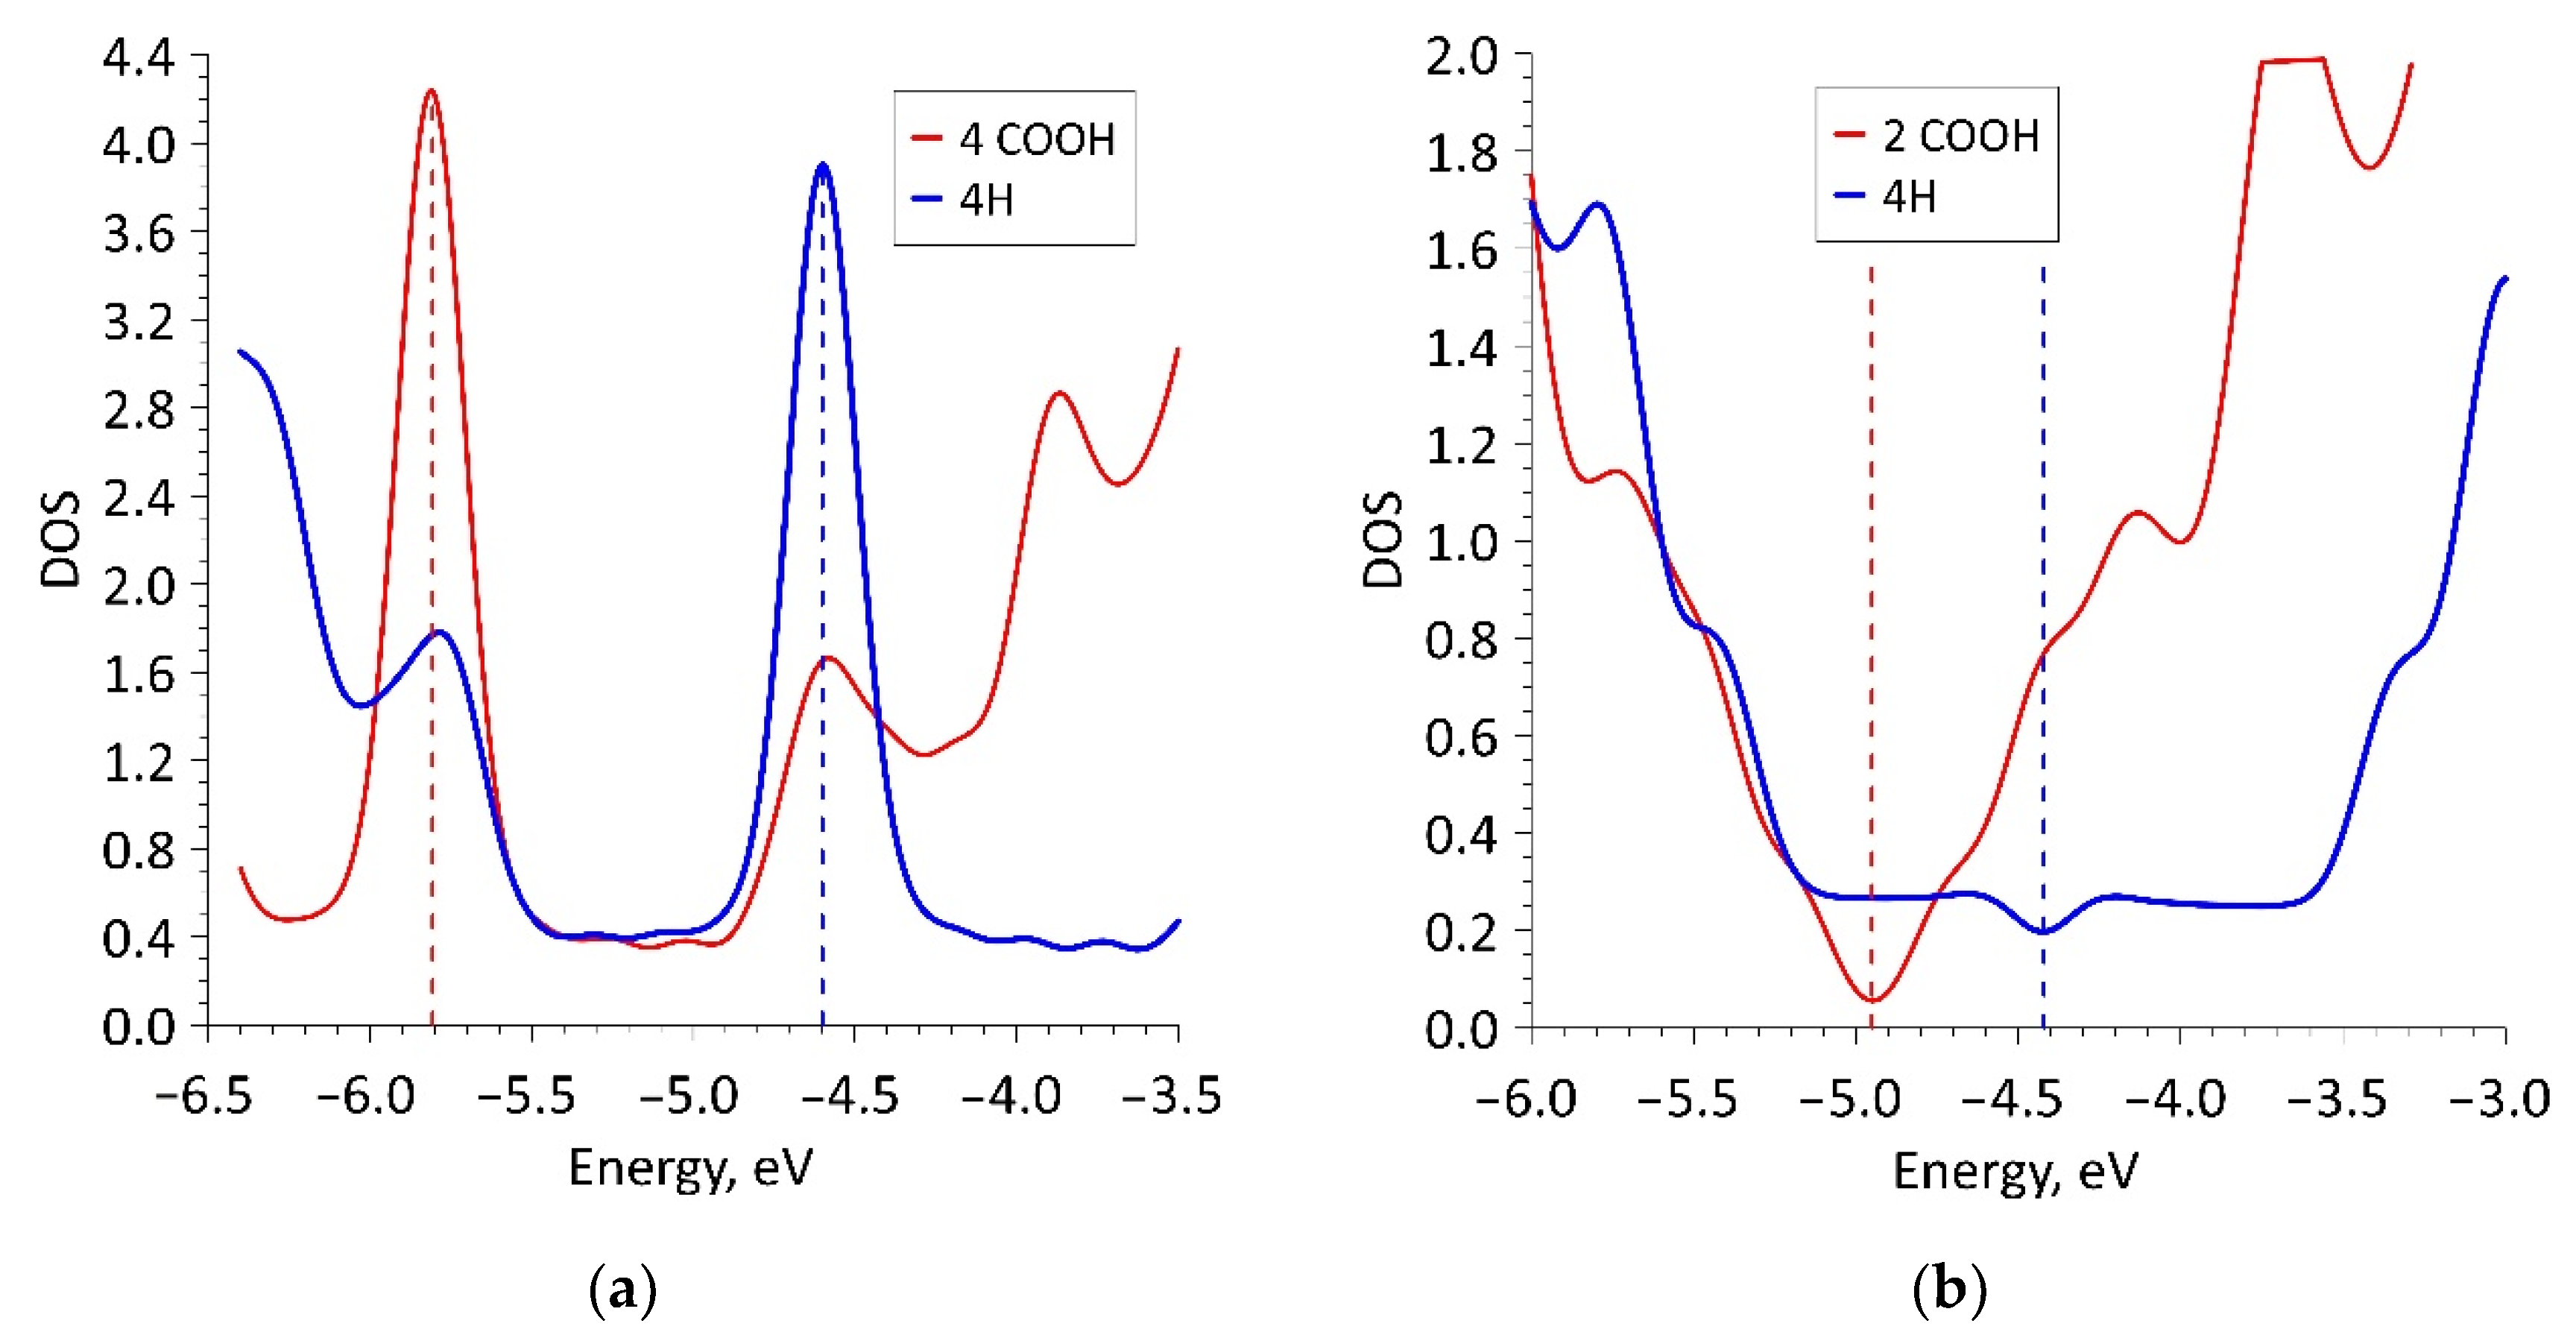
Despite the negative value of ΔHf for 16ZGRNR–2COOH-based nanoribbons, we also investigated other topological variants of supercells, each of which contained not 2 COOH groups but 4 COOH groups. In fact, such a supercell consists of two 16ZGRNR supercells, on the edge atoms, of which there are 2 COOH groups on each side, as shown in Figure 1a (middle figure). The most energetically favorable topological variant is the configuration of the arrangement of COOH groups shown in Figure 1a: two COOH groups located on one diagonal are directed upwards, the other two are directed downwards. This provides an equilibrium state from the standpoint of the heat of formation, which is significantly lower than in the previous variant. The energy and metric parameters of the resulting 32ZGRNR–4COOH new supercell are also presented in Table 1. It is clear from the data in the table that the formation of such carboxylated graphene nanoribbon is energetically more favorable by 194%. This can be explained by the fact that the COOH groups of the 16ZGRNR–2COOH nanoribbon are located too close to each other during supercell translation, which leads to the repulsion of electrons from the near COOH groups. All the main characteristics for the obtained most energetically favorable 32ZGRNR–4COOH nanoribbon are also presented in Table 1. Note that in all the considered cases of the carboxylated zigzag graphene nanoribbons, the COOH groups take up part of the charge. In the case of the 32ZGRNR–4COOH nanoribbon, each COOH group takes the maximum amount of charge equal to -0.1e. This suggests that these nanoribbons will have the maximum chemical activity of carboxyl groups, which plays the most important role in improving sensory properties. Thus, in the case of constructing a carboxylated zigzag nanoribbon based on a supercell of 32 atoms, the density of carboxyl groups per the number of atoms of the original supercell is achieved in a ratio of 1:8. Such a high density of COOH groups makes the zigzag nanoribbon highly functionalized with many adsorption centers. A fragment of this nanoribbon is shown on the right in Figure 1a. The DOS plot of this nanoribbon is shown in Figure 2a, where clear, sharp DOS peaks are seen at the Fermi level for a nanoribbon with passivated edge atoms (4Hblue curve) and functionalized COOH groups (4 COOH—red curve). Moreover, upon functionalization of edge atoms with COOH groups, the DOS peak at the Fermi level increases, which additionally indicates an increase in the chemical activity of carboxylated zigzag graphene nanoribbons than conventional passivated nanoribbons.
Various topological configurations for carboxylated graphene armchair nanoribbons were also considered. Unlike zigzag nanoribbons, armchair nanoribbons are distinguished by the presence of an energy gap in the band structure, the value of which fluctuates depending on the width of the nanoribbon. In this regard, two types of nanoribbons (20AGRNR–2COOH and 42AGRNR–2COOH) were considered in detail. Both nanoribbons have only two COOH groups and differ in the width of the nanoribbon. Table 1 shows the values of the translation vectors (the translation vector is directed along the Y-axis, as shown in Figure 1b) and the bond lengths between the COOH group and the edge C-atom. This table also shows the energy characteristics. The first configuration of the 20AGRNR–2COOH nanoribbon is distinguished by a rather large energy gap Egap, which makes these nanostructures not promising for their use in gas sensors since the electrical resistance for them will reach hundreds of megohms.
Therefore, in spite of the energetically favorable functionalization of the edge atoms of these nanostructures, we considered armchair nanoribbons of larger width, for which the Egap value has a lower value. The functionalization of the edge atoms of these nanoribbons (42AGRNR–2COOH, see Figure 1b) is even more energetically favorable than 20AGRNR–2COOH nanoribbons. The topology of the supercells of both nanoribbons is shown in Figure 1b, which also shows the cis/trans isomers of the nanoribbon of a smaller width, as well as the topology of the energetically favorable 42AGRNR–2COOH nanoribbon. For the 42AGRNR–2COOH nanoribbon, the energetically most favorable supercell configuration is shown when two COOH groups on opposite diagonally edges have an identical arrangement (circled in green). The DOS plots of the original 42AGRNR supercell and 42AGRNR–2COOH supercells are presented in Figure 2b, which shows that the functionalization of the edges shifts the Fermi level as in the case of zigzag nanoribbons. In the case of armchair nanoribbons, functionalization leads to a slight increase in the energy gap. However, the gap is small, so this type of nanoribbons can also be used in sensorics. The amount of charge transferred over to each COOH group is less than that of zigzag nanoribbons, but it is also quite significant and shows the chemical activity of carboxyl groups.

3.2. Sensory Properties

Sensory properties of non-functionalized 32ZGRNR–4H and 42AGRNR–4H nanoribbons and carboxylated 32ZGRNR–4COOH and 42AGRNR–2COOHnanoribbons were studied. Ammonia was used as the analyte. The studies were carried out in the presence of water and without it.

3.2.1. Zigzag Nanoribbon

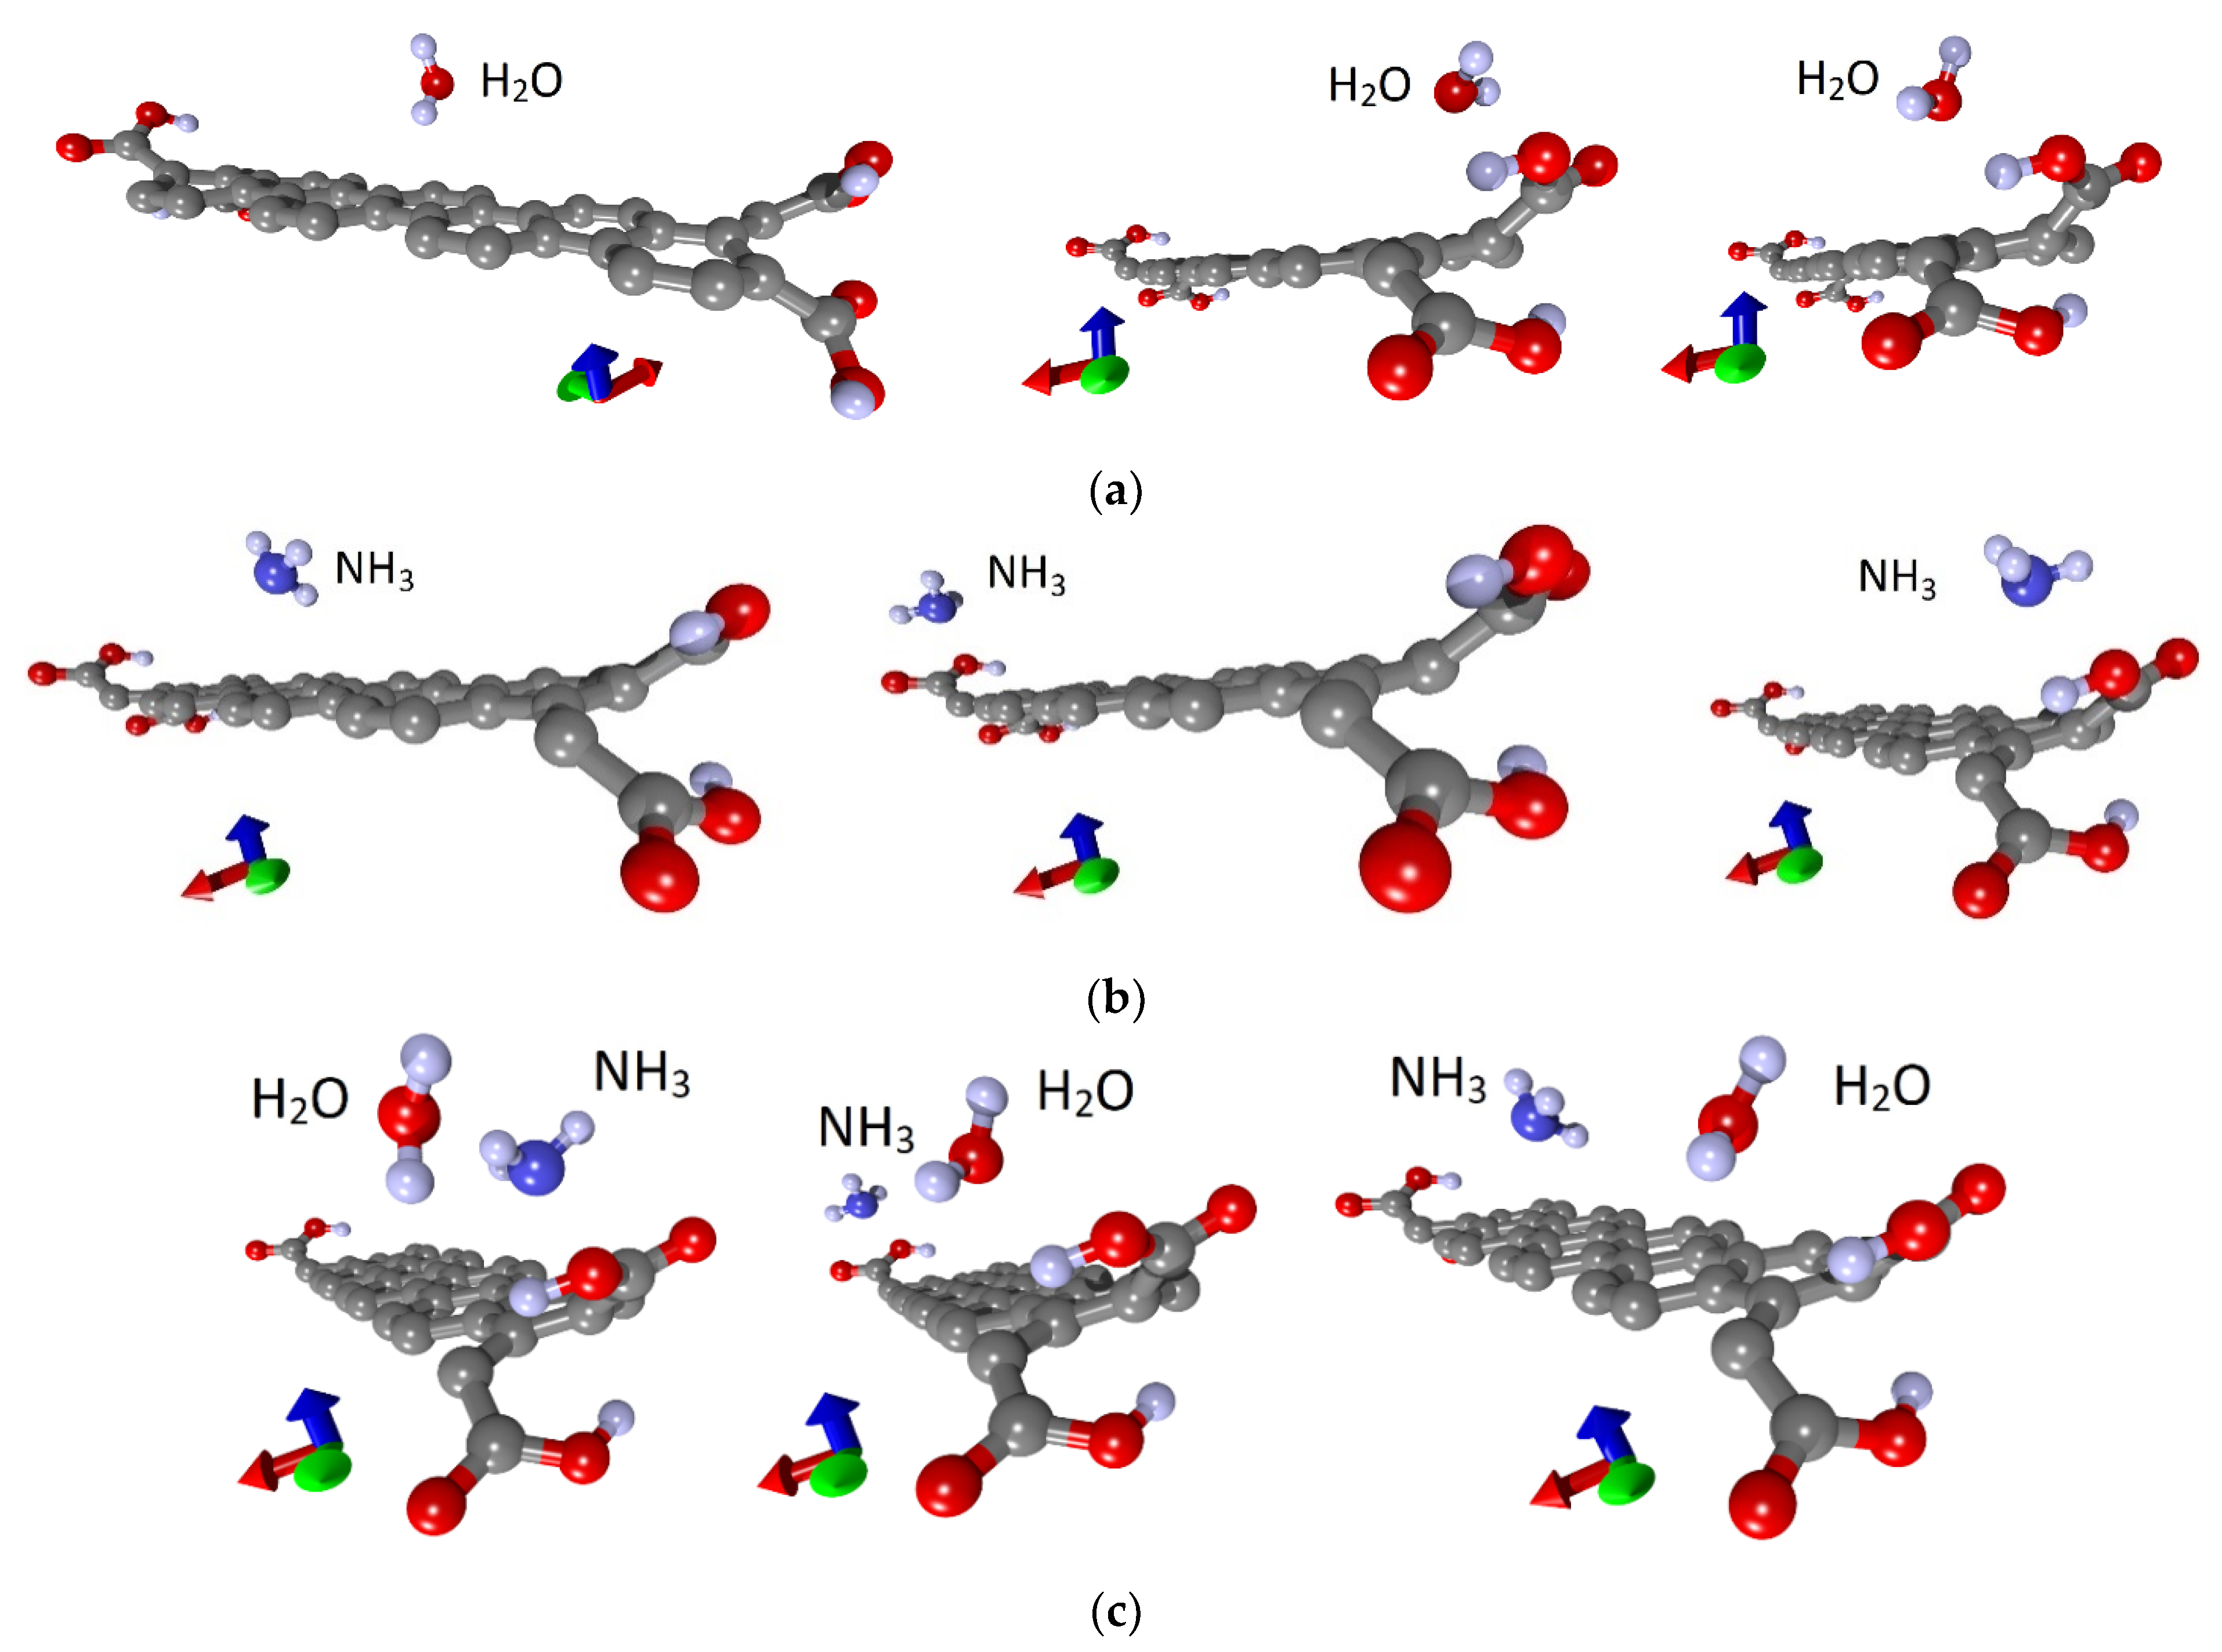
To understand the nature of the nanoribbon interaction with water and analyte, a series of calculations were carried out with various places of water and ammonia landing. Figure 3 shows such different situations with the landing of a water molecule (a), ammonia (b) and the landing of ammonia on a wet surface (c). Three main places of adsorption of single molecules of water and ammonia were selected: in the center and at two opposite ends, that is, on the basal surface and beside the COOH groups, as shown in Figure 3a,b. Similarly, these molecules were adsorbed individually and on a non-functionalized nanoribbon. Optimization of the atomic structure, taking into account the van der Waals interaction of the adsorbate with the nanoribbon, was carried out after each landing of molecules. It was found that the cases of adsorption of both water and ammonia molecules on the edges are energetically favorable. Moreover, in the case of carboxylated graphene nanoribbons, these are not just edges but COOH groups. It should also be noted that there are several energetically favorable landing positions at the edge, differing in energy within 0.01‰. Next, the ammonia molecule was placed on a wet nanoribbon. In addition, different landing sites were chosen, and a series of calculations were carried out. The water molecule was located at the edge of the nanoribbon in one of the energetically favorable positions, and the NH3 molecule was located either next to it, or in the center or at the other edge of the nanoribbon, where there was no water (Figure 3c).In addition, every time, the whole system was re-optimized. Figure 4 shows the cases of adsorption at optimal configurations of a water molecule and an ammonia molecule on a wet nanoribbon for non-functionalized (a) and carboxylated (b) nanoribbons.
Table 2 presents the energy characteristics, including the Fermi level, the adsorption energy and the charge on the nanoribbon. The adsorption energy Eads was calculated as Eads = EFAR − Enear, where EFAR is the energy of a clean nanoribbon + the energy of a molecule at a large distance between them (when they are far from each other), and Enear is the energy of the nanoribbon + molecule system after adsorption. The energy characteristics are given in the table, taking into account all the revealed energetically favorable positioning of water and ammonia molecules concerning the nanoribbon; therefore, these characteristics are given, taking into account the corresponding scatter. First of all, there is a large difference between the Fermi level for a clean ribbon without COOH groups and a clean ribbon with functionalized edges with COOH groups. Upon functionalization of the nanoribbon, the Fermi level shifts sharply downward, which indicates a rearrangement of the entire electronic system. Further, as water and ammonia molecules are adsorbed, the Fermi level shifts upward, that is, to zero. This is observed in both ZGRNR–4H nanoribbons and ZGRNR–2COOH-2H nanoribbons.
The next step was to calculate the chemoresistive response of 32ZGRNR–4H and 32ZGRNR–4COOH nanoribbons to the adsorption of ammonia in cases of dry and wet surfaces. As is known, the chemoresistive response is calculated as the relative value of the change in the electrical resistance of the nanoribbon upon adsorption of the molecular object: S = |ΔR|/R. The performed calculations show the following results: (1) the adsorption of water and ammonia molecules on the 32ZGRNR–4H nanoribbon reduces the resistance; (2) the adsorption on the 32ZGRNR–4COOH nanoribbon leads to a decrease in the resistance in the case of water, and to an increase in the case of ammonia. In this case, the reaction of 32ZGRNR–4H and 32ZGRNR–4COOH wet nanoribbons to ammonia is not the same. The chemoresistive response of the dry nanoribbon to ammonia is small and averages 6.2% and 3.4%, respectively. However, the response of the 32ZGRNR–4COOH wet nanoribbon is very convincing as it exceeds 10%, reaching an average of 15.2%. How can this be explained? To answer this question, let us again turn to the data presented in Table 2. One of the important characteristics of the nanoribbon + adsorbate system is charge transfer. In the case of adsorption of the water molecule on supercells and ammonia molecules, the nanoribbon’s atomic framework received an additional charge, but upon the adsorption of the NH3 molecule on the wet 32ZGRNR–4COOH nanoribbon, the charge transfer changed direction. Now the nanoribbon, on the contrary, gave up part of the charge, so the resistance value increased from 10.573 to 12.105 kOhm. In this case, the chemoresistive response was 15.2%. For clarity, Figure 5 shows the patterns of charge distribution over the 32ZGRNR–4H and 32ZGRNR–4COOH atoms upon the adsorption of an NH3 molecule on a wet nanoribbon. The charges are calculated according to Mulliken population analysis.
As shown in Figure 5, the nanoribbon’s functionalization by COOH groups radically changes the pattern of the distribution of the electron charge density. If a non-functionalized nanoribbon is characterized by a charge transfer from a water molecule and NH3 molecule to the atomic framework of a nanoribbon, then for a functionalized nanoribbon, the opposite is true. The charge from the nanoribbon framework and the water molecule flows to the ammonia molecule, which explains the increase in the resistance of this ribbon to the wet nanoribbon. In general, it should be noted that functionalization of the zigzag nanoribbon by COOH groups played a positive role in improving sensory properties. As compared to the non-functionalized nanoribbon, the chemoresistive response S increased almost twofold. As a visualization of the characteristic differences between the functionalized nanoribbon and the non-functionalized one, Figure 6 shows diagrams of the dynamics of the Fermi level and resistance in the process of adsorption of ammonia, water, and ammonia molecules on a wet surface. The presented diagrams very well demonstrate the role of COOH groups since the nanoribbon reacts more noticeably to ammonia precisely in the presence of carboxyl groups. This is especially noticeable for wet nanoribbons. It is clearly seen how strongly the resistance jumped when landing on a wet nanoribbon of an ammonia molecule. This is a very important result since there are practically no clean surfaces without water.

3.2.2. Armchair Nanoribbon

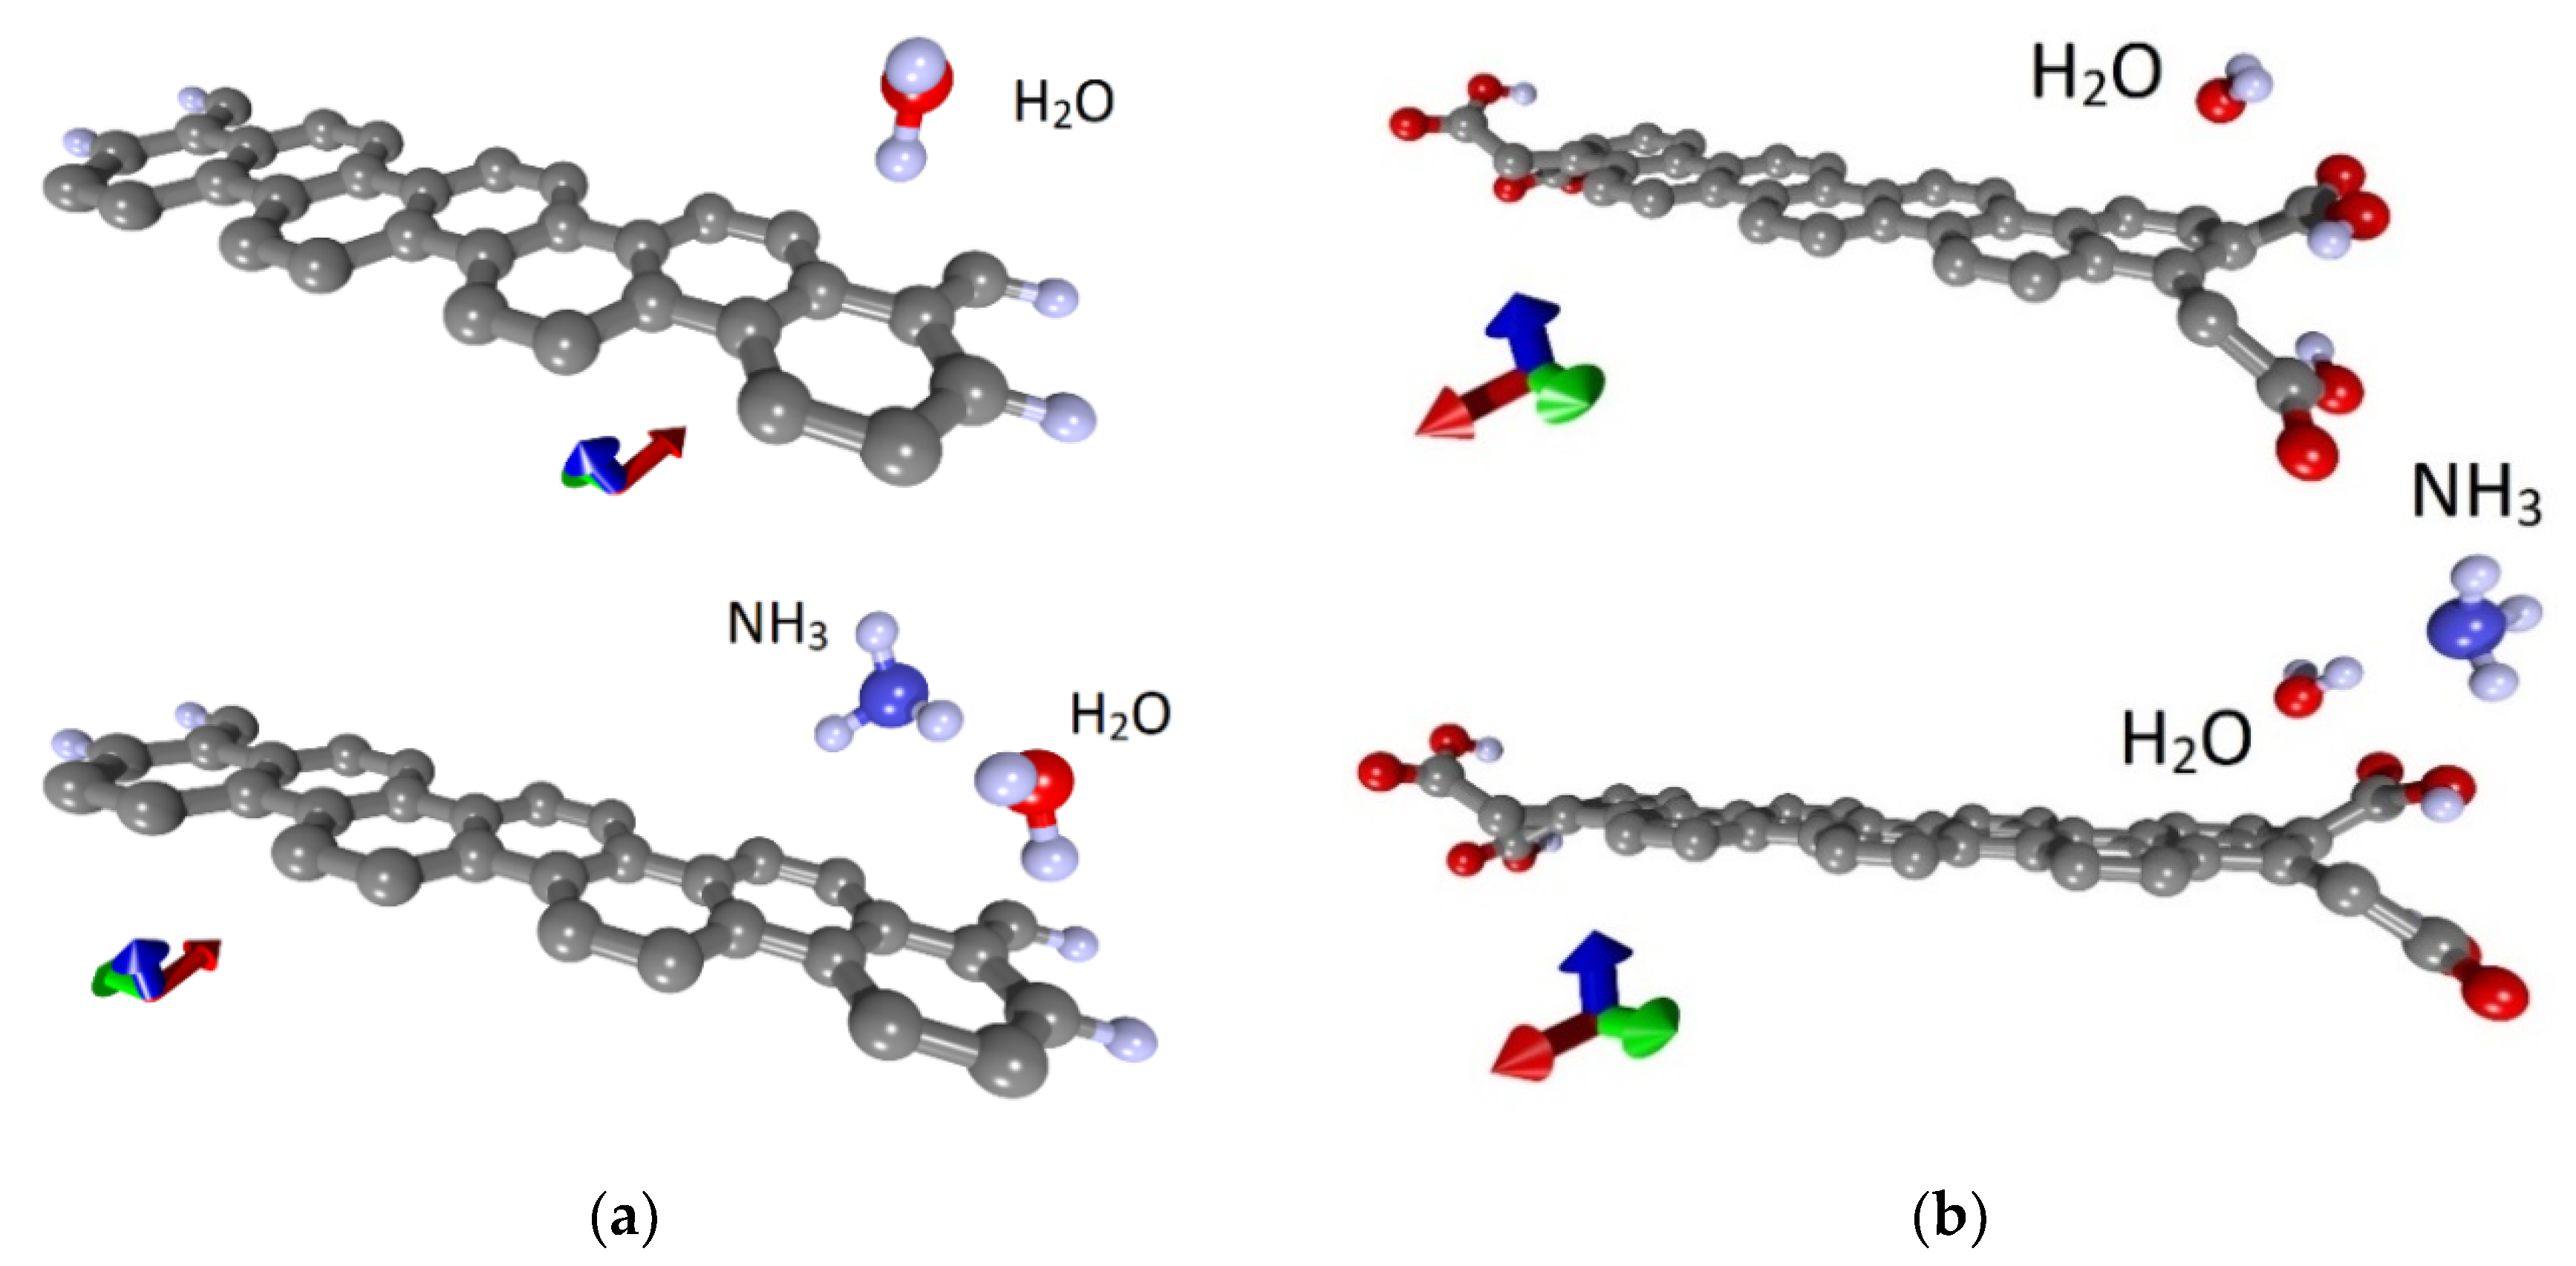
Similar studies were carried out for the armchair nanoribbon. As in the case of the zigzag nanoribbon, 42AGRNR–4H nanoribbon with passivated edges and 42AGRNR–2COOH nanoribbon carboxylated edges were considered. Figure 7a,b show fragments of these nanoribbons and their supercells, which are highlighted in blue. The landing of ammonia and water molecules was also carried out in various ways, including the nanoribbon’s edges and its middle part. As a result of a series of calculations, the most energetically favorable landing regions were identified; they are shown in Figure 7c,d. Energy characteristics, charge transfer, resistance and chemoresistive response are presented in Table 3. Due to the small gap in these nanoribbons’ band structure, the resistance is noticeably higher than zigzag nanoribbons. There is a chemoresistive response but within a few percent.
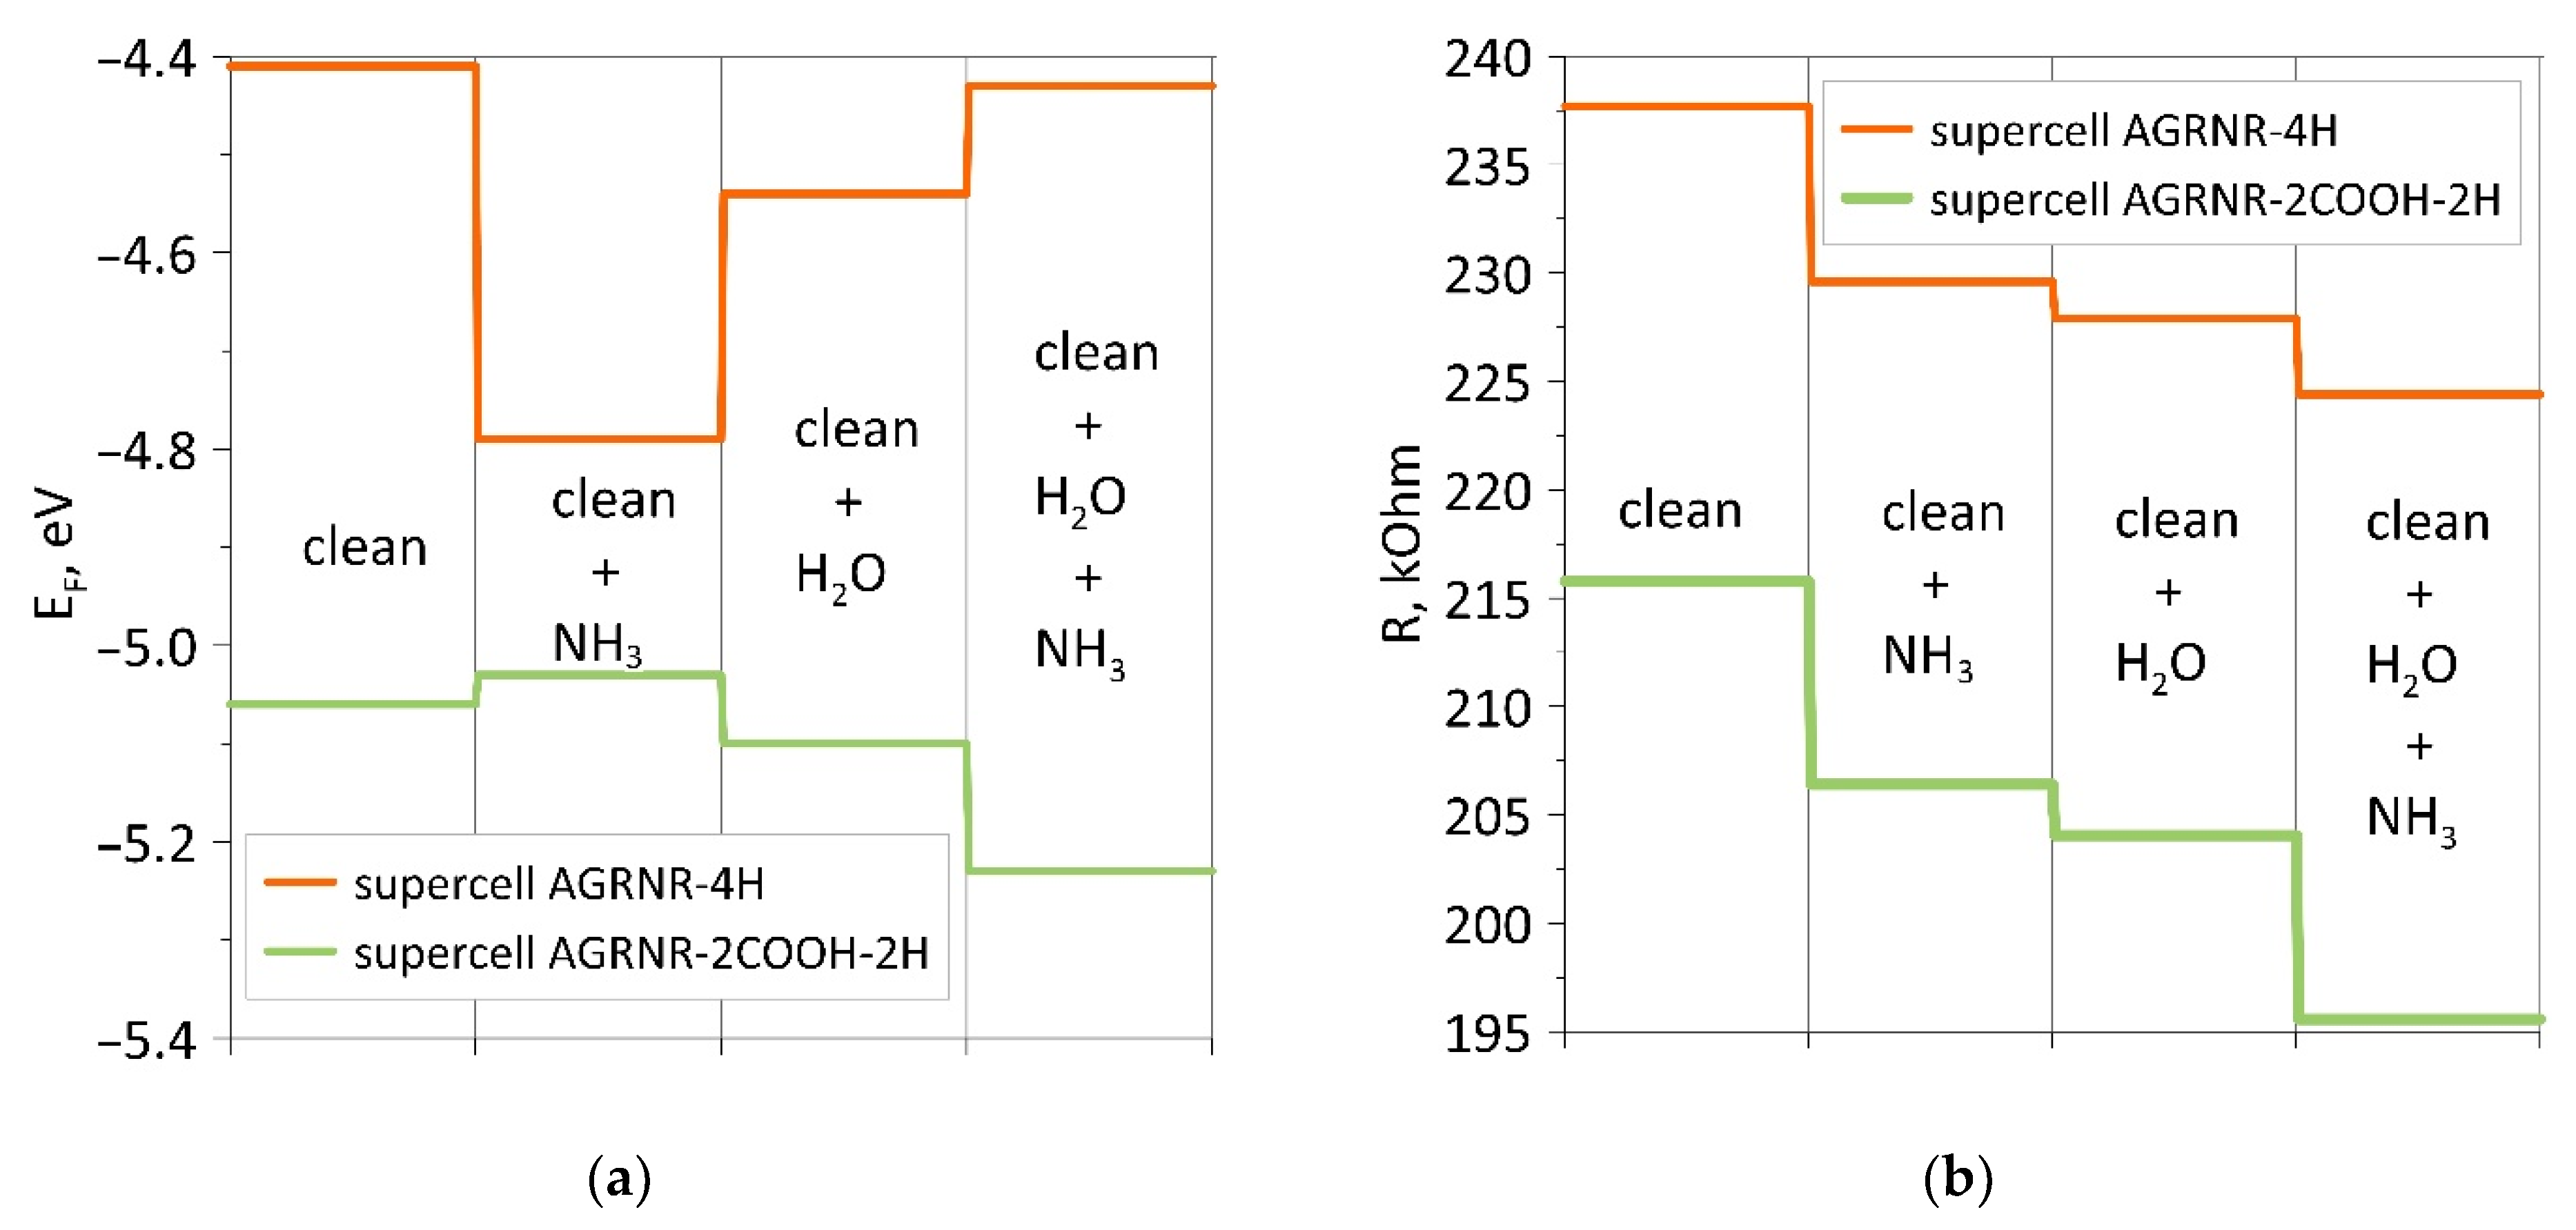
Analysis of the data obtained shows that the adsorption energy of ammonia on a wet armchair nanoribbon is higher, as in the case of a zigzag nanoribbon. Carboxylation of nanoribbons of both types leads to a sharp shift of the Fermi level towards a decrease. The adsorption of water and ammonia affects the energy in different ways. For comparison and clarity, Figure 8 shows diagrams of changes in the Fermi level and resistance for armchair nanoribbons. If in the case of zigzag nanoribbons, each adsorption shifted the Fermi level in one direction (towards a decrease for a non-functionalized nanoribbon and an increase for a carboxylated one), then, in this case, we see jumps in the behavior of the Fermi level. However, the resistance behaves in the same way, and it decreases for both considered armchair nanoribbons.

4. Conclusions

In this work, we investigated the role of carboxyl groups in changing the sensor properties of gas sensors based on graphene zigzag and armchair nanoribbons. First of all, it was found that the chemoresistive response is significantly higher when ammonia is adsorbed on wet nanoribbons functionalized by COOH groups. This is an important result since water is always present in the air and is inevitably present on graphene structures. Another interesting point is that carboxyl groups primarily attract water molecules, which are energetically advantageous to sit on these regions and then on the nanoribbon’s basal surface. It was also found that the armchair nanoribbon is less suitable for an ammonia gas sensor because the chemoresistive response of the carboxylated armchair nanoribbon is small than the carboxylated zigzag nanoribbon. This is important because experimental studies show that the zigzag edges are characteristic of graphene flakes, ribbons, and perforated graphene. That is, the carboxylated nanoribbon zigzag can be the most promising.

Author Contributions

Conceptualization, O.E.G.; methodology, O.E.G.; software, O.E.G.; validation, O.E.G., P.V.B.; formal analysis, O.E.G.; investigation, P.V.B.; resources, O.E.G.; data curation, O.E.G.; writing—original draft preparation, P.V.B.; writing—review and editing, O.E.G.; visualization, P.V.B.; supervision, O.E.G.; project administration, O.E.G.; funding acquisition, O.E.G. All authors have read and agreed to the published version of the manuscript.

Funding

This research was funded by the Ministry of Science and Higher Education of the Russian Federation (project no. FSRR-2020-0004).

Conflicts of Interest

The authors declare no conflict of interest.

References

  1. Kiani, M.J.; Ahmadi, M.T.; Akbari, E.; Karimi, H.; Che Harun, F. Graphene Nanoribbon Based Gas Sensor. Key Eng. Mater. 2013, 553, 7–11. [Google Scholar] [CrossRef]
  2. Kumar, R.; Singh, R.; Kumar, A.; Kashyap, R.; Kumar, D.; Kumar, M. Chemically functionalized graphene oxide thin films for selective ammonia Gas sensing. Mater. Res. Express 2020, 7, 015612. [Google Scholar] [CrossRef]
  3. Liu, B.; Sun, H.; Peng, T.; Yang, J.; Ren, Y.; Ma, J.; Tang, G.; Wang, L.; Huang, S. High Selectivity Humidity Sensors of Functionalized Graphite oxide with More Epoxy Groups. Appl. Surf. Sci. 2020, 503, 144312. [Google Scholar] [CrossRef]
  4. Shekhirev, M.; Lipatov, A.; Torres, A.; Vorobeva, N.S.; Harkleroad, A.; Lashkov, A.; Sysoev, V.; Sinitskii, A. Highly Selective Gas Sensors Based on Graphene Nanoribbons Grown by Chemical Vapor Deposition. ACS Appl. Mater. Interfaces 2020, 12, 7392–7402. [Google Scholar] [CrossRef] [PubMed]
  5. Bannov, A.G.; Popov, M.V.; Brester, A.E.; Kurmashov, P.B. Recent Advances in Ammonia Gas Sensors Based on Carbon Nanomaterials. Micromachines 2021, 12, 186. [Google Scholar] [CrossRef]
  6. Cadore, A.R.; Mania, E.; Alencar, A.B.; Rezende, N.P.; de Oliveira, S.; Watanabe, K.; Taniguchi, T.; Chacham, H.; Campos, L.C.; Lacerda, R.G. Enhancing the response of NH3 graphene-sensors by using devices with different graphene-substrate distances. Sens. Actuators B Chem. 2018, 266, 438–446. [Google Scholar] [CrossRef] [Green Version]
  7. Leenaerts, O.; Partoens, B.; Peeters, F.M. Adsorption of H2O, NH3, CO, NO2, and NO on graphene: A first-principles study. Phys. Rev. B 2008, 77, 125416. [Google Scholar] [CrossRef] [Green Version]
  8. Lin, X.; Ni, J.; Fang, C. Adsorption capacity of H2O, NH3, CO, and NO2 on the pristine graphene. J. Appl. Phys. 2013, 113, 034306. [Google Scholar] [CrossRef]
  9. Zhang, Z.; Zhang, X.; Luo, W.; Yang, H.; He, Y.; Liu, Y.; Zhang, X.; Peng, G. Study on adsorption and desorption of ammonia on graphene. Nanoscale Res. Lett. 2015, 10, 359. [Google Scholar] [CrossRef] [Green Version]
  10. Gupta, B.; Kumar, N.; Panda, K.; Kanan, V.; Joshi, S.; Visoly-Fisher, I. Role of oxygen functional groups in reduced graphene oxide for lubrication. Sci. Rep. 2017, 7, srep45030. [Google Scholar] [CrossRef]
  11. Minitha, C.R.; Anithaa, V.S.; Subramaniam, V.; Kumar, R.T.R. Impact of Oxygen Functional Groups on Reduced Graphene Oxide-Based Sensors for Ammonia and Toluene Detection at Room Temperature. ACS Omega 2018, 3, 4105–4112. [Google Scholar] [CrossRef]
  12. Yu, W.; Sisi, L.; Haiyan, Y.; Jie, L. Progress in the functional modification of graphene/graphene oxide: A review. RSC Adv. 2020, 10, 15328–15345. [Google Scholar] [CrossRef]
  13. Aliyev, E.; Filiz, V.; Khan, M.M.; Lee, Y.J.; Abetz, C.; Abetz, V. Structural Characterization of Graphene Oxide: Surface Functional Groups and Fractionated Oxidative Debris. Nanomaterials 2019, 9, 1180. [Google Scholar] [CrossRef] [PubMed] [Green Version]
  14. Salzmann, C.G.; Nicolosi, V.; Green, M.L.H. Edge-carboxylated graphene nanoflakes from nitric acid oxidised arc-discharge material. J. Mater. Chem. 2010, 20, 314–319. [Google Scholar] [CrossRef]
  15. Guo, Y.; Li, J.; Dong, S. Hemin functionalized graphene nanosheets-based dual biosensor platforms for hydrogen peroxide and glucose. Sens. Actuators B Chem. 2011, 160, 295–300. [Google Scholar] [CrossRef]
  16. Jarczewska, M.; Sheelam, S.R.; Ziółkowski, R.; Górski, Ł. A Label-Free Electrochemical DNA Aptasensor for the Detection of Dopamine. J. Electrochem. Soc. 2015, 163, B26–B31. [Google Scholar] [CrossRef]
  17. Ruan, H.; Liu, B.; Li, H. Controlled synthesis of graphene–Gd(OH)3 nanocomposites and their application for detection of ascorbic acid. RSC Adv. 2015, 5, 21242–21248. [Google Scholar] [CrossRef]
  18. Tian, Y.; Liu, Y.; Wang, W.-p.; Zhang, X.; Peng, W. CuO nanoparticles onsulfur-doped graphene for nonenzymatic glucose sensing. Electrochim. Acta 2015, 156, 244–251. [Google Scholar] [CrossRef]
  19. Benvidi, A.; Rajabzadeh, N.; Zahedi, H.; Mazloum-Ardakani, M.; Heidari, M.; Hosseinzadeh, L. Simple and label-free detection of DNA hybridization on a modified graphene nanosheets electrode. Talanta 2015, 137, 80–86. [Google Scholar] [CrossRef]
  20. Wang, G.; Zhang, G.; Huanga, H.; Wang, L. Graphene-Prussian blue/gold nanoparticles based electrochemical immunoassay of carcinoembryonicantigen. Anal. Methods 2011, 3, 2082–2087. [Google Scholar]
  21. Wu, Q.-Y.; Lan, J.-H.; Wang, C.-Z.; Xiao, C.-L.; Zhao, Y.-L.; Wei, Y.-Z.; Chai, Z.-F.; Shi, W.-Q. Understanding the Bonding Nature of Uranyl Ion and Functionalized Graphene: A Theoretical Study. J. Phys. Chem. A 2014, 118, 2149–2158. [Google Scholar] [CrossRef] [PubMed]
  22. Ziółkowski, R.; Górski, Ł.; Malinowska, E. Carboxylated graphene as a sensing material for electrochemical uranyl ion detection. Sens. Actuators B Chem. 2017, 238, 540–547. [Google Scholar] [CrossRef]
  23. Ziółkowski, R.; Górski, Ł.; Oszwałdowski, S.; Malinowska, E. Electrochemical uranyl biosensor with DNA oligonucleotides as receptor layer. Anal. Bioanal. Chem. 2012, 402, 2259–2266. [Google Scholar] [CrossRef] [Green Version]
  24. Ma, F.; Nian, J.; Bi, C.; Yang, M.; Zhang, C.; Liu, L.; Dong, H.; Zhu, M.; Dong, B. Preparation of carboxylated graphene oxide for enhanced adsorption of U(VI). J. Solid State Chem. 2019, 277, 9–16. [Google Scholar] [CrossRef]
  25. Rabchinskii, M.K.; Shnitov, V.V.; Dideikin, A.T.; Aleksenskii, A.E.; Vul’, S.P.; Baidakova, M.V.; Pronin, I.I.; Kirilenko, D.A.; Brunkov, P.N.; Weise, J.; et al. Nanoscale Perforation of Graphene Oxide during Photoreduction Process in the Argon Atmosphere. J. Phys. Chem. C 2016, 120, 28261–28269. [Google Scholar] [CrossRef]
  26. Jin, Y.; Zheng, Y.; Podkolzin, S.G.; Lee, W. Band gap of reduced graphene oxide tuned by controlling functional groups. J. Mater. Chem. C 2020, 8, 4885–4894. [Google Scholar] [CrossRef]
  27. Fang, Y.; Luo, B.; Jia, Y.; Li, X.; Wang, B.; Song, Q.; Kang, F.; Zhi, L. Renewing Functionalized Graphene as Electrodes for High-Performance Supercapacitors. Adv. Mater. 2012, 24, 6348–6355. [Google Scholar] [CrossRef]
  28. Lee, D.; Seo, J. Three-dimensionally networked graphene hydroxide with giant pores and its application in supercapacitors. Sci. Rep. 2014, 4, 7419. [Google Scholar] [CrossRef]
  29. Stassen, I.; Dou, J.-H.; Hendon, C.; Dincă, M. Chemiresistive Sensing of Ambient CO2 by an Autogenously Hydrated Cu3(hexaiminobenzene)2 Framework. ACS Central Sci. 2019, 5, 1425–1431. [Google Scholar] [CrossRef] [Green Version]
  30. Li, M.; Zhu, H.; Wei, G.; He, A.; Liu, Y. DFT calculation and analysis of the gas sensing mechanism of methoxy propanol on Ag decorated SnO2 (110) surface. RSC Adv. 2019, 9, 35862–35871. [Google Scholar] [CrossRef] [Green Version]
  31. Klyamer, D.; Sukhikh, A.; Gromilov, S.; Krasnov, P.; Basova, T. Fluorinated Metal Phthalocyanines: Interplay between Fluorination Degree, Films Orientation, and Ammonia Sensing Properties. Sensors 2018, 18, 2141. [Google Scholar] [CrossRef] [Green Version]
  32. Yoosefian, M.; Raissi, H.; Mola, A. The hybrid of Pd and SWCNT (Pd loaded on SWCNT) as an efficient sensor for the for-maldehyde molecule detection: A DFT study. Sens. Actuat. B Chem. 2015, 212, 55–62. [Google Scholar] [CrossRef]
  33. Epifani, M.; Prades, J.D.; Comini, E.; Cirera, A.; Siciliano, P.; Faglia, G.; Morante, J.R. Chemoresistive sensing of light alkanes with SnO2 nanocrystals: A DFT-based insight. Phys. Chem. Chem. Phys. 2009, 11, 3634–3639. [Google Scholar] [CrossRef]
  34. Lee, S.W.; Kim, J.M.; Park, W.; Lee, H.; Lee, G.R.; Jung, Y.; Jung, Y.S.; Park, J.Y. Controlling hot electron flux and catalytic selectivity with nanoscale metal-oxide interfaces. Nat. Commun. 2021, 12, 1–11. [Google Scholar] [CrossRef]
  35. Kwak, D.; Sokol, H.; Moser, B.P.; Ryu, H.; Koski, K.J.; Maric, R.; Zhang, L.; Lei, Y. Ultrasensitive ammonia (NH3) gas sensor: DFT Simulation-Directed Selection of High-Performance Metal-Doped Molybdenum Tri-oxide (α-MoO3) Nanoribbons for NH3 Detection. IEEE Sens. 2019, 1–4. [Google Scholar] [CrossRef]
  36. Fedorov, F.S.; Solomatin, M.A.; Uhlemann, M.; Oswald, S.; Kolosov, D.A.; Morozov, A.; Varezhnikov, A.S.; Ivanov, M.A.; Grebenko, A.K.; Sommer, M.; et al. Quasi-2D Co3O4 nanoflakes as an efficient gas sensor versus alcohol VOCs. J. Mater. Chem. A 2020, 8, 7214–7228. [Google Scholar] [CrossRef]
  37. Soler, J.M.; Artacho, E.; Gale, J.D.; García, A.; Junquera, J.; Ordejón, P.; Sánchez-Portal, D. The SIESTA method for ab initio order-N materials simulation. J. Phys. Cond. Matt. 2002, 14, 2745. [Google Scholar] [CrossRef] [Green Version]
  38. García, A.; Papior, N.; Akhtar, A.; Artacho, E.; Blum, V.; Bosoni, E.; Brandimarte, P.; Brandbyge, M.; Cerdá, J.I.; Corsetti, F.; et al. Siesta: Recent developments and applications. J. Chem. Phys. 2020, 152, 204108. [Google Scholar] [CrossRef] [PubMed]
  39. Monkhorst, H.J.; Pack, J.D. Special points for Brillouin-zone integrations. Phys. Rev. B 1976, 13, 5188–5192. [Google Scholar] [CrossRef]
  40. Perdew, J.P.; Burke, K.; Ernzerhof, M. Generalized gradient approximation made simple. Phys. Rev. Lett. 1996, 77, 3865. [Google Scholar] [CrossRef] [PubMed] [Green Version]
  41. Berland, K.; Hyldgaard, P. Exchange functional that tests the robustness of the plasmon description of the van der Waals density functional. Phys. Rev. B 2014, 89, 035412. [Google Scholar] [CrossRef] [Green Version]
  42. Berland, K.; Cooper, V.R.; Lee, K.; Schröder, E.; Thonhauser, T.; Hyldgaard, P.; Lundqvist, B.I. van der Waals forces in den-sity functional theory: A review of the vdW-DF method. Rep. Prog. Phys. 2015, 78, 066501. [Google Scholar] [CrossRef] [PubMed] [Green Version]
  43. Hyldgaard, P.; Jiao, Y.; Shukla, V. Screening nature of the van der Waals density functional method: A review and analysis of the many-body physics foundation. J. Phys. Condens. Matter 2020, 32, 393001. [Google Scholar] [CrossRef] [PubMed] [Green Version]
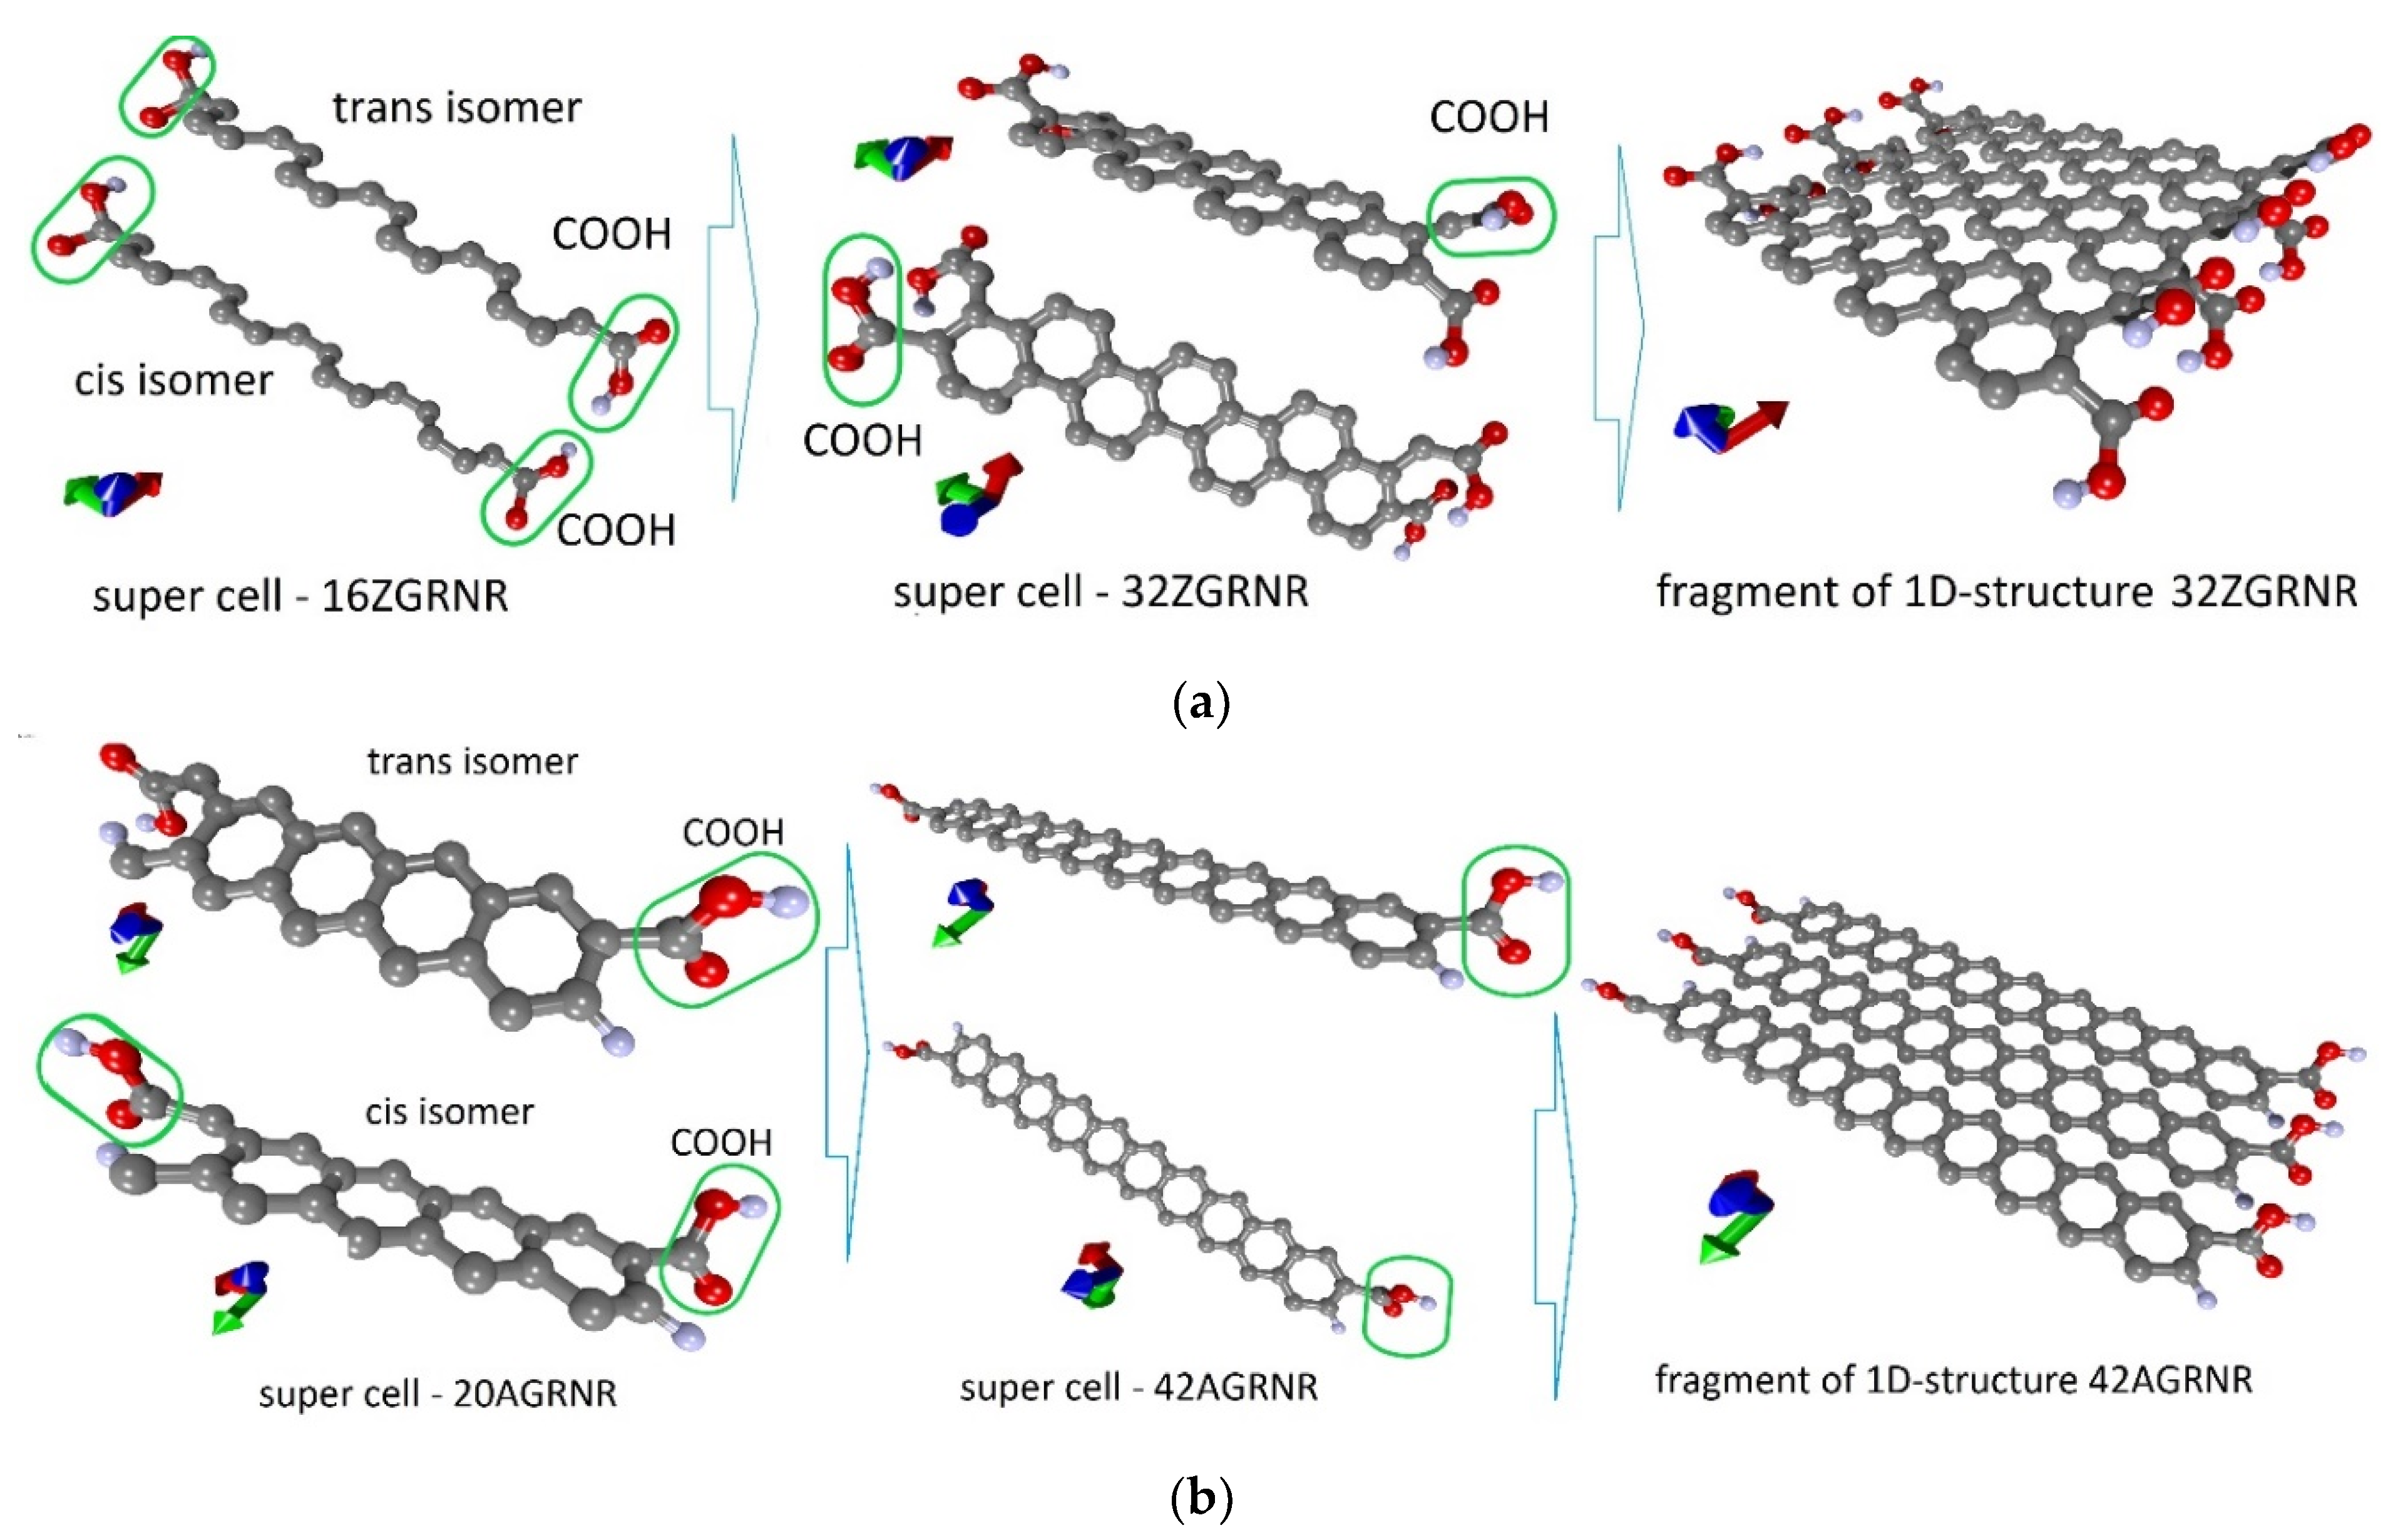
Figure 1. Atomistic models of carboxylated graphene nanoribbons: (a) zigzag nanoribbon; (b) armchair nanoribbon (carboxyl groups in the figure are circled in green).
Chemosensors 09 00084 g001
Figure 2. DOS plots of carboxylated graphene nanoribbons: (a) zigzag nanoribbon; (b) armchair nanoribbon.
Chemosensors 09 00084 g002
Figure 3. Adsorption of water and ammonia: (a) water molecules; (b) ammonia molecules on a dry nanoribbon; (c) ammonia molecules on a wet nanoribbon (one supercell of 32ZGRNR–4COOH nanoribbon is shown).
Chemosensors 09 00084 g003
Figure 4. Adsorption of water and ammonia: (a) 32ZGRNR–4Hnanoribbon; (b) 32ZGRNR–4COOH nanoribbon (supercells of nanoribbons are shown).
Chemosensors 09 00084 g004
Figure 5. 4D patterns of the distribution of the electron charge density over the atoms of the supercell with adsorbed ammonia molecules on a wet surface: (a) 32ZGRNR–4H nanoribbon; (b) 32ZGRNR–4COOH nanoribbon.
Chemosensors 09 00084 g005
Figure 6. Diagrams of changes in the presence/absence of a COOH group at the edges of the zigzag nanoribbon: (a) for the Fermi level; (b) for resistance.
Chemosensors 09 00084 g006
Figure 7. Atomic structure of nanoribbons and adsorption of water and ammonia: (a) fragment of 42AGRNR–4Hnanoribbon; (b) a fragment of the 42AGRNR–2COOH nanoribbon; (c) adsorption on a non-functionalized nanoribbon; (d) adsorption on a carboxylated nanoribbon (supercells of nanoribbons are shown).
Chemosensors 09 00084 g007
Figure 8. Diagrams of changes in the presence/absence of a COOH group at the edges of the armchair nanoribbon: (a) for the Fermi level; (b) for resistance.
Chemosensors 09 00084 g008
Table 1. Metric and energy characteristics of carboxylated graphene nanoribbons.
StructureLength
C–COOH, Å
Lattice Vector, ÅΔHf, eVEgap, eVEF, eVCharge on COOH, e
Zigzag nanoribbons
16ZGRNR–2COOH
(cis isomer)
1.5222.455−8.900−5.88−0.077
16ZGRNR–2COOH
(trans-isomer)
1.5142.482−9.380−5.87−0.076
32ZGRNR–4COOH1.5224.954−27.560−5.82−0.100
Armchair nanoribbons
20AGRNR–2COOH
(cis isomer)
1.5014.260−31.901.024−5.06−0.020
20AGRNR–2COOH
(trans-isomer)
1.5024.260−31.911.028−5.07−0.021
42AGRNR–2COOH1.5124.254−35.500.040−4.95−0.030
Table 2. Energy characteristics of non-functionalized zigzag 32ZGRNR–4H nanoribbon and carboxylated 32ZGRNR–4COOH nanoribbon.
Eads, eVEF, eVCharge of ZGRNR, eR, kOhmS, %
32ZGRNR–4H
Clean−4.60012.596
+NH30.013 ± 0.001−4.68 ± 0.01−0.0041 ± 0.000411.812 ± 0.076.2 ± 0.08
+H2O0.078 ± 0.002−4.70 ± 0.01−0.0046 ± 0.000311.104 ± 0.05
+H2O + NH30.015 ± 0.006−4.74 ± 0.02−0.0051 ± 0.000510.457 ± 0.038.3 ± 0.10
32ZGRNR−4COOH
Clean−5.92012.701
+NH30.103 ± 0.001−5.85 ± 0.01−0.0007 ± 0.0000512.219 ± 0.043.4 ± 0.03
+H2O0.186 ± 0.002−5.82 ± 0.02−0.0014 ± 0.000210.573 ± 0.03
+H2O + NH30.128 ± 0.005−5.69 ± 0.030.002 ± 0.00112.105 ± 0.0215.2 ± 0.05
Table 3. Energy characteristics of non-functionalized 42AGRNR–4H zigzag nanoribbon and carboxylated 42AGRNR–2COOH-2Hnanoribbon.
Eads, eVEF, eVCharge of AGRNR, eR, kOhmS, %
42AGRNR–4H
Clean−4.41237.731
+NH30.008 ± 0.003−4.79 ± 0.02−0.0028 ± 0.0005229.648 ± 1.83.3 ± 0.35
+H2O0.05 ± 0.005−4.54 ± 0.03−0.0047 ± 0.0003227.955 ± 1.5
+H2O + NH30.010 ± 0.002−4.43 ± 0.02−0.0083 ± 0.0005224.400 ± 1.61.57 ± 0.02
42AGRNR–2COOH-2H
Clean−5.06215.772
+NH30.005 ± 0.005−5.03 ± 0.02−0.0007206.417 ± 1.54.30 ± 0.05
+H2O0.06 ± 0.03−5.10 ± 0.02−0.0014204.052 ± 2.0
+H2O + NH30.022 ± 0.005−5.23 ± 0.03−0.018 ± 0.005195.570 ± 1.84.13 ± 0.03
Publisher’s Note: MDPI stays neutral with regard to jurisdictional claims in published maps and institutional affiliations.