Article

Graphene Bioelectronic Nose for the Detection of Odorants with Human Olfactory Receptor 2AG1

by
Danielle M. Goodwin
1,*,
Ffion Walters
1,
Muhammad Munem Ali
1,
Ehsaneh Daghigh Ahmadi
1 and
Owen J. Guy
1,2,*
1
Centre for NanoHealth, College of Engineering, Swansea University, Swansea SA2 8PP, UK
2
Department of Chemistry, College of Science, Swansea University, Swansea SA2 8PP, UK
*
Authors to whom correspondence should be addressed.
Chemosensors 2021, 9(7), 174; https://doi.org/10.3390/chemosensors9070174
Submission received: 28 April 2021 / Revised: 2 July 2021 / Accepted: 5 July 2021 / Published: 8 July 2021
(This article belongs to the Special Issue Gustatory and Olfactory Sensing Technologies and Applications)

Abstract

:
A real-time sensor for the detection of amyl butyrate (AB) utilising human olfactory receptor 2AG1 (OR2AG1), a G-protein coupled receptor (GPCR) consisting of seven transmembrane domains, immobilized onto a graphene resistor is demonstrated. Using CVD graphene as the sensor platform, allows greater potential for more sensitive detection than similar sensors based on carbon nanotubes, gold or graphene oxide platforms. A specific graphene resistor sensor was fabricated and modified via non-covalent π–π stacking of 1,5 diaminonaphthalene (DAN) onto the graphene channel, and subsequent anchoring of the OR2AG1 receptor to the DAN molecule using glutaraldehyde coupling. Binding between the target odorant, amyl butyrate, and the OR2AG1 receptor protein generated a change in resistance of the graphene resistor sensor. The functionalized graphene resistor sensors exhibited a linear sensor response between 0.1–500 pM and high selectively towards amyl butyrate, with a sensitivity as low as 500 fM, whilst control measurements using non-specific esters, produced a negligible sensor response. The approach described here provides an alternative sensing platform that can be used in bioelectronic nose applications.

1. Introduction

Olfaction, the perception of smell, is a process of chemoreception in humans, animals and insects that is essential for the detection of hazards, sourcing of food and recognition of pheromones [1,2]. Olfaction has also proven useful in the detection of biomarkers, food quality [3], law enforcement and security [4]. Although humans have only 350 olfactory receptor genes [5], upwards of 1 trillion olfactory stimuli can be discriminated [6]. Olfactory receptors (ORs) are G-protein coupled receptors (GPCRs) that consist of seven transmembrane domains [7,8], and while some exhibit high specificity towards one specific odorant, others bind to a range of unique odorants [1]. Although the ORs share some similarities throughout their seven α-helical membrane domains, there is a region of variability located within the third, fourth and fifth domains, and within these domains is a pocket that is thought to be the binding side for ligands [9]. Different amino acids present within this pocket alter the selectivity of specific ORs. For instance, a single amino acid (valine or isoleucine) determines whether a particular mouse OR is selective towards octanal or hexanal [9]. Operating via a ‘combinatorial code’, certain receptors in the olfactory system are activated when exposed to different odours [10,11,12]. Hence, individual odorants can activate multiple receptors, and individual receptors can detect multiple odorants. This combinatorial response of activated receptors enables pattern recognition in the brain, which enables humans to discriminate between different odorants [12]. The olfactory mechanism consists of delivery of odorants via odorant binding proteins (OBPs) to the olfactory receptors (ORs), which are located in the olfactory sensory neurons in olfactory epithelium [13].
Utilisation of odorant binding proteins and olfactory receptors in biosensors to develop a ‘bioelectronic nose’, resulting in a device that mimics the human olfactory system, dates back to 1961 [14]. Conceptually, the bioelectronic nose is analogous to the human olfactory system. Whereas the human olfactory system consists of olfactory receptors located in olfactory epithelium in the nose, bioelectronic noses contain these receptors immobilized on a support matrix (e.g., graphene, carbon nanotubes, silicon nanowires, etc.). Binding between the odorant molecule and its respective olfactory receptor/odorant-binding protein results in signal transduction produced by a conformational change in the receptor protein. Signals are detected as a change in resistance as conformational changes can alter charge transfer [15]. Recently, biosensors mimicking the olfactory system have been developed [16,17,18,19,20] using ORs such as rat I7, human OR2AG1 and odorant binding protein 14 (OBP14) from the honey bee, immobilized on platforms such as single-walled carbon nanotubes (swCNTs) [17,18,21], gold [16,22,23] and reduced graphene oxide [19,20]. These bioreceptor proteins are often utilised as the target odorants are known. For instance, a device demonstrating high sensitivity (10−15 M) and selectivity using chemically modified swCNTs was fabricated via π-stacking of 1,5 diaminonaphthalene covalently bonded to OR2AG1 [17]. Similarly, a field effect transistor fabricated on reduced graphene oxide and modified using OBP14 demonstrated that molecules containing an aromatic backbone together with a hydroxyl group are able to selectively bind with OBP14 [19].
Traditional diagnosis techniques, although reliable and well-established, often require skilled personnel, expensive equipment and time-consuming sample preparation. Biosensors are becoming the present-day solution for rapid, reliable, sensitive, selective and cost-effective detection methods. Current research includes the use of several different types of biosensors: optical, potentiometric, impediametric, amperometric [24] and piezoelectric [25]. Synthetic peptide chains have also been utilized to selectively and sensitivity detect various odorants, for example in piezoelectric sensors using immobilized peptide chains based on the odorant-binding region of HarmOBP7 [26,27]. Similarly, a synthetic peptide fluorescent ratio sensor based on dansyl-peptide was recently demonstrated to selectively detect Ag+ against other common metal ions as low as 80 nM in water treatment applications [28]. In another example, peptide hormone sensors were realized using human hormone receptor-carrying nanovesicles immobilized on graphene-FET devices [29]. Although widely researched, graphene has not frequently been employed in these bioelectronic nose sensors to date. Graphene, a 2D nanomaterial composed of a single layer of sp2 hybridised carbons, possesses superior electrical properties such as high carrier mobility and electron transfer rates at room temperature [30], which present opportunities for applications in a diverse range of fields such as medical, solar cells, energy storage, transparent electrodes, transistors and nanocomposites [31]. In particular, graphene-based sensing devices have features such as label-free detection, high sensitivity and selectivity, biocompatibility and ease of functionalization [32,33,34]. The ability to fabricate graphene devices using standard lithographic processes presents significant advantages over CNT-based sensors in terms of reliability of device platforms and potential multiplexing capability for any bioelectronic nose.
Herein, we report the fabrication, real-time functionalization and performance of a graphene resistor capable of selectively and sensitively detecting amyl butyrate (AB), an odorant specific to OR2AG1. Graphene was chemically modified using drop-cast 1,5 diaminonaphthalene (DAN) via π–π stacking followed by covalent attachment of the analyte-specific receptor, OR2AG1, using glutaraldehyde as the condensing agent. To the best of our knowledge, this is the first bioelectronic nose for the detection of amyl butyrate (AB), based on CVD graphene resistor devices on Si/SiO2 substrates. In addition, to the best of our knowledge, this is the first real-time resistor-based sensor with MVD passivation.

2. Materials and Methods

2.1. Materials

Graphenea (Cambridge, MA, USA): Monolayer graphene on 300 nm thermal oxide SiO2/525 μm Si wafers (<100> orientation, 1–10 Ω.cm resistivity and P-type/Bor). DOW Electronics Materials (Portland, ME, USA): Microposit LOR 3A Photoresist and Microposit S1805 G2 positive photoresist. MicroChemicals GmbH (Ulm, Germany): TechniStrip NI555, AZ 726 MIF Developer and 25% TMAH etchant. Kurt J. Lesker Company Ltd. (East Sussex, UK): Chromium and palladium PVD targets. Pegasus Chemicals (Sandycroft, Wales): Trimethylaluminium (TMA) precursor. Fisher Scientific UK Ltd. (Loughborough, Leicestershire, UK): Phosphate buffered saline (PBS) containing 0.01 M phosphate, 0.0027 M KCl, and 0.137 M NaCl, pH 7.4, butyl butyrate and ethanol. Sigma Aldrich Company Ltd. (Gillingham, Dorset, UK): 1,5 diaminonaphthalene, glutaraldehyde, pentyl valerate, amyl butyrate, bovine serum albumin (BSA) and dimethyl sulfoxide. Abnova (Taipei City, Taiwan): human olfactory receptor 2AG1.

2.2. Device Fabrication

Graphene devices were fabricated using chemical vapour deposited (CVD) single-layer graphene-on-300 nm SiO2/525 μm Si (1–10 Ω.cm resistivity, p-type/Boron doped and <100> orientation silicon wafers), supplied by Graphenea. The graphene was annealed at 550 °C for 10 min using a Jiplec RTA system for improved graphene-to-substrate adhesion before performing photolithographic processing. After annealing, the graphene was patterned using a bilayer photoresist mask (LOR 3A and S1805 photoresists) and subsequent 5 min O2 plasma etch of exposed graphene, using a Quorum Emitech K1050X RF plasma asher, to form graphene channel devices, as described in our previous work [26]. Once the photoresist was removed, the graphene underwent a second photolithography lift-off step to pattern metal contacts (30 nm Cr and 200 nm Pd stack deposited using a Kurt J. Lesker MVD75 system), which connected to the graphene channels. The metal contacts of graphene devices were then coated with a 50 nm Al2O3 dielectric layer, deposited using an SPTS Technologies MVD300 system, to provide a protective passivation layer over the metallised device components, whilst the active part of the sensor—the graphene channel—was exposed to the sensing environment. This was achieved by patterning a window around the graphene channels using AZ nLof 2070 photoresist, exposing the Al2O3 to wet chemical etching using 1.25% concentrated tetramethylammonium hydroxide (TMAH) opening a window to expose only the graphene channels. After Al2O3 etching, the photoresist mask was removed with TechniStrip NI555 resist remover, revealing the final passivated graphene devices.

2.3. Functionalization of Graphene

2.3.1. DAN Functionalization

10 mM DAN solution was prepared in 70% ethanol in DI water. A 20 µL droplet was drop-cast onto the graphene channel and incubated at room temperature (RT) for 1 h. The droplet was topped with a 20 µL droplet during the hour to avoid evaporation. After incubation, devices were washed three times with a 20 µL droplet of 70% ethanol followed by washing three times with a 20 µL droplet of DI (deionized) water.

2.3.2. Olfactory Receptor Attachment

To deposit the OR2AG1 protein, a solution of 2% (v/v) glutaraldehyde (condensing agent) in 1 × phosphate buffered saline (PBS) (pH 7.4) was prepared, and 20 µL of this was drop-cast onto the graphene channel and incubated at RT for 30 min. Devices were subsequently washed three times with 20 µL of DI water, before applying a 16 µL droplet of OR2AG1 (0.01 µg/µL in 50 mM Tris-HCI, 10 mM reduced glutathione, pH = 8.0 in the elution buffer) onto the activated DAN-modified graphene channel and incubating for 1 h at RT. Functionalized devices were washed three times with 20 µL of DI water. The graphene functionalization is illustrated in Figure 1.

2.3.3. Blocker Attachment

Following functionalization of the graphene channel with OR2AG1, blocking agents were used to mop up any non-specific binding sites on the graphene channel device. A 1% 20 µL droplet of bovine serum albumin (BSA) blocker solution diluted in DI water was thus drop-cast onto the OR2AG1/glutaraldehyde/DAN functionalized graphene devices and was incubated for 30 min at RT. Devices were washed three times with 20 µL of DI water and gently dried with N2.

2.4. Electrical Measurements

Real-time current–voltage resistance measurements were performed using graphene sensor chips, consisting of three discrete CVD graphene devices on a single chip. The three graphene resistor devices were measured simultaneously by sliding the chips into the ‘Sensor-Connect’ connector, supplied by Biovici Ltd.; see Figure 2. Measurements were carried out under ambient conditions (temperature 20 °C, normal atmospheric pressure), monitoring current in response to a constant voltage of 40 mV applied across the graphene devices. Real-time resistance measurements were carried out by in situ drop casting: starting with a ‘blank’ measurement (no solution), followed by PBS, negative controls (pentyl valerate, butyl butyrate and propyl butyrate) and finally, the target odorant, amyl butyrate at increasing concentrations.
Below is a depiction of signal transduction for this bioelectronic nose (Figure 3). The binding event between the odorant and receptor causes a conformational change in the receptor. The transducer (graphene resistor chip) converts the biorecognition event into a measurable electrical signal, which in this case is a current measurement [15].

3. Results and Discussion

3.1. Surface Characterization: Atomic Force Microscopy

The surface topography of graphene before and after functionalization with DAN was characterised using atomic force microscopy (AFM), performed using a JPK NanoWizards II (Dimension-3100 Multimode, Bruker, Billerica, MA, USA), using a non-contact AFM tip with resonant frequency, spring constant and tip radius of 320 kHz, 40 N/m and 8 nm, respectively, operated in AC mode. The surface graphene before and after functionalization with DAN (Figure 4) showed clear changes in surface topology and surface roughness. The root mean square (RMS) roughness of 0.534 nm (Figure 4a) of bare graphene dramatically increased to 2.315 nm (Figure 4b) after functionalization of graphene by DAN drop-casting. Table S1 (Supplementary Materials) also shows the statistical results of the RMS roughness of graphene surface before and after functionalization by DAN. According to the statistical results (Table S1), the average RMS roughness of 0.780 nm for the bare graphene surface increased to 1.150 nm for the DAN functionalized graphene surface.

3.2. Surface Characterization: Raman Spectroscopy

Raman spectroscopy was performed using a Renishaw inVia Raman microscope with a 532 nm laser at 2 mW power and a x100 objective lens. This spectroscopic technique was used to characterize the changes in the graphene surface after each functionalization stage. Extended point scans were performed on the graphene, (Figure 5a). For the pristine graphene, the average intensity ratio between the D- and G-peaks, located at ~1350 cm−1 and ~1590 cm−1, respectively, was close to 0.079 [35]. This ratio increased with each surface modification step due to the presence of additional aromatic molecules on the graphene surface. After the DAN modification step, the intensity and FWHM of the D-peaks and G-peaks changed significantly. The D-band produced an asymmetrical peak, influenced by the stretching of C–N vibrational modes, found in the DAN structure [34]. An additional peak was present at ~1460 cm−1 and ~1620 cm−1 due to the vibrational modes created by the aromatic rings found in DAN [36]. The peak ~1620 cm−1 started to broaden due to the C = O and amide stretching caused by the glutaraldehyde and OR2AG1 receptor protein [37] surface modification steps. With each attachment step, the additional peaks broadened due to the influence of the different functional groups present on the graphene surface, and began merging with the graphene G-peak, increasing the FWHM. These changes in the Raman spectrum indicated successful graphene functionalization after each step. Using a custom script, the Raman peak positions of the G-peaks and 2D-peaks were obtained after each functionalization stage and were placed into a scatter plot (Figure 5b). The shifts in the G-peak positions, with respect to the shifts in the 2D-peak position, after each functionalization stage could be used to analyse the changes in stress or strain in the graphene crystalline structure and alterations in the charge carrier doping [38]. The application of DAN resulted in electron donation between the DAN and the graphene surface, introducing an n-doping effect on the graphene, shown by the blue-shifting of the Raman peaks [34,35,39]. However, once the glutaraldehyde and OR2AG1 receptor proteins were attached, the Raman peaks shifted again in the opposite direction, indicating that a p-doping effect was taking place. This p-doping effect took place due to the charge transfer occurring between the glutaraldehyde/protein layers and the graphene buried underneath [35,38,39,40,41]. After the final functionalization step, the doping level of the graphene was shown to be p-doped overall, resulting in the graphene being further away from the charge neutrality point.

3.3. Electrical Measurements

3.3.1. Real-Time Functionalization

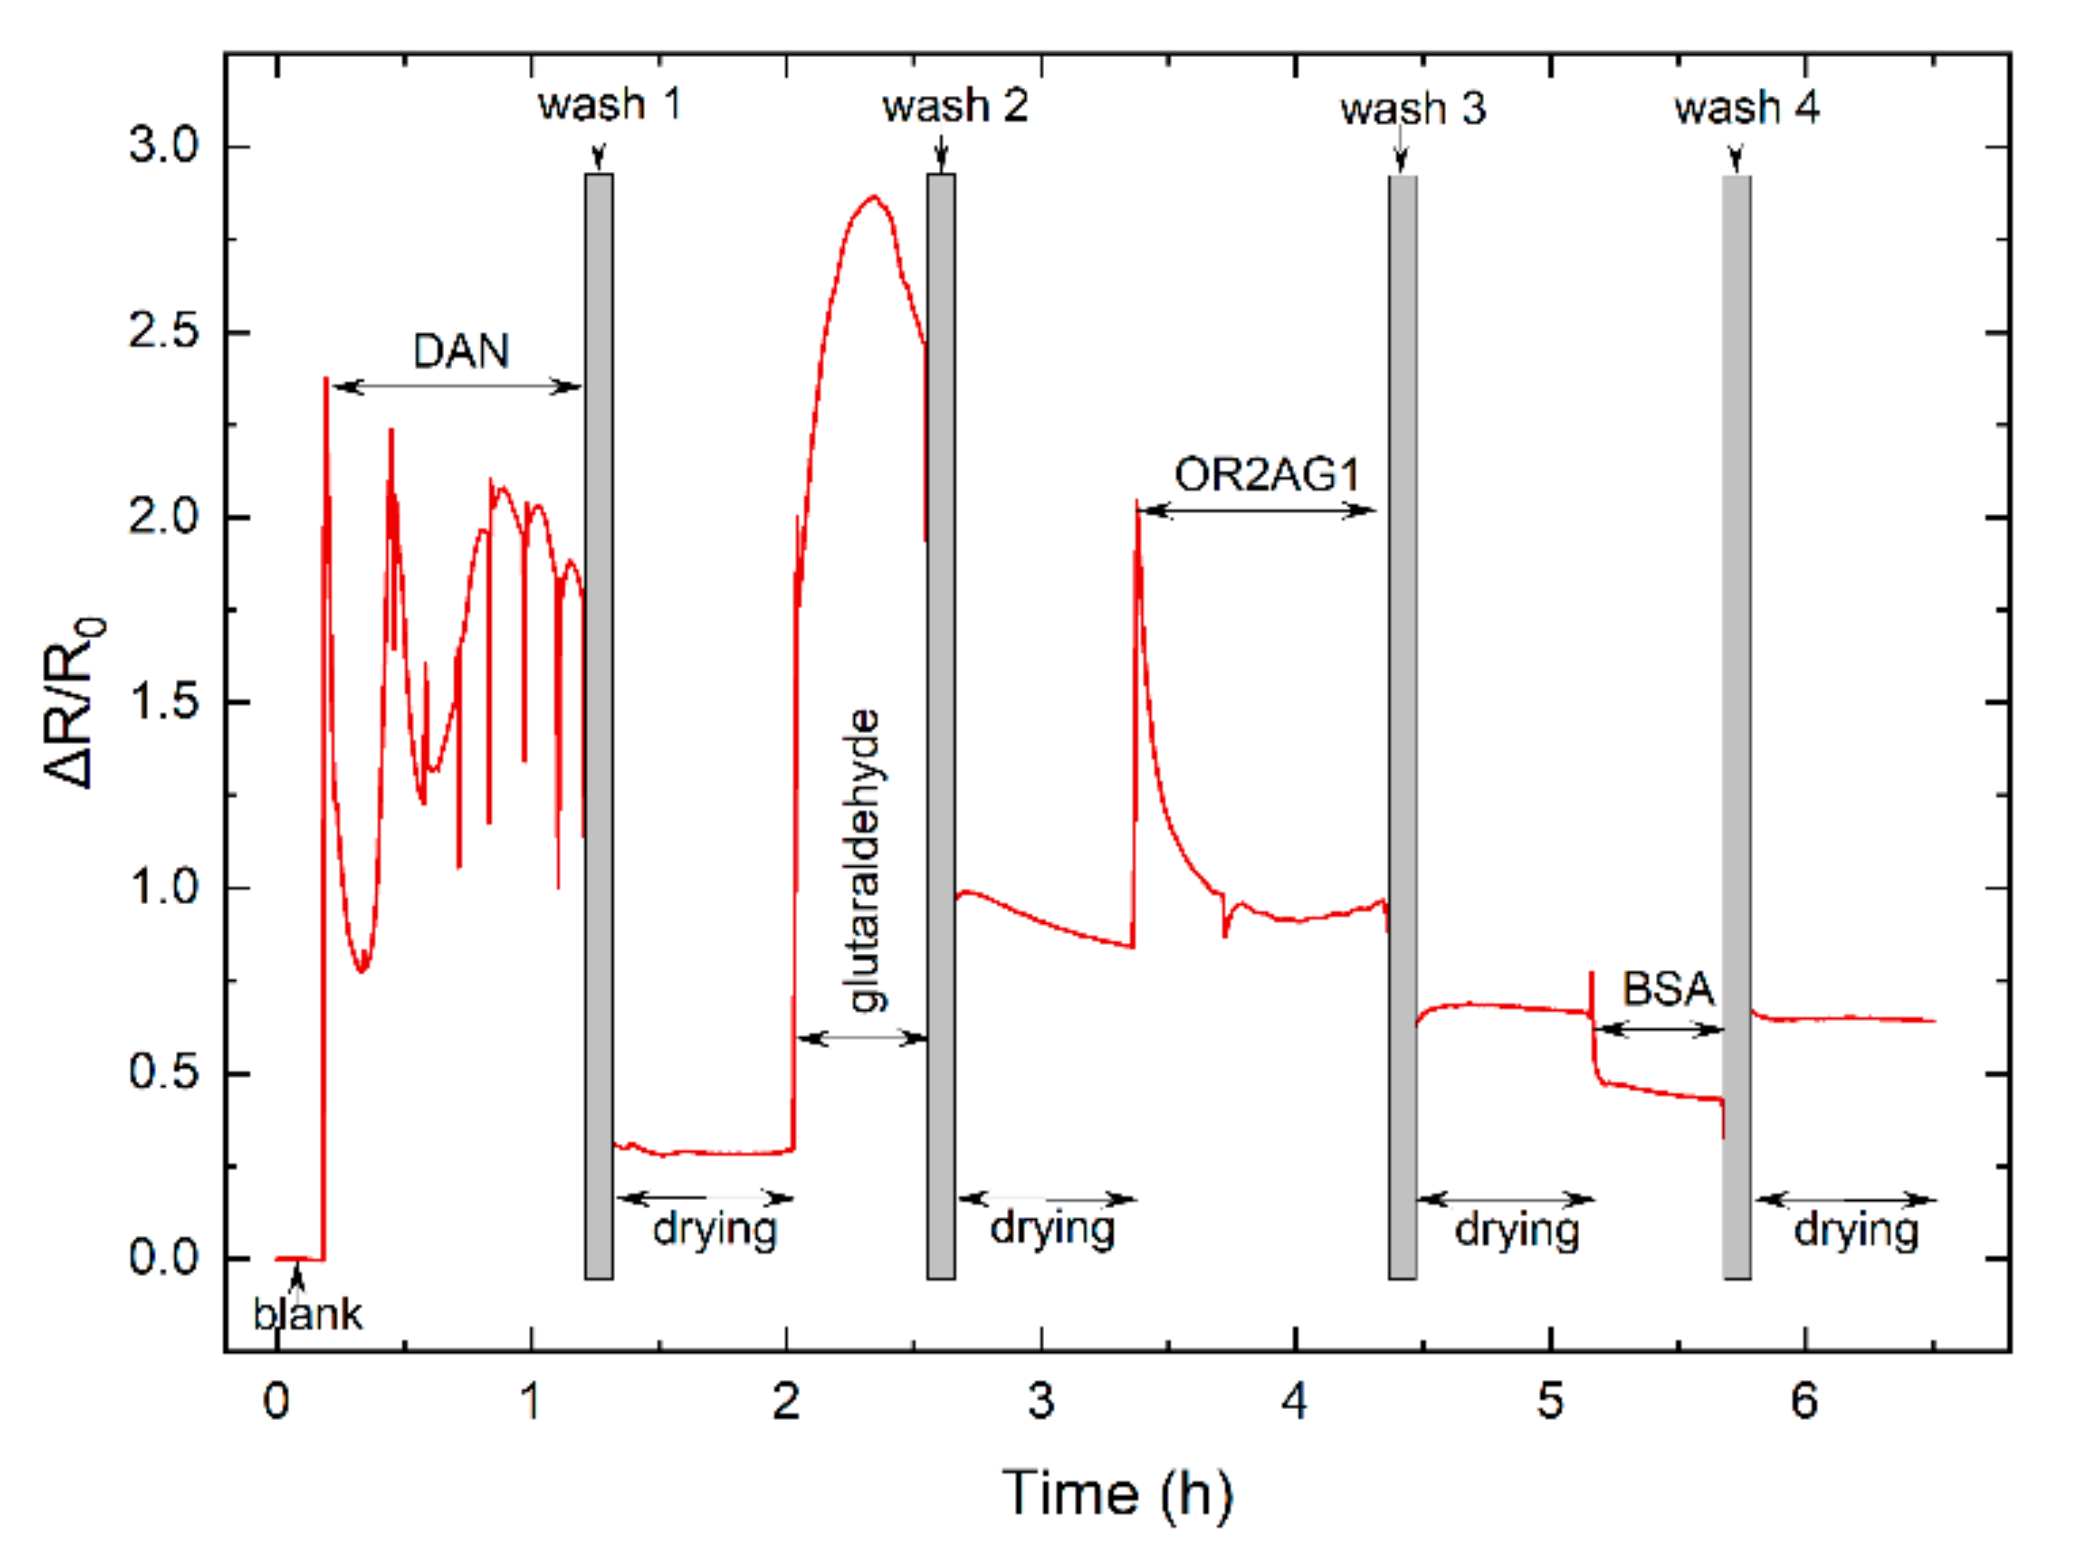
Real-time resistance measurements during the functionalization process were carried out with drop-casting and in situ washing followed by 45-min relaxation/drying periods after each functionalization stage. The requirement for graphene to relax under ambient conditions was investigated in our previous work [34] and is perhaps related to the redistribution of charges within the graphene surface absorbates and Si/SiO2 substrate [33,42].
Figure 6 shows a dramatic increase in resistance after DAN (in 70% ethanol) was drop-cast onto the graphene devices, relative to the resistance of the dry pristine graphene device. During the 1-h incubation period, in which graphene became saturated with DAN, spikes in resistance were seen, which corresponded to the topping up of the droplet to avoid evaporation. Following DAN modification, devices were washed (3 × 20 µL of 70% ethanol, followed by 3 × 20 µL of DI water) and allowed to relax/dry for 45 min. Following drying, the resistance was higher than the initial resistance of the pristine graphene device, indicating modification with DAN resulted in a resistance change. A second increase in resistance was observed with the addition of glutaraldehyde, which was subsequently washed (3 × 20 µL of DI water) and allowed to dry. Addition of the ORA2G1 receptor, followed by BSA blocker (the blocker reduces non-specific binding to unused graphene sites) also produced slight changes in resistance when compared to the previous functionalization steps and to the pristine graphene. The final resistance after completion of functionalization remained higher than the pristine (unmodified) graphene surface. Further repeats, which displayed identical trends, can be found in the Supplementary Materials (Figure S1).

3.3.2. Detection of Odorants

A schematic of the functionalized sensor is shown in Figure 1. OR2AG1 has a high affinity towards amyl butyrate (AB), demonstrated in previous studies [17,18,21,43,44], where OR2AG1 produced no response on exposure to non-specific, structurally similar molecules of aliphatic alcohols, aldehydes, ketones, ketals and esters, including, for example, pentyl valerate, butyl butyrate and propyl butyrate (Figure 7).
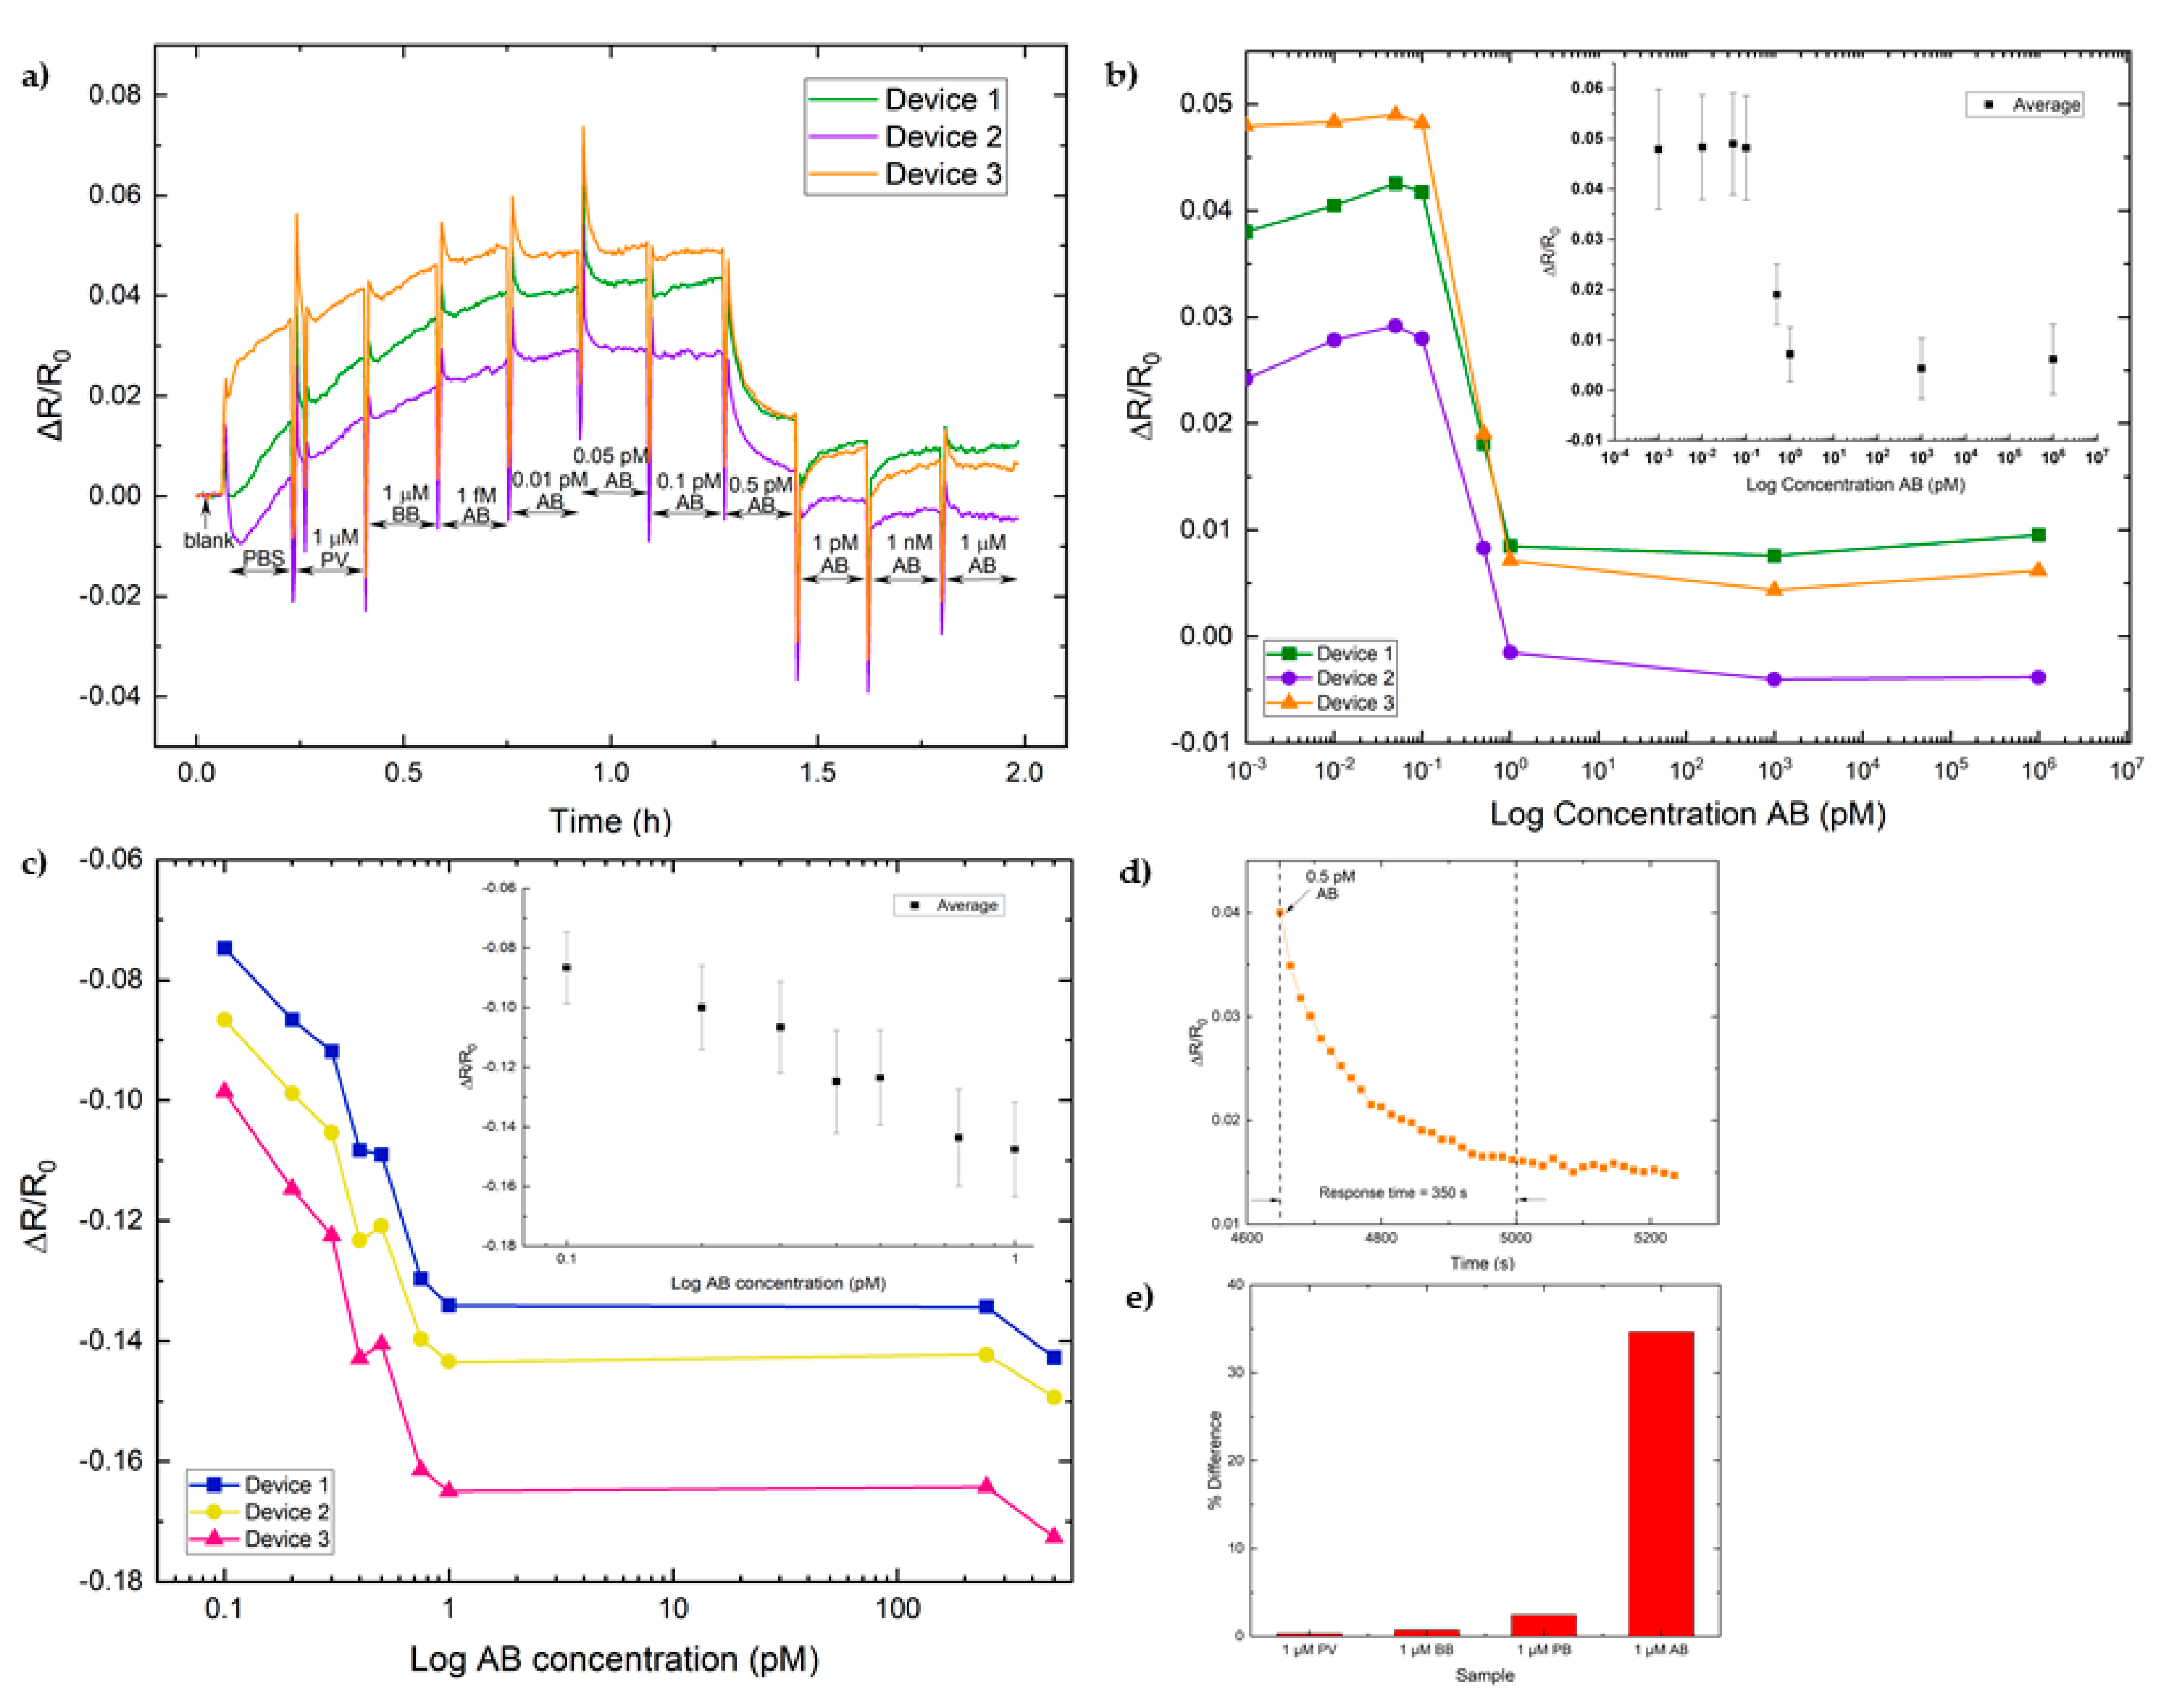
Figure 8a shows the real-time resistance measurement profiles for three OR2AG1 graphene sensors on the same chip. Addition of 0.5 pM AB caused a sharp decrease in resistance (ΔR/R0 in a negative direction) in all three devices, and subsequently, sensor saturation was observed after addition of 1 pM AB. Two structurally similar odorants were employed to assess sensor selectivity: pentyl valerate (PV) and butyl butyrate (BB). No significant changes of ΔR/R0 in a negative direction were observed with the addition of the non-target odorants. Figure 8b represents normalised device resistance against AB concentrations. Concentration dependence was observed at 0.5 pM, followed by a plateau, representing device saturation. Additional AB concentrations (0.1, 0.2, 0.3, 0.4, 0.75, 250, 500 pM) in the linear detection region are displayed in Figure 8c, which demonstrates a linear sensor response. Additional repeats can be found in the Supplementary Materials (Figures S2 and S3). Figure 8d displays the device’s reaction time at 0.5 pM, presenting a response time of approximately 350 s. Figure 8e shows a comparison of the obtained signal after dropcasting of 1 µM AB or the three control odorants. The response signals (% difference in relation to PBS) showed a significantly larger signal change for the AB specific analyte, with only very small changes seen for all three negative control odorants run. Therefore, these results indicate that the functionalised graphene biosensor offered high selectivity towards amyl butyrate.
In similar studies, where nanovesicles were used to amplify sensing signals [18], and the working concentration of the olfactory receptor was higher (0.05 µg/µL) [17], sensitivity was reported at 10−15 M. However, the reported device contains a working concentration of the OR2AG1 receptor of 0.01 µg/µL, with a sensitivity of 10−13 M; this shows that good sensitivity can still be achieved even with low working concentrations of receptor, indicating lower potential development costs.

4. Conclusions

In this work, a graphene resistor bioelectronic nose was fabricated and its performance evaluated using real-time I–V characterization. The sensor was realized using non-covalent surface functionalization of graphene resistor devices with DAN using a drop-cast technique and subsequent immobilization of OR2AG1 protein. The resulting sensor selectively detected the target odorant, amyl butyrate, at a concentration of 0.5 pM even with a low working concentration of the olfactory receptor 2AG1 (0.01 µg/µL), indicating the potential for a bioelectronic nose design using combinations of olfactory receptors. The facile functionalization method allows for simple, quick and cost-effective fabrication of selective and sensitive sensing devices.

Supplementary Materials

The following are available online at https://www.mdpi.com/article/10.3390/chemosensors9070174/s1, Table S1: Root Mean Square (RMS) roughness data, Figure S1: Real-time resistance measurements of the graphene functionalization process and Figure S2: Real-time resistance measurements of the OR2AG1 functionalized graphene sensor. Figure S3. Real-time resistance measurements of the OR2AG1 functionalized graphene sensor.

Author Contributions

Conceptualization, O.J.G.; methodology, D.M.G. and F.W.; validation, D.M.G. and F.W.; formal analysis D.M.G., F.W., M.M.A. and E.D.A.; investigation, D.M.G., F.W., M.M.A. and E.D.A.; writing—original draft preparation, D.M.G., M.M.A. and E.D.A.; writing—review and editing, D.M.G., F.W., M.M.A., E.D.A. and O.J.G.; visualization, D.M.G., F.W., M.M.A. and E.D.A.; supervision, O.J.G.; project administration, O.J.G.; funding acquisition, O.J.G. All authors have read and agreed to the published version of the manuscript.

Funding

This research was funded by the M2A funding from the European Social Fund via the Welsh Government (c80816), the Engineering and Physical Sciences Research Council (Grant Ref: EP/S02252X/1) and Knowledge Economy Skills Scholarships (KESS), Innovate UK project 102877. Avenues of Commercialisation of Nano & Micro Technologies (ACNM) Operation funded by the European Regional Development Fund via the Welsh Government. Application Specific Semiconductor Etch Technologies (ASSET) Project funded by the European Regional Development Fund via the Welsh Governments Smart Expertise Operation. Knowledge Transfer Partnership Associate (Project number 011971) funded by Innovate UK and SPTS Technologies Ltd. Fabrication aided by Centre for NanoHealth technical team. The authors would like to acknowledge support of this work by SPTS Technologies Ltd. and Pegasus Chemicals Ltd.

Institutional Review Board Statement

Not applicable.

Informed Consent Statement

Not applicable.

Data Availability Statement

Data available upon request.

Acknowledgments

The authors would also like to acknowledge Biovici Ltd. for use of their ‘Sensor-Connect’ technology for real-time resistance measurements.

Conflicts of Interest

The authors declare no conflict of interest.

References

  1. Korsching, S.I. Olfactory Receptors, 2nd ed.; Elsevier: Amsterdam, The Netherlands, 2013; Volume 3. [Google Scholar]
  2. Zozulya, S.; Echeverri, F.; Nguyen, T. The human olfactory receptor repertoire. Genome Biol. 2001, 2, 1–12. [Google Scholar] [CrossRef]
  3. Park, J.; Lim, J.H.; Jin, H.J.; Namgung, S.; Lee, S.H.; Park, T.H.; Hong, S. A bioelectronic sensor based on canine olfactory nanovesicle–carbon nanotube hybrid structures for the fast assessment of food quality. Analyst 2012, 137, 3249–3254. [Google Scholar] [CrossRef] [PubMed]
  4. Marshall, B.; Warr, C.G.; De Bruyne, M. Detection of Volatile Indicators of Illicit Substances by the Olfactory Receptors of Drosophila melanogaster. Chem. Senses 2010, 35, 613–625. [Google Scholar] [CrossRef] [PubMed] [Green Version]
  5. Sarafoleanu, C.; Mella, C.; Georgescu, M.; Perederco, C. The importance of the olfactory sense in the human behavior and evolution. J. Med. Life 2009, 2, 196–198. [Google Scholar]
  6. Bushdid, C.; Magnasco, M.O.; Vosshall, L.B.; Keller, A.; Mixture, M. 1 Trillion Olfactory Stimuli. Science 2016, 343, 1370–1373. [Google Scholar] [CrossRef] [PubMed] [Green Version]
  7. Venthur, H.; Zhou, J.-J. Odorant Receptors and Odorant-Binding Proteins as Insect Pest Control Targets: A Comparative Analysis. Front. Physiol. 2018, 9, 1163. [Google Scholar] [CrossRef]
  8. Hopf, T.A.; Morinaga, S.; Ihara, S.; Touhara, K.; Marks, D.S.; Benton, R. Amino acid coevolution reveals three-dimensional structure and functional domains of insect odorant receptors. Nat. Commun. 2015, 6, 1–7. [Google Scholar] [CrossRef] [Green Version]
  9. Firestein, S. How the olfactory system makes sense of scents. Nat. Cell Biol. 2001, 413, 211–218. [Google Scholar] [CrossRef] [PubMed]
  10. Robin, S.; Tacher, S.; Rimbault, M.; Vaysse, A.; Dréano, S.; André, C.; Hitte, C.; Galibert, F. Genetic diversity of canine olfactory receptors. BMC Genom. 2009, 10, 21. [Google Scholar] [CrossRef] [Green Version]
  11. Malnic, B.; Hirono, J.; Sato, T.; Buck, L.B. Combinatorial Receptor Codes for Odors. Cell 1999, 96, 713–723. [Google Scholar] [CrossRef] [Green Version]
  12. Purves, D.; Augustine, G.; Fitzpatrick, D. Odorant receptors and olfactory coding. In Neuroscience, 2nd ed.; Sinauer Associates: Sunderland, MA, USA, 2001. [Google Scholar]
  13. Archunan, G. Odorant Binding Proteins: A key player in the sense of smell. Bioinformation 2018, 14, 36–37. [Google Scholar] [CrossRef] [Green Version]
  14. Gardner, J.; Bartlett, P.N. A brief history of electronic noses. Sens. Actuators B Chem. 1994, 18, 210–211. [Google Scholar] [CrossRef]
  15. Purves, D.; Augustine, G.; Fitzpatrick, D. The Transduction of Olfactory Signals. In Neuroscience, 2nd ed.; Sinauer Associates: Sunderland, MA, USA, 2001. [Google Scholar]
  16. Hou, Y.; Jaffrezic-Renault, N.; Martelet, C.; Zhang, A.; Minic-Vidic, J.; Gorojankina, T.; Persuy, M.-A.; Pajot-Augy, E.; Salesse, R.; Akimov, V.; et al. A novel detection strategy for odorant molecules based on controlled bioengineering of rat olfactory receptor I7. Biosens. Bioelectron. 2007, 22, 1550–1555. [Google Scholar] [CrossRef]
  17. Lee, S.H.; Jin, H.J.; Song, H.S.; Hong, S.; Park, T.H. Bioelectronic nose with high sensitivity and selectivity using chemically functionalized carbon nanotube combined with human olfactory receptor. J. Biotechnol. 2012, 157, 467–472. [Google Scholar] [CrossRef] [PubMed]
  18. Jin, H.J.; Lee, S.H.; Kim, T.H.; Park, J.; Song, H.S.; Park, T.H.; Hong, S. Nanovesicle-based bioelectronic nose platform mimicking human olfactory signal transduction. Biosens. Bioelectron. 2012, 35, 335–341. [Google Scholar] [CrossRef]
  19. Larisika, M.; Kotlowski, C.; Steininger, C.; Mastrogiacomo, R.; Pelosi, P.; Schütz, S.; Peteu, S.F.; Kleber, C.; Reiner-Rozman, C.; Nowak, C.; et al. Electronic Olfactory Sensor Based on A. mellifera Odorant-Binding Protein 14 on a Reduced Graphene Oxide Field-Effect Transistor. Angew. Chem. 2015, 54, 13245–13248. [Google Scholar] [CrossRef]
  20. Kotlowski, C.; Larisika, M.; Guerin, P.M.; Kleber, C.; Kröber, T.; Mastrogiacomo, R.; Nowak, C.; Pelosi, P.; Schütz, S.; Schwaighofer, A.; et al. Fine discrimination of volatile compounds by graphene-immobilized odorant-binding proteins. Sens. Actuators B Chem. 2018, 256, 564–572. [Google Scholar] [CrossRef]
  21. Kim, T.H.; Lee, S.H.; Lee, J.; Song, H.S.; Oh, E.H.; Park, T.H.; Hong, S. Single-Carbon-Atomic-Resolution Detection of Odorant Molecules using a Human Olfactory Receptor-based Bioelectronic Nose. Adv. Mater. 2009, 21, 91–94. [Google Scholar] [CrossRef]
  22. Liu, Q.; Wang, H.; Li, H.; Zhang, J.; Zhuang, S.; Zhang, F.; Hsia, K.J.; Wang, P. Impedance sensing and molecular modeling of an olfactory biosensor based on chemosensory proteins of honeybee. Biosens. Bioelectron. 2013, 40, 174–179. [Google Scholar] [CrossRef] [PubMed]
  23. Lu, Y.; Yao, Y.; Li, S.; Zhang, Q.; Liu, Q. Olfactory biosensor based on odorant-binding proteins of Bactrocera dorsalis with electrochemical impedance sensing for pest management. Sens. Rev. 2017, 37, 396–403. [Google Scholar] [CrossRef]
  24. Ravina, R.; Dalal, A.; Mohan, H.; Prasad, M.; Pundir, C. Detection methods for influenza A H1N1 virus with special reference to biosensors: A review. Biosci. Rep. 2020, 40, BSR20193852. [Google Scholar] [CrossRef] [Green Version]
  25. Lim, H.J.; Saha, T.; Tey, B.T.; Tan, W.S.; Wei, O.C. Quartz crystal microbalance-based biosensors as rapid diagnostic devices for infectious diseases. Biosens. Bioelectron. 2020, 168, 112513. [Google Scholar] [CrossRef]
  26. Wasilewski, T.; Szulczyński, B.; Wojciechowski, M.; Kamysz, W.; Gębicki, J. A Highly Selective Biosensor Based on Peptide Directly Derived from the HarmOBP7 Aldehyde Binding Site. Sensors 2019, 19, 4284. [Google Scholar] [CrossRef] [Green Version]
  27. Wasilewski, T.; Szulczyński, B.; Wojciechowski, M.; Kamysz, W.; Gębicki, J. Determination of long-chain aldehydes using a novel quartz crystal microbalance sensor based on a biomimetic peptide. Microchem. J. 2020, 154, 104509. [Google Scholar] [CrossRef]
  28. Yu, S.; Wang, Z.; Gao, L.; Zhang, B.; Wang, L.; Kong, J.; Li, L. A Highly Selective and Sensitive Peptide-Based Fluorescent Ratio Sensor for Ag+. J. Fluoresc. 2021, 31, 237–246. [Google Scholar] [CrossRef]
  29. Ahn, S.R.; An, J.H.; Lee, S.H.; Song, H.S.; Jang, J.; Park, T.H. Peptide hormone sensors using human hormone receptor-carrying nanovesicles and graphene FETs. Sci. Rep. 2020, 10, 388. [Google Scholar] [CrossRef] [PubMed]
  30. Marconcini, P.; Macucci, M. Approximate calculation of the potential profile in a graphene-based device. IET Circuits Devices Syst. 2015, 9, 30–38. [Google Scholar] [CrossRef] [Green Version]
  31. Singh, V.; Joung, D.; Zhai, L.; Das, S.; Khondaker, S.I.; Seal, S. Graphene based materials: Past, present and future. Prog. Mater. Sci. 2011, 56, 1178–1271. [Google Scholar] [CrossRef]
  32. Teixeira, S.; Conlan, R.; Guy, O.J.; Sales, M.G.F. Label-free human chorionic gonadotropin detection at picogram levels using oriented antibodies bound to graphene screen-printed electrodes. J. Mater. Chem. B 2014, 2, 1852–1865. [Google Scholar] [CrossRef] [Green Version]
  33. Walters, F.; Rozhko, S.; Buckley, D.; Ahmadi, E.D.; Ali, M.; Tehrani, Z.; Mitchell, J.J.; Burwell, G.; Liu, Y.; Kazakova, O.; et al. Real-time detection of hepatitis B surface antigen using a hybrid graphene-gold nanoparticle biosensor. 2D Mater. 2020, 7, 024009. [Google Scholar] [CrossRef]
  34. Walters, F.; Ali, M.M.; Burwell, G.; Rozhko, S.; Tehrani, Z.; Ahmadi, E.D.; Evans, J.E.; Abbasi, H.Y.; Bigham, R.; Mitchell, J.J.; et al. A Facile Method for the Non-Covalent Amine Functionalization of Carbon-Based Surfaces for Use in Biosensor Development. Nanomaterials 2020, 10, 1808. [Google Scholar] [CrossRef] [PubMed]
  35. Ferrari, A.C.; Basko, D.M. Raman spectroscopy as a versatile tool for studying the properties of graphene. Nat. Nanotechnol. 2013, 8, 235–246. [Google Scholar] [CrossRef] [PubMed] [Green Version]
  36. Lin-Vien, D.; Colthup, N.B.; Fateley, W.G.; Grasselli, J.G. Aromatic and Heteroaromatic Rings. In The Handbook of Infrared and Raman Characteristic Frequencies of Organic Molecules; Elsevier: Amsterdam, The Netherlands, 1991; pp. 277–306. [Google Scholar]
  37. Lin-Vien, D.; Colthup, N.B.; Fateley, W.G.; Grasselli, J.G. Compounds Containing the Carbonyl Group. In The Handbook of Infrared and Raman Characteristic Frequencies of Organic Molecules; Elsevier: Amsterdam, The Netherlands, 1991; pp. 117–154. [Google Scholar]
  38. Vincent, T.; Panchal, V.; Booth, T.; Power, S.R.; Jauho, A.; Antonov, V.; Kazakova, O. Probing the nanoscale origin of strain and doping in graphene-hBN heterostructures. 2D Mater. 2019, 6, 015022. [Google Scholar] [CrossRef] [Green Version]
  39. Casiraghi, C.; Pisana, S.; Novoselov, K.; Geim, A.K.; Ferrari, A.C. Raman fingerprint of charged impurities in graphene. Appl. Phys. Lett. 2007, 91, 233108. [Google Scholar] [CrossRef] [Green Version]
  40. Neumann, C.; Reichardt, S.; Venezuela, P.; Droegeler, M.; Banszerus, L.; Schmitz, M.; Watanabe, K.; Taniguchi, T.; Mauri, F.; Beschoten, B.; et al. Raman spectroscopy as probe of nanometre-scale strain variations in graphene. Nat. Commun. 2015, 6, 8429. [Google Scholar] [CrossRef] [PubMed] [Green Version]
  41. Sitsanidis, E.D.; Schirmer, J.; Lampinen, A.; Mentel, K.K.; Hiltunen, V.-M.; Ruokolainen, V.; Johansson, A.; Myllyperkiö, P.; Nissinen, M.; Pettersson, M. Tuning protein adsorption on graphene surfaces via laser-induced oxidation. Nanoscale Adv. 2021, 3, 2065–2074. [Google Scholar] [CrossRef]
  42. Pinto, H.; Markevich, A. Electronic and electrochemical doping of graphene by surface adsorbates. Beilstein J. Nanotechnol. 2014, 5, 1842–1848. [Google Scholar] [CrossRef] [Green Version]
  43. Yoon, H.; Lee, S.H.; Kwon, O.S.; Song, H.S.; Oh, E.H.; Park, T.H.; Jang, J. Polypyrrole Nanotubes Conjugated with Human Olfactory Receptors: High-Performance Transducers for FET-Type Bioelectronic Noses. Angew. Chem. 2009, 121, 2793–2796. [Google Scholar] [CrossRef]
  44. Neuhaus, E.M.; Mashukova, A.; Zhang, W.; Barbour, J.; Hatt, H. A Specific Heat Shock Protein Enhances the Expression of Mammalian Olfactory Receptor Proteins. Chem. Senses 2006, 31, 445–452. [Google Scholar] [CrossRef] [PubMed] [Green Version]
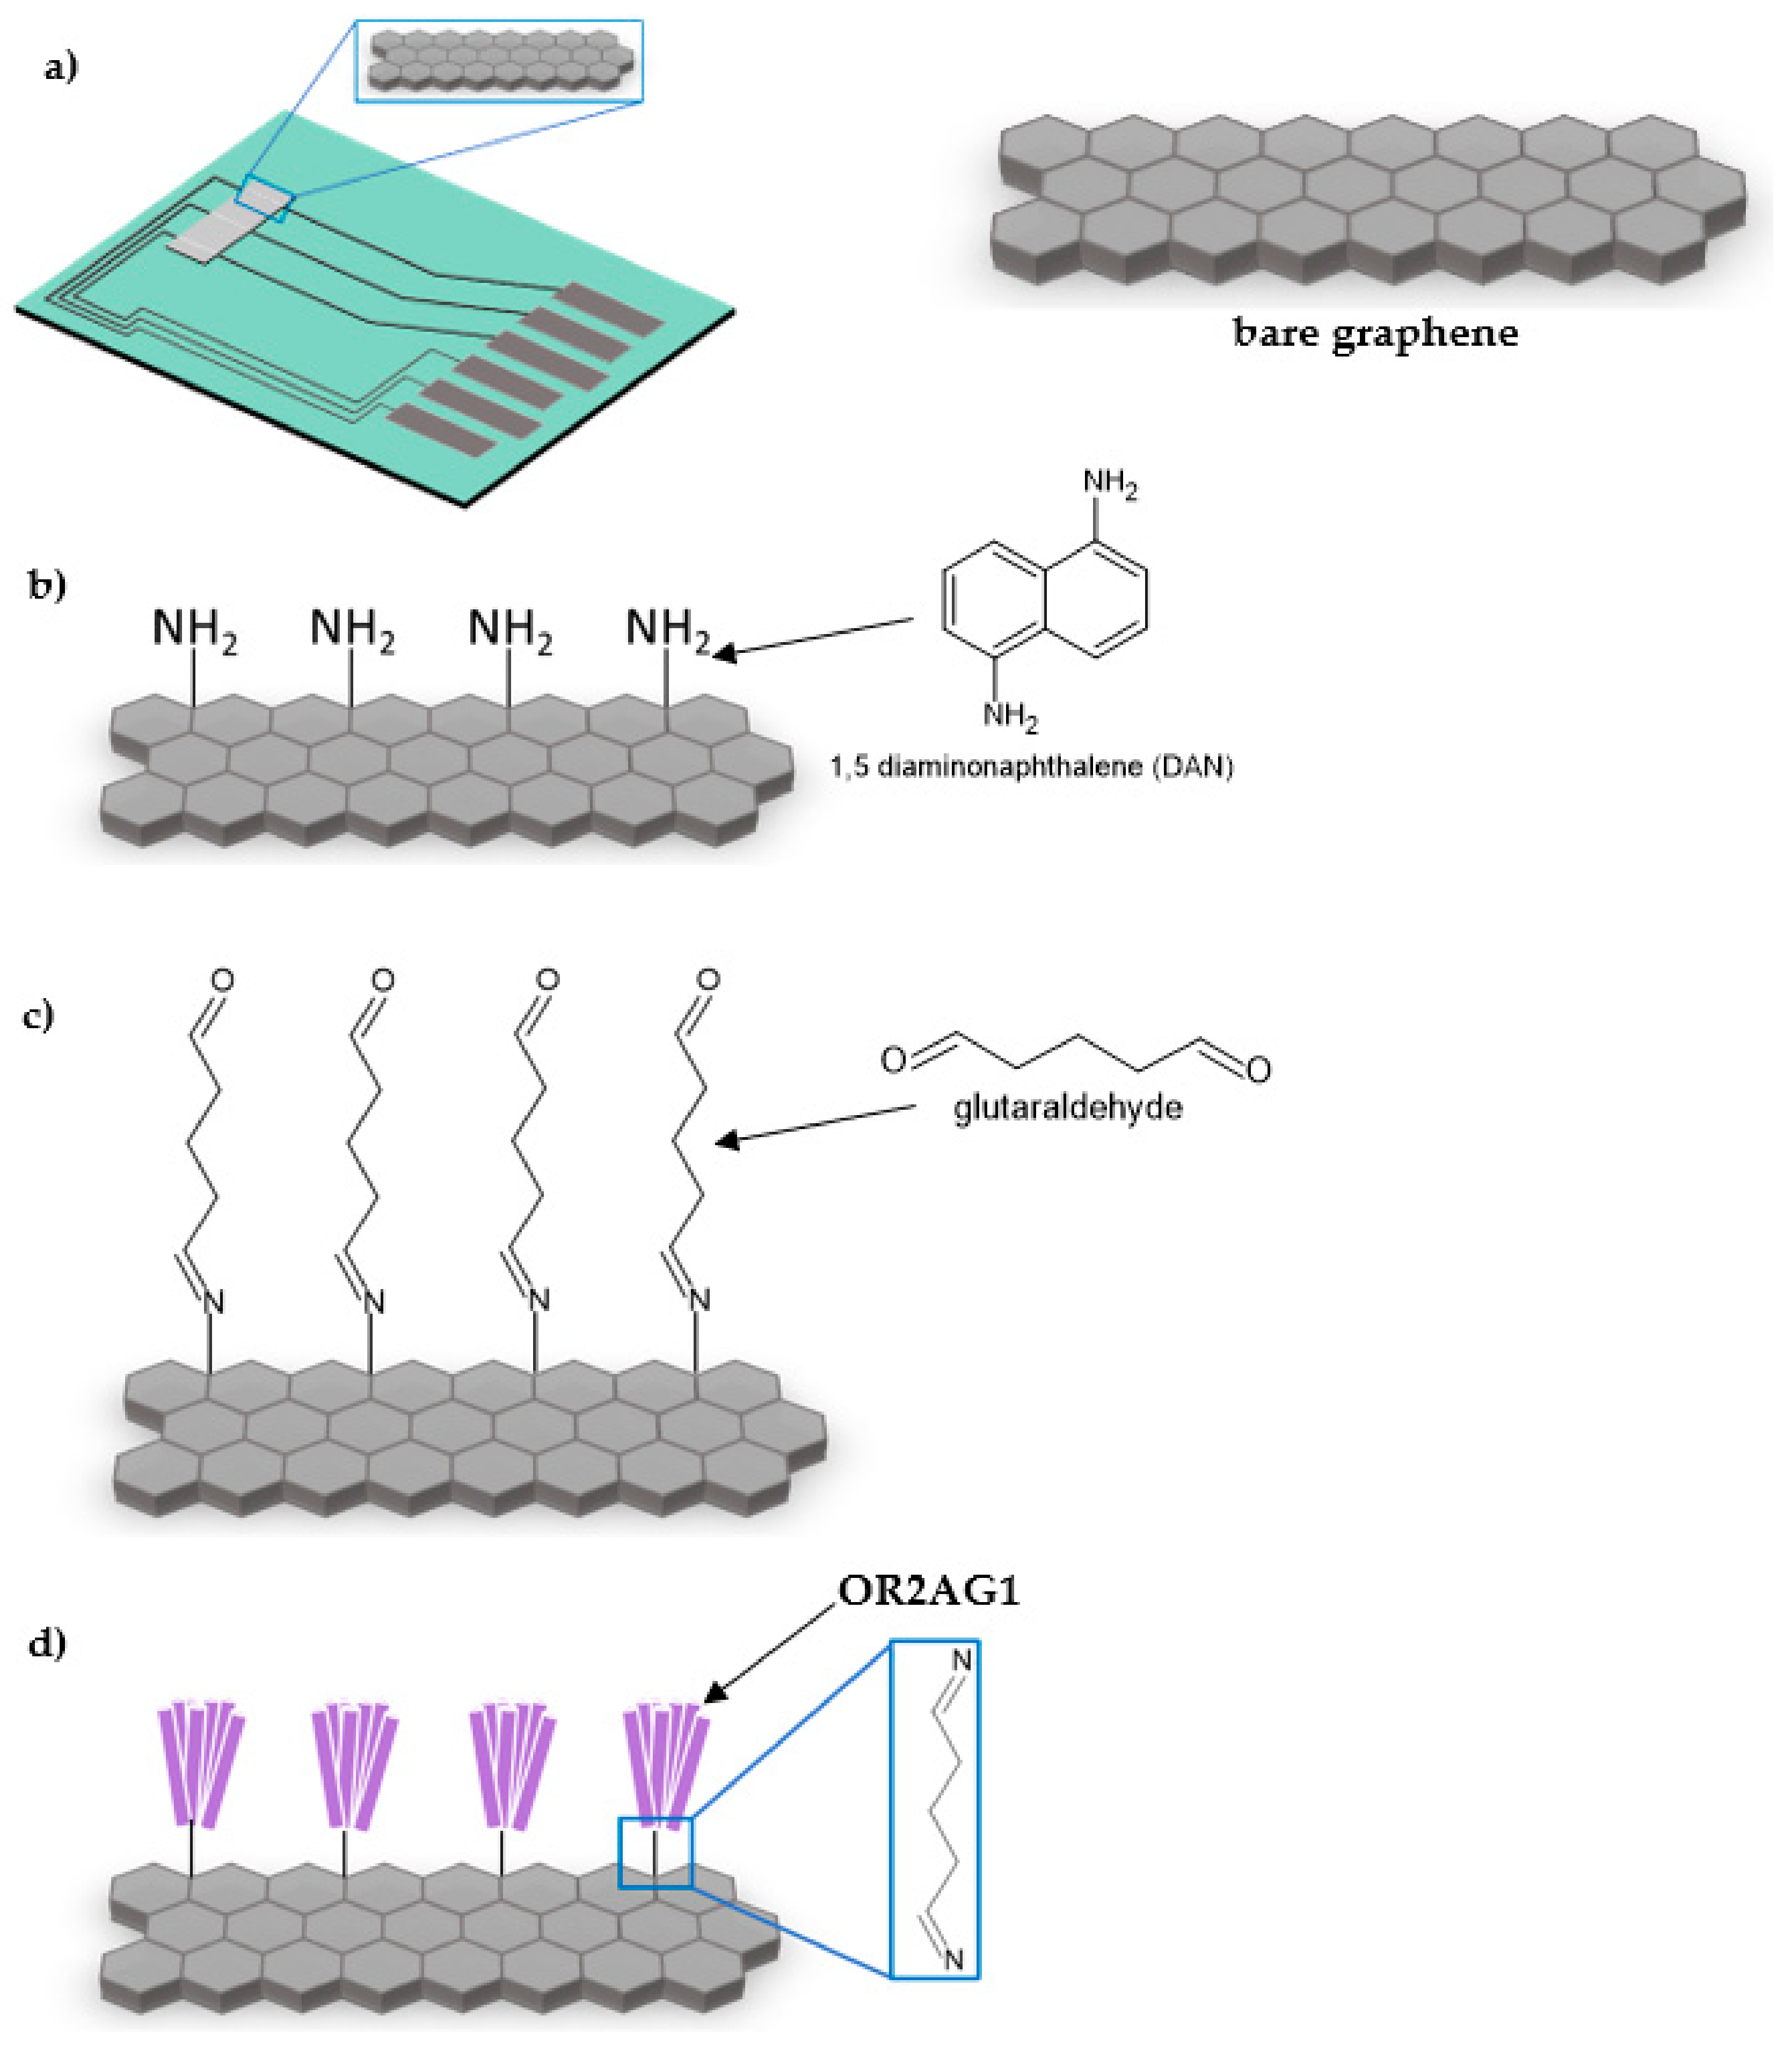
Figure 1. Functionalization of graphene: (a) schematic of graphene resistor chip (18,200 µm × 9700 µm), (b) 1,5 diaminonaphthalene chemical modification of the bare graphene surface, (c) addition of glutaraldehyde, (d) immobilization of olfactory receptor 2AG1.
Chemosensors 09 00174 g001
Figure 2. Image of a passivated chip in the Biovici ‘Sensor-Connect’ connector for real-time resistance measurements.
Chemosensors 09 00174 g002
Figure 3. Schematic representation of signal transduction in the bioelectronic nose.
Chemosensors 09 00174 g003
Figure 4. Representative AFM morphology of the (a) the non-functionalized (intrinsic graphene) surface, and (b) the functionalized graphene surface with DAN.
Chemosensors 09 00174 g004
Figure 5. (a) Raman spectroscopy of unmodified graphene (red) and graphene after each functionalization step (drop-casting of DAN (blue), followed by glutaraldehyde attachment (green) and lastly OR2AG1 protein receptor (pink). (b) Scatter plot showing the shifting in the G-peak and 2D-peak positions, at each functionalization stage, unmodified graphene (red), drop-cast DAN (dark blue), glutaraldehyde attachment (green) and OR2AG1 protein receptor (light blue), indicative of changes in doping and applied strain of the graphene structure, after each functionalization stage.
Chemosensors 09 00174 g005
Figure 6. Real-time resistance measurements of the graphene functionalization process, where ΔR/R0 = Rdevice – R0/R0, and R0 is the resistance at T = 0 (resistance of bare (intrinsic) graphene).
Chemosensors 09 00174 g006
Figure 7. Structure of (a) amyl butyrate (target odorant), (b) pentyl valerate, (c) butyl butyrate and (d) propyl butyrate.
Chemosensors 09 00174 g007
Figure 8. (a) Real-time resistance measurements of the OR2AG1 functionalized sensor, where ΔR/R0 = Rdevice − R0/R0, and R0 is the resistance at T = 0 (resistance of OR2AG1 functionalized graphene). A concentration range of 10−15 to 10−6 M in PBS was used for the target odorant, amyl butyrate (AB), and 10−6 M in PBS was used for pentyl valerate (PV) and butyl butyrate (BB) controls (all prepared using 1 M stock solutions in DMSO). (b) Picomolar amyl butyrate concentration (logarithmic scale) plotted against resistance with inset error bars. (c) Picomolar amyl butyrate concentration (logarithmic scale) repeat with additional concentrations (0.1, 0.2, 0.3, 0.4, 0.75, 250, 500 pM) plotted against resistance with inset error bars. (d) Real-time reaction time graph showing response time after adding the target odorant (amyl butyrate, 0.5 pM). (e) Selectivity graph of the negative controls (1 µM PV, BB, PB) and target odorant (1 µM AB) with respect to PBS.
Chemosensors 09 00174 g008
Publisher’s Note: MDPI stays neutral with regard to jurisdictional claims in published maps and institutional affiliations.