Abstract
This paper describes the sensitive properties of screen-printed carbon electrodes (SPCE) modified by using three different electroactive chemical compounds: Meldola’s Blue, Cobalt Phthalocyanine and Prussian Blue, respectively. It was demonstrated that the Prussian Blue (PB) modified SPCE presented electrochemical signals with the highest performances in terms of electrochemical process kinetics and sensitivity in all the solutions analyzed. PB-SPCE was demonstrated to detect Phe through the influence it exerts on the redox processes of PB. The PB-SPCE calibration have shown a linearity range of 0.33–14.5 µM, a detection limit (LOD) of 1.23 × 10⁻⁸ M and the standard deviation relative to 3%. The PB-SPCE sensor was used to determine Phe by means of calibration and standard addition techniques on pure samples, on simple pharmaceutical samples or on multicomponent pharmaceutical samples. Direct determination of the concentration of 4 × 10⁻⁶–5 × 10⁻⁵ M Phe in KCl solution showed that the analytical recovery falls in the range of 99.75–100.28%, and relative standard deviations in the range of 2.28–3.02%. The sensors were successfully applied to determine the Phe in pharmaceuticals. The validation of the method was performed by using the FTIR, and by comparing the results obtained by PB-SPCE in the analysis of three pharmaceutical products of different concentrations with those indicated by the producer.
1. Introduction
Metabolic diseases are genetic disorders related to the metabolic pathways of some compounds from food. Such diseases are due to hereditary factors, and these could be diagnosed from birth, and are also related to other diseases occurring during a lifetime, and are identified after the appearance of specific symptoms [1,2].
The classification of metabolic diseases is based on symptoms, prognosis and evolution, taking into account the main molecule which is affected (organic acids, fatty acids, carbohydrates and amino acids) and which may cause diseases such as amino acidurias [3,4]. Being considered as the most harmful metabolic diseases due, mainly, to the risky effects on newborns, amino acid related diseases are classified into: phenylketonuria (PKU), tyrosinemia, homocystinuria, arginase deficiencies and urine diseases with the smell of maple syrup. These diseases are caused by high levels of amino acid (AAs) concentrations: phenylalanine (Phe), tyrosine (Tyr), methionine (Met), arginine (Arg), Leucine (Leu), Isoleucine (Ile) and Valine (Val). The clinical symptoms of metabolic diseases may be detected right from birth, in certain cases, but also during a lifetime, by using various methods of identification [5]. Most manifestations due to the lack or impairment of these AAs lead to dementia, mental problems such as intellectual disability in newborns, mood disorder, Parkinson’s disease, rickets, liver damage, hepatocellular carcinoma and even death without treatment in the first days of life [4,5]. Moreover, the lack of these AAs may lead to depression, hypochondria or albinism [5,6].
The most common and widespread metabolic disease is PKU, which is due either to the lack of phenylalanine hydroxylase (PAH) or to its low level in the blood. This enzyme is necessary for converting the essential AA Phe into another AA called Tyr aspect, which explains why Phe is one of the most studied AAs [6]. The PKU level may be detected as early as the neonatal period, the detection of PKU markers in biological fluids being performed mainly by using high performance liquid chromatography (HPLC) or gas chromatography-mass spectrometry (GC-MS) [7,8,9,10,11,12,13,14,15,16,17,18]. The method for determining PKU, which is considered outdated today, due to the long time required for sample processing and to its ineffectiveness in the case of antibiotic treatment. It is a bacterial inhibition screening test, which uses Bacillus subtilis [19]. However, there are other methods for determining PKU such as: enzymatic activity tests [3,20,21], capillary electrophoresis coupled with laser-induced fluorescence or electrochemical detection [22,23,24], as well as genetic tests [25].
Many of the methods mentioned above are unsuitable for point-of-care testing (POC), due to their implying numerous processing stages, a long time for analysis, to their being tedious, not portable and rather expensive, and to their requiring highly-specialized personnel. The need to detect metabolic diseases as quickly as possible has favored the development and application of numerous testing methods, but the differences regarding neonatal screening criteria used in various countries and even in the same country have made diagnosis difficult [1,5].
Considering the advantages of electrochemical techniques, namely: their simplicity, excellent potential for miniaturization, easy operation, low cost and high sensitivity [26,27], such techniques represent a major research topic. In fact, the low detection limit obtained by using these methods has determined numerous researchers to study AAs. On the other hand, electrochemical methods have a series of limitations on the electrochemical determination of AAs, the facts being observed that electron transfer, sensitivity and reproducibility are low, stability is low for numerous solutions and detection potential is high [28]. Therefore, the use of chemically-modified electrodes (CMEs) for AAs detection could be a feasible alternative [29,30].
A wide variety of sensitive surface modifications have been suggested in order to improve the electroanalytical parameters of CME, among which coating with molecularly printed polymers (MIPs) [31]. A study conducted by Shin-Hong Ou et al. on an electrochemical sensor using MIP for the enantioselective D-Phe and L-Phe recognition demonstrated that the use of polypyrrole as a conductive polymer may change an electron from the polymer chain during the electrochemical reaction [32]. MIPs offer a series of advantages in the analysis of AAs, such as high sensitivity, short response time, simplicity, portable instruments [33,34]. Nevertheless, such sensors have some drawbacks, such as the relatively complicated manufacturing method, the long time required for individual determinations, the incompatibility with some aqueous solutions, the limited number of templates and their low specificity. The most problematic aspect in the case of this method concerns the stability and maintenance of the imprinted molecule recognition capacity [35].
Sensors based on other sensitive materials have been developed. For example, Yulong Wang et al. studied the electrochemical detection of 4 AAs: L-cysteine (L-Cys), L-Tryptophan (L-Trp), L-Alanine (L-Ala) and L-Phe with a new electrochemical sensor based on carbon modified with LaNi0.5Ti0.5O3 perovskite, obtaining good results in optimal conditions [1]. Qing Bi et al. developed a novel sensor based on 2,2,6,6-tetramethylpiperidine-1-oxyl (TEMPO)-oxidized cellulose nanocrystals (TOCNCs) L-Cys modified Au electrode (TOCNC/L-Cys/Au electrode), for the detection of chiral isomers of Phe [36]. However, CMEs based on screen-printed electrodes (SPE) modified with electroactive compounds could be an alternative to the sensors developed to date for the detection of Phe. Such electrodes have numerous advantages, which support their applicability in various fields, such as pharmacy, medicine, chemistry, biology and environmental. The benefits of these devices are: low cost, accessibility of use, high manufacturing reproducibility, small size, lack of contamination, suitability when working with small volumes and adequate analytical characteristics [34].
Meldola’s Blue, Cobalt Phthalocyanine and Prussian Blue are electroactive compounds of interest for the development of sensors. An electrode modified with Meldola’s Blue was used in the development of biosensors based on dehydrogenase, due to its ability to mediate the oxidation of nicotinamide adenine dinucleotides [37,38,39,40,41,42,43]. Cobalt Phthalocyanine, an organic semiconductor ensuring sensor stability and sensitivity is another modifier used in the development of CMEs [44,45,46,47]. Due to its chemical composition, Prussian Blue has very good electrochemical properties, being most frequently used in the manufacture of electrochemical (bio)sensors detecting hydrogen peroxide [48,49,50,51,52,53,54,55,56]. These electroactive materials could be used for the development of novel electrochemical sensors for different analysts of great importance such is Phe.
The use of these electroactive materials as modifiers of SPEs for detection of Phe could increase the performance characteristics of the electrochemical sensors. Therefore, the aim of this work is to develop and characterize electrochemical sensors based on SPEs modified with three electroactive compounds (Prussian Blue, Cobalt Phthalocyanine, Meldola’s Blue), and to establish their capability of detecting Phe in pharmaceutical samples.
2. Materials and Methods
2.1. Equipment
An SP 150 potentiostat/galvanostat Biological Science Instrument controlled by the EC-Lab Express software was used to perform the electrochemical experiments. An electrochemical cell (15 mL) with these three electrodes (reference electrode, auxiliary electrode and working electrode) printed on the same device was connected to potentiostat/galvanostat via the special-connector cable (Dropsens, Spain).
The Elmasonic S10H ultrasonic bath (Elma Schmidbauer GmbH, Singen, Germany) was used to dissolve the compounds and homogenize the solutions. The analytical balance AS 60/220.R2 (SC Partner Corporation SRL, Bucharest, Romania) was used for weighing the compounds.
The FTIR spectra were acquired with a Bruker ALPHA FT-IR spectrometer (BrukerOptik GmbH, Ettlingen, Germany) using OPUS software (BrukerOptik GmbH, Ettlingen, Germany) in the range of 4000–500 cm−1 (32 scans, 4 cm−1 resolution) in the attenuated total reflectance (ATR) mode. The ATR ZnSe crystal was carefully cleaned with ultrapure water and isopropanol between measurements. The background was the spectrum obtained in the air (ATR ZnSe crystal).
2.2. Electrodes
The determination of Phe was made using SPCE (DRP-C110 working in solution) purchased from Metrohm-DropSens (Llanera, Spain) with the following characteristics: ceramic substrates—L 33 mm × W 10 mm × H 0.5 mm; electric contacts—silver. The carbon auxiliary electrode and the silver/silver chloride reference electrode were integrated in the device. The working electrode was modified with 3 commercial electroactive substances: Meldola’s blue—8-Dimethylamino-2,3-benzophenoxazine heme (zinc chloride) salt, Cobalt (II) phthalocyanine and Prussian Blue—Iron (III) hexacyanoferrate (II) hydrate, purchased of the Sigma-Aldrich (St. Louis, MO, USA). Electrode modification was performed with 10 mg × mL−1 solutions of the compounds in chloroform by using the drop-and-dry method. A total of 10 μL of solution was added to the working electrode surface in two stages, followed by evaporation of the solvent at room temperature [57].
The three types of chemically modified electrodes were obtained: CoPc-SPCE modified with Cobalt Phthalocyanine, MB-SPCE modified with Meldola’s Blue and PB-SPCE modified with Prussian Blue. The FTIR spectra of the active layer of the sensors is presented in the Figure S1.
These electrodes were made and used in the present study taking into account the nature and specific properties of the electroactive chemical compound immobilized in the working electrode, but also the fact that Phe is an electrochemically-inactive compound.
2.3. Reagents and Solutions
The reagents used were purchased from Sigma-Aldrich (St. Louis, MO, USA) and used without further purification. The solutions used: 10−1 M potassium chloride (KCl), potassium ferrocyanide, 10−3 M K4[Fe(CN)6]–10−1 M KCl, and aqueous solution of 10−3 M Phe—10−1 M KCl were prepared with ultrapure water with resistivity 18.3 MΩ × cm (Milli-Q Simplicity® Purification Water System, Bedford, MA, USA). The solutions with lower concentrations used were obtained by diluting the stock solutions with 10−1 M KCl solution.
In order to validate the method, three pharmaceutical products were analyzed, namely: L-Phenylalanine 500 mg capsules (Solaray), DLPA 500 mg—DL—phenylalanine free form—herbal capsules (Solgar) and Amino 75 containing essential amino acids free form (Solgar)—herbal capsules containing AA L-Phe in a concentration of 75 mg together with L-lysine 75 mg, L-leucine 75 mg, L-valine 75 mg, L-methionine 75 mg, L-histidine 75 mg, L-isoleucine 75 mg and L-threonine 75mg. The value obtained by using the electroanalytical method was compared with the value indicated by manufactures.
In the case of electrochemical studies, the pharmaceuticals were weighed and dissolved in 10−1 M KCl solution. The solutions were homogenized by ultrasonication and the insoluble fraction was separated by filtration. The preparation of the solutions was carried in three stages for each pharmaceutical product in order to solve entire Phe from the samples.
2.4. Methodology
Cyclic voltammetry (CV) was used as detection method for the study of SPCEs electrochemical behavior in KCl, K4[Fe(CN)6] and Phe solutions [58].
The cyclic voltammograms allowed for a comparison of the sensors in the 3 solutions, and the calculation of the active area or of the diffusion coefficient based on the Randles–Sevcik equation:
where Ip represents the current corresponding to peak (A), z—the number of electrons involved in the redox half-reaction, A—the electrode surface (cm2), D—the diffusion coefficient (cm2 × s−1), ν—the scan rate (V × s−1), C—concentration in mmole × L−1 [59].
Ip = (2.69 × 10⁵) × z3/2 × A × C × D1/2 × ν1/2
The parameters of the voltammetric technique were: initial potential 0.0 V, positive vertex potential +1.3 V, negative vertex potential −0.4 V and the scan rate was between 0.1 and 1.0 V × s−1. 5 cycles were recorded in the solution to be analyzed in order to stabilize the sensor signals.
The results obtained from the electrochemical measurements were observed, analyzed and processed by using EC-Lab Express, Origin and Microsoft Excel software.
3. Results and Discussions
3.1. Electrochemical Responses of SPEs in 10−1 M KCl Solution
KCl is a solution often used in the field of electrochemistry for the storage and activation of electrodes, due to its having the role of neutralizing or diluting the contamination of the electrodes through the frit. This solution is also used as a point of reference, being electrochemically inactive [57].
The voltammetric responses of the three sensors were recorded in the 10−1 M KCl solution with different scan rate and in various potential areas. Well-defined signals were obtained, with little background noise when the scan rate was 0.6 V × s−1. The optimal potential range was from −0.4 V to +1.3 V. The results obtained are shown in Figure S2.
As illustrated in Figure S2a,b, no clear oxidation or reduction peaks were observed in this potential range, demonstrating that the electrochemical processes of CoPc and MB, respectively, immobilized in electrodes are not favored in this electrolyte and in the potential range used.
Figure S2c, on the other hand, shows two anodic peaks at the potentials 0.221 V and 0.855 V, and two cathode peaks at −0.009 V and 0.676 V. The values obtained from the cyclic voltammogram of PB-SPCE are included in Table S1. In order to centralize the results obtained with Modified PB-SPCEs, the following parameters were determined from the CV: anodic peak potential (Epa), cathodic peak potential (Epc), anodic peak intensity (Ipa) and cathodic peak intensity (Ipc), their values being presented in Table S1. E1/2, ΔEp and | Ipc/Ipa | were also calculated.
Since KCl is an electroinactive compound, the two pairs of peaks are due to the redox processes of PB immobilized in the screen-printed electrode. These two processes are presented in Scheme 1 [49]:
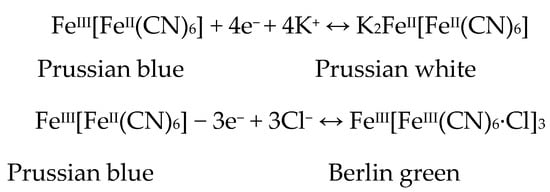
Scheme 1.
The redox processes of the PB (adapted from [49]).
The results correspond to those presented in other specific research studies, the differences being due to the particularity of the electrode (e.g., surface area, support material) and to the voltammetric technique (potential range, scan rate) [53,60].
The influence of the scan rate on the voltammetric responses of the sensors was achieved by recording the cyclic voltammograms of the modified SPCEs in 10−1 M KCl solution with scan rates in the range 0.1–1.0 V × s−1. The results obtained are shown in Figure 1.
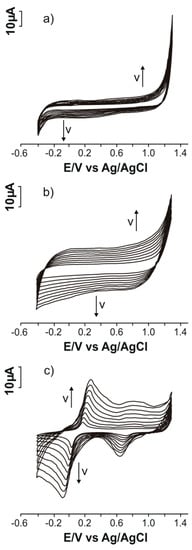
Figure 1.
Cyclic voltammograms obtained with modified screen-printed carbon electrodes (SPCEs) in 10−1 M KCl solution with scan rates in the range 0.1–1.0 V × s−1: (a) CoPc-SPCE; (b) MB-SPCE; (c) PB-SPCE.
Peak currents may be observed to increase when the scan rates increases. In Figure 1a,b, the processes which take place at the surface of the electrodes do not materialize in well-defined peaks as in Figure 1c for PB-SPCE, even at higher scan rates. The intensity of the anodic peak for PB-SPCE was plotted as a function of the scan rate, obtaining a linear regression with the scan rate, which demonstrates that the process is controlled by electron transfer [60]. The linear adjustment equation is Ipa = 0.0002292 × v–4.4914 × 10⁻⁶, with a coefficient of determination (R2) of 0.9983.
3.2. Electrochemical Responses of SPCEs in 10−3 M K4[Fe(CN)6]–10−1 M KCl Solution
K4[Fe(CN)6] shows redox activity and this aspect may be highlighted by carbon or noble metal electrodes using cyclic voltammetry when an anodic and a cathodic peak are obtained, due to the reversible oxidation of the ferrocyanide ion to ferricyanide [61,62].
The voltammetric responses in the 10−3 M K4[Fe(CN)6]–10−1 M KCl solution recorded by the three electrodes, at the same scan rate, in the same potential range considered and in the KCl solution, were well-defined and reproducible at a scan rate of 0.6 V × s−1 (Figure S3).
As illustrated in Figure S3, there is a clear difference between the redox processes seen in the CVs of the three modified SPCEs. More precisely, two peaks, one anodic and one cathodic, are observed in the case of CoPc-SPCE, and two pairs of redox peaks are observed in the case of MB-SPCE and PB-SPCE. Thus, the redox processes of the electroactive modifier present in the sensitive layer at the level of MB-SPCE and PB-SPCE are observed in addition to the ferrocyanide/ferricyanide redox process.
The process, in the case of MB, is presented in Scheme 2 [39].
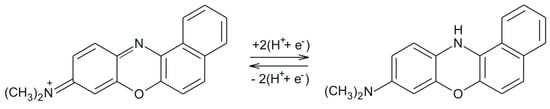
Scheme 2.
The redox processes of MB (adapted from [39]).
The results obtained for all electrodes immersed in a 10−3 M K4[Fe(CN)6]–10−1 M KCl solution are included in Table S2.
According to the results obtained from the electrochemical measurements, the fact may be noticed that MB-SPCE and PB-SPCE in Figure S3b,c have the best responses recorded by CV, where the activity of the MB and PB electroactive compounds with which the sensors were modified is observed in addition to the redox activity of the K4[Fe(CN)6] solution.
The Ipc/Ipa ratio is higher or lower than the ideal value 1, but close to it in the case of the PB-SPCE electrode (Ipc/Ipa is 1.05), proving that the process is quasi-reversible in the case of the PB-modified electrode. Similar results were obtained for other electrodes modified with CoPc, MB or PB [38,44,53].
The scan rate has an important role in the electrochemical determination of redox processes. Thus, the influence of the scan rate on the voltammetric responses of the sensors was achieved by recording cyclic voltamograms of SPCEs modified in 10−3 M K4[Fe(CN)6]–10−1 M KCl solution. These results are shown in Figure 2.
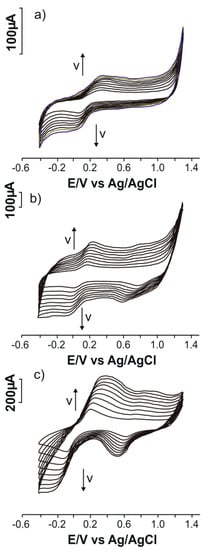
Figure 2.
Cyclic voltammograms obtained with the three modified SPCEs immersed in 10−3 M K4[Fe(CN)6]–10−1 M KCl solution with scan rates in the range 0.1–1.0 V × s−1: (a) CoPc-SPCE; (b) MB-SPCE; (c) PB-SPCE.
The recording of the sensor responses with different scan rates, i.e., between 0.1 and 1.0 V × s−1, was calculated the area of the electroactive surface of the electrodes. Thus, this area was calculated for the three SPCEs immersed in 10−3 M K4[Fe(CN)6]–10−1 M KCl solution. The calculation was made by using the Randles–Sevcik equation, presented in Section 2.4 [59].
Figure S4 shows the linear adjustment graphs between Ipa or Ipc and the square root of the scan rate for each electrode studied. In the case of the sensors modified with MB and PB, the most intense pair of peaks was used.
Figure S4 also shows that a series of linear dependencies are obtained in all cases, with coefficients of determination greater than 0.98. Therefore, according to the Randles–Sevcik equation, the oxidation of the ferrocyanide ion at the three electrodes is controlled by the diffusion process, and the peak intensities depend not only on the properties of the electroactive compounds on the electrode surface, such as concentration and diffusion, but also on the scan rate [63].
The active surface of the electrodes was calculated using the linear dependence equation between Ipa and v1/2. The results are detailed in Table 1.

Table 1.
The active surface areas and the roughness factors of the modified SPCEs.
According to the results presented in Table 1, the fact may be noticed that the values of the electroactive area of the sensors are higher than the geometric area, this being due to several factors which need to be taken into account, among which are: the degree of roughness, the degree of dispersion of the electroactive compound, compound activity etc. [50].
Considering the comparative analysis of the three SPCEs in K4[Fe(CN)6] solution, the results indicate that PB-SPCE has the highest value of the active area, and the peaks are the best defined and most intense, this SPCE having, accordingly, the highest sensitivity. Consequently, this sensor could be successfully applied to determine the essential AA Phe, an AA that is not electroactive, but which can affect the electrochemical processes of the modifying material of the sensitive element.
3.3. Electrochemical Responses of SPCEs Modified in 10−3 M Phe–10−1 M KCl Solution
Although Phe is an essential AA intensively studied by using various methods, the research performed by means of electrochemical methods based on voltammetric sensors modified with electroactive substances is limited. As a result, the study of the three modified SPCEs was completed by the analysis of the 10−3 M Phe solution dissolved in 10−1 M KCl in the potential range −0.4 V to +1.3 V, at scan rates varying between 0.1–1.0 V × s−1.
Figure 3 shows the cyclic voltammograms obtained by each modified SPCE immersed in Phe solution, at the optimal scan rate of 0.6 V × s−1.
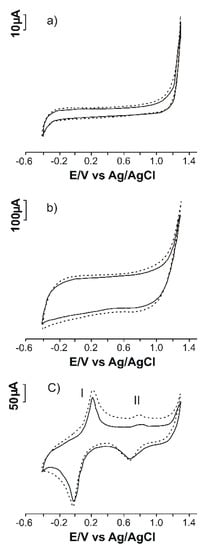
Figure 3.
Cyclic voltammograms of the (a) CoPc-SPCE; (b) MB-SPCE; (c) PB-SPCE immersed in 10−1 M KCl solution (dashed line) and 10−3 M Phe–10−1 M KCl solution (solid line) registered at 0.6 V × s−1.
According to Figure 3a,b, sensors CoPc-SPCE and MB-SPCE are less sensitive, the corresponding redox processes being irrelevant to the Phe study. On the other hand, PB-SPCE (Figure 3c) is very sensitive. It has two anodic peaks and two cathodic peaks, due to the redox processes of the electroactive compound with which the electrode was modified, all these peaks being influenced by Phe, which was present in the solution to be analyzed. Therefore, PB-SPCE will be used for Phe detection, being the most sensitive of the three electrodes. The peak intensities and potentials obtained by CV for the PB-SPCE sensor are detailed in Table S3.
By comparing the cyclic voltammograms obtained in KCl solution with those obtained in Phe–KCl solution (see Tables S1 and S3 and Figure 3), the fact is observed that the peaks are less intense in the solution containing Phe. The scheme of the mechanism of Phe detection at the PB-SPCE sensitive surface is present in Scheme 3.
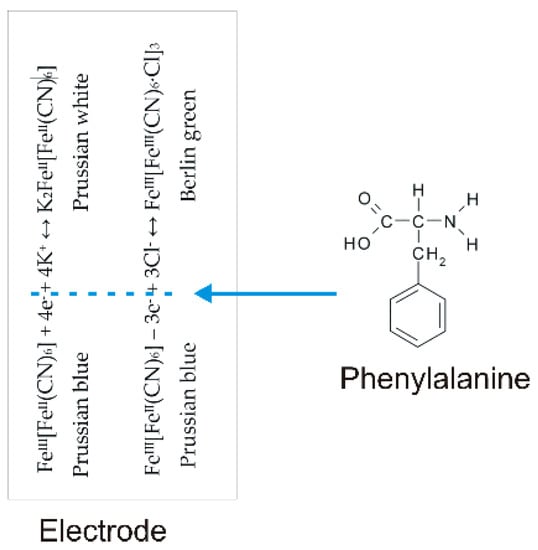
Scheme 3.
Scheme of Phe detection at sensitive surface of PB-SPCE.
This is due to Phe, which inhibits the kinetics of the oxidation-reduction process of the electroactive compound PB, from the sensitive element of the sensor. Regarding the potentials of the peaks, they are displaced to lower values in the presence of Phe, which demonstrates that Phe inhibits the electrochemical processes of PB oxidation-reduction. Therefore, the presence of Phe in the samples to be analyzed may be indirectly detected with the help of PB-SPCE by decreasing the peak currents, and by moving the peak potentials to lower values. E1/2 remains almost constant, which demonstrates that Phe interacts with PB in both oxidation and reduction. Moreover, Ipc/Ipa values decrease in the presence of Phe, demonstrating that the kinetics of the processes at the level of the sensor sensitive element is strongly influenced by the presence of Phe in the solution to be analyzed.
These results correspond to those obtained when using other voltammetric sensors for the indirect detection of electroinactive compounds [39,43,44,47,48,50].
The following stage was devoted to analyzing the influence of the scan rate on the voltammetric responses of PB-SPCE. Thus, Figure 4 shows the cyclic voltammograms of PB-SPCE in 10−3 M Phe—10−1 M KCl solution at scan rates varying between 0.1 and 1.0 V × s−1.
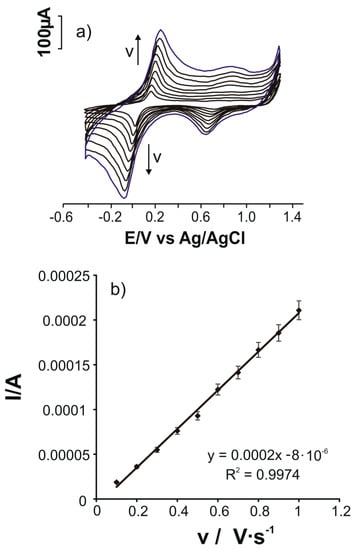
Figure 4.
(a) Cyclic voltammograms of the PB-SPCE immersed in 10−3 M Phe–10−1 M KCl solution registered with scan rates between 0.1 and 1.0 V × s−1. (b) Plot of the linear dependence between the anodic peak current and the scan rates.
The cyclic voltammograms show two anodic peaks (oxidation) and two cathodic peaks (reduction), all clear and intense. The higher the scan rate, the more clear and intense the peaks. Figure 4b shows that there is a linear dependence between the peak current and the scan rate (R2 = 0.9974), showing that the oxidation process is controlled by the electron exchange. Therefore, it is obvious that Phe is detected by this sensor, due to the fact that the adsorption of Phe on the active surface of the electrode is the determining stage of the kinetics of the electrochemical process.
Considering the equation of linear adjustment between the current of the most intense anodic peak and the scan rate the degree of coverage of the surface with electroactive centers (Γ) was calculated using Laviron’s equation [64]:
where
- Γ—surface coverage, mol × cm−2;
- Ipa—the current of the peak, A;
- A—electrode surface, cm2;
- n—the number of electrons transferred during redox processes, 4 for peak pair I;
- F—Faraday’s constant, 96,485 C × mol−1;
- R—universal gas constant, 8.314 J × mol−1 × K−1;
- T—absolute temperature, K;
A degree of surface coverage with active centers of 1.14 × 10⁻¹⁰ mole × cm−2 resulted from the slope of the linear adjustment Ipa vs. v, a value similar to many other results reported in the literature [65]. In a series of research studies PB-SPCE has been demonstrated to be very sensitive to the presence of Phe in the solution to be analyzed.
3.4. Influence of Phe Concentration on the Voltammetric Response of PB-SPCE
The concentration of the solutions to be analyzed is essential in the response of an electrochemical sensor. Cyclic voltammograms were recorded in Phe solutions of different concentrations dissolved in 10−1 M KCl solution, between 3.3 × 10⁻⁷ M and 2.1 × 10⁻⁵ M (0.33–21 µM), in order to determine the influence of Phe concentration on PB—SPCE. The electrochemical responses of the sensor recorded by cyclic voltammetry are shown in Figure 5.
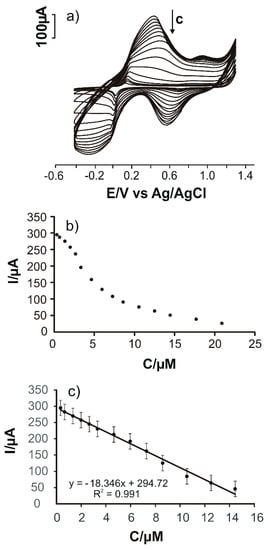
Figure 5.
(a) Cyclic voltammograms of PB-SPCE immersed in Phe solutions in the range 0.33–21 µM. (b) Dependence between Ipa and Phe concentration in the range 0.33–21 µM. (c) Linear dependence between Ipa and Phe concentration in the range 0.33–14.5 µM.
It may be noticed that the higher the concentration (c), the lower the intensity of the peaks. By graphically representing Ipa as a function of Phe concentration (Figure 5b), a typical curve for an electrochemical sensor was obtained, namely an area where Ipa decreases sharply with increasing c, followed by a plateau phase, in which, even if the concentration continues to increase, Ipa remains almost constant. This means that all active centers on the surface are involved in the electrochemical reaction [65]. The range in which Ipa is directly proportional with c is 0.33–14.5 µM (Figure 5c). The limit of detection (LOD) was calculated from the equation of the calibration line and the limit of quantification (LOQ) from the equations LOD = 3σ/m and LOQ = 10σ/m, where σ is the standard deviation of the current recorded in the blank sample (blank solution, in this case 10−1 M KCl) and m is the slope of the calibration plot [66].
The values obtained for PB-SPCE are LOD = 0.0123 µM (1.23 × 10⁻⁸ M) and LOQ = 0.0409 µM (4.09 × 10⁻⁸ M), values comparable with some results reported in the literature (Table 2). Table 2 presents a series of voltammetric sensors and their performances in Phe detection.
Table 2.
The principal voltammetric sensors used in the detection of Phe.
The LOD and LOQ values of the PB-SPCE sensor are acceptable for detection of Phe in real samples. Therefore, this sensor was used to determine Phe in pharmaceuticals.
3.5. Reproducibility, Stability, and Interference Studies
The stability of the PB-SPCE sensor was evaluated by employing cyclic voltammetry for 50 consecutive scans. The PB-SPCE sensor maintained 96.2% of its initial peak current response when it is immersed in 50 μM Phe—10−1 M KCl solution. Regarding the long-term stability of the PB-SPCE sensor, it was tested over ten days. The PB-SPCE sensor preserved 94% from the initially response after ten days, with a RSD value of 3.28%. These results demonstrated the good stability of the sensor. Additionally, the reproducibility of the PB-SPCE sensor fabrication was studied by preparing five different sensors. The fabrication reproducibility tests were carried out in in 50 μM Phe—10−1 M KCl solution. The RSD value for the anodic peak current observed for all five sensors was calculated to be 2.5%, demonstrating the good reproducibility of sensor development.
The interference studies of PB-SPCE sensor were carried out in presence of some interfering chemical species using cyclic voltammetry. CV responses were recorded in 50 μM Phe—10−1 M KCl solution in the presence of a 10-fold concentration of interfering species, such as glucose, L-valine, L-methionine, L-histidine and ascorbic acid. The results obtained showed that the PB-SPCE sensor retained 93.5% of its activity in the presence of interference chemical species. Therefore, the PB-SPCE sensor could be applied in real sample analysis.
3.6. Quantitative Determination of Phe in Pharmaceuticals Products
In order to validate the sensor in the Phe analysis from real samples, three pharmaceutical products from different manufacturers and containing Phe in different concentrations were selected and analyzed: Amino 75 mg Solgar (L-Phe 75 mg), L-Phenylalanine 500 mg Solaray and DLPA 500 mg Solgar. These pharmaceuticals were analyzed by using two methods: CV (the method developed in this study) and FTIR (standard method) [73]. The purpose of these analyzes was to compare, on the one hand, the results obtained by using the two methods, and the experiment results with the values indicated by the manufacturers in the leaflets of the analyzed pharmaceutical products, on the other.
In the case of cyclic voltammetry, the cyclic voltammograms of PB-SPCE sensor immersed in solution of pharmaceutical products containing also KCl 10−1 M as support electrolyte present two peak pairs at cca. 0.21 V (anodic peak I) and −0.02 V (cathodic peak I), together with an anodic peak (II) at 0.82 V and a cathodic peak (II) at 0.70 V. These pea values are close to those observed for the standard solution of Phe. Therefore, the PB-SPCE sensor have good selectivity and sensitivity to detect Phe in complex samples such as the pharmaceutical products. The anodic peak I current was used for the quantification of Phe from the pharmaceutics by interpolation in the calibration plot. The dilution and the quantity of pharmaceutical samples taken in the analysis were also considered.
The calibration curve was performed for the FTIR method [73]. The mixtures of L-Phe with KBr in solid state were used as reference samples for developing the calibration curve. Taking into account the absorbance of the band from 1556 cm−1, a linear dependence was obtained for the levels of the concentrations among 10 mg × g−1 and 150 mg × g−1.
Table 3 illustrates the results obtained from the quantitative determination of L-Phe by using the two methods. The fact may be noticed that the cyclic voltammetry (CV) method, used in the present study, is efficient, due to the quantity of AA. L-Phe obtained is in agreement with the one reported by the manufacturers, but also with the one obtained by using the FTIR reference method.
Table 3.
The amount of L-Phe measured in pharmaceuticals products of different concentrations and different producers.
The precision of the method based on the sensor and CV was calculated from five replicate analyses carried out in a single day (intra-day assay), using a 4 × 10⁻⁶ M Phe solution. Inter-day precision was calculated from the results obtained during ten days analyzing 5 × 10⁻⁵ M Phe solution (inter-day assay). The results obtained in both cases are presented in Table 4.
Table 4.
The results of studies on the accuracy of the electroanalytical method.
The recovery studies were carried out by the following method. Different amounts of each pharmaceutical product were weighted and dissolved in KCl 10−1 M. By this way, knowing the quantity of Phe from the pharmaceuticals indicated by producers, solutions of different concentrations were prepared (Phe added). The anodic peak current I was used for the calculation of the Phe concentration (Phe found), using the equation of calibration. The results are presented in Table 5. The recovery value was calculated as the percentage of the ratio between Phe found and Phe added. As can be observed, the recovery results close to 100% confirmed the excellent accuracy of the loltametric method.
Table 5.
The results of the recovery studies.
4. Conclusions
In the present work, three screen-printed electrodes modified with electroactive compounds for the determination of phenylalanine were produced and characterized. The conclusion reached, following the experiments performed, was that the PB-modified sensor shows electroactivity in all studied environments, which proves that this sensor is also useful for the detection of inactive redox compounds such as phenylalanine.
The use of cyclic voltammetry as a detection method allowed for very good analytical performances with applicability in laboratory practice. The PB-SPCE sensor has been demonstrated to have the best analytical performance for the determination of phenylalanine in pharmaceuticals. It has a wide linearity range, a high sensitivity and a very low detection limit.
The results obtained with the PB-SPCE sensor are very close to those obtained by using the standard method, and those indicated by the manufacturer at a 99% confidence level.
The electroanalytical method, developed in the present study, proved to be effective, due to the advantages it presented: precision, accuracy, simplicity, portability and low cost. This method can be used to control the quality of drugs, and may be extended to the analysis of phenylalanine in other types of samples, such as food, nutritional supplements and medical samples.
Supplementary Materials
The following are available online at https://www.mdpi.com/2227-9040/8/4/113/s1, Figure S1: (a) FTIR spectra of CoPc-SPCE; (b) MB-SPCE; (c) PB-SPCE, Figure S2: Cyclic voltammograms of (a) CoPc-SPCE; (b) MB-SPCE; (c) PB-SPCE immersed in 10−1 M KCl solution; scan rate 0.6 V × s−1, Figure S3: Cyclic voltammograms of the (a) CoPc-SPCE; (b) MB-SPCE; (c) PB-SPCE immersed in 10−3 M K4[Fe(CN)6]– 10−1 M KCl solution registered with the scan rate of 0.6 V × s−1, Figure S4: Plots of linear adjustment between the currents of the anodic peak, respectively cathodic peak vs square root of the scan rates for: (a) and (b) CoPc–SPCE; (c) and (d) MB–SPCE; (e) and (f) PB–SPCE, Table S1: Electrochemical parameters obtained from the cyclic voltammogram of PB-SPCE immersed in 10−1 M KCl solution; scan rate 0.6 V × s−1, Table S2: Electrochemical parameters of the CoPc-SPCE, MB-SPCE and PB-SPCE, respectively, immersed in 10−3 M K4[Fe(CN)6]- 10−1 M KCl solution obtained by cyclic voltammetry at 0.6 V × s−1, Table S3: Electrochemical parameters obtained from the cyclic voltammogram of PB-SPCE immersed in 10−3 M Phe-10−1 M KCl solution at 0.6 V × s−1.
Author Contributions
Conceptualization, C.A. and A.D.; methodology, C.A.; validation, C.A. and A.D.; formal analysis, A.D.; investigation, C.A. and A.D.; data curation, C.A. and A.D.; writing—original draft preparation, A.D.; writing—review and editing, C.A.; supervision, C.A. All authors have read and agreed to the published version of the manuscript.
Funding
The publication fees for this article were supported by “Dunarea de Jos” University of Galati.
Acknowledgments
The translation and linguistic review of the present article were made by Antoanela Marta Mardar, member of the Research Center “Interface Research of the Original and Translated Text. Cognitive and Communicative Dimensions of the Message”, Faculty of Letters, “Dunărea de Jos” University of Galați, Romania.
Conflicts of Interest
The authors declare no conflict of interest.
References
- García-Carmona, L.; González, M.C.; Escarpa, A. Nanomaterial-based electrochemical (bio)-sensing: One step ahead in diagnostic and monitoring of metabolic rare diseases. TrAC Trends Anal. Chem. 2019, 118, 29–42. [Google Scholar] [CrossRef]
- Pavan, S.; Rommel, K.; Mateo Marquina, M.E.; Höhn, S.; Lanneau, V.; Rath, A. Clinical practice guidelines for rare diseases: The orphanet database. PLoS ONE 2017, 12, e0170365. [Google Scholar] [CrossRef] [PubMed]
- Jumbo-Lucioni, P.P.; Garber, K.; Kiel, J.; Baric, I.; Berry, G.T.; Bosch, A.; Burlina, A.; Chiesa, A.; Pico, M.L.C.; Estrada, S.C. Diversity of approaches to classic galactosemia around the world: A comparison of diagnosis, intervention, and outcomes. J. Inherit. Metab. Dis. 2012, 35, 1037–1049. [Google Scholar] [CrossRef]
- Burrage, L.C.; Nagamani, S.C.; Campeau, P.M.; Lee, B.H. Branched-chain amino acid metabolism: From rare Mendelian diseases to more common disorders. Hum. Mol. Genet. 2014, 23, R1–R8. [Google Scholar] [CrossRef] [PubMed]
- Dinu, A.; Apetrei, C. A Review on Electrochemical Sensors and Biosensors Used in Phenylalanine Electroanalysis. Sensors 2020, 20, 2496. [Google Scholar] [CrossRef] [PubMed]
- Blau, N.; Hennermann, J.B.; Langenbeck, U.; Lichter-Konecki, U. Diagnosis, classification, and genetics of phenylketonuria and tetrahydrobiopterin (BH4) deficiencies. Mol. Genet. Metab. 2011, 104, S2–S9. [Google Scholar] [CrossRef]
- Fujimoto, A.; Okano, Y.; Miyagi, T.; Isshiki, G.; Oura, T. Quantitative Beutler test for newborn mass screening of galactosemia using a fluorometric microplate reader. Clin. Chem. 2000, 46, 806–810. [Google Scholar] [CrossRef]
- Nishimura, Y.; Tajima, G.; Bahagia, A.D.; Sakamoto, A.; Ono, H.; Sakura, N.; Naito, K.; Hamakawa, M.; Yoshii, C.; Kubota, M. Differential diagnosis of neonatal mild hypergalactosaemia detected by mass screening: Clinical significance of portal vein imaging. J. Inherit. Metab. Dis. 2004, 27, 11–18. [Google Scholar] [CrossRef]
- Dick, L.; Dooley, N.; Elliott, M.A.; Ford, S.J.; Gordon, M.R.; Halbert, G.W.; Kerr, W.J. Boron phenylalanine and related impurities: HPLC analysis, stability profile and degradation pathways. J. Pharm. Biomed. Anal. 2011, 56, 633–636. [Google Scholar] [CrossRef]
- Zhang, Z.; Zhang, M.; Liu, Y.; Yang, X.; Luo, L.; Yao, S. Preparation of L-phenylalanine imprinted polymer based on monodisperse hybrid silica microsphere and its application on chiral separation of phenylalanine racemates as HPLC stationary phase. Sep. Purif. Technol. 2012, 87, 142–148. [Google Scholar] [CrossRef]
- Mo, X.; Li, Y.; Tang, A.; Ren, Y. Simultaneous determination of phenylalanine and tyrosine in peripheral capillary blood by HPLC with ultraviolet detection. Clin. Biochem. 2013, 46, 1074–1078. [Google Scholar] [CrossRef] [PubMed]
- Neurauter, G.; Scholl-Bürgi, S.; Haara, A.; Geisler, S.; Mayersbach, P.; Schennach, H.; Fuchs, D. Simultaneous measurement of phenylalanine and tyrosine by high performance liquid chromatography (HPLC) with fluorescence detection. Clin. Biochem. 2013, 46, 1848–1851. [Google Scholar] [CrossRef]
- Pecce, R.; Scolamiero, E.; Ingenito, L.; Parenti, G.; Ruoppolo, M. Optimization of an HPLC method for phenylalanine and tyrosine quantization in dried blood spot. Clin. Biochem. 2013, 46, 1892–1895. [Google Scholar] [CrossRef] [PubMed]
- Ciolacu, F.L.; Ardelean, A.; Țurcuș, V.; Mândruțiu, I.; Belengeanu, A.; Bechet, D.; Frențescu, L. A simple, sensitive and highly accurate procedure for plasma phenylalanine determination by HPLC. Acta Endocrinol. Buc 2015, 11, 143–146. [Google Scholar]
- Peat, J.; Garg, U. Determination of phenylalanine and tyrosine by high performance liquid chromatography-tandem mass spectrometry. In Clinical Applications of Mass Spectrometry in Biomolecular Analysis; Springer: Berlin/Heidelberg, Germany, 2016; pp. 219–225. [Google Scholar]
- Hroboňová, K.; Lomenova, A. Molecularly imprinted polymer as stationary phase for HPLC separation of phenylalanine enantiomers. Mon. Chem. Chem. Mon. 2018, 149, 939–946. [Google Scholar] [CrossRef]
- Lomenova, A.; Hroboňová, K. Comparison of HPLC separation of phenylalanine enantiomers on different types of chiral stationary phases. Food Anal. Methods 2018, 11, 3314–3323. [Google Scholar] [CrossRef]
- Kazan, R.M.; Seddik, H.A.; Marstani, Z.M.; Elsutohy, M.M.; Yasri, N.G. Determination of amino acids content in tea species using liquid chromatography via pre-column fluorescence derivatization. Microchem. J. 2019, 150, 104103. [Google Scholar] [CrossRef]
- Xu, X.; Ji, D.; Zhang, Y.; Gao, X.; Xu, P.; Li, X.; Liu, C.-C.; Wen, W. Detection of Phenylketonuria Markers Using a ZIF-67 Encapsulated PtPd Alloy Nanoparticle (PtPd@ ZIF-67)-Based Disposable Electrochemical Microsensor. ACS Appl. Mater. Interfaces 2019, 11, 20734–20742. [Google Scholar] [CrossRef]
- Harms, E.; Olgemöller, B. Neonatal screening for metabolic and endocrine disorders. Dtsch. Ärztebl. Int. 2011, 108, 11. [Google Scholar] [CrossRef]
- Rhode, H.; Elei, E.; Taube, I.; Podskarbi, T.; Horn, A. Newborn screening for galactosemia: Ultramicro assay for galactose-1-phosphate-uridyltransferase activity. Clin. Chim. Acta 1998, 274, 71–87. [Google Scholar] [CrossRef]
- Jeong, J.-S.; Yoon, H.-R.; Hong, S.-P. Development of a new diagnostic method for galactosemia by high-performance anion-exchange chromatography with pulsed amperometric detection. J. Chromatogr. A 2007, 1140, 157–162. [Google Scholar] [CrossRef] [PubMed]
- Easley, C.J.; Jin, L.J.; Elgstoen, K.B.P.; Jellum, E.; Landers, J.P.; Ferrance, J.P. Capillary electrophoresis with laser-induced fluorescence detection for laboratory diagnosis of galactosemia. J. Chromatogr. A 2003, 1004, 29–37. [Google Scholar] [CrossRef]
- Hasanzadeh, M.; Shadjou, N.; Chen, S.-T.; Sheikhzadeh, P. MCM-41-NH2 as an advanced nanocatalyst for electrooxidation and determination of amino acids. Catal. Commun. 2012, 19, 21–27. [Google Scholar] [CrossRef]
- Blau, N.; Shen, N.; Carducci, C. Molecular genetics and diagnosis of phenylketonuria: State of the art. Expert Rev. Mol. Diagn. 2014, 14, 655–671. [Google Scholar] [CrossRef] [PubMed]
- Dincer, C.; Bruch, R.; Kling, A.; Dittrich, P.S.; Urban, G.A. Multiplexed point-of-care testing–xPOCT. Trends Biotechnol. 2017, 35, 728–742. [Google Scholar] [CrossRef] [PubMed]
- Luppa, P.B.; Bietenbeck, A.; Beaudoin, C.; Giannetti, A. Clinically relevant analytical techniques, organizational concepts for application and future perspectives of point-of-care testing. Biotechnol. Adv. 2016, 34, 139–160. [Google Scholar] [CrossRef]
- Zhang, W.; Guo, S.; Carvalho, W.S.P.; Jiang, Y.; Serpe, M.J. Portable point-of-care diagnostic devices. Anal. Methods 2016, 8, 7847–7867. [Google Scholar] [CrossRef]
- Farzin, L.; Shamsipur, M.; Samandari, L.; Sheibani, S. Advances in the design of nanomaterial-based electrochemical affinity and enzymatic biosensors for metabolic biomarkers: A review. Microchim. Acta 2018, 185, 276. [Google Scholar] [CrossRef]
- Pundir, C.; Lata, S.; Narwal, V. Biosensors for determination of D and L-amino acids: A review. Biosens. Bioelectron. 2018, 117, 373–384. [Google Scholar] [CrossRef]
- Ermiş, N.; Uzun, L.; Denizli, A. Preparation of molecularly imprinted electrochemical sensor for L-phenylalanine detection and its application. J. Electroanal. Chem. 2017, 807, 244–252. [Google Scholar] [CrossRef]
- Ou, S.-H.; Pan, L.-S.; Jow, J.-J.; Chen, H.-R.; Ling, T.-R. Molecularly imprinted electrochemical sensor, formed on Ag screen-printed electrodes, for the enantioselective recognition of d and l phenylalanine. Biosens. Bioelectron. 2018, 105, 143–150. [Google Scholar] [CrossRef] [PubMed]
- Apetrei, I.; Apetrei, C. A modified nanostructured graphene-gold nanoparticle carbon screen-printed electrode for the sensitive voltammetric detection of rutin. Measurement 2018, 114, 37–43. [Google Scholar] [CrossRef]
- Apetrei, I.M.; Apetrei, C. Study of different carbonaceous materials as modifiers of screen-printed electrodes for detection of catecholamines. IEEE Sens. J. 2014, 15, 3094–3101. [Google Scholar] [CrossRef]
- Saylan, Y.; Yilmaz, F.; Özgür, E.; Derazshamshir, A.; Yavuz, H.; Denizli, A. Molecular imprinting of macromolecules for sensor applications. Sensors 2017, 17, 898. [Google Scholar] [CrossRef] [PubMed]
- Bi, Q.; Dong, S.; Sun, Y.; Lu, X.; Zhao, L. An electrochemical sensor based on cellulose nanocrystal for the enantioselective discrimination of chiral amino acids. Anal. Biochem. 2016, 508, 50–57. [Google Scholar] [CrossRef]
- Kubota, L.T.; Gouvea, F.; Andrade, A.N.; Milagres, B.G.; Neto, G.D.O. Electrochemical sensor for NADH based on Meldola’s Blue immobilized on silica gel modified with titanium phosphate. Electrochim. Acta 1996, 41, 1465–1469. [Google Scholar] [CrossRef]
- Adamski, J.; Kochana, J. Meldola’s Blue—Doped titania sol-gel sensor for NADH determination. Open Chem. 2011, 9, 185–191. [Google Scholar] [CrossRef]
- Hope-Roberts, M.; Horobin, R. Biomedical applications and chemical nature of three dyes first synthesized by Raphael Meldola: Isamine blue, Meldola’s blue and naphthol green B. Biotech. Histochem. 2012, 87, 295–299. [Google Scholar] [CrossRef]
- Hoffmann, A.A.; Dias, S.L.; Benvenutti, E.V.; Lima, E.C.; Pavan, F.A.; Rodrigues, J.R.; Scotti, R.; Ribeiro, E.S.; Gushikem, Y. Cationic dyes immobilized on cellulose acetate surface modified with titanium dioxide: Factorial design and an application as sensor for NADH. J. Braz. Chem. Soc. 2007, 18, 1462–1472. [Google Scholar] [CrossRef]
- Njagi, J.; Erlichman, J.S.; Aston, J.W.; Leiter, J.; Andreescu, S. A sensitive electrochemical sensor based on chitosan and electropolymerized Meldola blue for monitoring NO in brain slices. Sens. Actuators B Chem. 2010, 143, 673–680. [Google Scholar] [CrossRef]
- Piano, M.; Serban, S.; Pittson, R.; Drago, G.; Hart, J.P. Amperometric lactate biosensor for flow injection analysis based on a screen-printed carbon electrode containing Meldola’s Blue-Reinecke salt, coated with lactate dehydrogenase and NAD+. Talanta 2010, 82, 34–37. [Google Scholar] [CrossRef] [PubMed]
- Titoiu, A.M.; Lapauw, M.; Necula-Petrareanu, G.; Purcarea, C.; Fanjul-Bolado, P.; Marty, J.; Vasilescu, A. Carbon Nanofiber and Meldola Blue Based Electrochemical Sensor for NADH: Application to the Detection of Benzaldehyde. Electroanalysis 2018, 30, 2676–2688. [Google Scholar] [CrossRef]
- Apetrei, I.; Rodriguez-Mendez, M.; Apetrei, C.; De Saja, J. Enzyme sensor based on carbon nanotubes/cobalt (II) phthalocyanine and tyrosinase used in pharmaceutical analysis. Sens. Actuators B Chem. 2013, 177, 138–144. [Google Scholar] [CrossRef]
- Georgescu, R.; van Staden, J.F.; Stefan-van Staden, R.-I.; Boscornea, C. Evaluation of amperometric dot microsensors for the analysis of folic acid in pharmaceutical tablets and urine samples. J. Porphyr. Phthalocyanines 2015, 19, 679–687. [Google Scholar] [CrossRef]
- Foster, C.W.; Metters, J.P.; Kampouris, D.K.; Banks, C.E. Ultraflexible screen-printed graphitic electroanalytical sensing platforms. Electroanalysis 2014, 26, 262–274. [Google Scholar] [CrossRef]
- Wahab, F.; Sayyad, M.; Tahir, M.; Aziz, F.; Khan, R.; Karimov, K.S. Sensing properties of cobalt-phthalocyanine-based multipurpose sensor. J. Electron. Mater. 2017, 46, 2045–2052. [Google Scholar] [CrossRef]
- Aller-Pellitero, M.; Fremeau, J.; Villa, R.; Guirado, G.; Lakard, B.; Hihn, J.-Y.; Del Campo, F.J. Electrochromic biosensors based on screen-printed Prussian Blue electrodes. Sens. Actuators B Chem. 2019, 290, 591–597. [Google Scholar] [CrossRef]
- Karyakin, A.A. Prussian blue and its analogues: Electrochemistry and analytical applications. Electroanal. Int. J. Devoted Fundam. Pract. Asp. Electroanal. 2001, 13, 813–819. [Google Scholar] [CrossRef]
- Katic, V.; dos Santos, P.L.; dos Santos, M.F.; Pires, B.M.; Loureiro, H.C.; Lima, A.P.; Queiroz, J.C.; Landers, R.; Muñoz, R.A.; Bonacin, J.A. 3D printed graphene electrodes modified with Prussian blue: Emerging electrochemical sensing platform for peroxide detection. ACS Appl. Mater. Interfaces 2019, 11, 35068–35078. [Google Scholar] [CrossRef]
- Hutanu, F.; Ocnaru, E.; Arsene, M.; Badea-Doni, M. Characterization of surfactant-modified prussian blue screen-printed carbon electrodes for H2O2 detection. Bull. Transilv. Univ. Brasov Ser. Eng. Sci. 2013, 6, 95–102. [Google Scholar]
- Cinti, S.; Arduini, F.; Moscone, D.; Palleschi, G.; Killard, A.J. Development of a hydrogen peroxide sensor based on screen-printed electrodes modified with inkjet-printed Prussian blue nanoparticles. Sensors 2014, 14, 14222–14234. [Google Scholar] [CrossRef] [PubMed]
- Zhou, L.; Wu, S.; Xu, H.; Zhao, Q.; Zhang, Z.; Yao, Y. Preparation of poly (N-acetylaniline)–Prussian blue hybrid composite film and its application to hydrogen peroxide sensing. Anal. Methods 2014, 6, 8003–8010. [Google Scholar] [CrossRef]
- Bonacin, J.A.; Dos Santos, P.L.; Katic, V.; Foster, C.W.; Banks, C.E. Use of screen-printed electrodes modified by prussian blue and analogues in sensing of cysteine. Electroanalysis 2018, 30, 170–179. [Google Scholar] [CrossRef]
- Hutanu, F.; Gheorghe, G. Modified prussian blue screen printed electrodes for H2O2 detection. Food Environ. Saf. J. 2016, 12, 78–83. [Google Scholar]
- O’Halloran, M.P.; Pravda, M.; Guilbault, G.G. Prussian Blue bulk modified screen-printed electrodes for H2O2 detection and for biosensors. Talanta 2001, 55, 605–611. [Google Scholar]
- Bounegru, A.V.; Apetrei, C. Voltammetric Sensors Based on Nanomaterials for Detection of Caffeic Acid in Food Supplements. Chemosensors 2020, 8, 41. [Google Scholar] [CrossRef]
- Bounegru, A.V.; Apetrei, C. Carbonaceous Nanomaterials Employed in the Development of Electrochemical Sensors Based on Screen-Printing Technique—A Review. Catalysts 2020, 10, 680. [Google Scholar] [CrossRef]
- Jäntschi, L.; Naşcu, H.I. Chimie Analitică şi Instrumentală; Academic Press: Cambridge, MA, USA, 2009; ISBN 973-744-191-5. [Google Scholar]
- Salazar, P.; Martín, M.; O’Neill, R.; Roche, R.; González-Mora, J. Surfactant-promoted Prussian Blue-modified carbon electrodes: Enhancement of electro-deposition step, stabilization, electrochemical properties and application to lactate microbiosensors for the neurosciences. Colloids Surf. B Biointerfaces 2012, 92, 180–189. [Google Scholar] [CrossRef]
- Rabinowitz, J.D.; Vacchino, J.F.; Beeson, C.; McConnell, H.M. Potentiometric measurement of intracellular redox activity. J. Am. Chem. Soc. 1998, 120, 2464–2473. [Google Scholar] [CrossRef]
- Pournaghi-Azar, M.; Ojani, R. Electrochemistry and electrocatalytic activity of polypyrrole/ferrocyanide films on a glassy carbon electrode. J. Solid State Electrochem. 2000, 4, 75–79. [Google Scholar] [CrossRef]
- Apetrei, I.; Apetrei, C. Application of voltammetric e-tongue for the detection of ammonia and putrescine in beef products. Sens. Actuators B Chem. 2016, 234, 371–379. [Google Scholar] [CrossRef]
- Fotouhi, L.; Fatollahzadeh, M.; Heravi, M.M. Electrochemical behavior and voltammetric determination of sulfaguanidine at a glassy carbon electrode modified with a multi-walled carbon nanotube. Int. J. Electrochem. Sci. 2012, 7, 3919–3928. [Google Scholar]
- Brubaker, J.P. A Diffusion Model for Cyclic Voltammetry with Nanostructured Electrode Surfaces. Master’s Thesis, University of Dayton, Dayton, OH, USA, 2014. [Google Scholar]
- Armbruster, D.A.; Pry, T. Limit of blank, limit of detection and limit of quantitation. Clin. Biochem. Rev. 2008, 29, S49. [Google Scholar] [PubMed]
- Yi, Y.; Zhang, D.; Ma, Y.; Wu, X.; Zhu, G. Dual-signal electrochemical enantiospecific recognition system via competitive supramolecular host–guest interactions: The case of phenylalanine. Anal. Chem. 2019, 91, 2908–2915. [Google Scholar] [CrossRef] [PubMed]
- Niu, X.; Yang, X.; Mo, Z.; Guo, R.; Liu, N.; Zhao, P.; Liu, Z. Perylene-functionalized graphene sheets modified with β-cyclodextrin for the voltammetric discrimination of phenylalanine enantiomers. Bioelectrochemistry 2019, 129, 189–198. [Google Scholar] [CrossRef]
- Aghaei, F.; Seifati, S.M.; Nasirizadeh, N. Development of a DNA biosensor for the detection of phenylketonuria based on a screen-printed gold electrode and hematoxylin. Anal. Methods 2017, 9, 966–973. [Google Scholar] [CrossRef]
- Sajini, T.; John, S.; Mathew, B. Tailoring of photo-responsive molecularly imprinted polymers on multiwalled carbon nanotube as an enantioselective sensor and sorbent for L-PABE. Compos. Sci. Technol. 2019, 181, 107676. [Google Scholar] [CrossRef]
- Wu, T.; Wei, X.; Ma, X.; Li, J. Amperometric sensing of L-phenylalanine using a gold electrode modified with a metal organic framework, a molecularly imprinted polymer, and β-cyclodextrin-functionalized gold nanoparticles. Microchim. Acta 2017, 184, 2901–2907. [Google Scholar] [CrossRef]
- Seifati, S.M.; Nasirizadeh, N.; Azimzadeh, M. Nano-biosensor based on reduced graphene oxide and gold nanoparticles, for detection of phenylketonuria-associated DNA mutation. IET Nanobiotechnol. 2017, 12, 417–422. [Google Scholar] [CrossRef]
- European Pharmacopoeia 7.0, 7th ed.; Council of Europe: Strasbourg, France, 2011; Volume 1, ISBN 92-871-6700-1.


Publisher’s Note: MDPI stays neutral with regard to jurisdictional claims in published maps and institutional affiliations. |
© 2020 by the authors. Licensee MDPI, Basel, Switzerland. This article is an open access article distributed under the terms and conditions of the Creative Commons Attribution (CC BY) license (http://creativecommons.org/licenses/by/4.0/).