Optimizing Piezoelectric Cantilever Design for Electronic Nose Applications

 ,
,  , ,
, ,  ,
,  and
and 
Abstract
1. Introduction
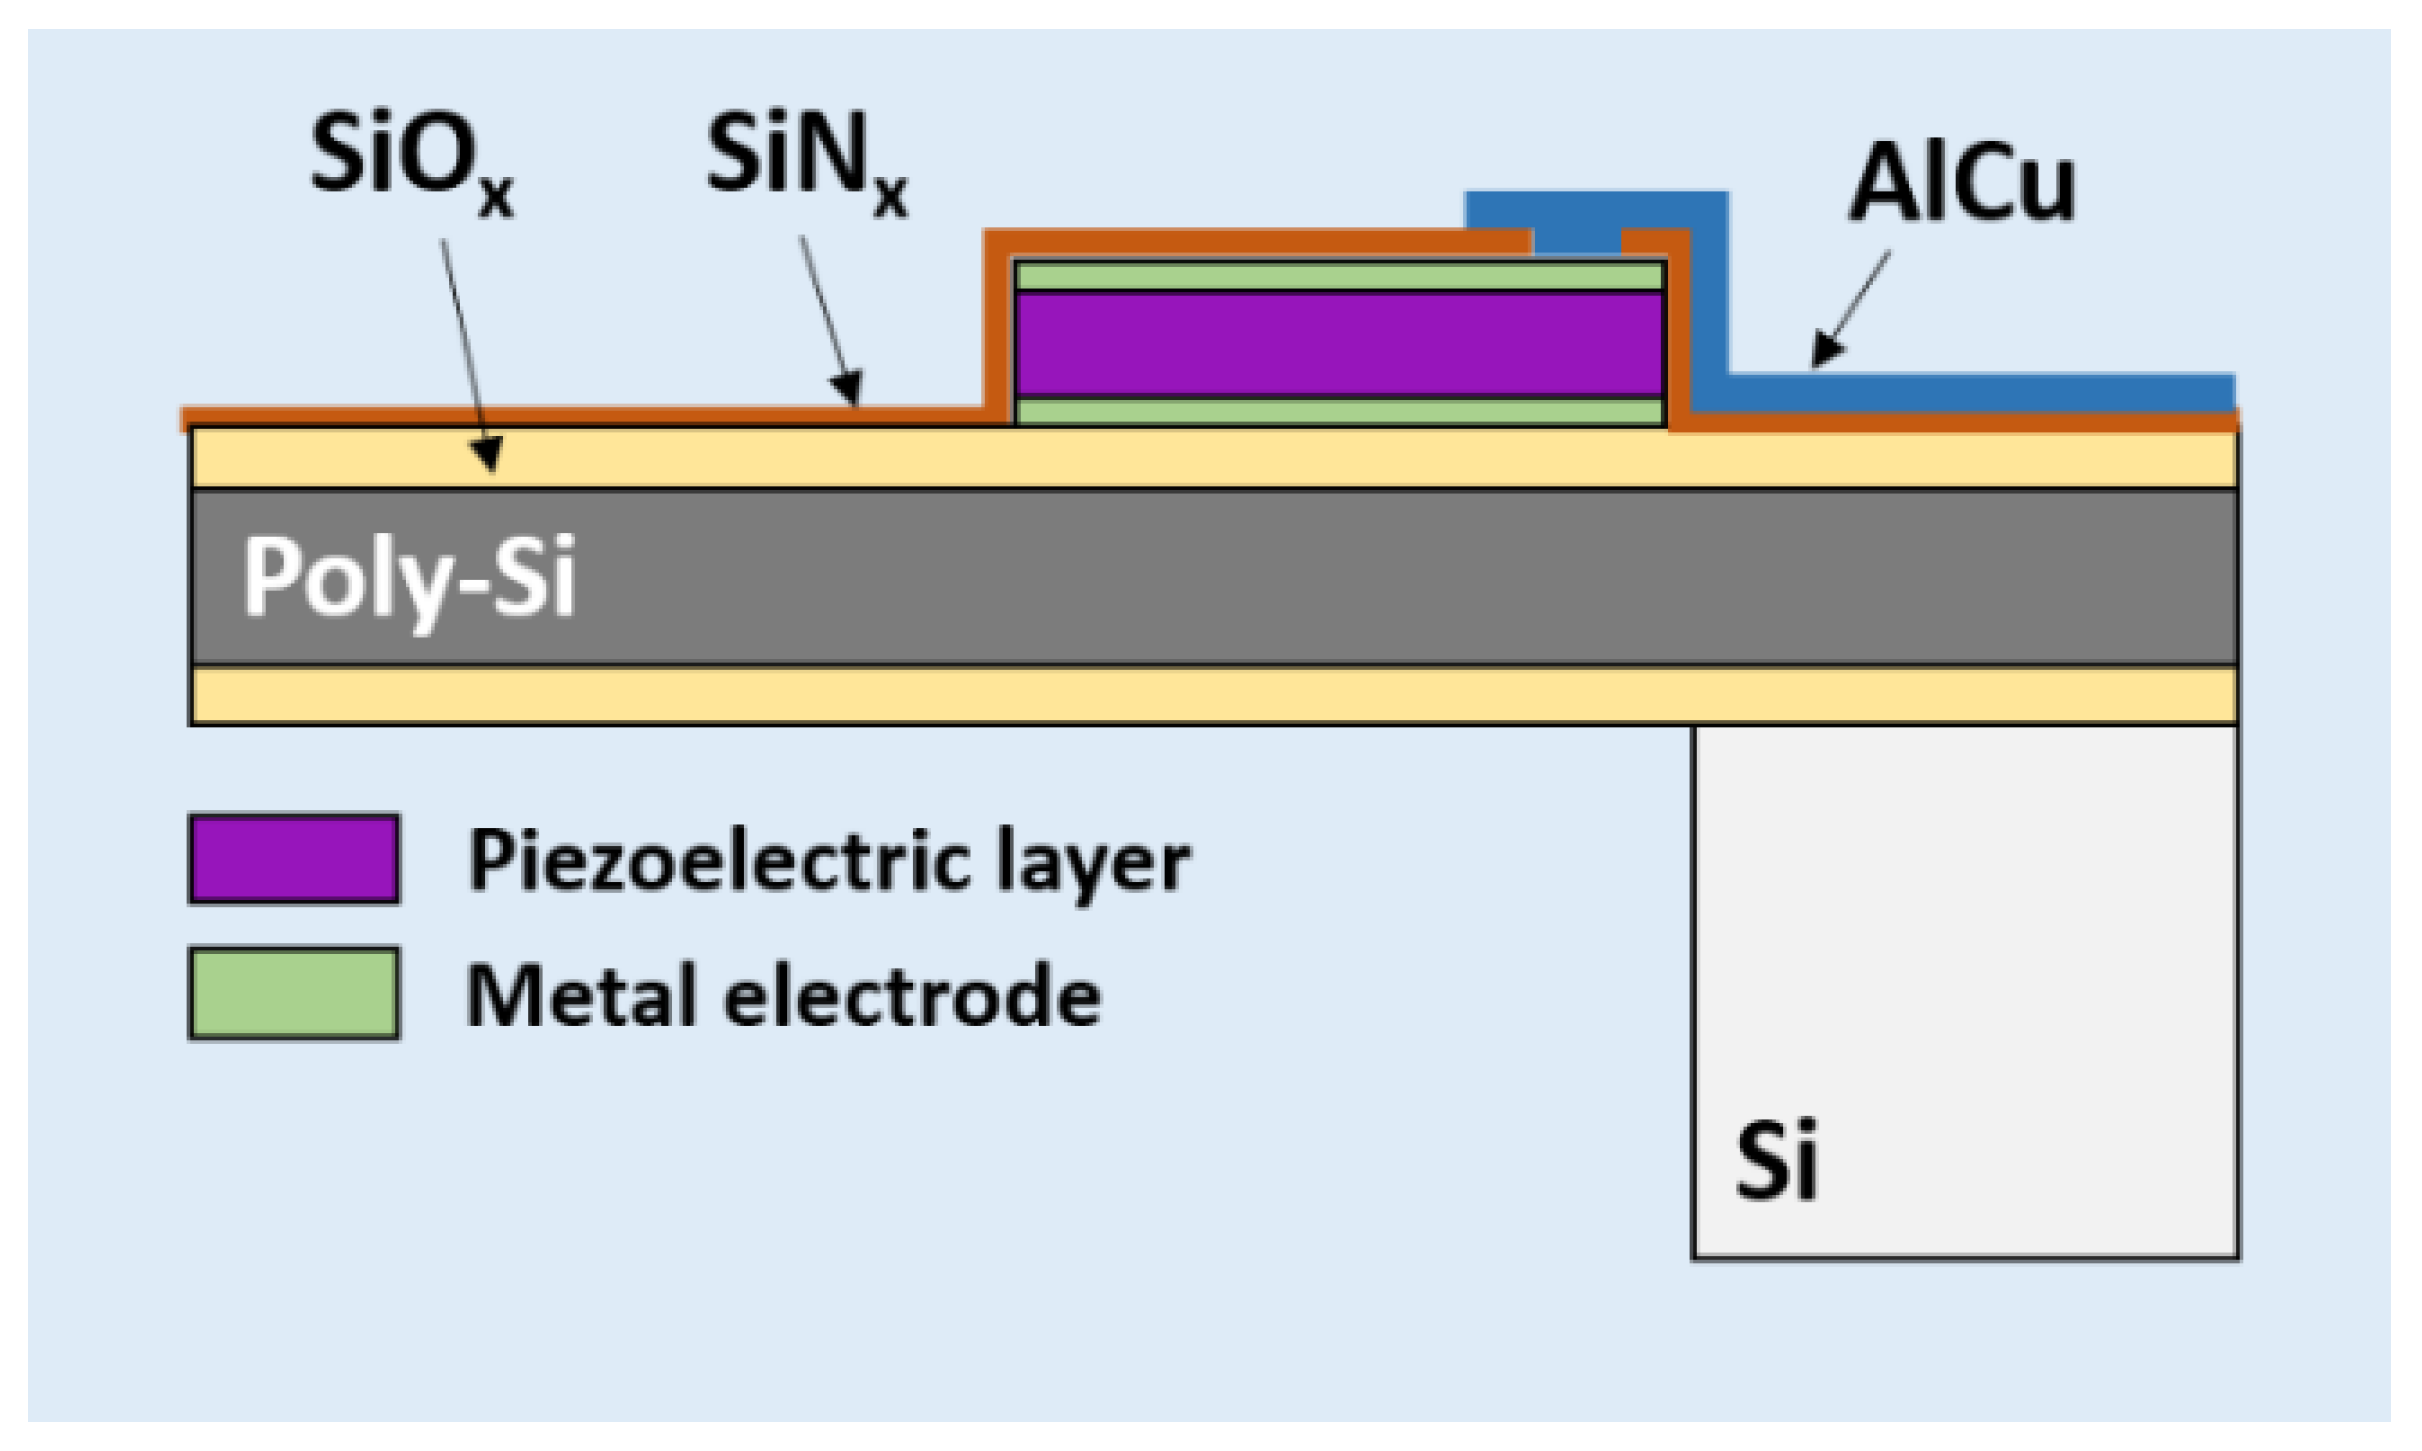
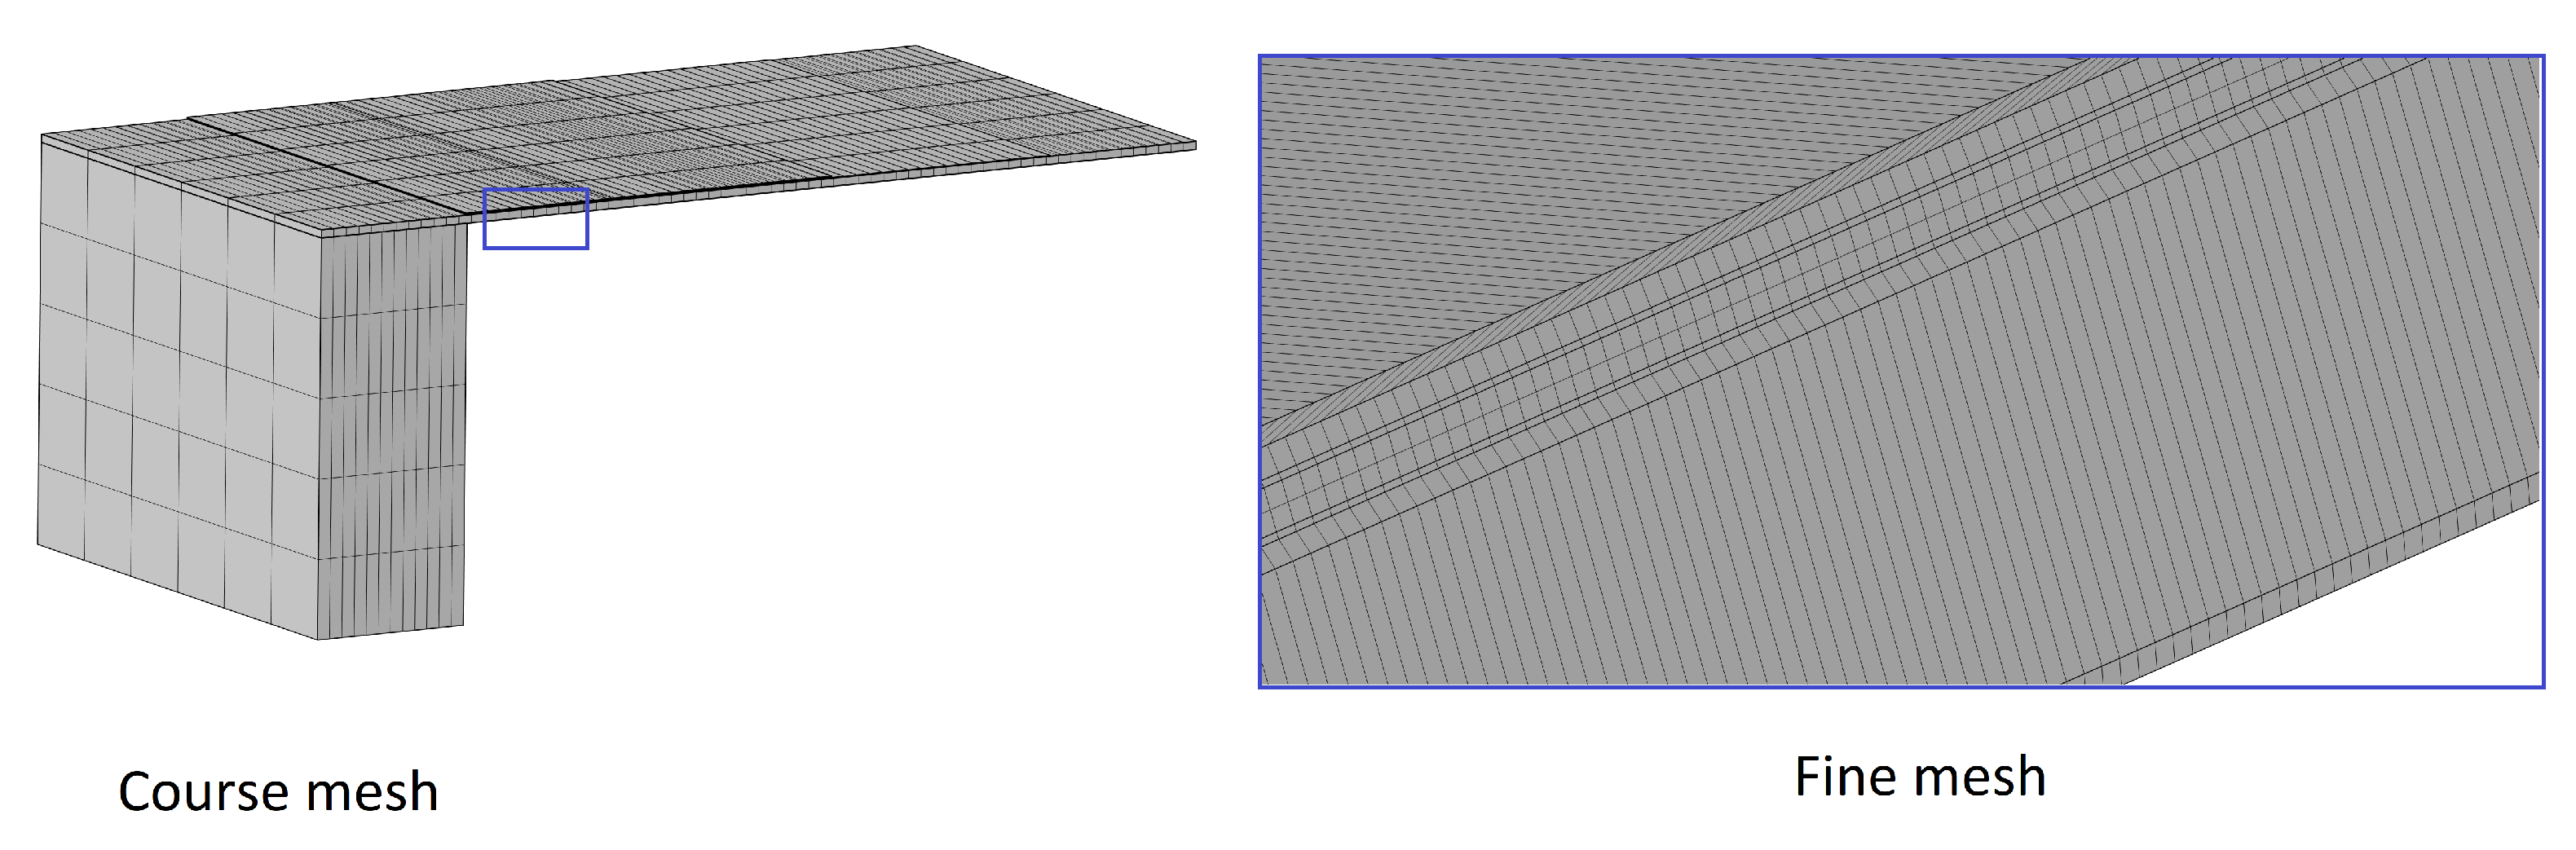
2. Methods
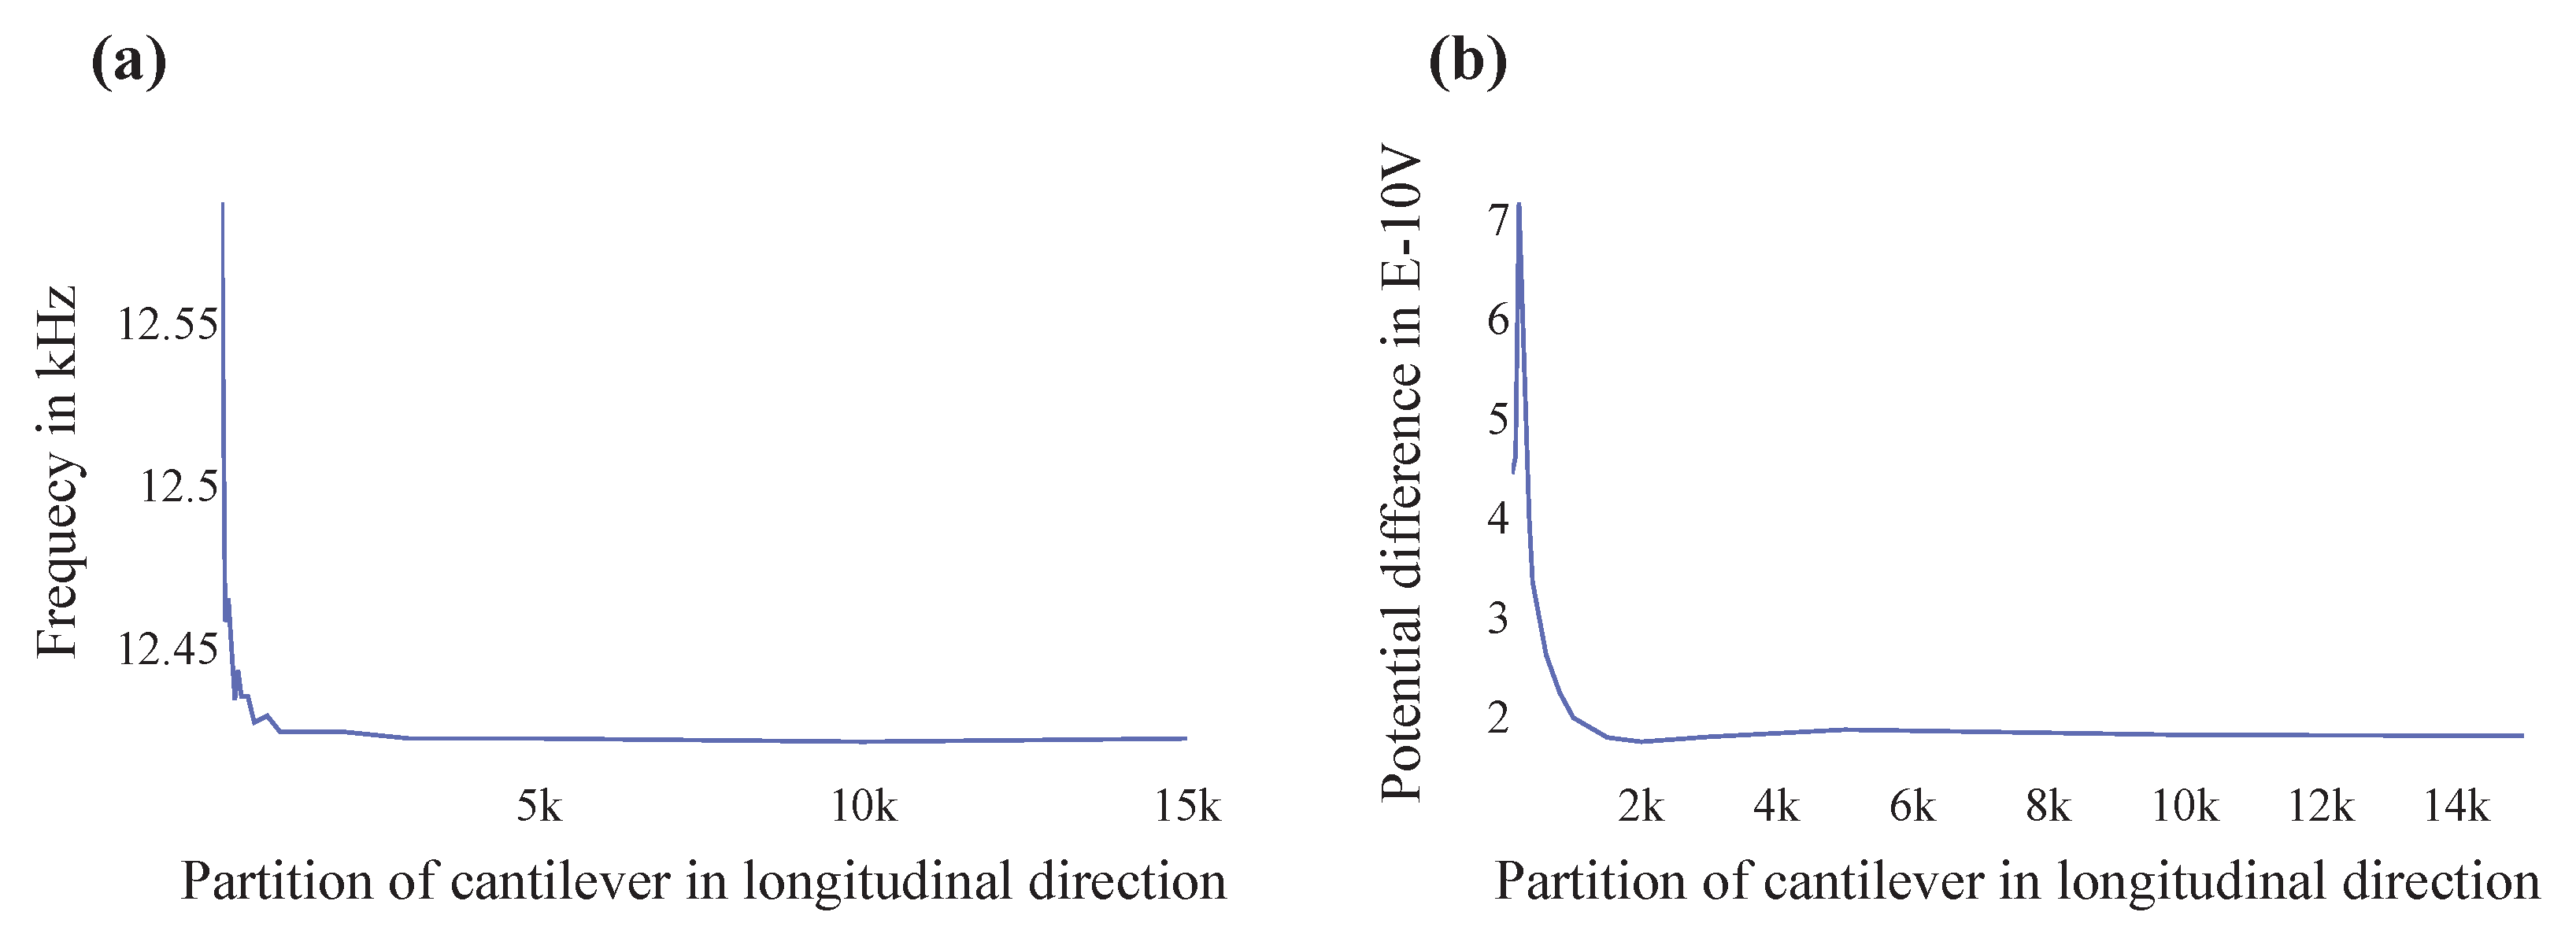
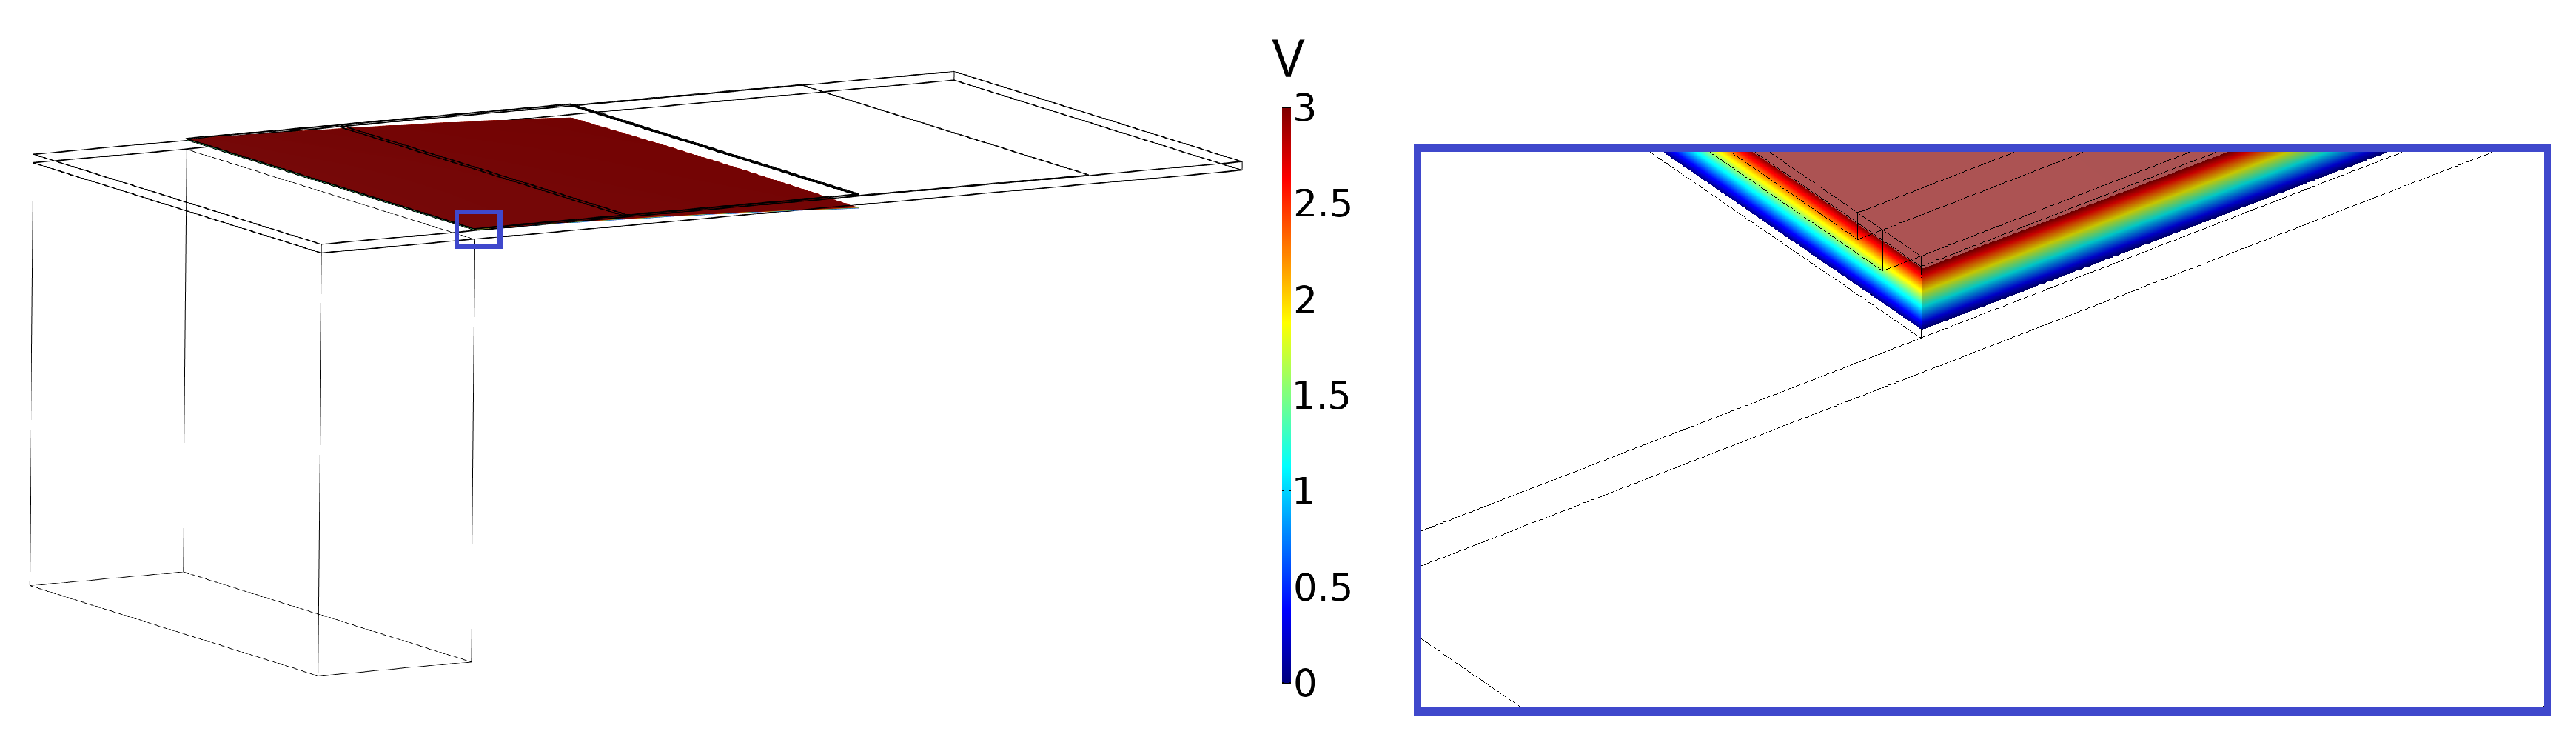
3. Results and Discussion
4. Conclusions
Author Contributions
Funding
Acknowledgments
Conflicts of Interest
References
- Clune, S.; Crossin, E.; Verghese, K. Systematic review of greenhouse gas emissions for different fresh food categories. J. Clean. Prod. 2017, 140, 766–783. [Google Scholar] [CrossRef]
- Quested, T.; Murphy, L. Household Food and Drink Waste: A Product Focus; Waste and Resources Action Programme: Banbury, UK, 2014; ISBN 978-1-84405-469-5. [Google Scholar]
- Andrew, J. Market Study on Date Marking and other Information Provided on Food Labels and Food Waste Prevention; Publications Office of the EU: Luxembourg, 2018. [Google Scholar] [CrossRef]
- Pircher, A.; Bauer, F.; Paulsen, P. Formation of cadaverine, histamine, putrescine and tyramine by bacteria isolated from meat, fermented sausages and cheeses. Eur. Food Res. Technol. 2006, 226, 225–231. [Google Scholar] [CrossRef]
- Edwards, R.; Dainty, R.; Hibbard, C. Putrescine and cadaverine formation in vacuum packed beef. J. Appl. Bacteriol. 1985, 58, 13–19. [Google Scholar] [CrossRef]
- Laursen, B.; Byrne, D.; Kirkegaard, J.; Leisner, J. Lactic acid bacteria associated with a heat-processed pork product and sources of variation affecting chemical indices of spoilage and sensory characteristics. J. Appl. Microbiol. 2009, 106, 543–553. [Google Scholar] [CrossRef] [PubMed]
- Gui, M.; Binzhao; Song, J.; Zhang, Z.; Hui, P.; Li, P. Biogenic amines formation, nucleotide degradation and TVB-N accumulation of vacuum-packed minced sturgeon (Acipenser schrencki) stored at 4 °C and their relation to microbiological attributes. J. Sci. Food Agric. 2014, 94, 2057–2063. [Google Scholar] [CrossRef] [PubMed]
- Vinci, G.; Antonelli, M. Biogenic amines: Quality index of freshness in red and white meat. Food Control 2002, 13, 519–524. [Google Scholar] [CrossRef]
- Quality indices for canned skipjack tuna: Correlation of sensory attributes with chemical indices. Off. Ication Inst. Food Technol. 1992, 57, 1112–1115.
- Emborg, J.; Laursen, B.; Rathjen, T.; Dalgaard, P. Microbial spoilage and formation of biogenic amines in fresh and thawed modified atmosphere-packed salmon (Salmo salar) at 2 °C. J. Appl. Microbiol. 2002, 92, 790–799. [Google Scholar] [CrossRef]
- Stolzenbach, S.; Leisner, J.J.; Byrne, D.V. Sensory shelf life determination of a processed meat product ‘rullepølse’ and microbial metabolites as potential indicators. Meat Sci. 2009, 83, 285–292. [Google Scholar] [CrossRef]
- Leuschner, R.G.; Kurihara, R.; Hammes, W.P. Formation of biogenic amines by proteolytic enterococci during cheese ripening. J. Sci. Food Agric. 1999, 79, 1141–1144. [Google Scholar] [CrossRef]
- Nishikawa, H.; Tabata, T.; Kitani, S. Simple Detection Method of Biogenic Amines in Decomposed Fish by Intramolecular Excimer Fluorescence. Food Nutr. Sci. 2012, 3, 1020–1026. [Google Scholar] [CrossRef]
- Almeida, C.; Fernandes, J.; Cunha, S. A novel dispersive liquid–liquid microextraction (DLLME) gas chromatography-mass spectrometry (GC–MS) method for the determination of eighteen biogenic amines in beer. Food Control 2012, 25, 380–388. [Google Scholar] [CrossRef]
- Hidayat, S.N.; Triyana, K.; Fauzan, I.; Julian, T.; Lelono, D.; Yusuf, Y.; Ngadiman, N.; Veloso, A.C.; Peres, A.M. The Electronic Nose Coupled with Chemometric Tools for Discriminating the Quality of Black Tea Samples In Situ. Chemosensors 2019, 7, 29. [Google Scholar] [CrossRef]
- Yang, T.; Tian, F.; Covington, J.A.; Xu, F.; Xu, Y.; Jiang, A.; Qian, J.; Liu, R.; Wang, Z.; Huang, Y. Resistance-Capacitance Gas Sensor Based on Fractal Geometry. Chemosensors 2019, 7, 31. [Google Scholar] [CrossRef]
- da Costa Arca, V.; Peres, A.M.; Machado, A.A.; Bona, E.; Dias, L.G. Sugars’ Quantifications Using a Potentiometric Electronic Tongue with Cross-Selective Sensors: Influence of an Ionic Background. Chemosensors 2019, 7, 43. [Google Scholar] [CrossRef]
- da Silva, A.; Braunger, M.L.; Neris Coutinho, M.A.; Rios do Amaral, L.; Rodrigues, V.; Riul, A. 3D-Printed Graphene Electrodes Applied in an Impedimetric Electronic Tongue for Soil Analysis. Chemosensors 2019, 7, 50. [Google Scholar] [CrossRef]
- Boisen, A.; Dohn, S.; Keller, S.S.; Schmid, S.; Tenje, M. Cantilever-like micromechanical sensors. Rep. Prog. Phys. 2011, 74, 036101. [Google Scholar] [CrossRef]
- Preumont, A. Vibration Control of Active Structures; Springer International Publishing: Cham, Switzerland, 2018. [Google Scholar] [CrossRef]
- Younis, M.I. MEMS Linear and Nonlinear Statics and Dynamics; Springer: Cham, Switzerland, 2011. [Google Scholar] [CrossRef]
- Homayouni-Amlashi, A.; Mohand-Ousaid, A.; Rakotondrabe, M. Analytical Modelling and Optimization of a Piezoelectric Cantilever Energy Harvester with In-Span Attachment. Micromachines 2020, 11, 591. [Google Scholar] [CrossRef]
- Costa, C.A.B.; Grazhdan, D.; Fiutowski, J.; Nebling, E.; Blohm, L.; Lofink, F.; Rubahn, H.G.; de Oliveira Hansen, R. Meat and fish freshness evaluation by functionalized cantilever-based biosensors. Microsyst. Technol. 2019, 26, 867–871. [Google Scholar] [CrossRef]
- Wang, Y.; Sobolewska, E.K.; Fiutowski, J.; Rubahn, H.G.; de Oliveira Hansen, R.; Albers, J.; Nebling, E.; Wagner, B.; Benecke, W.; Hansen, R.D.O. Functionalizing micro-cantilevers for meat degradation measurements. In Proceedings of the 2016 Symposium on Design, Test, Integration and Packaging of MEMS/MOEMS (DTIP), Budapest, Hungary, 30 May–2 June 2016. [Google Scholar] [CrossRef]
- Wang, Y.; Costa, C.A.B.; Sobolewska, E.K.; Fiutowski, J.; Brehm, R.; Albers, J.; Nebling, E.; Lofink, F.; Wagner, B.; Benecke, W.; et al. Micro-cantilevers for optical sensing of biogenic amines. Microsyst. Technol. 2017, 24, 363–369. [Google Scholar] [CrossRef]
- Powell, M. The BOBYQA Algorithm for Bound Constrained Optimization without Derivatives; Technical Report; Department of Applied Mathematics and Theoretical Physics: Cambridge, UK, 2009. [Google Scholar]
- Alexi, N.; Hvam, J.; Lund, B.W.; Nsubuga, L.; de Oliveira Hansen, R.M.; Thamsborg, K.; Lofink, F.; Byrne, D.V.; Leisner, J.J. Potential of novel cadaverine biosensor technology to predict shelf life of chilled yellowfin tuna (Thunnus albacares). Food Control 2020, 119, 107458. [Google Scholar] [CrossRef]


| Parameter | Value |
|---|---|
| Cantilever length | 1800 μm |
| Cantilever width | 1000 μm |
| Cantilever body thickness | 14 μm |
| Metal electrode thickness | 0.25 μm |
| Piezoelectric layer thickness | 1.5 μm |
| Piezoelectric layer material | Aluminum Nitride (AlN) |
| Metal electrode material | Gold (Au) |
| Material | Resonance Frequency in kHz | |||
|---|---|---|---|---|
| 1st Mode | 2nd Mode | 3rd Mode | ||
| Piezoelectric Material | AlN | |||
| PZT-5H | ||||
| ZnO | ||||
| Electrode layer | Au | |||
| Mo | ||||
| Cu | ||||
| Al | ||||
| Parameter | Bound (lb and ub) | Optimised Result |
|---|---|---|
| Cantilever length | [1000 μm, 2000 μm] | 1508.9 μm |
| Cantilever width | [500 μm, 1500 μm] | 1004.5 μm |
| Cantilever body thickness | [8 μm, 22 μm] | 8 μm |
| Piezoelectric layer thickness | [0.5 μm, 1.5 μm] | 0.866 μm |
| Silicon oxide layer thickness | [0.2 μm, 1 μm] | 0.733 μm |
| Aluminium contact layer thickness | [0.2 μm, 1μm] | 1 μm |
| Silicon nitride layer thickness | [0.2 μm, 1μm] | 0.4245 μm |
Publisher’s Note: MDPI stays neutral with regard to jurisdictional claims in published maps and institutional affiliations. |
© 2020 by the authors. Licensee MDPI, Basel, Switzerland. This article is an open access article distributed under the terms and conditions of the Creative Commons Attribution (CC BY) license (http://creativecommons.org/licenses/by/4.0/).
Share and Cite
Korsa, M.T.; Maria Carmona Domingo, J.; Nsubuga, L.; Hvam, J.; Niekiel, F.; Lofink, F.; Rubahn, H.-G.; Adam, J.; Hansen, R.d.O. Optimizing Piezoelectric Cantilever Design for Electronic Nose Applications. Chemosensors 2020, 8, 114. https://doi.org/10.3390/chemosensors8040114
Korsa MT, Maria Carmona Domingo J, Nsubuga L, Hvam J, Niekiel F, Lofink F, Rubahn H-G, Adam J, Hansen RdO. Optimizing Piezoelectric Cantilever Design for Electronic Nose Applications. Chemosensors. 2020; 8(4):114. https://doi.org/10.3390/chemosensors8040114
Chicago/Turabian StyleKorsa, Matiyas Tsegay, Josep Maria Carmona Domingo, Lawrence Nsubuga, Jeanette Hvam, Florian Niekiel, Fabian Lofink, Horst-Günter Rubahn, Jost Adam, and Roana de Oliveira Hansen. 2020. "Optimizing Piezoelectric Cantilever Design for Electronic Nose Applications" Chemosensors 8, no. 4: 114. https://doi.org/10.3390/chemosensors8040114
APA StyleKorsa, M. T., Maria Carmona Domingo, J., Nsubuga, L., Hvam, J., Niekiel, F., Lofink, F., Rubahn, H.-G., Adam, J., & Hansen, R. d. O. (2020). Optimizing Piezoelectric Cantilever Design for Electronic Nose Applications. Chemosensors, 8(4), 114. https://doi.org/10.3390/chemosensors8040114