Article

Sensing and Interaction of His-Tagged CA19-9 Antigen with Graphene-Modified Electrodes

1
National Institute for Research and Development of Isotopic and Molecular Technologies, Donat Street, 67-103, 400293 Cluj-Napoca, Romania
2
Laboratory of Electrochemistry and PATLAB, National Institute of Research for Electrochemistry and Condensed Matter, 202 Splaiul Independentei Street, 060021 Bucharest, Romania
3
Faculty of Applied Chemistry and Material Science, Politehnica University of Bucharest, 060021 Bucharest, Romania
*
Author to whom correspondence should be addressed.
Chemosensors 2020, 8(4), 112; https://doi.org/10.3390/chemosensors8040112
Submission received: 30 September 2020 / Revised: 28 October 2020 / Accepted: 4 November 2020 / Published: 5 November 2020

Abstract

:
The electrochemical oxidation of CA19-9 tagged with L-Histidine (CA199-His) was investigated for the first time with screen-printed electrodes (DS) modified with graphene oxide (DS/GO) or thermally reduced graphene oxide (DS/TRGO). Successive cyclic voltammograms (CV) measurements performed with bare and DS/TRGO electrodes proved that the intensity of the oxidation peak (I peak) is time-dependent. In fact, the oxidation signal increased over time, reached a maximum and then decreased due to the saturation of the surface with CA199-His molecules. The interaction of CA199-His with GO, TRGO, or graphite was additionally studied by isothermal calorimetry, a useful tool for accessing information regarding the biomolecule adsorption on graphene surface. The adsorption of CA199-His on TRGO was generating a higher heat, suggesting quantitative and efficient interactions. At the same time, in the case of TRGO, the saturation was not reached, indicating the existence of more free binding sites than in the case of GO and graphite. As such, the carbohydrate marker CA199-His showed a higher affinity for the TRGO surface than for the graphite or GO surfaces. The lack of saturation in the case of TRGO may indicate a continuous structural modification of the antigen when interacting with the graphene surface.

Graphical Abstract

1. Introduction

The early diagnosis in cancer is strongly related to the outcome of this disease in most patients. The accurate and selective detection of cancer biomarkers is important not only in the diagnosis, but also in the screening and monitoring of the disease. The current methods are reliable but suffer from major drawbacks such as the need for complex equipment and time consumption [1]. The researchers in the field are continuously exploring the possibilities to find newer and faster detection techniques.
The carbohydrate CA19-9 antigen is specific for gastrointestinal cancer tumors and represents a highly sialylated glycoprotein showing 85% carbohydrate by weight [2] that attaches to O-glycans on the surface of cells and plays a vital role in the cell-to-cell recognition processes. Over the years, it has been intensively studied and its importance has been proven in the detection of pancreatic cancer, ovarian cancer, gastric cancer, colorectal, and liver cancer [3]. To date, the clinical quantification of CA19-9 includes the chemiluminescent immunoassay [4], radioimmunoassay [5], and enzyme-linked immunoassay [6]. Lately, the detection of CA19-9 by electrochemical methods is considered to be simpler and more sensitive, but still dependent on the antigen–antibody interaction. As such, most of the electrochemical studies have been based on the construction of immunosensors on nanomaterials in order to improve the signal by the increased surface area of the modified electrode. Multiwalled carbon nanotubes in combination with magnetite nanoparticles (Fe3O4-MCNTs) [7] or bimetallic cerium and magnetite nanoparticles on a carbon matrix [8] are efficient examples for biosensor platforms. So far, the electrochemical detection of CA19-9 with bare electrodes or a simple surface-modified with nanomaterials has not been achieved. One of the reasons may be related to the large percentage of carbohydrate structures or its complex conformation, which hinders the exposure of the few functional groups toward oxidation.
An electrochemical immunosensor based on a redox-active poly (N,N-diphenyl-p-phenylene diamine) with bimetallic Au/Pt nanoparticles was used for the label-free ultralow detection of carbohydrate antigen 199 [9]. The advantages of bimetallic AuPt alloys in the construction of label-free immunosensors [10] with L-proline as a stabilizing platform have been explored in the ultrasensitive monitorization of CA19–9 [11]. The enhanced electrocatalytic activity and biocompatibility of bimetallic nanoparticles-based composites facilitated the construction of further label-free electrochemical immunosensors for CA19–9, for example, AuAg nanocrystals stabilized by polycytidysic acid [12] or cerium-iron oxides embedded in a mesoporous carbon matrix [8]. Another simple electrochemical immunosensor for CA 19–9 detection was built by using a chitosan-gold nanoparticles nanocomposite [13]. Recently, Ref. [14] CA 19-9 was used as a model analyte biomarker to test the performances of a sandwich-type amperometric immunosensor based on polydopamine-silver nanoparticles modified with an antibody, together with a graphene oxide-melamine composite as an electrochemical platform. Excellent results have also been reported on a capacitive immunosensor based on screen-printed interdigitated electrodes modified with nanostructured carbon nano-onion and graphene oxide films, labeled with an antibody [15].
One of the previous studies stated that it is not possible to observe the specific oxidation of L-Hystidine onto solid electrodes [16]. However, recent experiments conducted on boron-doped diamond electrodes [17] and glassy carbon electrodes [18] showed the opposite. The investigation of the electrochemical behavior of L-Histidine is important due to the fact that proteins designed with the L-His tag can be attached onto solid electrodes through their tag [19]. In our case, the interest was in investigating the interaction of the CA199-His protein marker with various carbon surfaces (graphene; graphene-oxide; graphite) and to corroborate the signal from L-Histidine with the concentration of CA199-His.
The employed techniques were cyclic voltammetry and electrochemical impedance spectroscopy followed by the thermodynamic evaluation through isothermal titration calorimetry. The His tag is an amino acid motif consisting of six L-Histidine residues, linked to the carboxyl (C-) or amino (N-) terminus of the target protein. The advantage of employing the CA199-His molecule is that the imidazole side-chain of histidine is prone to electrochemical oxidation and, according to the literature, the addition of the His tag has a negligible perturbation to the protein structure and function [20].
In this paper, the electrochemical oxidation of the CA199-His molecule was investigated for the first time with screen-printed electrodes (DS) modified with graphene oxide (DS/GO) or thermally reduced graphene oxide (DS/TRGO) and the results were compared with those obtained for bare electrodes. In addition, the interaction of CA199-His with GO, TRGO, or graphite was studied by isothermal calorimetry, a useful tool for accessing information regarding the biomolecule adsorption on the graphene surface, as previously described for nucleobases [21] or ssDNS [22].

2. Materials and Methods

His tag CA19–9 (Carbohydrate antigen N-terminal His Tag) was purchased from MyBioSource and denoted as CA199-His. Tris(hydroxymethyl)aminomethane hydrochloride (Tris-HCl) was purchased from Merck Chemicals. Graphite was purchased from Sigma-Aldrich (particle size <20 µm; catalog number: 282863). The buffer for ITC experiments was 20 mM Tris, 150 mM NaCl (pH 8.5). Graphene oxide (GO) and thermally reduced graphene oxide (TRGO, the reduction temperature was 400 °C) were prepared according to the procedures described in our previous papers [23,24]. In the most recent paper [24], we demonstrated that by controlling the temperature during GO reduction, we could design materials with the desired composition. The optimum reduction temperature was determined to be 400 °C, where the highest percent (82%) of few layer graphene was obtained. In addition, the XPS analysis indicated a significant change in the percentage of element distribution, from 70.73% C and 29.27% O in GO to 86.6% C and 13.4% O in the trGO-400 sample.

2.1. Electrochemical Measurements

The electrochemical measurements (Cyclic Voltammetry-CV; Electrochemical Impedance Spectroscopy-EIS) were recorded with a Potentiostat/Galvanostat Instrument (PGSTAT-302N, Metrohm-Autolab B.V., Utrecht, The Netherlands) connected to the screen-printed electrode via a mini-device. The CV measurements were generally run with a scan rate of 10 mVs−1. The EIS analysis was performed at an applied potential of +1.1 V (within 0.1–106 Hz) under a small excitation signal (10 mV). A volume of 50 µL solution was generally dropped onto the electrode surface during the measurements.
For SEM analysis of the bare DS electrode and DS modified with TRGO/GO, a Hitachi SU8230 SEM instrument (Tokyo, Japan) operating at 5 kV was employed.

2.2. Screen-Printed Electrodes Modified with Graphene Oxide (GO) or Thermally Reduced Graphene Oxide (TRGO)

GO and TRGO powders were dispersed in N,N-Dimethylformamide (1 mg/mL) for three minutes using an ultrasonic finger device (SONICS Vibra Cell, Newtown, CT, USA). The obtained suspensions were next used to modify the screen-printed electrodes bought from Drop-Sens (DS), Spain. A total volume of 10 µL solution was drop casted on their surfaces, which was then dried at room temperature for 24 h. The modified electrodes were correspondingly denoted as DS/GO and DS/TRGO.

2.3. Isothermal Titration Calorimetry (ITC)

A Nano ITC2G Calorimeter (TA Instruments, New Castle, DE, USA) was used for the thermodynamic binding experiments. Before each titration, all solutions were degassed (Ar) prior to loading into the ITC cell.
ITC experiments were carried out with both L-Histidine (L-His) of 45.92 mM concentration and CA199-His (43 µg/mL). The solutions were injected into the calorimetric vessel that contained the graphene (4 mg/mL for TRGO and 1 mg/mL for GO) or graphite (4 mg/mL) suspensions by using a Hamilton syringe. The reference cell was filled with 20 mM Tris buffer (pH 8.5). The experiments consisted of titrating the two compounds (L-Histidine or CA199-His) into the graphene solutions, typically by injecting 10 μL of solution at each 200 s for TRGO and 300 s for GO, respectively. These time intervals between injections were set in order to allow the heat signal to return to the baseline, after each injection. In order to ensure a rapid and complete mixing of L-His or CA199-His with graphene solution, the content in the sample cell was thoroughly stirred at a stirring speed of 350 rpm. During L-His or CA199-His addition, the molecules interacted and the observed released heat was directly proportional to the amount of binding compound added with the solution aliquot. By measuring the enthalpy change at each injection, the raw data consisting of 25 peaks were obtained as a plot of heat flow (kJ·s−1) against time (minute). Dilution heat of the two compounds (L-Histidine or CA199-His) was measured under identical experimental conditions by injecting it into a 20 mM Tris buffer (pH 8.5).

3. Results and Discussion

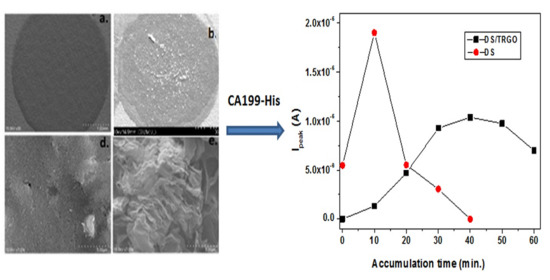
3.1. Morphological Characterization of the Electrodes

The morphological characteristics of DS electrodes (bare and modified with TRGO or GO) can be seen in Figure 1a–f. Significant differences were observed between the electrodes, both in the low and high-magnification SEM images.
The bare DS electrode exhibits a flat and relatively smooth surface (Figure 1a,d) while the DS/TRGO modified electrode (Figure 1b) has a porous appearance due to the successively deposited TRGO layers. Such overlapped layers with the lateral size in the range of micrometers can be clearly seen in the high-magnification SEM image (Figure 1e). In the case of the DS/GO electrode, the GO flakes were uniformly distributed over the DS surface (Figure 1c) and the high-magnification image revealed that the flakes were also large, over 5 µm (Figure 1f). Optical images of such electrodes are also presented in Figure 1 (one of them is attached to a mini-device).
There are many advantages in using DS electrodes, mainly related to their single-use capability (which avoids contamination between different samples) or with the possibility of attaching them to a mini-device for on-site monitoring (see Figure 1). In order to compare the electro-catalytic properties of bare and graphene-modified electrodes, the active area of each electrode was determined. For this purpose, CVs were recorded with different scanning rates (from 2 to 50 mV/s) in 1 mM K4[Fe (CN)6] + 0.2 M KCl supporting electrolyte [25]. The values for the active areas were found to be 0.083, 0.014, and 0.14 cm2 for DS, DS/GO, and DS/TRGO, respectively.
Figure 2 shows the CVs (current densities) recorded with DS (black), DS/GO (red), and DS/TRGO (blue) electrodes in the 1 mM K4[Fe(CN)6] + 0.2 M KCl supporting electrolyte at a scanning rate of 10 mV/s. In all cases, the redox process is quasi-reversible, being characterized by a large peak potential separation (ΔEp ~90 mV) and Ipa > Ipc. No significant shift took place in the peak potential after electrode modification, either with GO or with TRGO.
Before testing the electrochemical oxidation of CA199-His at the bare and DS modified electrodes, the L-Histidine behavior was investigated by cyclic voltammetry in a phosphate buffer saline (PBS) electrolyte of various pH, from 6 to 8. L-Histidine contains one α-amino group (protonated under physiological conditions, −NH3+), a carboxylic acid group (deprotonated under physiological conditions, –COO), and an imidazole side chain that is neutral (pI = 7.59) [26].
Even though the presence of the imidazole ring in the structure of L-Histidine is indicative for an electrochemically active amino acid, the oxidation peak is weak and appears at high potentials. Unlike other amino acids, the electrochemical oxidation of L-Histidine proved to be dependent on the electrode surface. On ceramic electrodes, an electrochemical polymerization occurs, as reported by Chen et al. 2008 [17]. On metallic electrodes, the decarboxylation of the free carboxylic acid and the formation of free imidazole were reported [27], but this mechanism cannot be considered for the His-tagged molecule. As such, the mechanism described by Brett et al. [18] is the most suitable assumption, with the imidazole ring transferring one electron and one proton and the formation of the 4-imidazolin-2-one ring (see the inset, Figure 3).
Figure 3 presents the CVs recorded with the bare DS electrode in PBS solutions (pH from 6 to 8), each containing 10−3 M L-Histidine. In all cases, the oxidation peak appeared as a broad wave at around +1.1 V, indicating a slow transfer of electrons between the DS surface and the analyte molecules. In addition, no reduction peak was observed in the cathodic scan, so the process is irreversible. The peak current (Ip) reached its maximum intensity at pH 7.6, therefore this pH value was chosen for further electrochemical studies regarding the oxidation of CA199-His molecules.
In order to understand the interaction of CA199-His with GO, TRGO, or graphite, electrochemical measurements were performed with bare and DS modified electrodes, evidencing for the first time the oxidation signal of this molecule. Hence, the DS, DS/GO, and DS/TRGO electrodes were preliminary tested in the presence of CA199-His in order to compare their electro-catalytic properties toward the selected analyte. CA199-His (43 kDa molar mass) is a large molecule and its interaction with various surfaces depends both on its conformation and the functional groups present on the surface. The isoelectric point of L-Histidine is 7.59, therefore in pH 7.6 PBS solution, the His tag is electrically neutral. Consequently, no electrostatic interactions occur between the His tag and the electrode surface. Instead, π–π stacking interactions may occur between the aromatic ring of L-Histidine and the graphite or TRGO surface.
Successive CV measurements recorded with bare DS and TRGO/DS electrodes have proven that the intensity of the oxidation peak (Ipeak) is time-dependent (Figure 4a,b). In fact, the oxidation signal increased over time, reached a maximum, and then decreased due to the saturation of the surface with CA199-His molecules. In contrast, the electrochemical signal recorded with the DS/GO electrode did not change in time and the absence of the oxidation peak can be noted (Figure 4c).
A maximum peak current of 1.9 × 10⁻⁵ A was reached in 10 min for the bare DS electrode, as can be seen in Figure 5 (red curve). After that period of time, Ipeak significantly decreased due to the saturation of the surface with CA199-His molecules that block the transfer of electrons from the neighboring molecules. A different situation was observed in the case of the DS/TRGO electrode, where a longer accumulation time was needed in order to obtain the maximum oxidation signal (1.04 × 10⁻⁵ A) for CA199-His molecules. The peak intensity reached its maximum after 40 min and the signal gradually decreased during the next 20 min.
Since the bare DS electrodes had better performances in terms of peak current and accumulation time, they were further used to record the signal of CA199-His, having various concentrations (from 1 × 10⁻⁵ to 6 × 10⁻⁵ g/mL, Figure 6a). Each concentration was recorded with a new electrode, after 10 min accumulation time (from DS1 to DS7; DS1 was used only for background recording, in pH 7.6 PBS). As can be seen in Figure 6b, the signal from L-Histidine linearly increased with concentration, allowing us to obtain a calibration curve. It is important to emphasize that at concentrations higher than 6 × 10⁻⁵ g/mL, the electrochemical signal did not increase, proving the saturation of the electrode surface with CA199-His proteins.
The bare DS electrode was further characterized by electrochemical impedance spectroscopy (EIS). Figure 7a presents the Nyquist plots recorded in pH 7.6 PBS solution containing 0.07 mg/mL CA199-His. In order to see the effect of CA199-His accumulation on the bare DS surface, the spectra were recorded over longer time (25 min). The EIS data were fitted with an electrical equivalent circuit containing the solution resistance (Rs) and two RC parallel circuits, where the capacitances were replaced by constant phase elements (CPEs). One of the resistances was attributed to the charge-transfer resistance (Rct) while the other element, RL, was attributed to the resistance of the CA199-His layer attached to the electrode surface, which prevents the oxidation of the neighboring molecules.
The variation of the charge-transfer resistance with the accumulation time can be seen in Figure 7b. As expected, its value was relatively low (1.1 kΩ) when the electrode surface was partly covered with CA199-His molecules and gradually increased up to 2.2 kΩ, indicating the surface blockage and saturation. The EIS results were in excellent agreement with those obtained by CVs, where the highest peak current was achieved after 10 min accumulation time, when according to the impedance data, the surface was almost fully covered by the analyte molecules.

3.2. Thermodynamic Analysis by Isothermal Titration Calorimetry (ITC)

In order to estimate the thermodynamic contribution of L-Histidine to the overall adsorption of CA199-His on various surfaces, the isothermal titration calorimetry experiments of free L-His with graphene oxide, thermally reduced graphene oxide and graphite were performed. In a typical experiment, small volumes of L-His were injected into the graphite, GO, or TRGO suspension and the rate of heat release was recorded as a function of time. In all cases, the interaction was exothermic and the amplitude of the peaks was reduced after progressive injections, as the number of available free sites for binding the L-His molecules on the material decreased.
Figure 8 shows the raw data obtained by titration of 45.92 mM L-His solution into the graphite (4 mg/mL), GO (1 mg/mL), or TRGO (4 mg/mL) suspension. As expected, the background heat of titrating L-His in buffer (Figure 8a) was smaller compared to the interaction experiments (Figure 8b–d). The blank peaks were sharper and the reaction kinetics were much faster compared to that of the titrations. On the other hand, by comparing Figure 8c with Figure 8d, one can see that the heat release after five injections was relatively large, suggesting quantitative and efficient reactions. For the final injections, the decrease in the heat revealed the saturation of graphene surface by L-His. This indicates that approximately 357 µg of L-Histidine was adsorbed on either 1 mg/mL GO or 4 mg/mL TRGO. As such, one can conclude that the thermodynamic interaction between L-His and GO is stronger than that with TRGO, suggesting that the oxygen functionalities present on the surface of graphene oxide play an important role. In the case of the graphite suspension (Figure 8b), the heat release progressively decreased as more L-His was injected in the suspension. Although the peaks were well defined compared with TRGO, the saturation was not reached at this concentration. This suggests the presence of more binding sites with high energy on the graphite surface.
Next, the experiments were devoted to studying the interaction between CA199-His and GO, TRGO, or graphite suspensions. Figure 9 shows the raw data obtained by titration of 43 µg/mL CA199-His solution into GO (1 mg/mL), TRGO (4 mg/mL), or graphite (4 mg/mL). The raw ITC data for the blank titration of 43 µg/mL CA199-His in buffer are presented in Figure 9a and show that the process is exothermic at the same volumes of injection.
By comparing Figure 9b–d, one can see that the amount of heat released at the interaction of CA199-His with TRGO was higher and the amplitude of the peaks decreased with the amount of added protein. This suggests the existence of quantitative and efficient reactions. The lack of saturation for the interaction of CA199-His with TRGO indicates a complex interaction between the tagged carbohydrate antigen and the aromatic graphene surface. On the other hand, it is interesting to note that the heat released after injection of CA199-His in the graphite and GO suspension reached a plateau, after which the heat started to decrease. This indicates that the adsorption sites on the graphene oxide and graphite surface were saturated with the carbohydrate antigen.
In general, the amplitude of the heat release during the interactions with CA199-His was higher than that with L-His molecules, indicating a stronger interaction of the carbohydrate antigen with the graphene-based materials and graphite. Due to the proven interaction between L-His and graphite/GO/TRGO, it is clear that the existence of His tag on the CA 19-9 antigen plays an important role in its adsorption on the graphene surface.
The adsorption of CA199-His on TRGO generates a higher heat, suggesting quantitative and efficient interactions. At the same time, in the case of TRGO, the saturation was not reached, which may be attributed to the existence of more free binding sites than in the case of GO and graphite. As such, the carbohydrate marker CA199-His showed a higher affinity for the TRGO surface than for the graphite or GO surfaces. The lack of saturation in the case of TRGO can also indicate a continuous structural modification of the antigen when interacting with the graphene surface.

4. Conclusions

CA199-His (43 kDa molar mass) is a large molecule and its interaction with various surfaces depends both on its conformation and the functional groups present on the surface. In order to understand the interaction of CA199-His with GO, TRGO, or graphite, electrochemical measurements were performed with bare and DS modified electrodes, evidencing for the first time the oxidation signal of this molecule. The CV recordings indicated that a maximum peak current (Ipeak) of 1.9 × 10⁻⁵ A was reached in 10 min with the bare DS electrode. After that period of time, Ipeak significantly decreased due to the saturation of the surface with CA199-His molecules that blocked the transfer of electrons from the neighboring molecules. A different situation was observed in the case of the DS/TRGO electrode, where a longer accumulation time (40 min) was needed in order to obtain the maximum oxidation signal (1.04 × 10⁻⁵ A) for CA199-His molecules. In the case of the DS/GO electrode, no oxidation signal was recorded. In addition, the isothermal calorimetry experiments proved that the amount of heat released at the interaction of CA199-His with TRGO was higher in comparison with GO or graphite. Moreover, in the case of TRGO, the saturation was not reached, indicating the existence of more free binding sites compared to GO or graphite.

Author Contributions

Methodology, investigation and formal analysis: M.M., C.V., F.P., C.S. and M.C. Writing—original draft preparation: M.M., C.S. and S.P. Review and editing: R.-I.S.-v.S. and S.P. All authors have read and agreed to the published version of the manuscript.

Funding

This work was supported by a grant of Romanian Ministry of Research and Innovation, CNCS-UEFISCDI, project number PN-III-P4-ID-PCCF-2016-0006, within PNCDI III and by Nucleu Program contract no. PN 19 35 02 02/2019.

Acknowledgments

The authors are grateful to Maria Suciu for the SEM investigation of the bare and DS modified electrodes.

Conflicts of Interest

The authors declare no conflict of interest.

References

  1. Rusling, J.F.; Kumar, C.V.; Gutkind, J.S.; Patel, V. Measurement of biomarker proteins for point-of-care early detection and monitoring of cancer. Analyst 2010, 135, 2496–2511. [Google Scholar] [CrossRef] [PubMed] [Green Version]
  2. Klug, T.L.; LeDonne, N.C.; Greber, T.F.; Zurawski, V.R., Jr. Purification and composition of a novel gastrointestinal tumor-associated glycoprotein expressing sialylated lacto-N-fucopentaose II (Ca19-9). Cancer Res. 1988, 48, 1505–1511. [Google Scholar] [PubMed]
  3. Yang, F.; Yang, Z.; Zhuo, Y.; Chai, Y.; Yuan, R. Ultrasensitive electrochemical immunosensor for carbohydrate antigen 19-9 using Au/porous graphene nanocomposite as platform and Au@Pd core/shell bimetallic functionalized graphene nanocomposites as signal enhancers. Biosens. Bioelectron. 2015, 66, 356–362. [Google Scholar] [CrossRef] [PubMed]
  4. Lin, J.; Ju, H. Electrochemical and chemiluminescent immunosensors for tumor markers. Biosens. Bioelectron. 2005, 20, 1461–1470. [Google Scholar] [CrossRef]
  5. Ching, C.K.; Rhodes, J.M. Enzyme-linked PNA lectin binding assay compared with CA19-9 and CEA radioimmunoassay as a diagnostic blood test for pancreatic cancer. Br. J. Cancer 1989, 59, 949–953. [Google Scholar] [CrossRef] [Green Version]
  6. Goonetilleke, K.S.; Siriwardena, A.K. Systematic review of carbohydrate antigen (Ca19-9) as a biochemical marker in the diagnosis of pancreatic cancer. Eur. J. Surg. Oncol. 2007, 33, 266–270. [Google Scholar] [CrossRef]
  7. Huang, Y.; Wen, Y.; Baryeh, K.; Takalkar, S.; Lund, M.; Zheng, X.; Liu, G. Lateral flow assay for carbohydrate antigen 19-9 in whole blood by using magnetized carbon nanotubes. Microchim. Acta 2017, 184, 4287–4294. [Google Scholar] [CrossRef] [PubMed]
  8. Wang, M.; Hu, M.; Hu, B.; Guo, C.; Song, Y.; Jia, Q.; He, L.; Zhang, Z.; Fang, S. Bimetallic cerium and ferric oxide nanoparticles embedded within mesoporous carbon matrix: Electrochemical immunosensor for sensitive detection of carbohydrate antigen 19-9. Biosens. Bioelectron. 2019, 135, 22–29. [Google Scholar] [CrossRef]
  9. Wang, L.; Shan, J.; Feng, F.; Ma, Z. Novel redox species polyaniline derivative-Au/Pt as sensing platform for label-free electrochemical immunoassay of carbohydrate antigen 199. Anal. Chim. Acta 2016, 91, 108–113. [Google Scholar] [CrossRef] [PubMed]
  10. Tao, M.; Li, X.; Wu, Z.; Wang, M.; Hua, M.; Yang, Y. The preparation of label-free electrochemical immunosensor based on the Pt-Au alloy nanotube array for detection of human chorionic gonadotrophin. Clin. Chim. Acta 2011, 412, 550–555. [Google Scholar] [CrossRef] [PubMed]
  11. Weng, X.; Liu, Y.; Xue, Y.; Wang, A.J.; Wu, L.; Feng, J.J. L-Proline bio-inspired synthesis of AuPt nanocalliandras as sensing platform for label-free electrochemical immunoassay of carbohydrateantigen 19-9. Sens. Actuators B 2017, 250, 61–68. [Google Scholar] [CrossRef]
  12. Wang, R.; Feng, J.J.; Liu, W.D.; Jiang, L.Y.; Wang, A.J. A novel label-free electrochemical immunosensor based on the enhanced catalytic currents of oxygen reduction by AuAg hollow nanocrystals for detecting carbohydrate antigen 199. Biosens. Bioelectron. 2017, 96, 152–158. [Google Scholar] [CrossRef]
  13. Rong, Q.; Feng, F.; Man, Z. Metal ions doped chitosan–poly(acrylic acid) nanospheres: Synthesis and their application in simultaneously electrochemical detection of four markers of pancreatic cancer. Biosens. Bioelectron. 2016, 75, 148–154. [Google Scholar] [CrossRef]
  14. Zhang, N.; Zhang, D.; Chu, C.; Ma, Z. Label-assisted chemical adsorption triggered conversion of electroactivity of sensing interface to achieve the Ag/AgCl process for ultrasensitive detection of CA 19-9. Anal. Chim. Acta 2020, 1093, 43–51. [Google Scholar] [CrossRef]
  15. Ibanez-Redin, G.; Furuta, R.H.M.; Wilson, D.; Shimizu, F.M.; Materon, E.M.; Rebolho Batista Arantes, L.M.; Melendezd, M.E.; Carvalhod, A.L.; Reis, R.M.; Chaur, M.N.; et al. Screen-printed interdigitated electrodes modified with nanostructured carbon nano-onion films for detecting the cancer biomarker CA19-9. Mater. Sci. Eng. C 2019, 99, 1502–1508. [Google Scholar] [CrossRef]
  16. Malfoy, B.; Reynaud, J.A. Electrochemical investigations of amino acids at solid electrodes. J. Electroanal. Chem. Interfacial Electrochem. 1980, 114, 213–223. [Google Scholar] [CrossRef]
  17. Chen, L.; Chang, C.; Chang, H. Electrochemical oxidation of histidine at an anodic oxidized boron-doped diamond electrode in neutral solution. Electrochim. Acta 2008, 53, 2883–2889. [Google Scholar] [CrossRef]
  18. Enache, T.A.; Oliveira-Brett, A.M. Peptide methionine sulfoxide reductase A (Msra): Direct electrochemical oxidation on carbon electrodes. Bioelectrochemistry 2013, 89, 11–18. [Google Scholar] [CrossRef]
  19. Ley, C.; Holtmann, D.; Mangold, K.M.; Schrader, J. Immobilization of histidine-tagged proteins on electrodes. Colloids Surf. B 2011, 88, 539–551. [Google Scholar] [CrossRef]
  20. Thielges, M.C.; Chung, J.K.; Axup, J.Y.; Fayer, M.D. The influence of histidine tag attachment on picosecond protein dynamics. Biochemistry 2011, 50, 5799–5805. [Google Scholar] [CrossRef] [Green Version]
  21. Varghese, N.; Mogera, U.; Govindaraj, A.; Das, A.; Maiti, P.K.; Sood, A.K.; Rao, C.N.R. Binding of DNA nucleobases and nucleosides with graphene. ChemPhysChem 2009, 10, 206–210. [Google Scholar] [CrossRef]
  22. Ranganathan, S.V.; Halvorsen, K.; Myers, C.A.; Robertson, N.M.; Yigit, M.V.; Chen, A.A. Complex thermodynamic behavior of single-stranded nucleic acid adsorption to graphene surfaces. Langmuir 2016, 32, 6028–6034. [Google Scholar] [CrossRef] [PubMed]
  23. Pogacean, F.; Socaci, C.; Pruneanu, S.; Biris, A.R.; Coros, M.; Magerusan, L.; Katona, G.; Turcu, R.; Borodi, G. Graphene based nanomaterials as chemical sensors for hydrogen peroxide—A comparison study of their intrinsic peroxidase catalytic behavior. Sens. Actuators B 2015, 213, 474–483. [Google Scholar] [CrossRef]
  24. Coros, M.; Pogacean, F.; Turza, A.; Dan, M.; Berghian-Grosan, C.; Pana, I.O.; Pruneanu, S. Green synthesis, characterization and potential application of reduced graphene oxide. Physica E 2020, 119, 113971. [Google Scholar] [CrossRef]
  25. García-Miranda Ferrari, A.; Foster, C.W.; Kelly, P.J.; Brownson, D.A.C.; Banks, C.E. Determination of the electrochemical area of screen-printed electrochemical sensing platforms. Biosensors 2018, 8, 53. [Google Scholar] [CrossRef] [Green Version]
  26. Edsall, J.T.; Wyman, J. Biophysical Chemistry, Thermodynamics, Electrostatics, and the Biological Significance of the Properties of Matter, Chapter 8; Academic Press: Cambridge, MA, USA, 1958. [Google Scholar]
  27. Ogura, K.; Kobayashi, M.; Nakayama, M.; Miho, Y. In-situ FTIR studies on the electrochemical oxidation of histidine and tyrosine. J. Electroanal. Chem. 1999, 463, 218–223. [Google Scholar] [CrossRef]
Figure 1. Low and high-magnification SEM images of the electrodes: bare DS electrode (a,d); DS/TRGO (b,e); DS/GO (c,f); scale bar 1.0 mm (ac); scale bar 5.0 µm (df). Optical images of screen-printed electrodes: DS (1); DS/GO (2); DS/TRGO (3).
Chemosensors 08 00112 g001
Figure 2. CVs showing the current density recorded with DS (black); DS/GO (red) and DS/TRGO (blue), in solution containing 1 mM K4[Fe(CN)6] + 0.2 M KCl; scanning rate 10 mV/s.
Chemosensors 08 00112 g002
Figure 3. CVs recorded with bare DS electrode in solution containing 10−3 M L-Histidine; PBS supporting electrolyte: pH 6 (green); pH 7.6 (red); pH 8 (blue); scan rate 10 mV/s; inset: the electrochemical oxidation of L-Histidine.
Chemosensors 08 00112 g003
Figure 4. CVs recorded at different accumulation time with bare DS (a), DS/TRGO (b), and DS/GO (c) in the presence of 0.07 mg/mL CA199-His in pH 7.6 PBS solution; 10 mV/s scan rate.
Chemosensors 08 00112 g004
Figure 5. Ipeak versus accumulation time of CA199-His at bare DS (red) and DS/TRGO modified electrode (black) in the presence of 0.07 mg/mL CA199-His (pH 7.6 PBS supporting electrolyte).
Chemosensors 08 00112 g005
Figure 6. CVs recorded with bare DS electrodes in the presence of CA199-His having various concentrations, from 1 × 10⁻⁵ to 6 × 10⁻⁵ g/mL; scan rate 10 mV/s (a). Calibration curve obtained with bare DS electrodes for CA199-His (b).
Chemosensors 08 00112 g006
Figure 7. Nyquist plots recorded over time with the bare DS electrode in pH 7.6 PBS solution containing 0.07 mg/mL CA199-His; applied potential: +1.1 V; 0.1–106 Hz frequency range (a); inset: electrical equivalent circuit employed for fitting the recorded EIS data; Variation of Rct with the accumulation time (b).
Chemosensors 08 00112 g007
Figure 8. ITC data recorded for the interaction of L-His with different materials. ITC response for the blank titration (a); the raw data for the titration of 4 mg/mL graphite (b); 1 mg/mL GO (c); and 4 mg/mL TRGO (d) with L-His.
Chemosensors 08 00112 g008
Figure 9. ITC data recorded for the interaction of CA199-His with different materials. ITC response for the blank titration (a); the raw data for the titration of 4 mg/mL graphite (b); 1 mg/mL GO (c); and 4 mg/mL TRGO (d) with CA199-His.
Chemosensors 08 00112 g009
Publisher’s Note: MDPI stays neutral with regard to jurisdictional claims in published maps and institutional affiliations.

