Article

Novel Platinum-Porphyrin as Sensing Compound for Efficient Fluorescent and Electrochemical Detection of H2O2

1
“Coriolan Dragulescu” Institute of Chemistry of Romanian Academy, Mihai Viteazu Ave., No. 24, 300223 Timisoara, Romania
2
Institute of Macromolecular Chemistry “Petru Poni”, Grigore Ghica Vodă Alley, No. 41A, 700487 Iasi, Romania
3
Faculty of Industrial Chemistry and Environmental Engineering, Politehnica University of Timisoara, Vasile Pârvan Ave., No. 6, RO 300223 Timisoara, Romania
*
Author to whom correspondence should be addressed.
Chemosensors 2020, 8(2), 29; https://doi.org/10.3390/chemosensors8020029
Submission received: 18 March 2020 / Revised: 20 April 2020 / Accepted: 21 April 2020 / Published: 23 April 2020

Abstract

:
Metalloporphyrins are highly recognized for their capacity to act as sensitive substances used in formulation of optical, fluorescent, and electrochemical sensors. A novel compound, namely Pt(II)-5,10,15,20-tetra-(4-allyloxy-phenyl) porphyrin, was synthesized by metalation with PtCl2(PhCN)2 of the corresponding porphyrin base and was fully characterized by UV-vis, fluorimetry, FT-IR, 1H-NMR, and 13C-NMR methods. The fluorescence response of this Pt-porphyrin in the presence of different concentrations of hydrogen peroxide was investigated. Besides, modified glassy carbon electrodes with this Pt-porphyrin (Pt-Porf-GCE) were realized and several electrochemical characterizations were comparatively performed with bare glassy carbon electrodes (GCE), in the absence or presence of hydrogen peroxide. The Pt-porphyrin demonstrated to be a successful sensitive material for the detection of hydrogen peroxide both by fluorimetric method in a concentration range relevant for biological samples (1.05–3.9 × 10⁻⁷ M) and by electrochemical method, in a larger concentration range from 1 × 10⁻⁶ M to 5 × 10⁻⁵ M. Based on different methods, this Pt-porphyrin can cover detection in diverse fields, from medical tests to food and agricultural monitoring, proving high accuracy (correlation coefficients over 99%) in both fluorimetric and electrochemical measurements.

Graphical Abstract

1. Introduction

The detection and quantification of oxygen in its various forms is of great importance because reactive oxygen species (ROS), such as: peroxide radicals (ROO), hydroxyl radical (OH), hydrogen peroxide (H2O2), singlet oxygen (1O2), and ozone (O3) are intracellularly generated during some of the enzymatic oxidation processes that are involved in the metabolism of proteins, carbohydrates and fats [1]. The normal concentrations of H2O2 for plasma were determined to be 1–5 µM, while higher values, in the range of 30–50 µM, can appear during chronic inflammation [2]. In the urine of healthy subjects, the creatinine-corrected H2O2 concentration varies in the range 276–1844 µM, regardless of gender [3]. Reduced oxygen levels are developed in cardiac and brain ischemia [4]. Moreover, H2O2 present in blood can interact with Fe2+ ions contributing to oxidative stress [5].
Quantifying the dissolved O2 in water was realized using a three-dimensional matrix, containing platinum-tetraphenylporphyrin bonded with 3-(trimethoxysilyl)-propyl-methacrylate on the surface of polydimethylsiloxane with a detection limit of 4.7 µM [6]. The detection is based on the reversible fluorescence response of the Pt-porphyrin to different concentrations of dissolved O2 in water. Based on the same method, other platinum fluorescent compound, Pt(II)-5-(3-aminophenyl)-10,15,20-tris-(p-tolyl)-porphyrin, incorporated in polyimide polymers was capable of detecting oxygen in concentrations up to 10% [7].
Composite strips comprising Pt(II)-meso-tetrakis-(pentafluorophenyl)-porphyrin and cadmium telluride quantum dots were used for rapid colorimetric determination [8,9] of oxygen. High fluorescence quantum yield hybrid materials based on phenylacetylide fibers functionalized with platinum (II) meso-tetraphenylporphyrins were developed and showed improved sensitivity to O2, providing a detection limit of 7.5 ppm. The response to oxygen detection was significantly improved by adding silver nanoparticles to the hybrid material [9]. A recent work [10] showed that Pt (II)-complex with octaethylporphyrin-ketone is a near-infrared spectroscopy (NIR) emitting oxygen indicator.
Pt-porphyrins have been used extensively in polymeric membranes to detect molecular oxygen, but because of their small tendency to bind axial ligands [11,12] they have not been largely investigated as ionophores [13]. Potentiometric studies of Pt-porphyrins as ionophores became significant only after platinum-tetraphenylporphyrinates–based polymeric film sensors were successfully applied for analysis of wines [14]. Few years later, electrodes prepared with membrane containing Pt(II)-tetraphenylporphyrin responded to iodide with the Nernstian slope of 58.8 mV per decade, in 10−5 to 10−2 M iodide activity range. The same study revealed that Pt(II)-octaethylporphyrin exhibits enhanced selectivity for iodide-ion recognition than Pt(II)-tetraphenylporphyrin [15].
In the last decade, our team demonstrated expertise in optical [16], fluorescent [17,18] and electrochemical [19,20] detection of minute concentrations of hydrogen peroxide, in a range that is highly relevant for medical tests, using as sensitive materials Mn(III)- and Co(II)-metalloporphyrinates. Our next approach was to synthesize and test the sensitivity toward H2O2 of other metalloporphyrin structures, especially Pt-derivatives, for improving selectivity, sensitivity, and the detection concentration domain, preserving high accuracy.
The main purpose of this work was to synthesize a novel fluorescent Pt-metalloporphyrin with the capability of recognizing and monitoring ROS species, especially H2O2. We expected that an allyloxy substituted porphyrin would be more sensitive, due to both electron-withdrawing effect of allyloxy group and the expected electromeric effect caused during the interaction with an analyte. Besides, the flexible peripheral allyloxy groups might prevent fast aggregation and, in this case, the fast quenching of fluorescence.

2. Materials and Methods

2.1. Chemicals

The used solvents were hexane (C6H14), chlorobenzene (C6H5Cl), tetrahydrofuran (THF), chloroform (CHCl3), dichloromethane (CH2Cl2), benzonitrile (C6H5CN), N,N-dimethylformamide (DMF), and dimethylsulfoxide (DMSO), purchased from Merck (Darmstadt, Germany), Sigma-Aldrich (St. Louis, MO, USA) and all were used as received. Double distilled water was used in all experiments. All chemicals used in synthesis of free 5,10,15,20-tetra-(4-allyloxy-phenyl)-porphyrin were p.a. grade and were purchased from Merck (Darmstadt, Germany) and used as received, except for pyrrole that was distilled prior to use. The platinum water soluble complex PtCl2(PhCN)2 was provided by Alfa (Haverhill, MA, USA).

2.2. Apparatus

UV-visible spectra were performed using 1 cm wide quartz cuvettes, on a JASCO UV-visible spectrometer, V-650 model (Pfungstadt, Germany). The emission spectra were recorded in DMSO-water system, on a Perkin Elmer LS55 luminescence spectrometer (Perkin Elmer, Inc./UK Model/LS 55, Waltham, MA, USA). Fluorescence spectra were recorded at ambient temperature (22–24 °C), using 1 cm path length cells, without using cut-off filters, at a rate of 100 nm/min, with constant slit widths, for excitation (10 nm) and for emission (6 nm), exciting at λ = 365 nm. The fluorescence quantum yield (ΦF) of Pt-porphyrin was calculated by using the steady-state comparative method formula: Φsample = ΦTPP (Fsample/FTPP)(ATPP/Asample)(nsample2/nTPP2), where Φ is the relative fluorescence quantum yield, F, A, and n are the measured fluorescence area, the absorbance, and the refractive index of the solvent, respectively [21]. The method is based on comparing the Pt-porphyrin emission spectrum area with that of a fluorescence standard, meso-tetraphenylporphyrin (TPP). The emission spectra were performed in THF by exciting at λex = 330 nm. A value of Φf = 0.10 for TPP in THF, previously calculated [22], was used.
FT-IR spectra were carried out on a JASCO 430 FT-IR (Hachioji, Tokyo, Japan), from KBr pellets, in the range 4000–400 cm−1. 1H-NMR and 13C-NMR spectra were registered on 400 MHz and 100 MHz respectively on a Bruker Avance DRX spectrometer equipped with a 5 mm four nuclei (1H/13C/19F/29Si) direct detection probe (Rheinsteitten, Germany), in CDCl3. The chemical shifts are expressed in δ (ppm). Electrochemical investigations were performed with the help of Autolab 302N EcoChemie (Eco Chemie, The Netherlands, 2007).

2.3. Synthesis of 5,10,15,20-tetra-(4-allyloxy-phenyl)-porphyrin (TAPP)

Synthesis of 5,10,15,20-tetra-(4-allyloxy-phenyl)-porphyrin (TAPP) was done by functionalization of tetra-(4-hydroxy-phenyl) porphyrin derivative with bromopropylene [23] or by Lindsey method [24,25] from 4-allyloxybenzaldehyde and pyrrole. The complete physical characterization of the porphyrin base is in full agreement with the structure and was previously published [26].

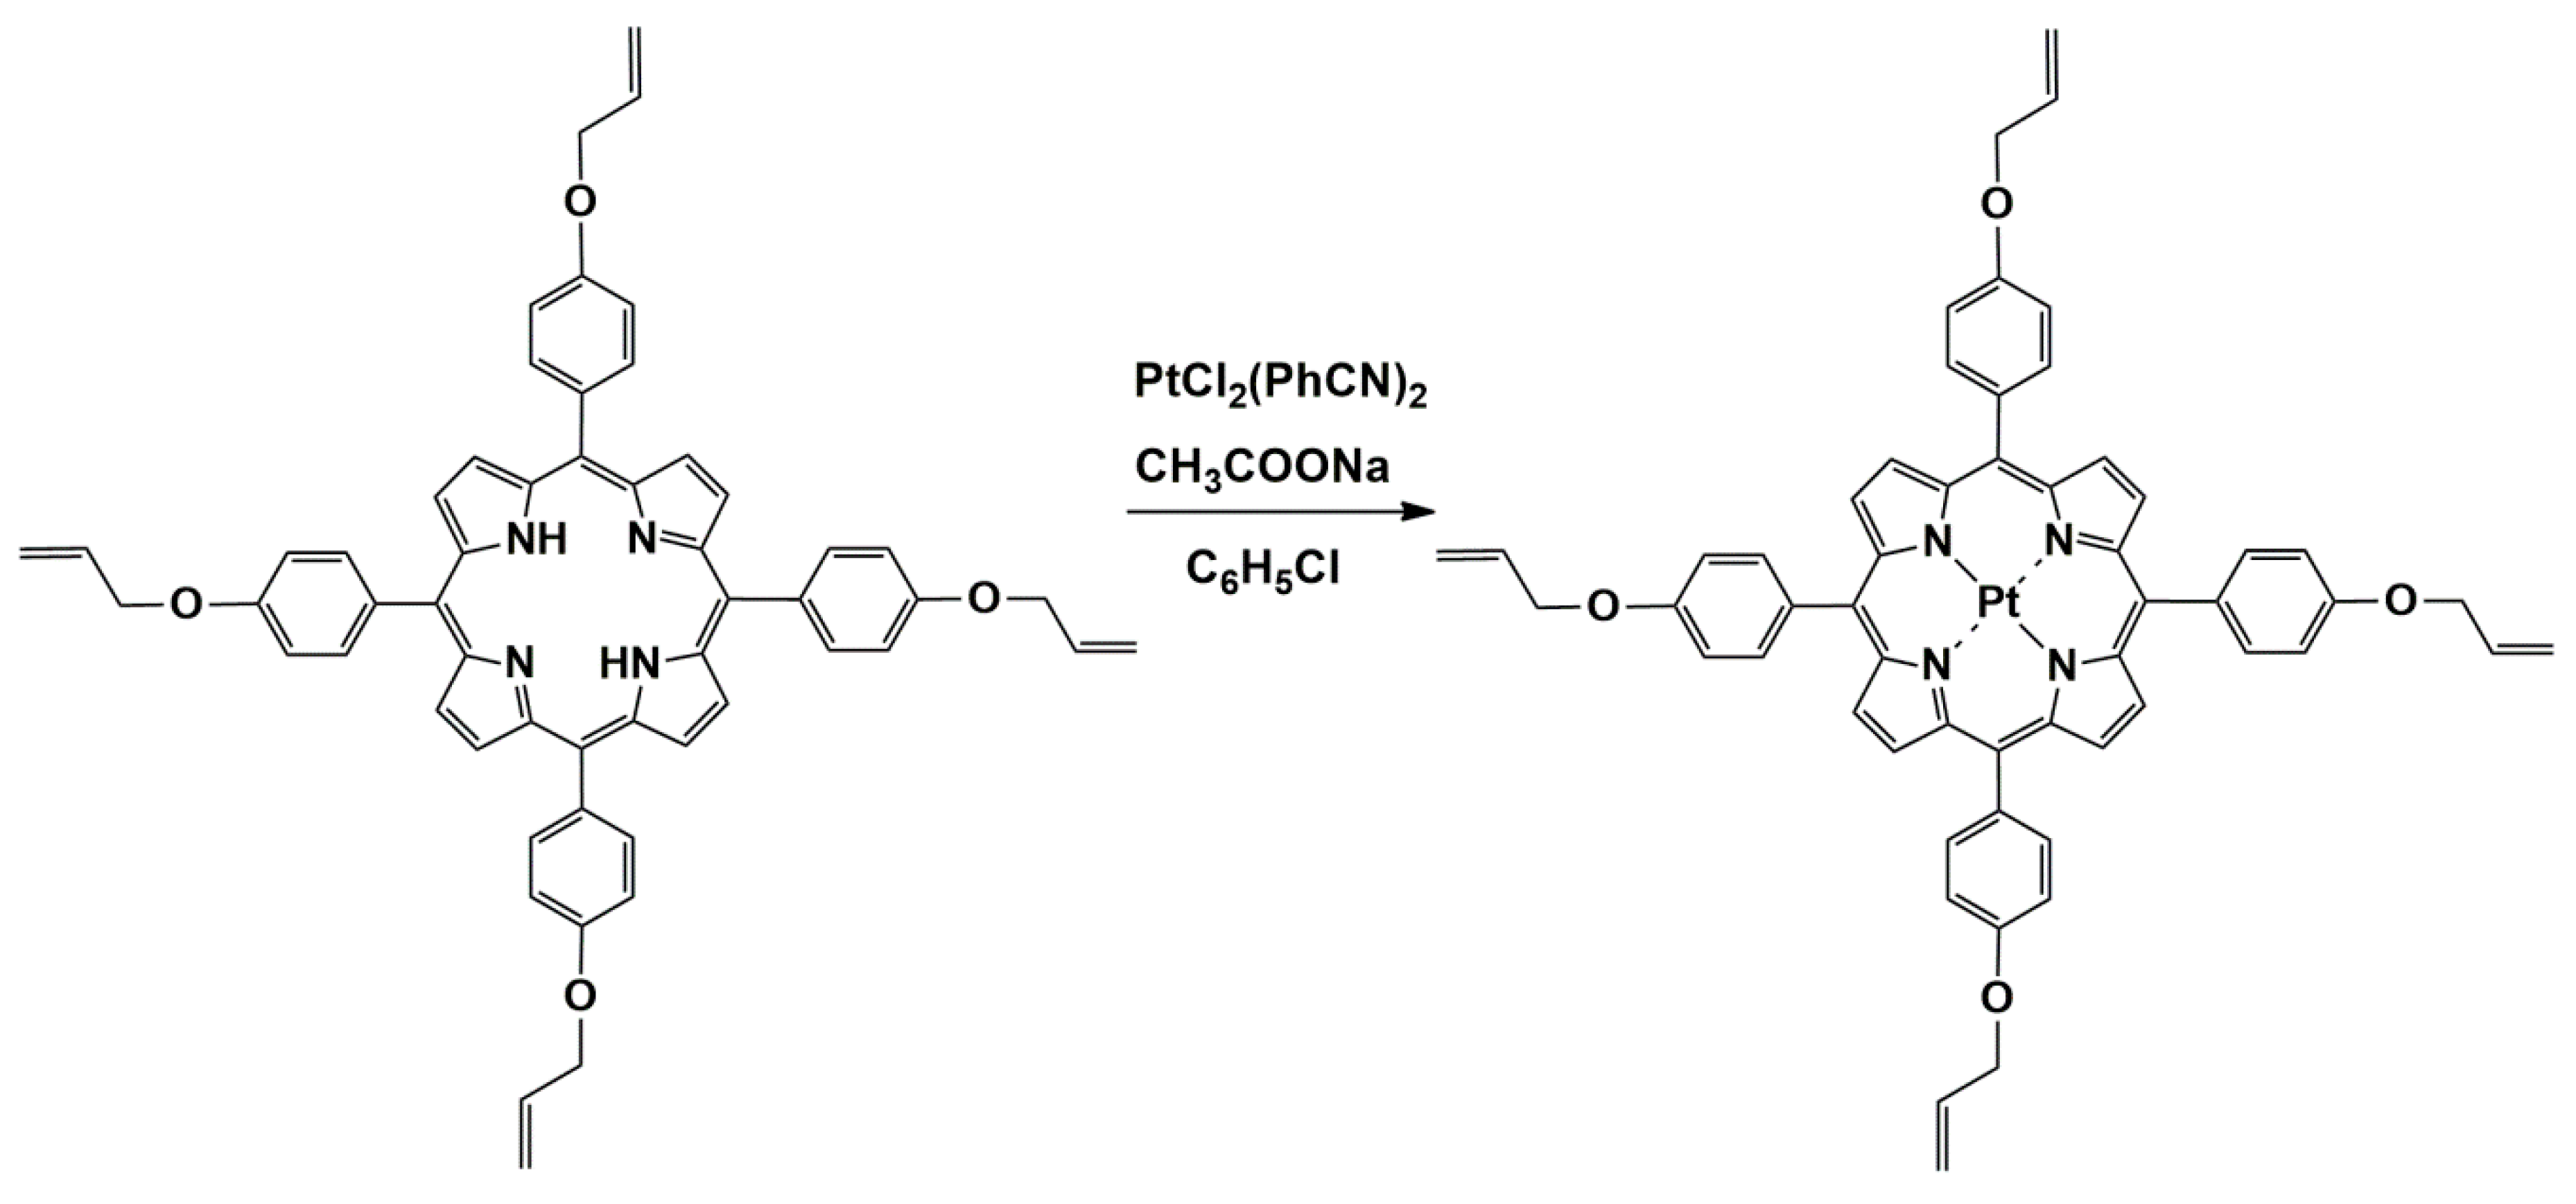
2.4. Synthesis of Pt(II)-5,10,15,20-tetra-(4-allyloxy-phenyl)-porphyrin (Pt(II)-TAPP)

The synthesis of Pt(II)-5,10,15,20-tetra-(4-allyloxy-phenyl)-porphyrin, shown in Figure 1, was performed by adapting the method of Yamashita [27], optimized according to [28], as follows: 0.105 g (12.5 mmole) 5,10,15,20-tetra-(4-allyloxy-phenyl)porphyrin dissolved in 35 mL chlorobenzene were vigorously stirred together with a mixture containing 0.0933 g (19.7 mmole) PtCl2(PhCN)2 and 0.072 g (52.9 mmole) NaAc × 3H2O dissolved in 24 mL chlorobenzene. The molar ratio between the reactants was TAPP:PtCl2(PhCN)2:CH3COONa × 3H2O = 1:1.5:4 chosen in order to favor the generation of the Pt-complex and to prevent the HCl generation. Then, the reaction mixture was refluxed for 2 h and the reaction progress was monitored by UV-vis spectroscopy, as can be seen in Figure 2.
The completion of the reaction was evidenced in the UV-vis spectra by both the hypsochromic shift of the Soret band and the reducing of the Q bands number to only two, as shown in Figure 2. The reaction mixture was then cooled to room temperature, filtered, and repeatedly washed with warm water (4 × 60 mL). The filtrate was several times washed with 100 mL water in a separatory funnel. The organic extract was dried over Na2SO4 and the chlorobenzene was removed by vacuum distillation. The resulting orange-reddish solid was recrystallized from dichloromethane. The pure crystalline powder was finally kept for 10 h at 90 °C in vacuum.
The main characteristics of Pt(II)-5,10,15,20-tetra-(4-allyloxy-phenyl)porphyrin are: brownish-orange crystals; yield 86%; mp over 320 °C; 1H-NMR (CDCl3, 400 MHz), δ, ppm: 8.70 (s, 8H, β-pyrrole), 7.94-7.96 (d, J = 8.4 Hz, 8H, H-2,6 phenyl), 7.18–7.20 (d, J = 8.4 Hz, 8H, H-3,5 phenyl), 6.13–6.22 (m, 4H, O-CH2-CH=CH2), 5.51–5.55 (d, J = 17.4 Hz, 4H, O-CH2-CH=HCH), 5.34–5.36 (d, J = 10.6 Hz, 4H, O-CH2-CH=HCH), 4.73–4.75 (d, J = 5.2 Hz, 8H, O-CH2-CH=HCH); the ratio between the peak areas of these proton categories is around: 1:1:1:0.5:0.5:0.5:1. 13C-NMR (CDCl3, 100 MHz), δ, ppm: 158.49 (Cph1’); 155.43 (C=N); 135.03 (Cph3’), 134.88 (=CH); 133.39 (=CH); 130.62 (=CH); 117.99 (=CH2); 113.78 (=CH); 113.07 (Cph2’); 69.16 (-OCH2). FT-IR(KBr), cm−1: 3426 (H-bonding), 1640 and 1501 (νC=CPh), 1452 (νC=N), 1357 (νC-N), 1231 (νC-O-Cas), 1168 (δC-HPh), 1006 (νC-O-C), 791 (γC-Hpyrrol), 670 (δC-Hpyrrol); UV-vis, DMSO (λmax (logε)): 408.6 (5.28); 512.5 (4.31); 596.5 (3.44); Φf = 0.038 ± 0.009.

2.5. Electrochemical Measurements

Before each electrochemical determination, the working electrode (WE) was cleaned with fine sandpaper (0.3 μm), washed with water, electrochemically cleaned (10 cycles in 0.5 M sulfuric acid in the range −1 to 1.2 V), and exposed to ultrasound bath for 3 minutes in water, acetone, and ethanol.
The porphyrin films were deposited on clean GCE surfaces by drop-casting from a 5.84 mM Pt(II)-TAPP solution in CH2Cl2, by successively depositing 3 × 1 drops. The films were left to dry, then the surfaces were washed with CH2Cl2 and water and then dried and stored in the dark. The modified electrode thus prepared was marked as Pt-Porf-GCE. All electrochemical measurements were performed at room temperature in a conventional one-compartment three-electrode cell. The electrochemical cell contains the platinum wire as auxiliary electrode, the Ag/AgCl as reference electrode and the working electrode: glassy carbon (GCE 0.0314 cm2) unmodified and modified with metal porphyrin film (Pt-Porf-GCE).
The electrocatalytic effect of the Pt-metalloporphyrin on hydrogen peroxide transformation was carried out in morpholine-ethane-sulfonic acid (MES) buffer solution, pH 5.6, at a scan rate of 50 mV/s, in open atmosphere, without removing oxygen (this did not have a significant effect on the oxidation process) [20].

3. Results and Discussion

3.1. UV-vis Monitoring of the Metalation Reaction

As represented in Figure 2, the UV-vis spectrum of the (TAPP) porphyrin-base is etio type shape with the Soret band generated by the transition from a1u (π) - eg* (π) and the four Q-bands in the visible region, corresponding to a2u (π) - eg* (π) transitions.
Monitoring the metalation reaction by UV-vis, as represented in Figure 2, shows that after a short period of time the Soret band of TAPP is splitting into two bands of equal intensity, revealing the equilibrium between porphyrin base (λ = 425 nm) and the generation of Pt(II)-TAPP. The forming of Pt-TAPP is shown by the significant hypsochromic shift of the Soret band with 15 nm, to 410 nm. After 100 min of reflux, the QI and the QIII bands disappeared and the intensity of the Soret band located at 410 nm is continuously increasing, proving that the equilibrium of the reaction is moved to the formation of the Pt-complex.
The reaction was completed after approximately two hours, when all the porphyrin was transformed into its Pt-complex. As a consequence, UV-vis spectrum presents solely a narrow Soret band located at 410 nm and only two Q bands, the first located at 513 nm, blue shifted in comparison with the porphyrin base and representing the Q(0-1) vibration and the second one at 596 nm respectively, representing Q(0-0) electronic transition. The intensity of the remaining Q(0-0) band is increased as compared to the original QI(0-0) band of the porphyrin base. According to this behavior [29] the novel obtained Pt-porphyrin is belonging to the second group of metalloporphyrins.

3.2. Physicochemical Characterization of Pt(II)-5,10,15,20-tetra-(4-allyloxy-phenyl)-porphyrin

3.2.1. FT-IR Characterization

A comparison of the FT-IR spectra of the porphyrin base TAPP with the corresponding Pt(II)-TAPP, as presented in Figure 3, shows that the Pt-complex gave a simplified spectrum, due to the higher symmetry of the novel compound, which increases from D2h to D4h.
The peak located at 3318 cm−1 and attributed to internal N-H bond is no more present in the Pt(II)-TAPP spectrum, proving the complete metalation. Due to the increased symmetry, the band corresponding to C-H stretching and bending vibrations, located at 1289 cm−1 in the spectrum of the porphyrin base is missing in the case of Pt-porphyrin. The large band of OH group caused by intramolecular H-bonding and located at 3426 cm−1 covers the C-H stretching vibrations of phenyl ring from 3033 cm−1 [30]. The C=N bonding vibration has a lower frequency (1452 cm−1) in Pt(II)-TAPP than in the porphyrin base (1472 cm-1) due to the influence of the platinum atom [31,32]. Another significant band is the vibration of the C-O-C bond, located at 1006 cm−1 in the Pt-porphyrin [33].

3.2.2. NMR Analysis

The investigation of the 1H-NMR spectrum, represented in Figure 4A, reveals the absence of the signal of the two internal protons, proving the bonding of the platinum in the inner core of the porphyrin. All the signals for the distinctive protons that prove the proposed structure of the compound are identifiable. Thus, the β-pyrrolic protons present a singlet at 8.70 ppm; the eight ortho phenyl protons gave signal in the 7.94–7.96 ppm interval and the eight meta phenyl protons as doublet at 7.18–7.20 ppm, respectively. The four protons from O-CH2-CH=CH2 are identified as multiplet at 6.13–6.22 ppm, the other eight belonging to =CH2 are resonating as two doublets from 5.51 to 5.55 ppm and from 5.34 to 5.36 ppm; the protons in the vicinity of oxygen O-CH2- gave a doublet at 4.73–4.74 ppm.
The chemical shifts (δ) of 13C-NMR are attributed in Figure 4B, taking into consideration the distinct aspect and zone for the assignment of each carbon. The 3-line triplet signal around 77 is due to CDCl3 in which the sample was diluted.

3.3. Detection of H2O2

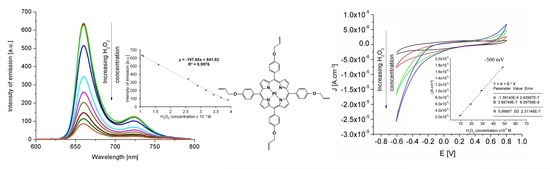
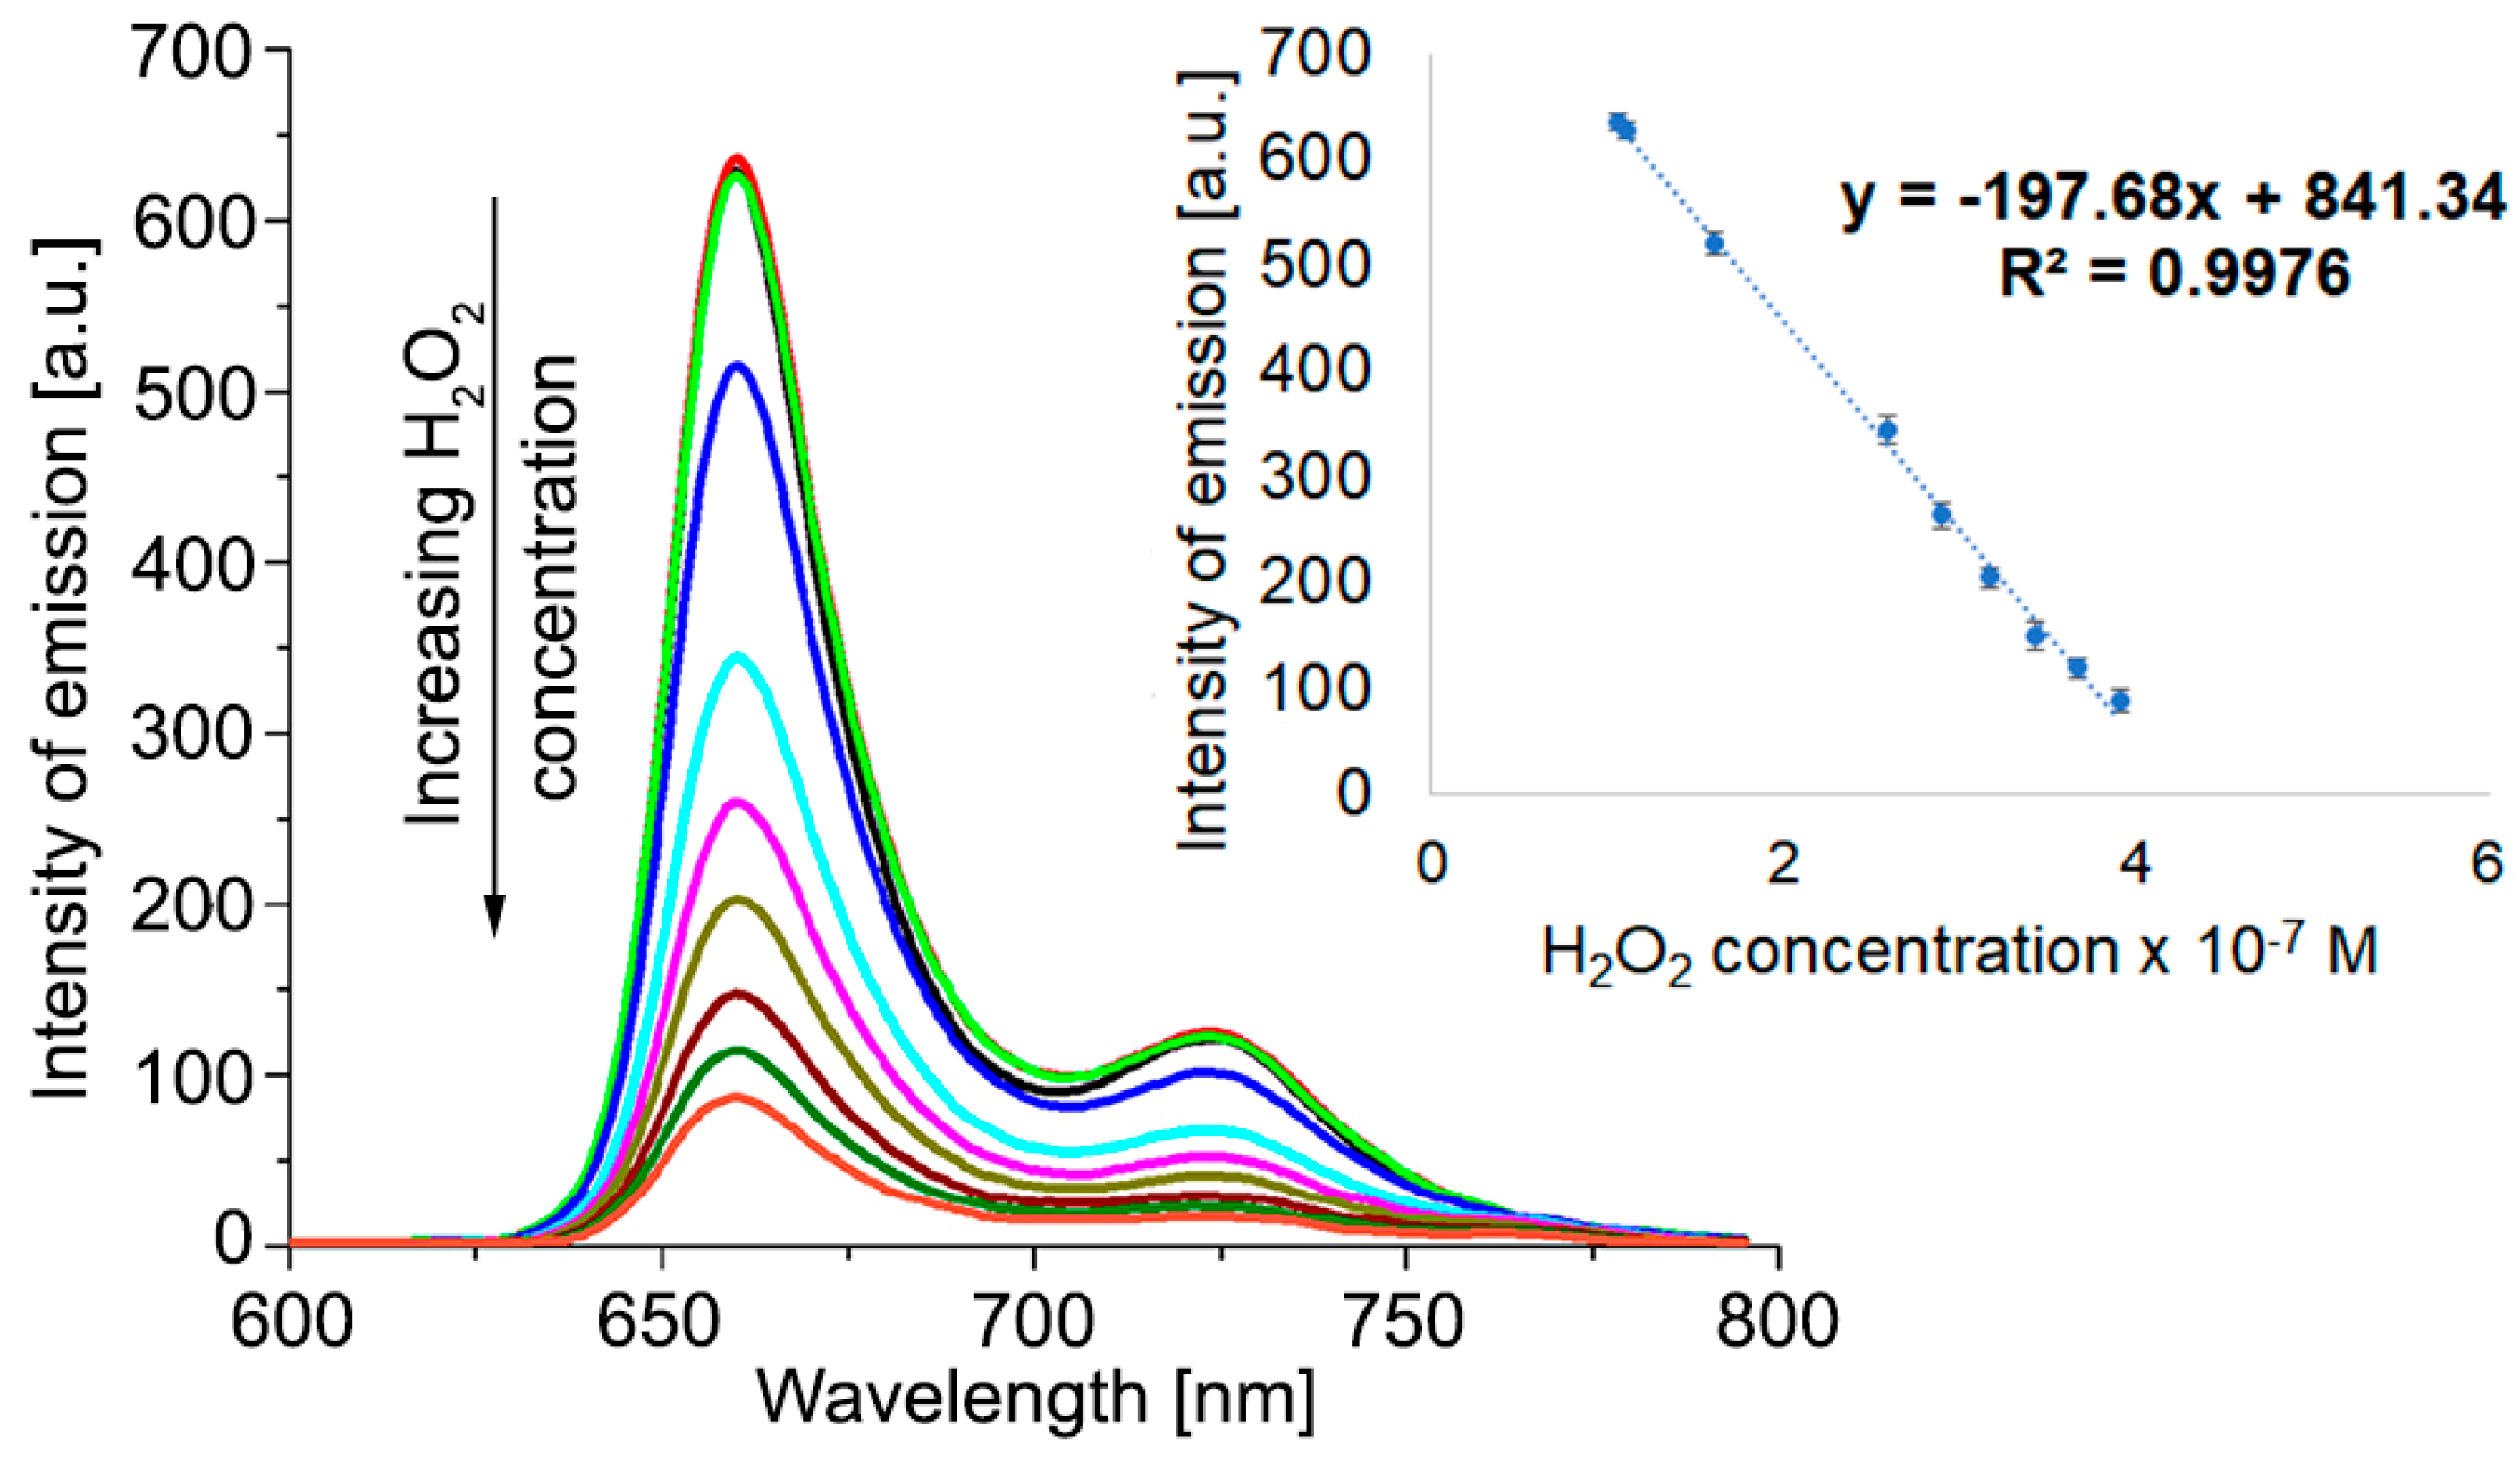
3.3.1. Fluorimetric Detection of H2O2

The method for testing the capacity of Pt(II)-TAPP to act as a sensitive material for the fluorimetric detection of hydrogen peroxide was performed by adding 0.6 mL H2O2 solution with different concentrations to each sample containing 5.4 mL solution of 9.93 × 10⁻⁶ M Pt(II)-TAPP in DMSO. The concentrations of the added H2O2 solution were: 1.05 × 10⁻⁶ M; 1.1 × 10⁻⁶ M; 1.6 × 10⁻⁶ M; 2.59 × 10⁻⁶ M; 2.9 × 10⁻⁶ M; 3.17 × 10⁻⁶ M; 3.43 × 10⁻⁶ M; 3.67 × 10⁻⁶ M; 3.9 × 10⁻⁶ M. Each sample was stirred, and the emission spectra were recorded, as shown in Figure 5.
It can be observed that the quenching of fluorescence is taking place when adding hydrogen peroxide to the Pt(II)-TAPP solution in DMSO, as represented in Figure 5. The intensity of emission decreases after a linear equation, characterized by an excellent confidence coefficient of 99.76%, in 1.05–3.9 × 10⁻⁷ M H2O2 concentration range.

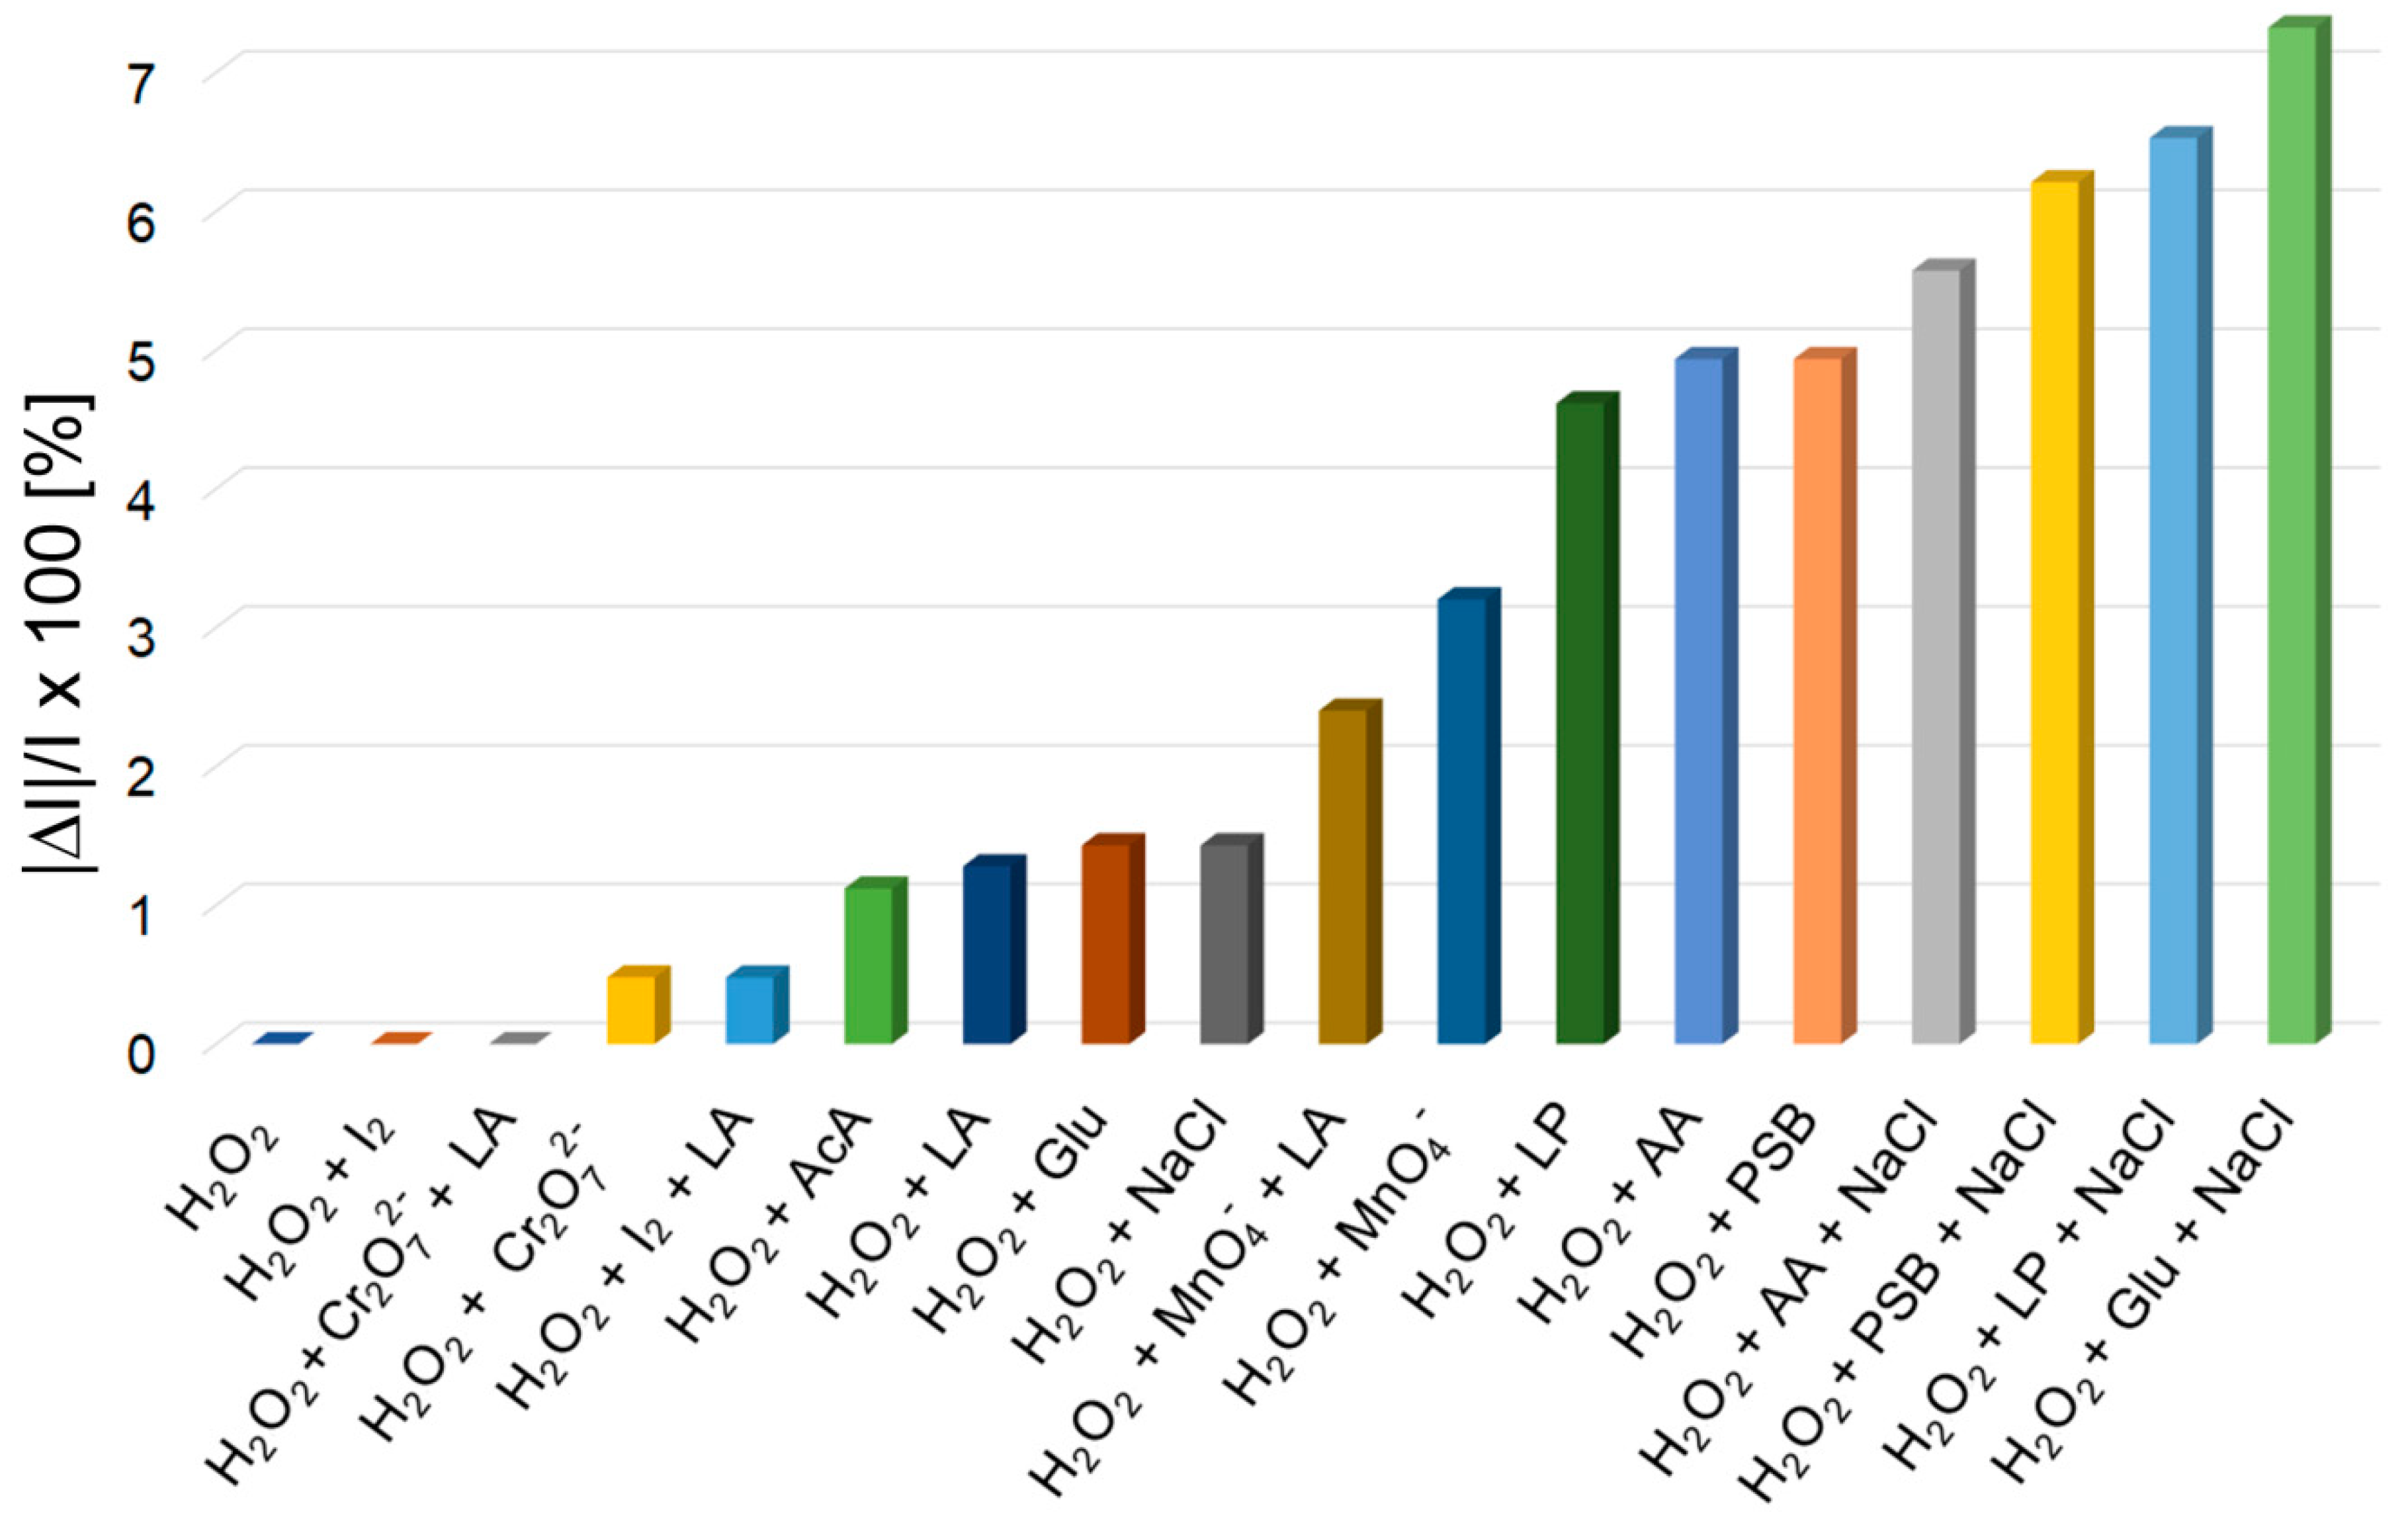
Study of Interfering Analytes

The selectivity of the fluorimetric sensor toward the H2O2 detection is a very important aspect. Taking into consideration that this fluorimetric sensor is destined for medical tests, the interference study, shown in Figure 6, was focused on those anions, cations or compounds that are frequently present in the targeted environments (human serum and urine), such as: glucose (Glu); NaCl; ascorbic acid (AA); phosphate buffer (PSB), AA + NaCl, PSB + NaCl, Glu + NaCl, lactic acid (LA), I2 + LA, potassium dichromate (Cr2O72−), Cr2O72− + LA, acetic acid (AcA), potassium permanganate (MnO4 ), MnO4 + LA, dilauryl phosphite (LP), LP + NaCl [28,34,35,36]. The concentration of each potential interfering analyte was 2 × 10⁻⁴ M, 100-fold higher in the mixed solution than that of H2O2 (c = 2 × 10⁻⁶ M).
The method used for investigation of interfering analytes is described as follows: to each 10 mL of 9.93 × 10⁻⁶ M Pt(II)-TAPP solution in DMSO, 1 mL solution containing the mentioned above interfering analytes was added. Each sample was vigorously stirred for 1 minute in the ultrasonic bath and the fluorescence spectra were recorded. Each measurement was performed three times.
The average percentage errors for H2O2 fluorescence detection are calculated as |ΔI|/I × 100 (where I represents the emission intensity of the sample containing H2O2 and |ΔI|, the difference in module between I and the emission intensity of each studied interference analyte or mixtures of analytes), as displayed in Figure 7.
As can be seen from Figure 7, glucose, lactic acid, dichromate anion, iodine, acetic acid, NaCl and permanganate anion, solely or in combined mixtures, have no significant influence toward H2O2 detection, although their concentration was 100-times higher than the concentration of detected H2O2.
Other interferences, such as: ascorbic acid, dilauryl phosphite and phosphate buffer introduced significant average percentage errors, below 5%. Instead, by performing the measurements in samples comprising at least three different interference analytes, each of them containing NaCl, the measurements are lacking in precision (errors between 5.5% and 7.3%), probably because of the induced higher ionic strength.

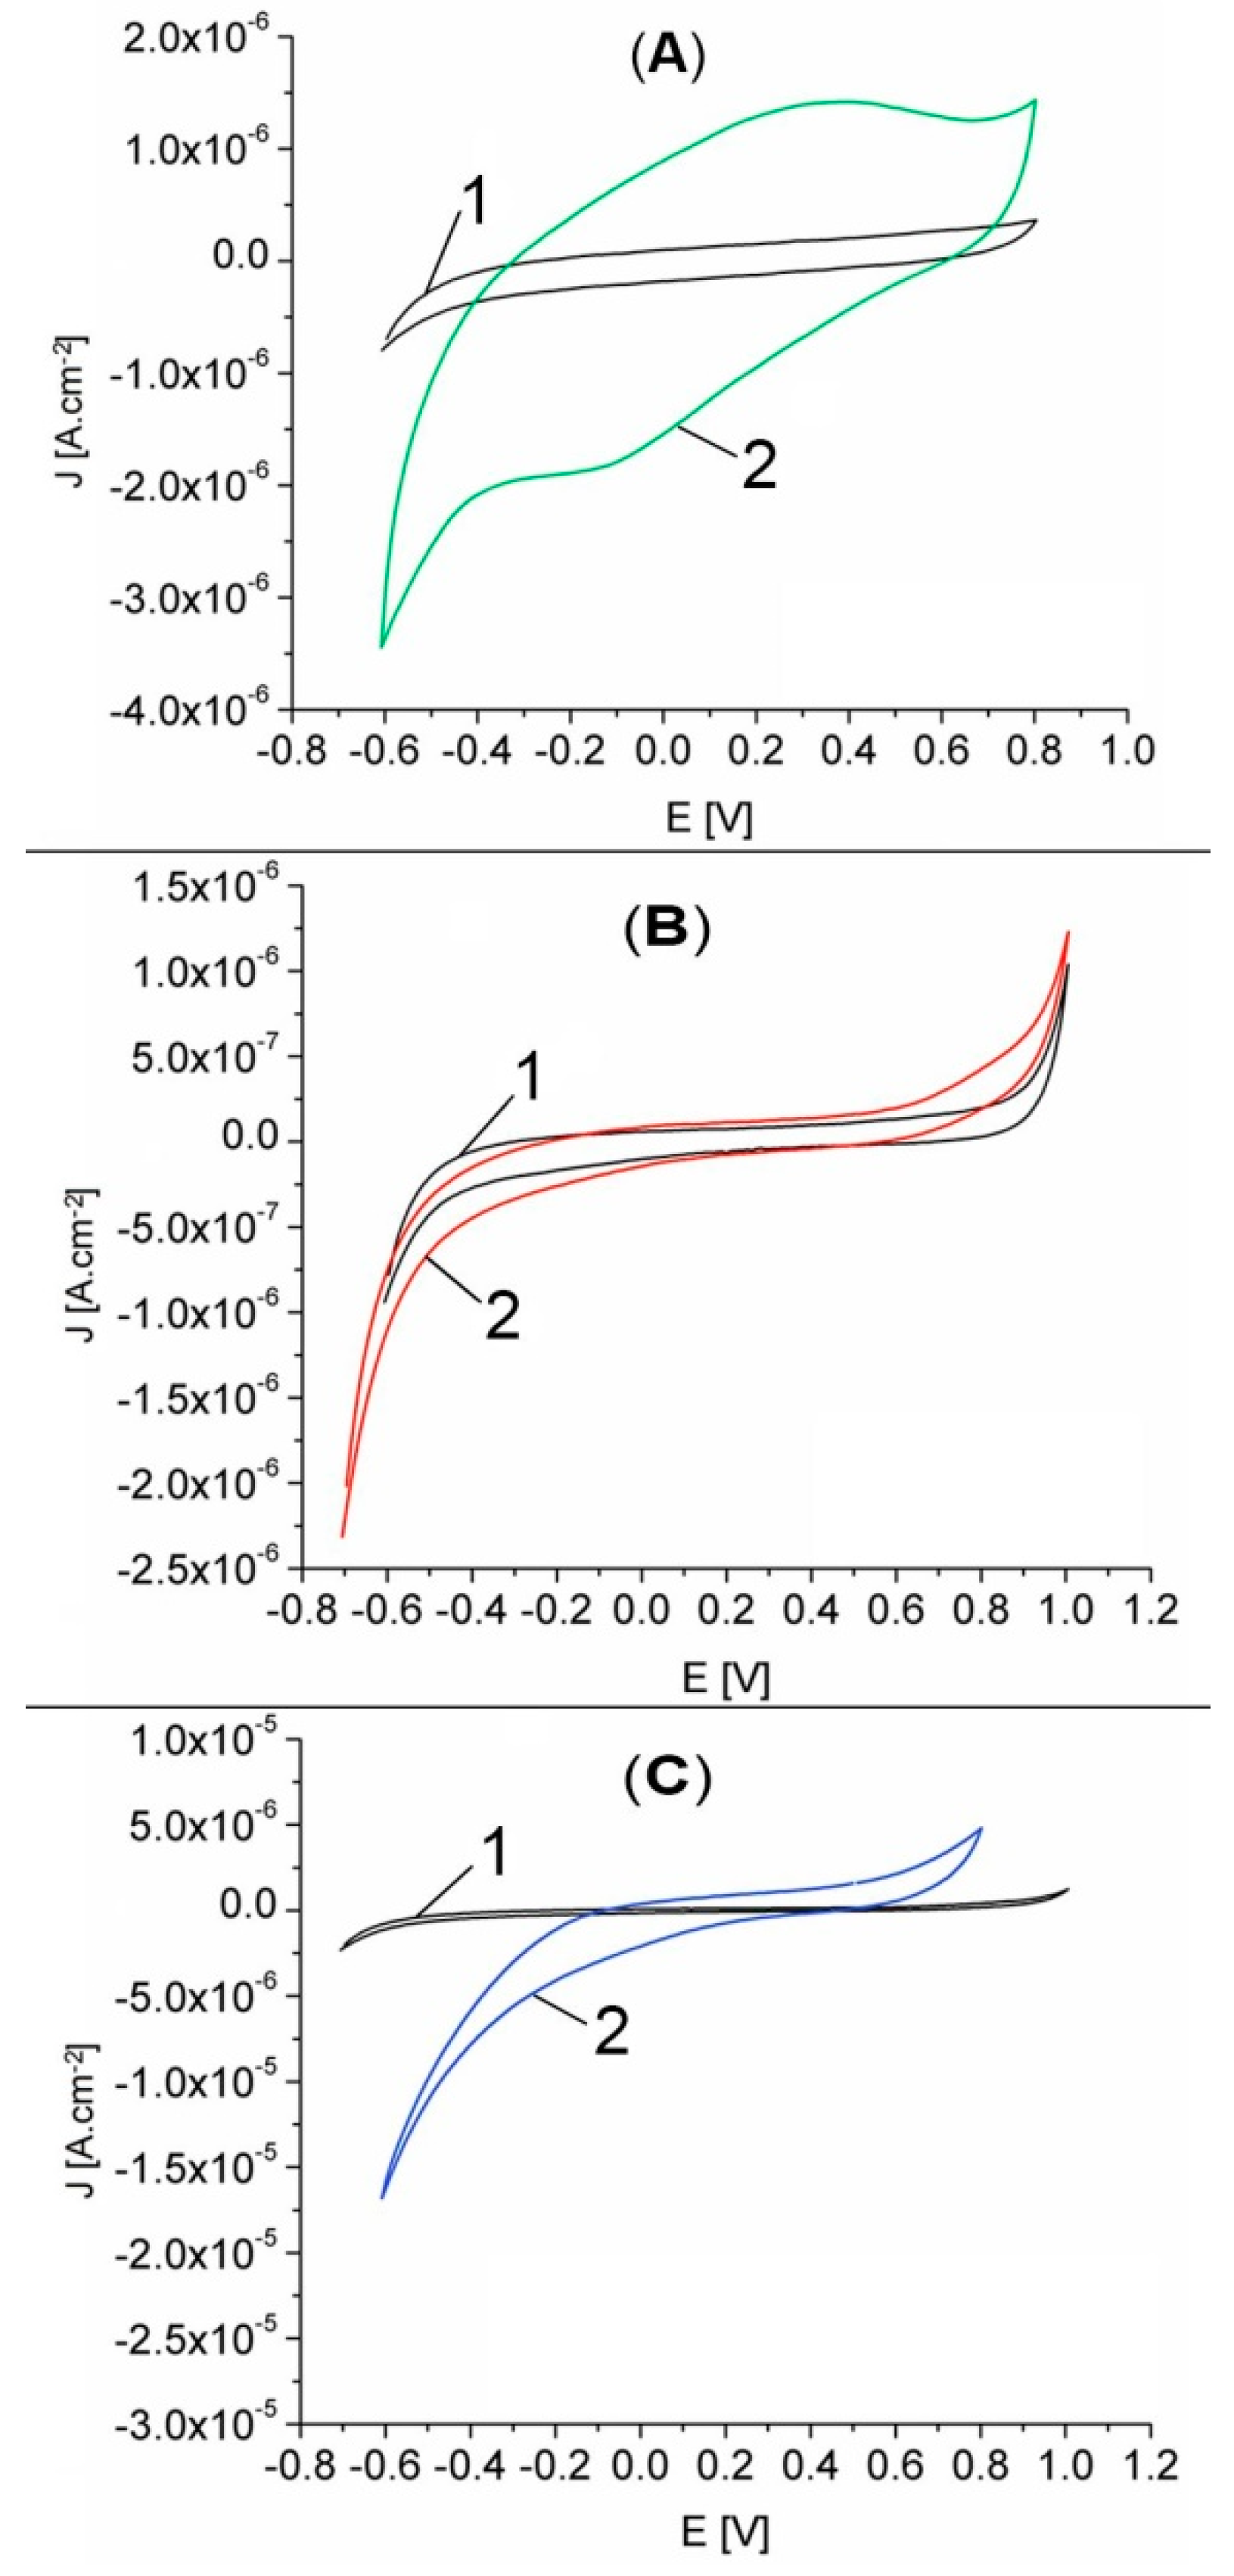
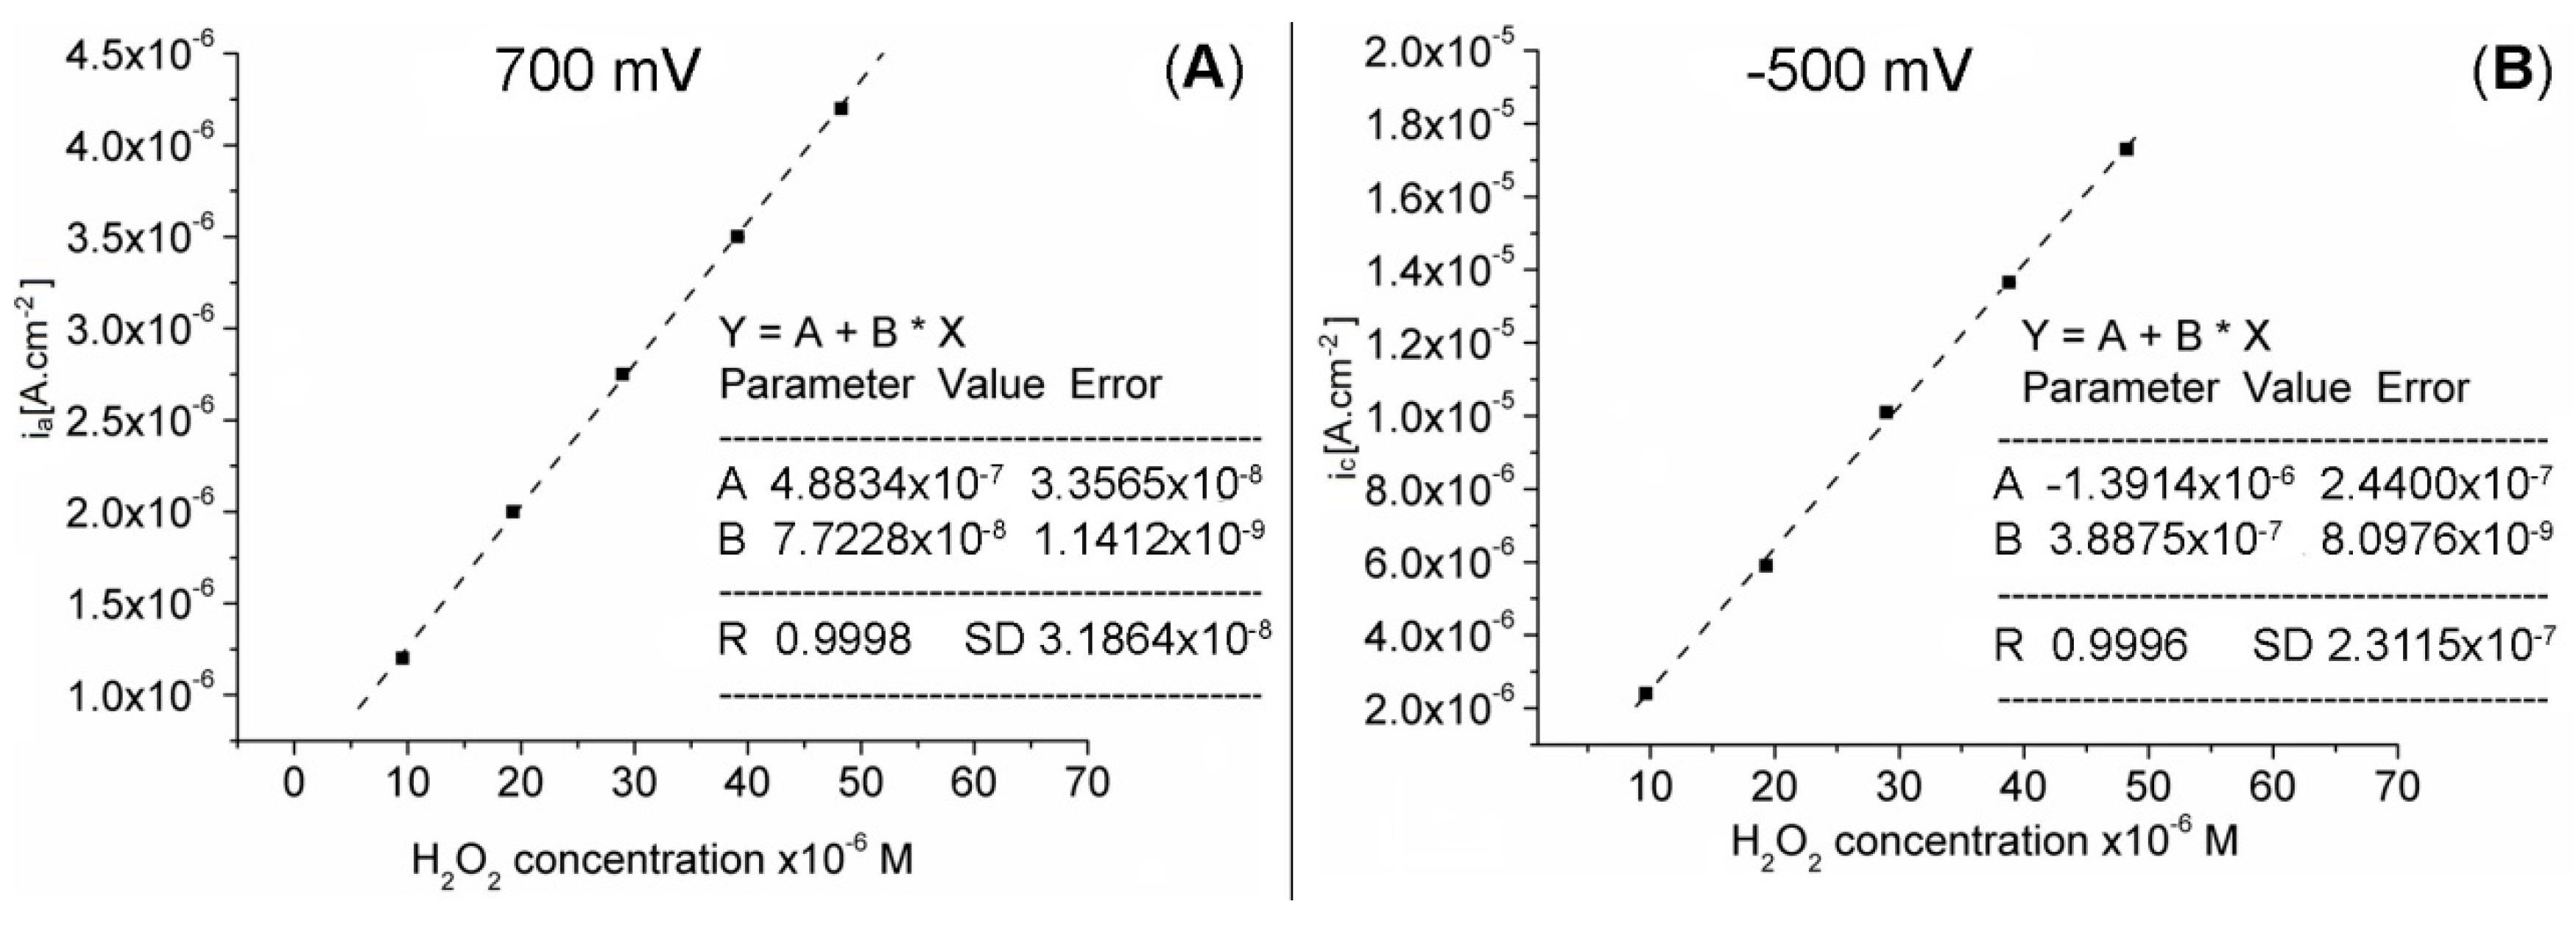
3.3.2. Electrochemical Detection of H2O2

The response of GCE and GCE electrodes modified with Pt-porphyrin film (Pt-Porf-GCE) in MES buffer solution at pH = 5.6 was studied comparatively. The cyclic voltammograms are shown in Figure 8A. Different cyclic voltammograms were obtained on modified GCE electrode. The modified electrode has oxidation peaks at the potentials of 0.35 V and 0.8 V and reduction peaks at −0.125 V and −0.6 V, corresponding to the Pt-porphyrin film and thus confirming its presence on the electrode surface.
Cyclic voltammograms for GCE in MES buffer solution at pH = 5.6 in the absence and in the presence of H2O2, are presented in Figure 8B. The GCE presents a light response in the presence of H2O2. The comparison of the cyclic voltammograms shown in Figure 8C for GCE (curve 1) and for modified Pt-Porf-GCE (curve 2) in the presence of the same concentration of H2O2 (28.95 mM), reveals that the GCE has no significant response but the modified Pt-Porf-GCE strongly changed both its anodic and cathodic responses. On modified Pt-Porf-GCE the oxidation process takes place at a lower potential and the reduction process at a higher potential than in the case of GCE.
The oxidation current of H2O2 on the modified Pt-Porf-GCE, represented in Figure 9, increased due to electrocatalytic oxidation (~0.7 V), as well as that of reduction (−0.5 V).
The significant increase of the reduction current in the presence of H2O2 is due to the electro- catalytic effect of the Pt-metalloporphyrin (Pt-Porf) on the H2O2 reduction, illustrated by Equations (1) and (2). The reduced form of Pt-metalloporphyrin (Pt-Porf) can reduce the H2O2 and transforms into the initial form (Pt-Porf) on the electrode surface (Equation (2)).
Pt-Porf + e ⟶ Pt-Porf
2Pt-Porf + H2O2+ 2H+ ⟶ 2Pt-Porf + 2H2O
The oxidation current is due to the electrochemical oxidation of water and hydrogen peroxide. The hydrogen peroxide oxidation is mediated by the Pt-metalloporphyrin immobilized on the GCE, as can be seen in the following simplified mechanism, presented in Equations (3) and (4):
Pt-Porf ⟶ Pt-Porf + + e
2Pt-Porf + + H2O2 ⟶ 2Pt-Porf + O2 + 2H+
Similar observations were reported by other authors [4,37].
In the studied concentration range, the anodic and cathodic response currents of the Pt-Porf-GCE are directly proportional to the H2O2 concentration, as illustrated in Figure 10A,B).
The results indicate that the detection of hydrogen peroxide by using the modified Pt-Porf-GCE is accurate. The oxidation and reduction currents were found to increase linearly with increasing H2O2 concentration. The calibration graphs from Figure 10A, B, plotted between the catalytic current and H2O2 concentration on the Pt-Porf-GCE give a linear dependence in the concentration range from 1 × 10⁻⁶ M to 5 × 10⁻⁵ M, R2 = 0.999, for both diagrams.
This is a range of concentration larger than that obtained in the case of fluorimetric detection and is appropriate for measurements in technical gold cyanidation [38] cosmetics [39] and agriculture [10].

4. Conclusions

Metalloporphyrins(II) are highly recognized for their capacity to act as sensitive substances used in formulation of optical, fluorescent, and electrochemical sensors. In this respect, a novel Pt-porphyrin structure, namely: Pt(II)-5,10,15,20-tetra-(4-allyloxy-phenyl) porphyrin, was successfully synthesized and was fully characterized by UV-vis and fluorimetry (Supplementary Materials), FT-IR, 1H-NMR and 13C-NMR methods.
The fluorescence response of this Pt-porphyrin in the presence of different concentrations of hydrogen peroxide was investigated. It was proved that in the detection domain 1.05–3.9 × 10⁻⁷ M H2O2 (that is highly relevant for biological testing) the investigated porphyrin can act as fluorescent sensitive substance, with a high confidence coefficient of 99.7%. In comparison with other previous strategies [8,16,17], this fluorescent approach gave a 40 times lower detection limit of 0.3 × 10⁻⁷ M, and the procedure is simpler, less expensive and less time consuming. The fluorimetric response is accurate and stable in the presence of several interfering mixtures of anions, cations and strongly oxidizing species frequently present in the targeted environments. Glucose, lactic acid, dichromate anion, iodine, acetic acid, NaCl, and permanganate anion, solely or in combined mixtures, have no significant influence on H2O2 detection, although their concentration was 100-times higher than that of detected H2O2.
On the other hand, Pt-Porf-GCE was realized and several electrochemical characterizations were comparatively performed with the bare GCE, in the absence or presence of hydrogen peroxide. The oxidation and reduction currents were found to increase linearly with increasing H2O2 concentration on modified Pt-Porf-GCE. The calibration graphs plotted between the catalytic current (both anodic and cathodic currents) and H2O2 concentration on the Pt-Porf-GCE gave a linear response in the concentration range from 1×10⁻⁶ M to 5×10⁻⁵ M with exceptional confidence coefficient of 99.9%.
Different methods for the determination of hydrogen peroxide, based on several sensitive materials were accomplished in order to improve the linear concentration range and the limit of detection and are summarized in Table 1.
Based on two different fluorimetric and electrochemical methods, this Pt-porphyrin has the potential to cover detection of hydrogen peroxide in diverse fields, from medical tests to technical, cosmetics, food, and agriculture monitoring, with high accuracy. The future implications will be focused on obtaining of the Pt-porphyrin from recovered platinum from spent automotive catalysts producing added value from this recovery and decreasing costs.

Supplementary Materials

The following are available online at https://www.mdpi.com/2227-9040/8/2/29/s1, Figure S1: UV-vis spectra of Pt(II)-TAPP (the same concentration 3 × 10⁻⁵ M) in different solvents: hexane (1); chlorobenzene (2); tetrahydrofuran (3); chloroform (4); dichloromethane (5); benzonitrile (6); dimethylformamide (7); dimethylsulfoxide (8). Effect of the solvent polarity on the intensity and position of the bands, Figure S2: Effect of the solvent polarity on the position and intensity of the bands in fluorescence spectra of Pt(II)-TAPP (the same concentration 3 × 10⁻⁵ M), in: hexane (1); chlorobenzene (2); tetrahydrofuran (3); chloroform (4); dichloromethane (5); benzonitrile (6); dimethylformamide (7); dimethylsulfoxide (8).

Author Contributions

E.F.-C. contributed with conception and design of the study; E.F.-C., N.P. and G.F.-C. established the specific methodology; I.F., D.A. and C.E. organized the database; A.L., M.C., D.A., C.E., I.F. and C.I. performed the synthesis, analyses and investigations; N.P. and G.F.-C. performed and validated the electrochemical experiments; E.F.-C. and M.C. provided resources; E.F.-C., N.P., A.L. and G.F.-C. wrote the first draft of the manuscript; E.F.-C. supervised final editing and managed project. All authors have read and agreed to the published version of the manuscript.

Funding

This research was funded by UEFISCDI, grant number 76 PCCDI/2018 Project belonging to PNIII-Future and Emerging Technologies and partially by Romanian Academy through Programme 3/2020 from “Coriolan Dragulescu” Institute of Chemistry.

Conflicts of Interest

The authors declare that the research was conducted in the absence of any commercial or financial relationships that could be construed as a potential conflict of interest.

References

  1. Sangeetha, N.S.; Narayanan, S.S. Amperometric H2O2 sensor based on gold nanoparticles/poly (celestine blue) nanohybrid film. SN Appl. Sci. 2019, 1, 732. [Google Scholar] [CrossRef] [Green Version]
  2. Forman, H.J.; Bernardo, A.; Davies, K.J.A. What is the concentration of hydrogen peroxide in blood and plasma? Arch. Biochem. Biophys. 2016, 603, 48–53. [Google Scholar] [CrossRef] [PubMed]
  3. Yuen, J.W.M.; Benzie, I.F.F. Hydrogen peroxide in urine as a potential biomarker of whole body oxidative stress. Free Radic. Res. 2003, 37, 1209–1213. [Google Scholar] [CrossRef] [PubMed]
  4. Mirabello, V.; Cortezon-Tamarit, F.; Pascu, S.I. Oxygen Sensing, Hypoxia Tracing and in Vivo Imaging with Functional Metalloprobes for the Early Detection of Non-communicable Diseases. Front. Chem. 2018, 6, 27. [Google Scholar] [CrossRef] [PubMed] [Green Version]
  5. Nwose, E.U.; Bwititi, P.T.; Chalada, M.J. Influence of Anticoagulants on Determination of H2O2 Levels in Blood: Comparison of Citrate and EDTA. Int. J. Pathol. Clin. Res. 2018, 4, 083. [Google Scholar] [CrossRef] [Green Version]
  6. Mao, Y.; Zhao, Q.; Pan, T.; Shi, J.; Jiang, S.; Chen, M.; Zhou, B.; Tian, Y. Platinum porphyrin/3-(trimethoxysily)propylmethacrylate functionalized flexible PDMS micropillar arrays as optical oxygen sensors. New J. Chem. 2017, 41, 5429–5435. [Google Scholar] [CrossRef]
  7. Kimura, T.; Watanabe, S.; Sawada, S.-I.; Shibasaki, Y.; Oishi, Y. Preparation and optical properties of polyimide films linked with porphyrinato Pd(II) and Pt(II) complexes through a triazine ring and application toward oxygen sensors. J. Polym. Sci. Part A Polym. Chem. 2017, 55, 1086–1094. [Google Scholar] [CrossRef]
  8. Önal, E.; Ay, Z.; Yel, Z.; Ertekin, K.; Gurek, A.G.; Topal, S.Z.; Hirel, C. Design of oxygen sensing nanomaterial: synthesis, encapsulation of phenylacetylide substituted Pd(II) and Pt(II) meso-tetraphenylporphyrins into poly(1-trimethylsilyl-1-propyne) nanofibers and influence of silver nanoparticles. RSC Adv. 2016, 6, 9967–9977. [Google Scholar] [CrossRef]
  9. Önal, E.; Saß, S.; Hurpin, J.; Ertekin, K.; Topal, S.Z.; Kume, M.U.; Hirel, C. Lifetime-based oxygen sensing properties of palladium(II) and platinum(II) meso-tetrakis(4-phenylethynyl)phenylporphyrin. J. Fluoresc. 2017, 27, 861–868. [Google Scholar] [CrossRef]
  10. Borisov, S.M. Brief Overview of the Most Common Indicators, Chapter 1: Fundamentals of Quenched Phosphorescence O2 Sensing and Rational Design of Sensor Materials, Quenched-phosphorescence Detection of Molecular Oxygen. In Applications in Life Sciences; Papovsky, D.B., Dmitriev, R.I., Eds.; Royal Society of Chemistry: Croydon, UK, 2018; pp. 7–9. [Google Scholar]
  11. Buchler, J.W. The Porphyrins; Dolphin, D., Ed.; Elsevier: Amsterdam, The Netherlands, 1978; Volume 1, p. 389. [Google Scholar]
  12. Mink, L.M.; Neitzel, M.L.; Bellomy, L.M.; Falvo, R.E.; Boggess, R.K.; Trainum, B.T.; Yeaman, P. Platinum(II) and platinum(IV) porphyrin complexes: synthesis, characterization, and electrochemistry. Polyhedron 1997, 16, 2809–2817. [Google Scholar] [CrossRef]
  13. Paolesse, R.; Nardis, S.; Monti, D.; Stefanelli, M.; DiNatale, C. Porphyrinoids for Chemical Sensor Applications. Chem. Rev. 2017, 117, 2517–2583. [Google Scholar] [CrossRef] [PubMed] [Green Version]
  14. Verrelli, G.; Lvova, L.; Paolesse, R.; Di Natale, C.; D’Amico, A. Metalloporphyrin-Based Electronic Tongue: an Application for the Analysis of Italian White Wines. Sensors 2007, 7, 2750–2762. [Google Scholar] [CrossRef] [PubMed] [Green Version]
  15. Lvova, L.; Verrelli, G.; Stefanelli, M.; Nardis, S.; Di Natale, C.; D’Amico, A.; Makarychev-Mikhailov, S.; Paolesse, R. Platinum porphyrins as ionophores in polymeric membrane electrodes. Analyst 2011, 136, 4966. [Google Scholar] [CrossRef] [PubMed]
  16. Creanga, I.; Palade, A.; Lascu, A.; Birdeanu, M.; Fagadar-Cosma, G.; Fagadar-Cosma, E. Manganese(III) porphyrin sensitive to H2O2 detection. Dig. J. Nanomater. Biostructures 2015, 1, 315–321. [Google Scholar]
  17. Lascu, A.; Palade, A.; Fagadar-Cosma, G.; Creanga, I.; Ianasi, C.; Serbachievici, I.; Birdeanu, M.; Fagadar-Cosma, E. Mesoporous manganese-porphyrin-silica hybrid nanomaterial sensitive to H2O2 fluorescent detection. Mater. Res. Bull. 2016, 74, 325–332. [Google Scholar] [CrossRef]
  18. Fagadar-Cosma, E.; Badea, V.; Fagadar-Cosma, G.; Palade, A.; Lascu, A.; Fringu, I. Trace Oxygen Sensitive Material Based on Two Porphyrin Derivatives in a Heterodimeric Complex. Molecules 2017, 22, 1787. [Google Scholar] [CrossRef] [Green Version]
  19. Sebarchievici, I.; Tăranu, B.O.; Birdeanu, M.; Rus, S.F.; Fagadar-Cosma, E. Electrocatalytic behavior and application of manganese porphyrin/gold nanoparticle- surface modified glassy carbon electrodes. Appl. Surf. Sci. 2016, 390, 131–140. [Google Scholar] [CrossRef]
  20. Fagadar-Cosma, E.; Sebarchievici, I.; Lascu, A.; Creanga, I.; Palade, A.; Birdeanu, M.; Taranu, B.; Fagadar-Cosma, G. Optical and electrochemical behavior of new nano-sized complexes based on gold-colloid and Co-porphyrin derivative in the presence of H2O2. J. Alloys Compd. 2016, 686, 896–904. [Google Scholar] [CrossRef]
  21. Fu, J.; Li, X.; Ng, D.K.P.; Wu, C. Encapsulation of phthalocyanines in biodegradable poly(sebacic anhydride) nanoparticles. Langmuir 2002, 18, 3843–3847. [Google Scholar] [CrossRef]
  22. Fagadar-Cosma, E.; Cseh, L.; Badea, V.; Fagadar-Cosma, G.; Vlascici, D. Combinatorial Synthesis and Characterization of New Asymmetric Porphyrins as Potential Photosensitizers in Photodynamic Therapy. Comb. Chem. High Throughput Screen. 2007, 10, 466–472. [Google Scholar] [CrossRef]
  23. Niu, C.-G.; Gui, X.-Q.; Zeng, G.-M.; Guan, A.-L.; Gao, P.-F.; Qin, P.-Z. Fluorescence ratiometric pH sensor prepared from covalently immobilized porphyrin and benzothioxanthene. Anal. Bioanal. Chem. 2005, 383, 349–357. [Google Scholar] [CrossRef] [PubMed]
  24. Lindsey, J.S.; Hsu, H.C.; Schreiman, I.C. Synthesis of tetraphenylporphyrins under very mild conditions. Tetrahedron Lett. 1986, 27, 4969–4970. [Google Scholar] [CrossRef]
  25. Sol, V.; Chaleix, V.; Granet, R.; Krausz, P. An efficient route to dimeric porphyrine RGD peptide conjugates via olefin metathesis. Tetrahedron 2008, 64, 364–371. [Google Scholar] [CrossRef]
  26. Dudas, Z.; Enache, C.; Fagadar-Cosma, G.; Armeanu, I.; Fagadar-Cosma, E. Hybrid silica-porphyrin materials with tailored pore sizes. Mater. Res Bull. 2010, 45, 1150–1156. [Google Scholar] [CrossRef]
  27. Yamashita, K.; Katsumata, N.; Tomita, S.; Fuwa, M.; Fujimaki, K.; Yoda, T.; Hirano, D.; Sugiura, K. Facile and practical synthesis of platinum(II) porphyrins under mild conditions. Chem. Lett. 2015, 44, 492–494. [Google Scholar] [CrossRef]
  28. Vlascici, D.; Fagadar-Cosma, G.; Plesu, N.; Lascu, A.; Petric, M.; Crisan, M.; Belean, A.; Fagadar-Cosma, E. Potentiometric sensors for iodide and bromide based on Pt(II)-porphyrin. Sensors 2018, 18, 2297. [Google Scholar] [CrossRef] [Green Version]
  29. Lomova, T.N.; Berezin, B.D. Porphyrin complexes with p, d and f metals in high oxidation states: structures, electronic absorption, and IR spectra. Russ. J. Coord. Chem. 2001, 27, 85–104. [Google Scholar] [CrossRef]
  30. Liu, X.-G.; Feng, Y.-Q.; Zhao, Y.; Chen, H.-L.; Li, X.-G. Synthesis, characterization and spectroscopic investigation of azo-porphyrins. Dyes Pigment. 2007, 75, 413–419. [Google Scholar] [CrossRef]
  31. Roy, D.R.; Shah, E.V.; Roy, S.M. Optical Activity of Co-Poprhyrin in the Light of IR and Raman Spectroscopy: A Critical DFT Investigation. Spectrochim. Acta Part A 2017, 190, 121–128. [Google Scholar] [CrossRef]
  32. Hellwig, P.; Melin, F. Infrared Absorbance Spectra of Porphyrins and Related Compounds, Chapter 36: Recent Applications of Infrared Spectroscopy and Microscopy in Chemistry, Biology and Medicine. In Handbook of Porphyrin Science with Applications to Chemistry, Physics, Materials Science, Engineering, Biology and Medicine; Kadish, K.M., Smith, K.M., Guilard, R., Eds.; World Scientific: Singapore, 2010; Volume 7, p. 443. [Google Scholar]
  33. Lian, W.; Sun, Y.; Wang, B.; Shan, N.; Shi, T. Synthesis and properties of 5,10,15,20-tetra[4-(3,5-dioctoxybenzamidephenyl] porphyrin and its metal complexes. J. Serb. Chem. Soc. 2012, 77, 335–348. [Google Scholar] [CrossRef]
  34. Gu, X.; Wang, H.; Schultz, Z.D.; Camden, J.P. Sensing Glucose in Urine and Serum and Hydrogen Peroxide in Living Cells by Use of a Novel Boronate Nanoprobe Based on Surface-Enhanced Raman Spectroscopy. Anal. Chem. 2016, 88, 7191–7197. [Google Scholar] [CrossRef] [PubMed] [Green Version]
  35. Fagadar-Cosma, E.; Lascu, A.; Shova, S.; Zaltariov, M.F.; Birdeanu, M.; Croitor, L.; Balan, A.; Anghel, D.; Stamatin, S. X-Ray structure elucidation of a Pt-metalloporphyrin and its application for obtaining sensitive AuNPs-plasmonic hybrids capable to detect triiodide anions. Int. J. Mol. Sci. 2019, 20, 710. [Google Scholar] [CrossRef] [PubMed] [Green Version]
  36. Lascu, A.; Plesu, N.; Anghel, D.; Birdeanu, M.; Vlascici, D.; Fagadar-Cosma, E. Optical detection of bromide ions using Pt(II)-5,10,15,20-tetra-(4-methoxy-phenyl)-porphyrin. Chemosensors 2019, 7, 21. [Google Scholar] [CrossRef] [Green Version]
  37. Barona-Castaño, J.C.; Carmona-Vargas, C.C.; Brocksom, T.J.; de Oliveira, K.T. Porphyrins as Catalysts in Scalable Organic Reactions. Molecules 2016, 21, 310. [Google Scholar] [CrossRef] [PubMed] [Green Version]
  38. Guzman, L.; Segarrab, M.; Chimenos, J.M.; Fernandez, M.A.; Espiell, F. Gold cyanidation using hydrogen peroxide. Hydrometallurgy 1999, 52, 21–35. [Google Scholar] [CrossRef]
  39. Mills, A.; Tommons, C.; Bailey, R.T.; Tedford, M.C.; Crilly, P.J. Reversible, fluorescence-based optical sensor for hydrogen peroxide. Analyst 2007, 132, 566–571. [Google Scholar] [CrossRef]
  40. Dhanjai; Sinha, A.; Lu, X.; Wu, L.; Tan, D.; Li, Y.; Chen, J.; Jain, R. Voltammetric sensing of biomolecules at carbon based electrode interfaces: A review. TrAC Trends Anal. Chem. 2018, 98, 174–189. [Google Scholar] [CrossRef]
  41. Yang, X.; Ouyang, Y.; Wu, F.; Hu, Y.; Ji, Y.; Wu, Z. Size controllable preparation of gold nanoparticles loading on graphene sheets-cerium oxide nanocomposites modified gold electrode for nonenzymatic hydrogen peroxide detection. Sens. Actuators B 2017, 238, 40–47. [Google Scholar] [CrossRef]
  42. Horozova, E.; Dodevska, T.; Dimcheva, N. Modified graphite electrodes as catalysts for electroreduction of hydrogen peroxide. Bulg. Chem. Commun. 2008, 40, 233–239. [Google Scholar]
  43. Li, Z.; Zheng, X.; Zheng, J. A non-enzymatic sensor based on Au@Ag nanoparticles with good stability for sensitive detection of H2O2. New J. Chem. 2016, 40, 2115–2120. [Google Scholar] [CrossRef]
  44. Janasek, D.; Vastarella, W.; Spohn, U.; Teuscher, N.; Heilmann, A. Ruthenium/rhodium modified gold electrodes for the amperometric detection of hydrogen peroxide at low potentials. Anal. Bioanal. Chem. 2002, 374, 1267–1273. [Google Scholar] [CrossRef] [PubMed]
  45. Mounesh; Reddy, K.R.V. Sensitive and reliable electrochemical detection of Nitrite and H2O2 Embellish-CoPc coupled with Appliance of composite MWCNTs. Anal. Chim. Acta 2020, 1108, 98–107. [Google Scholar] [CrossRef]
  46. Su, G.; Wei, Y.; Guo, M. Direct Colorimetric Detection of Hydrogen Peroxide Using 4-Nitrophenyl Boronic Acid or Its Pinacol Ester. Am. J. Anal. Chem. 2011, 2, 879–884. [Google Scholar] [CrossRef] [Green Version]
  47. Nikolaev, K.G.; Ermolenko, Y.E.; Offenhäusser, A.; Ermakov, S.S.; Mourzina, Y.G. Multisensor Systems by Electrochemical Nanowire Assembly for the Analysis of Aqueous Solutions. Front. Chem. 2018, 6, 256. [Google Scholar] [CrossRef] [PubMed] [Green Version]
  48. Wen, F.; Dong, Y.; Feng, L.; Wang, S.; Zhang, S.; Zhang, X. Horseradish Peroxidase Functionalized Fluorescent Gold Nanoclusters for Hydrogen Peroxide Sensing. Anal. Chem. 2011, 83, 1193–1196. [Google Scholar] [CrossRef]
  49. Zheng, H.; Su, R.; Gao, Z.; Qi, W.; Huang, R.; Wang, L.; Hea, Z. Magnetic–fluorescent nanocomposites as reusable fluorescence probes for sensitive detection of hydrogen peroxide and glucose. Anal. Methods 2014, 6, 6352–6357. [Google Scholar] [CrossRef]
  50. Burmistrova, N.A.; Kolontaeva, O.A.; Duerkop, A. New Nanomaterials and Luminescent Optical Sensors for Detection of Hydrogen Peroxide. Chemosensors 2015, 3, 253–273. [Google Scholar] [CrossRef] [Green Version]
  51. Wu, H.; Fan, S.; Jin, X.; Zhang, H.; Chen, H.; Dai, Z.; Zou, X. Construction of a Zinc Porphyrin-Fullerene-Derivative Based Nonenzymatic Electrochemical Sensor for Sensitive Sensing of Hydrogen Peroxide and Nitrite. Anal. Chem. 2014, 86, 6285–6290. [Google Scholar] [CrossRef]
Figure 1. Reaction scheme for obtaining Pt(II)-5,10,15,20-tetra-(4-allyloxy-phenyl)-porphyrin.
Chemosensors 08 00029 g001
Figure 2. Monitoring the reaction progress of forming Pt(II)-TAPP by increasing the absorption intensity at 410 nm and decreasing the intensity of the TAPP absorption bands at 425 nm. In detail the differences between the Q bands of TAPP, Pt(II)-TAPP and intermediate species.
Chemosensors 08 00029 g002
Figure 3. Overlapped FT-IR spectra for TAPP (full line) and Pt(II)-TAPP (dotted line).
Chemosensors 08 00029 g003
Figure 4. (A) 1H-NMR spectrum and (B) 13C-NMR spectrum of Pt(II)-TAPP in CDCl3.
Chemosensors 08 00029 g004
Figure 5. Effect of H2O2 on the fluorescence spectra of Pt(II)-TAPP, recorded in DMSO. Linear dependence between the intensity of emission of Pt(II)-TAPP, read at 660 nm, and the H2O2 concentration.
Chemosensors 08 00029 g005
Figure 6. Fluorescence spectra of Pt(II)-TAPP containing H2O2 (c = 2 × 10⁻⁶ M) in DMSO and in the presence of different interference analytes: LA; I2 + LA; Cr2O72− + LA; I2; Cr2O72−; Glu; NaCl; AcA; MnO4 + LA; MnO4; LP; AA; PSB; AA + NaCl; PSB + NaCl; LP + NaCl; Glu + NaCl. The concentration of each potential interfering analyte was 2 × 10⁻⁴ M.
Chemosensors 08 00029 g006
Figure 7. Average percentage errors for H2O2 fluorescence detection, introduced by different interferences, after three determinations.
Chemosensors 08 00029 g007
Figure 8. Cyclic voltammograms recorded in MES phosphate buffer solution, pH = 5.6, 50 mV/s, 25 °C, for: (A) GCE (curve 1) and Pt-Porf-GCE (curve 2), cycle 3; (B) GCE in the absence (curve 1) and in the presence of 28.95 mM H2O2 (curve 2); (C) GCE (curve 1) and Pt-Porf-GCE (curve 2) in the presence of 28.95 mM H2O2.
Chemosensors 08 00029 g008
Figure 9. Cyclic voltammograms obtained in MES buffer solution, pH = 5.6 for the Pt-Porf-GCE using different concentrations of H2O2 [mM]: 9.65 (1); 19.3 (2); 28.95 (3); 48.25 (4). 50 mV/s, 25 °C.
Chemosensors 08 00029 g009
Figure 10. Linear dependence between (A) anodic current at 700 mV (R: 0.9998, SD: 3.1864 × 10⁻⁸) and (B) cathodic current at −500 mV (R: 0.9996, SD: 2.3115 × 10⁻⁷) on the Pt-Porf-GCE and the concentration of hydrogen peroxide, in MES buffer solution, at 50 mV/s, 25 °C.
Chemosensors 08 00029 g010
Table 1. Linear concentration ranges and detection limits of recently developed electrochemical and optical sensors for the determination of hydrogen peroxide, using different sensitive materials.
Sensitive MaterialDetection MethodLinear Concentration
range (µM)
Detection Limit (µM)Reference
Graphene Sheets-CeO2/AuVoltammetric
sensing
1–100.26[40,41]
Pd and Au nanoparticles
(ratio 70:30%)/GCE
Electroreduction of hydrogen peroxide10–12707.06[42]
Au and Ag nanoparticles/GCEElectroreduction of hydrogen peroxide5–101.3[43]
Thin layers of ruthenium/rhodium/ Au foilsAmperometric detection-anodic oxidation1–500-[44]
L-Methionine cobalt (II) phthalocyanine
functionalized MWCNTs/ GCE
Amperometric detection0.1–0.80.05[45]
4-Nitrophenyl boronic acid or its pinacol esterDirect colorimetric detection5–501[46]
Pd-Au nanowire sensorsNon-enzymatic hydrogen peroxide reduction1–10000.3[47]
Bioconjugates of Au nanoclusters with Horseradish peroxidaseLuminescence quenching of Au0.1–100 0.03[48]
Fe3O4 and CdTe core-shell nanocompositesQuenching of luminescence of quantum dots 100–100035[49]
Eu3+-tetracycline -polyacrylonitrile-
polyacrylamide hybrid
Increasing of luminescence 0.45–100.45[50]
Zinc porphyrin−fullerene-derivativeNonenzymatic electrochemical sensor35–34001.44[51]
Platinum-porphyrin/GCEQuencing of
fluorescence
0.1–0.390.03This work
Nonenzymatic electrochemical sensor1–500.3

