1. Introduction
Bacterial viruses (bacteriophages or phages) are naturally occurring parasites that have an antibiotic effect, i.e., they selectively infect only bacteria. This action is particularly detrimental in those processes where bacteria are used to produce fermented foods, e.g., cheese, which is based on the controlled fermentation of milk by selected bacterial cultures, mostly composed of
Lactococcus species. Therefore, the presence of phages in the production plants could result in premature bacterial death and cause unsuccessful cheese production, with concomitant economical and time losses [
1]. Since the amount of milk used in the plants is in the order of tons, the losses could be massive; additionally, the strategies to control phages in dairy facilities (such as factory/equipment design, sanitation, and culture rotations), are expensive and time consuming [
1].
The detection of dairy phages is typically performed by standard microbiological methods, such as plaque assays, spot tests, and turbidity tests [
2]. Plaque assays involve the growth of a susceptible host culture, the exposition of the culture to the phage-containing solution, and the observation of the lytic plaques, i.e., zones of clearing in the confluent lawn of host bacteria due to the infection of a bacterial cell by a single lytic virus [
3]. The main problem of these assays is that they require time, an equipped microbiology laboratory, and trained personnel. Therefore, many producers prefer to avoid controls for phage presence in the dairy environment, and preventively perform sanitation protocols as often as possible. However, for industrial purposes, detection of phages by rapid, reliable, and user-friendly methods, such as biosensors, is highly advisable, so a timely intervention can be introduced to prevent fermentation failure.
Inkjet printing technology is one of the most outstanding biosensor fabrication techniques, since it uses an old-fashioned printing method combined with innovative nanoparticle-based inks to give relevant characteristics to the printed device, e.g., conductivity, insulating properties, hydrophobicity/hydrophilicity [
4,
5]. The method was even used to functionalize the printed devices with DNA-, enzyme-, and antibody-based inks. This method has been studied for the last ten years in the biosensor field, leading to a huge number of publications, and interesting possibilities and applications [
6,
7,
8]. However, few or no companies have started producing inkjet-printed devices for electrochemical and optical biosensing yet.
Some of the main advantages of inkjet printing with respect to other printing techniques is that it can be used both on solid and flexible substrates [
9], it requires no additional components other than the inks, and it can shorten to a few minutes the time from idea to prototype [
10]. Many substrates have been proposed and tested in the literature to be used with this technique for biosensing applications. Among them there are sustainable materials like paper, with tunable and peculiar microfluidic characteristics [
11,
12,
13,
14,
15], and polyethylene terephthalate (PET), which is flexible, light, and transparent [
16,
17,
18,
19,
20,
21].
In this research, we propose a preliminary study on a novel system to detect bacteriophage contaminations by low-cost inkjet-printed biosensors made by an interdigitated electrodes array (IDEA system). The system involves bacterial culturing on the electrodes in small wells, and rapidly detects the phage infection after the sample inoculation. The detection is based on electrochemical impedance spectroscopy (EIS) measurements, performed in real-time during the entire procedure. The required instruments can be easily miniaturized, and the data analysis can be automatically implemented to make the entire system affordable and to avoid the need for trained personnel.
The biosensors are produced by inkjet printing with conductive inks based on silver nanoparticles (AgNPs) and transparent and flexible PET sheets. We used consumer low-cost printers to fabricate the devices. In a previous work, we studied and characterized the resistivity, resolution, and morphology of these devices [
21]. In this research we focused on the electrical equivalent modeling of the impedance response of the printed devices, optimizing their geometrical parameters, and defining their stability for long-term measurements.
Finally, we applied the IDEA system for the detection of a phage affecting a strain of Lactococcus lactis, comparing the obtained results with two standard microbiological techniques, i.e., plaque assay and turbidity, and with the EIS response of a standard multielectrode array (MEA).
2. Materials and Methods
The inkjet-printed sensors were produced using an Epson ET-2550 EcoTank® printer and Mitsubishi Paper Mills Ltd. (Tokyo, Japan) Nanoink™ AgNPs based ink. The AgNP ink was loaded in the yellow color channel of the printer, and all the other channel were loaded with normal colored inks. Only black and AgNP inks were used for the sensor fabrication. Transparent PET by Mitsubishi Paper Mills Ltd. was used as printing substrate. This substrate has an absorbent coating allowing the chemical sintering of the nanoparticles, improving the printed lines’ conductivity. The printed lines and devices were designed and printed with Autodesk™ (San Rafael, CA, USA) AutoCAD® 2016.
To define the electrical and morphological properties of the AgNP printed lines, they were characterized by optical microscopy, profilometry, conductive atomic force microscopy (CAFM), and scanning electron microscopy (SEM). For the optical microscopy studies we used a Leica Microsystems GmbH (Wetzlar, Germany) DM-LB2 microscope in reflection mode connected by C-mount to a Nikon Coolpix 4500 camera (Tokyo, Japan). A custom MatLab (by Mathworks, Natick, MA, USA, R2015b version) function was defined to measure the real width of printed lines. The profile of 100 µm wide printed lines was measured by a KLA Tencor P-16+ Surface Profiler, while the CAFM was performed by a Park XE Bio Microscope on the same lines.
We assessed both the conductivity and the ratio between the real and nominal printed lines in previous research [
21] that was focused on the fabrication of interdigitated electrodes (IDE) for antibiotic detection. Here, we also studied the lines’ real width as a function of the line angle, since the sensor layout was more complicated and heterogeneous.
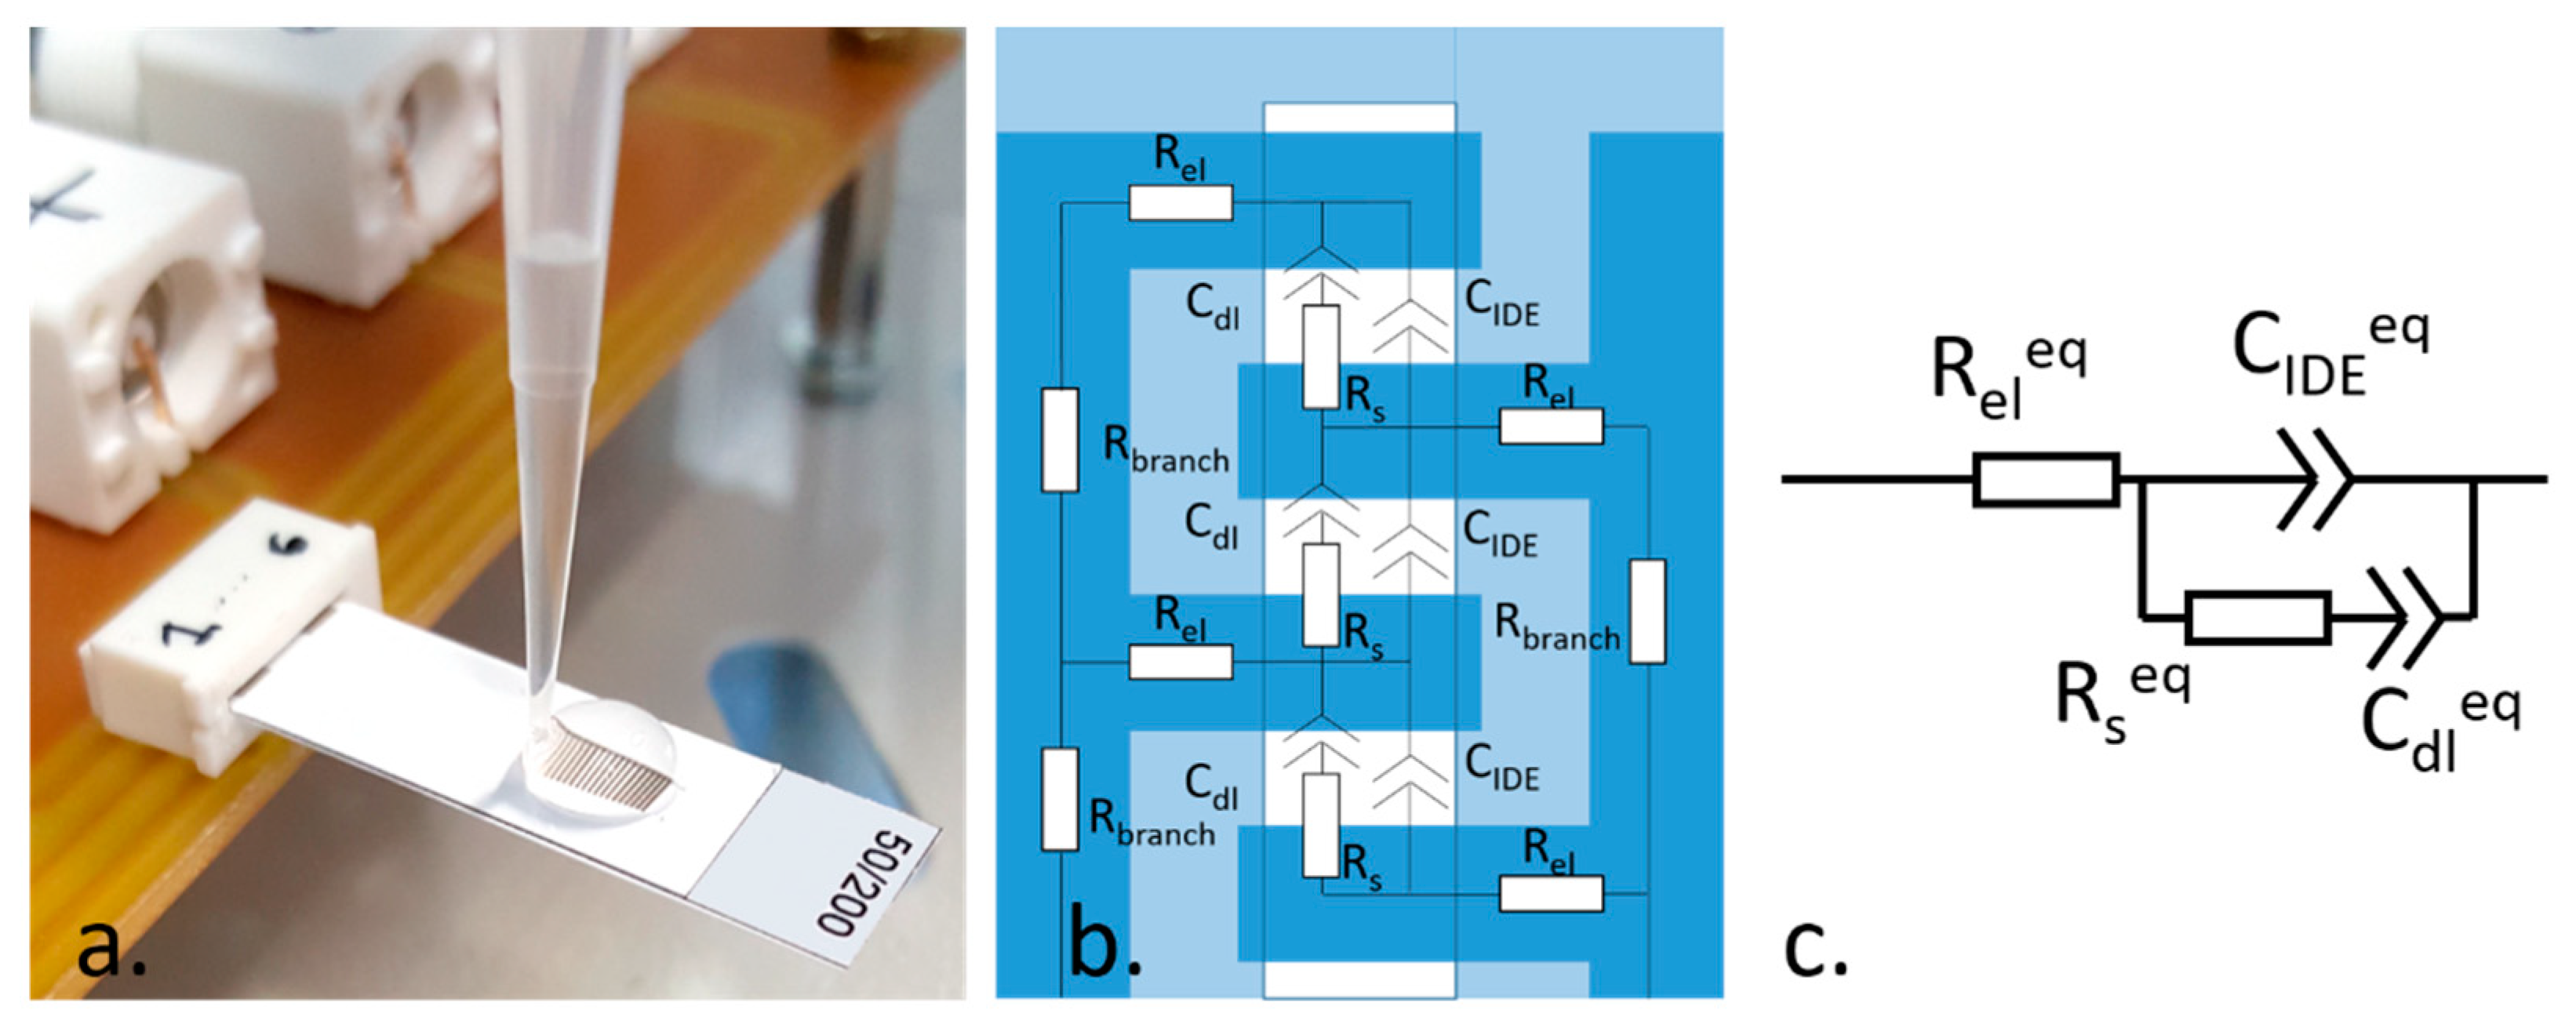
To define the IDE geometrical parameters, we adopted an experimental approach. We designed IDE with different electrodes width, i.e., 50, 100, 150 µm, and with different width of the passivation window, i.e., 1, 2, 3 mm. The passivation was made by patterning vinyl adhesive patches with a RoboMaster CraftRobo CC330. The selected values were the closest to the printing and patterning resolution, respectively. We then tested the designed IDE in 10 mM Phosphate Buffered Saline (PBS) (
Figure 1a) by EIS measurements with 0 V DC bias, 5 mV AC, in the 100 mHz–1 MHz frequency range. We defined an equivalent electrical model (
Figure 1b,c), taking into consideration the conduction contribution of the absorbing coating of the substrate (
CIDE).
Figure 1b depicts the distribution of the elements composing the electrical model, while
Figure 1c shows the resulting equivalent circuit.
The impact of both electrodes and passivation window widths on the electrochemical response of the sensor was assessed through fit of EIS data with the model in
Figure 1c using Zview 2 software (Scribner and Associates). Once the IDE geometrical characteristics were defined, we tested the EIS response of the devices in the PBS over time and fitted the measurements with the equivalent electrical model. This study was aimed to assess the time required by the devices for the stabilization of their EIS response.
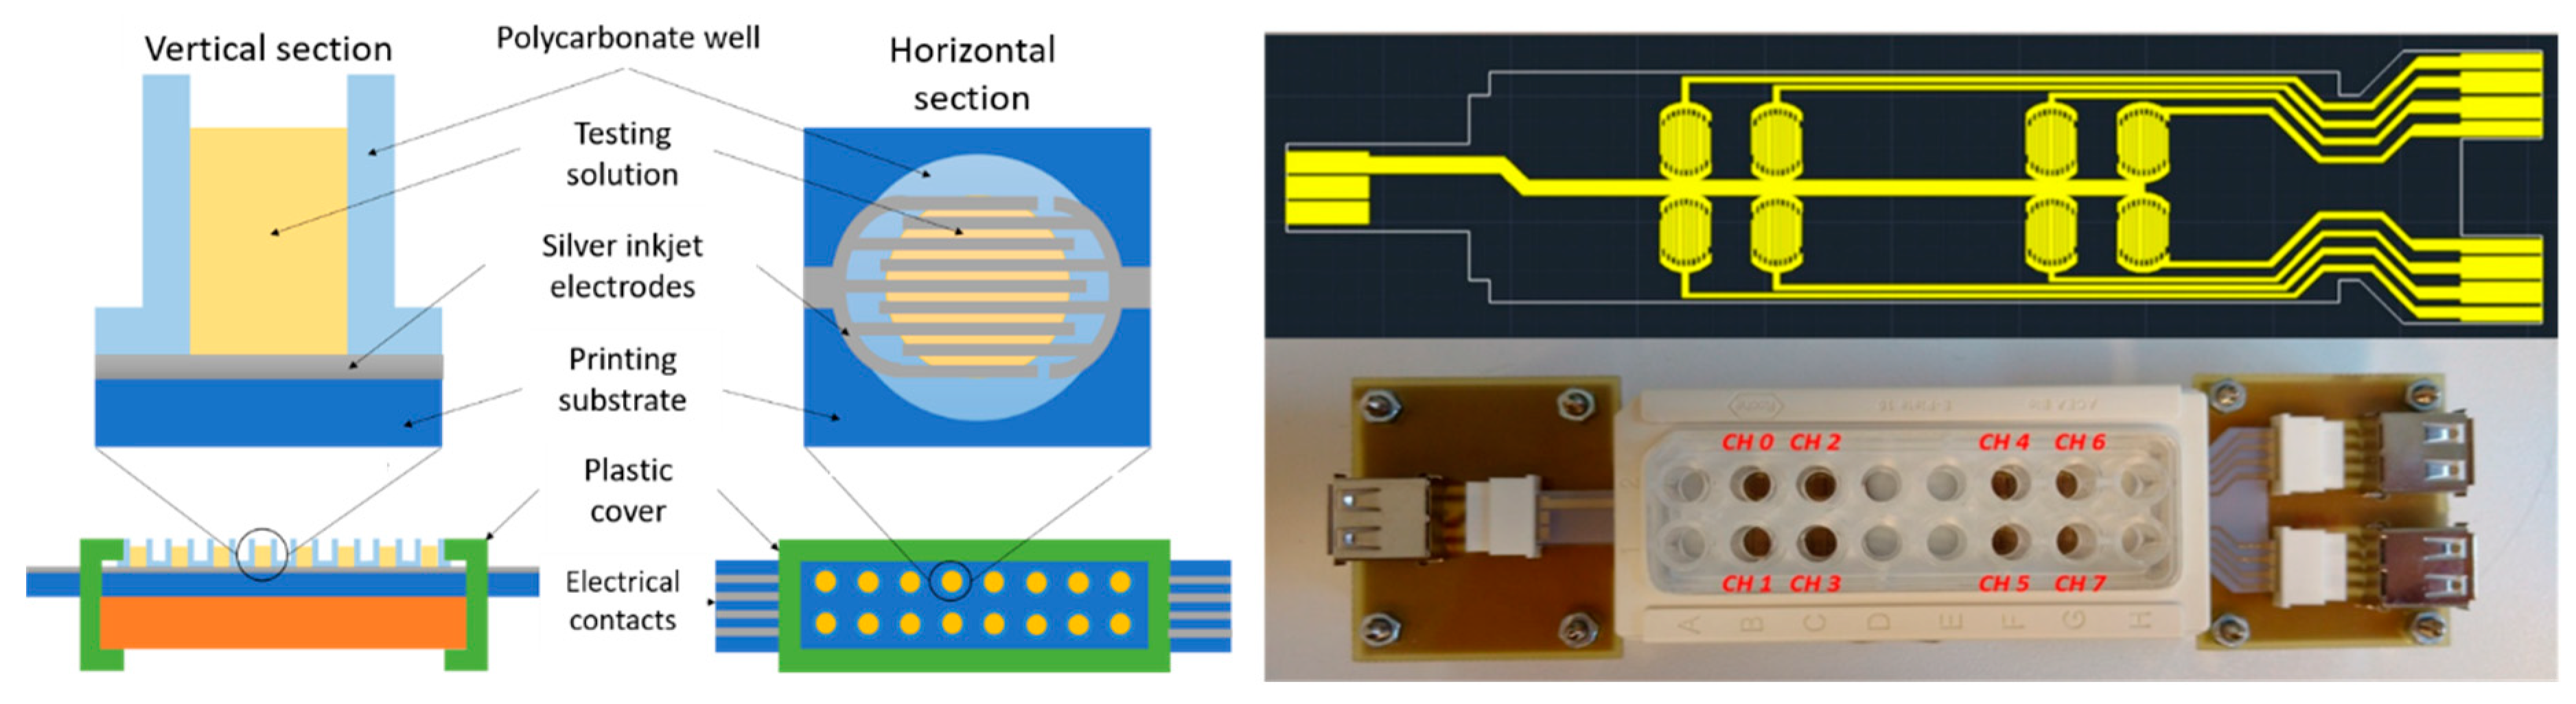
The IDEA system was designed in compliance to a standard 16 well plate (
Figure 2). The IDE were designed with the same electrode specifications obtained from the previous study to fit in the wells. Eight electrodes were defined, divided into control (CH 0-3) and test (CH 4-7) groups. A vinyl bi-adhesive patch was added between the IDE array and the 16 well plate in order to ensure the sealing of the wells. Finally, the printed substrate was connected to a flat ribbon connector and to USB ports with a custom printed circuit board (PCB). The evaporation of the liquid volume in the wells, i.e., less than 250 µL, was prevented by a sealed cover slip. The entire IDEA system was placed under a biological laminar flow hood during the tests.
The USB wires coming from the hood were connected to a 10 channel switching matrix HP 3488, which in turn was connected to the Solartron 1260a frequency analyzer. The SMaRT software driving the Solartron was set to run EIS measurements for 24 h, and to execute an external Matlab function to change the switching matrix channel in a loop at each EIS measurement.
Two of the switching matrix channels were not connected to the IDEA system. In fact, one was used to measure the open circuit impedance, i.e., to test the maximal impedance measurable by the system. This was necessary to verify that the parasitic effects of the wires, the connections, and the instruments did not overwhelm the measured impedance. The last switching matrix channel was connected to the control system: we used a MEA device to perform the same measurements of the IDEA system, to have a control test based on commercial devices. We developed a custom PCB connecting all the 60 microelectrodes of the MEA devices, and we placed this system under the hood, close to the IDEA system. We added external Ag/AgCl reference electrodes (CH Instruments) in contact with the solution in the MEA well. During the tests, we inoculated bacteria and phages on the two systems at the same time and with equal concentrations.
Lactococcus lactis subsp. Lactis, DSM 4366, and its phage P008 were used in this study; both microorganisms were bought from DSMZ culture collection (Germany). This species of lactic acid bacterium was chosen because of its preeminence in cheese making.
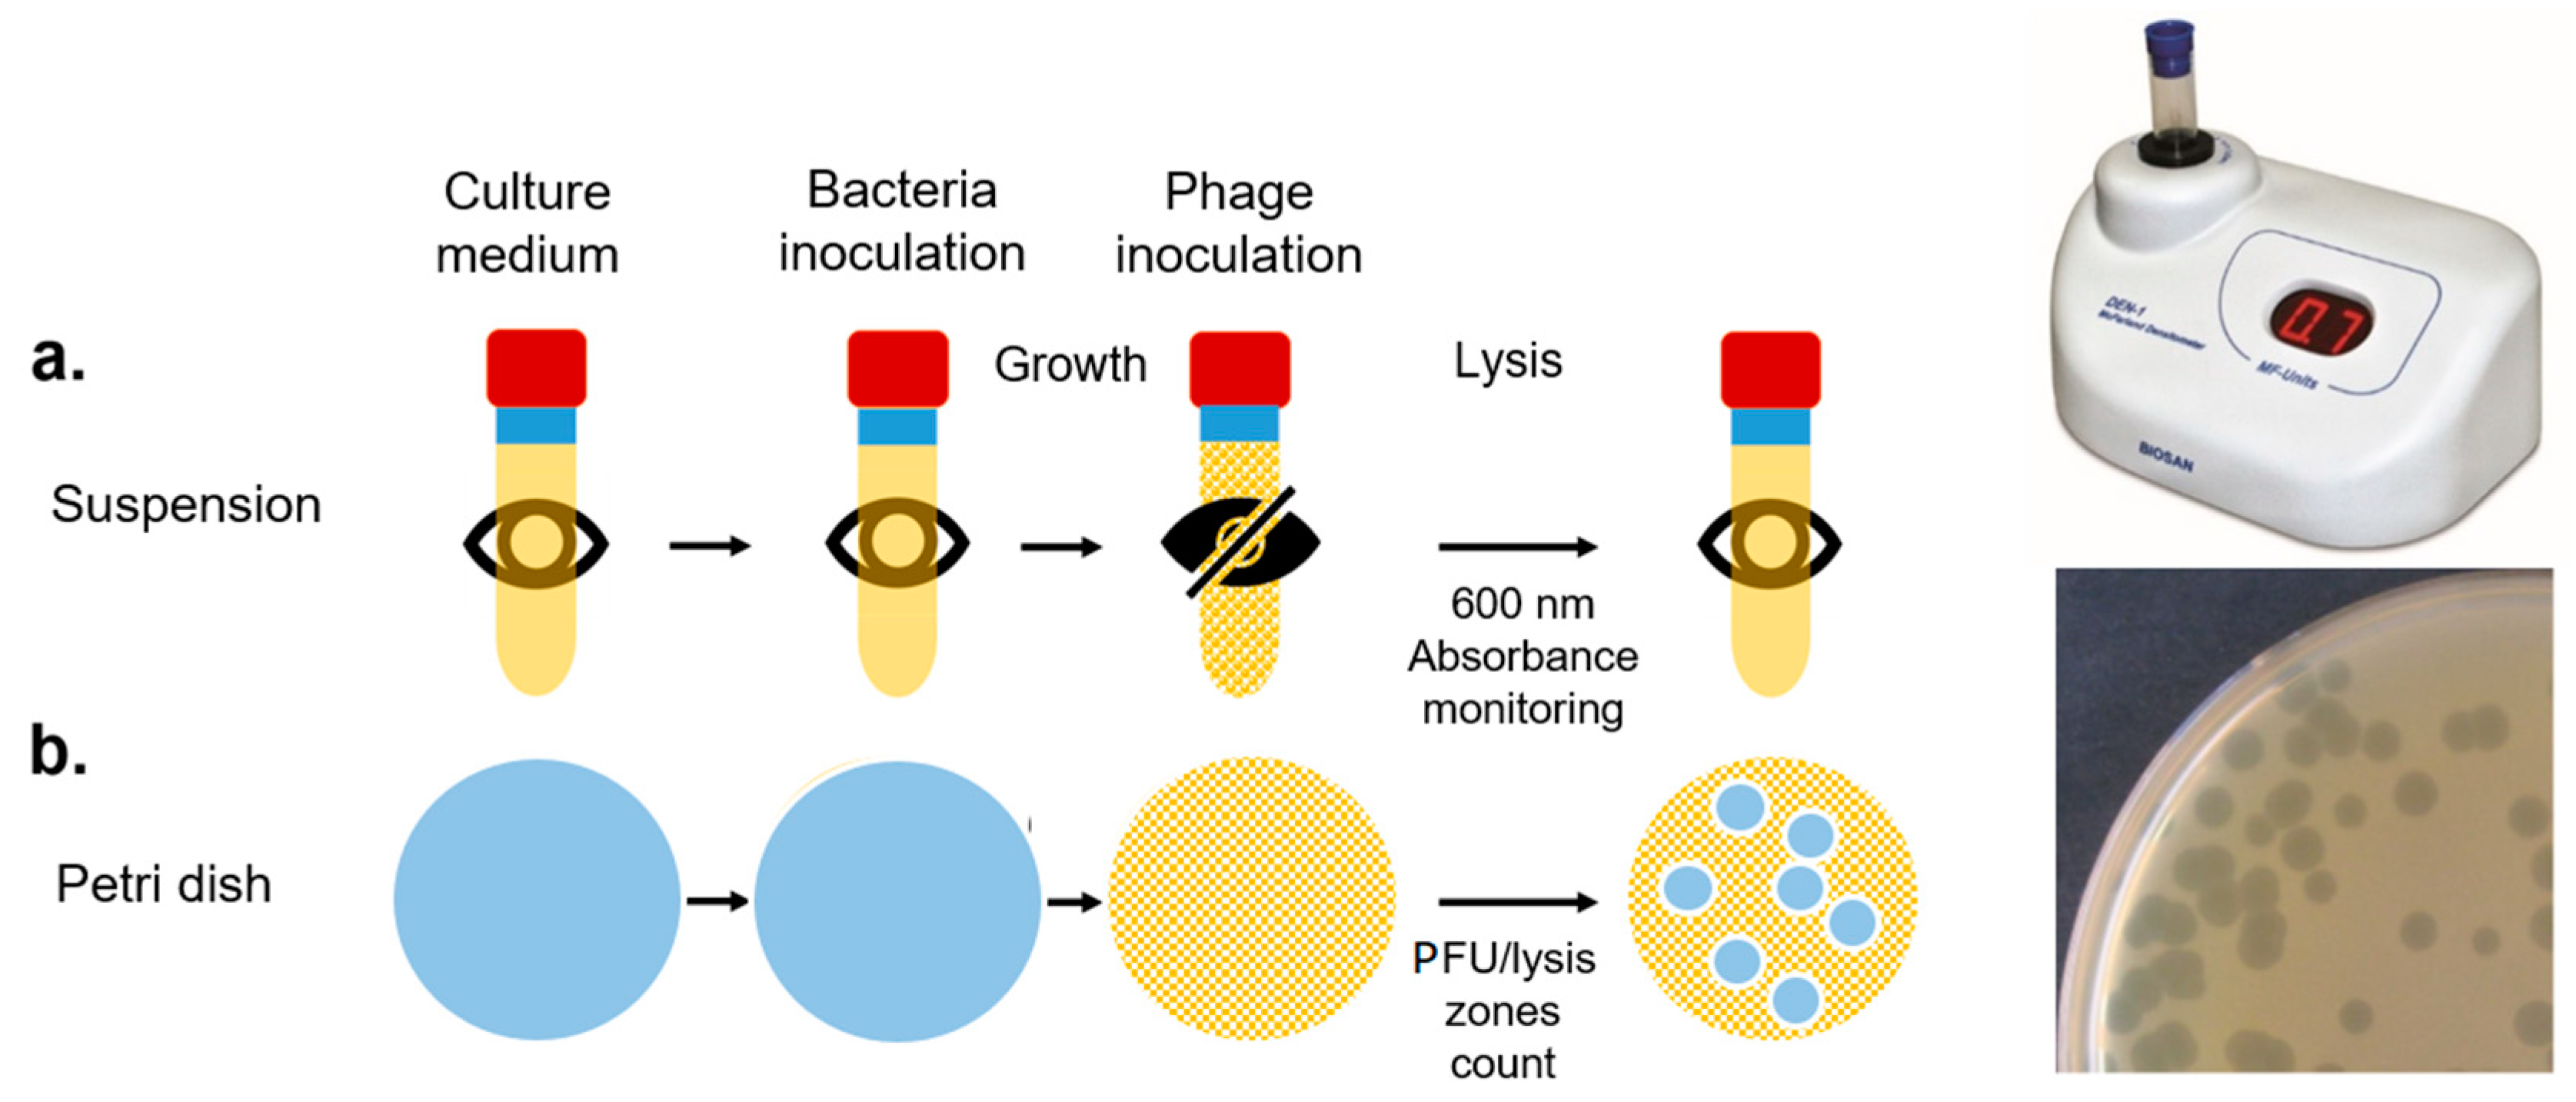
We tested the phage infection by three methods: first we defined the relative concentrations of bacteria and phage suitable to observe the production of lytic plaques in Petri plates containing the medium M17 (Oxoid) in 6 h (
Figure 2b). We then determined the 600 nm absorbance of the bacterial culture in M17 broth after growth and after phage inoculation (
Figure 3a).
After the turbidity test, we detected the phage presence with the IDEA and MEA systems in the test (bacteria exposed to the phage) and control (bacteria added with phosphate buffered saline) experiments at time 0 (M17 medium), 4 h (after bacterial inoculation), and 7 h (after phage or PBS inoculation).
The EIS data collected by the IDEA system were then fitted with the equivalent electrical model previously defined (
Figure 1c), defining the variations of the parameters values as a consequence of the phage inoculation.
3. Results and Discussion
3.1. Printed Line Characterization
The inkjet-printed lines produced with the Epson printer were characterized in previous studies by means of their actual width and their conductivity [
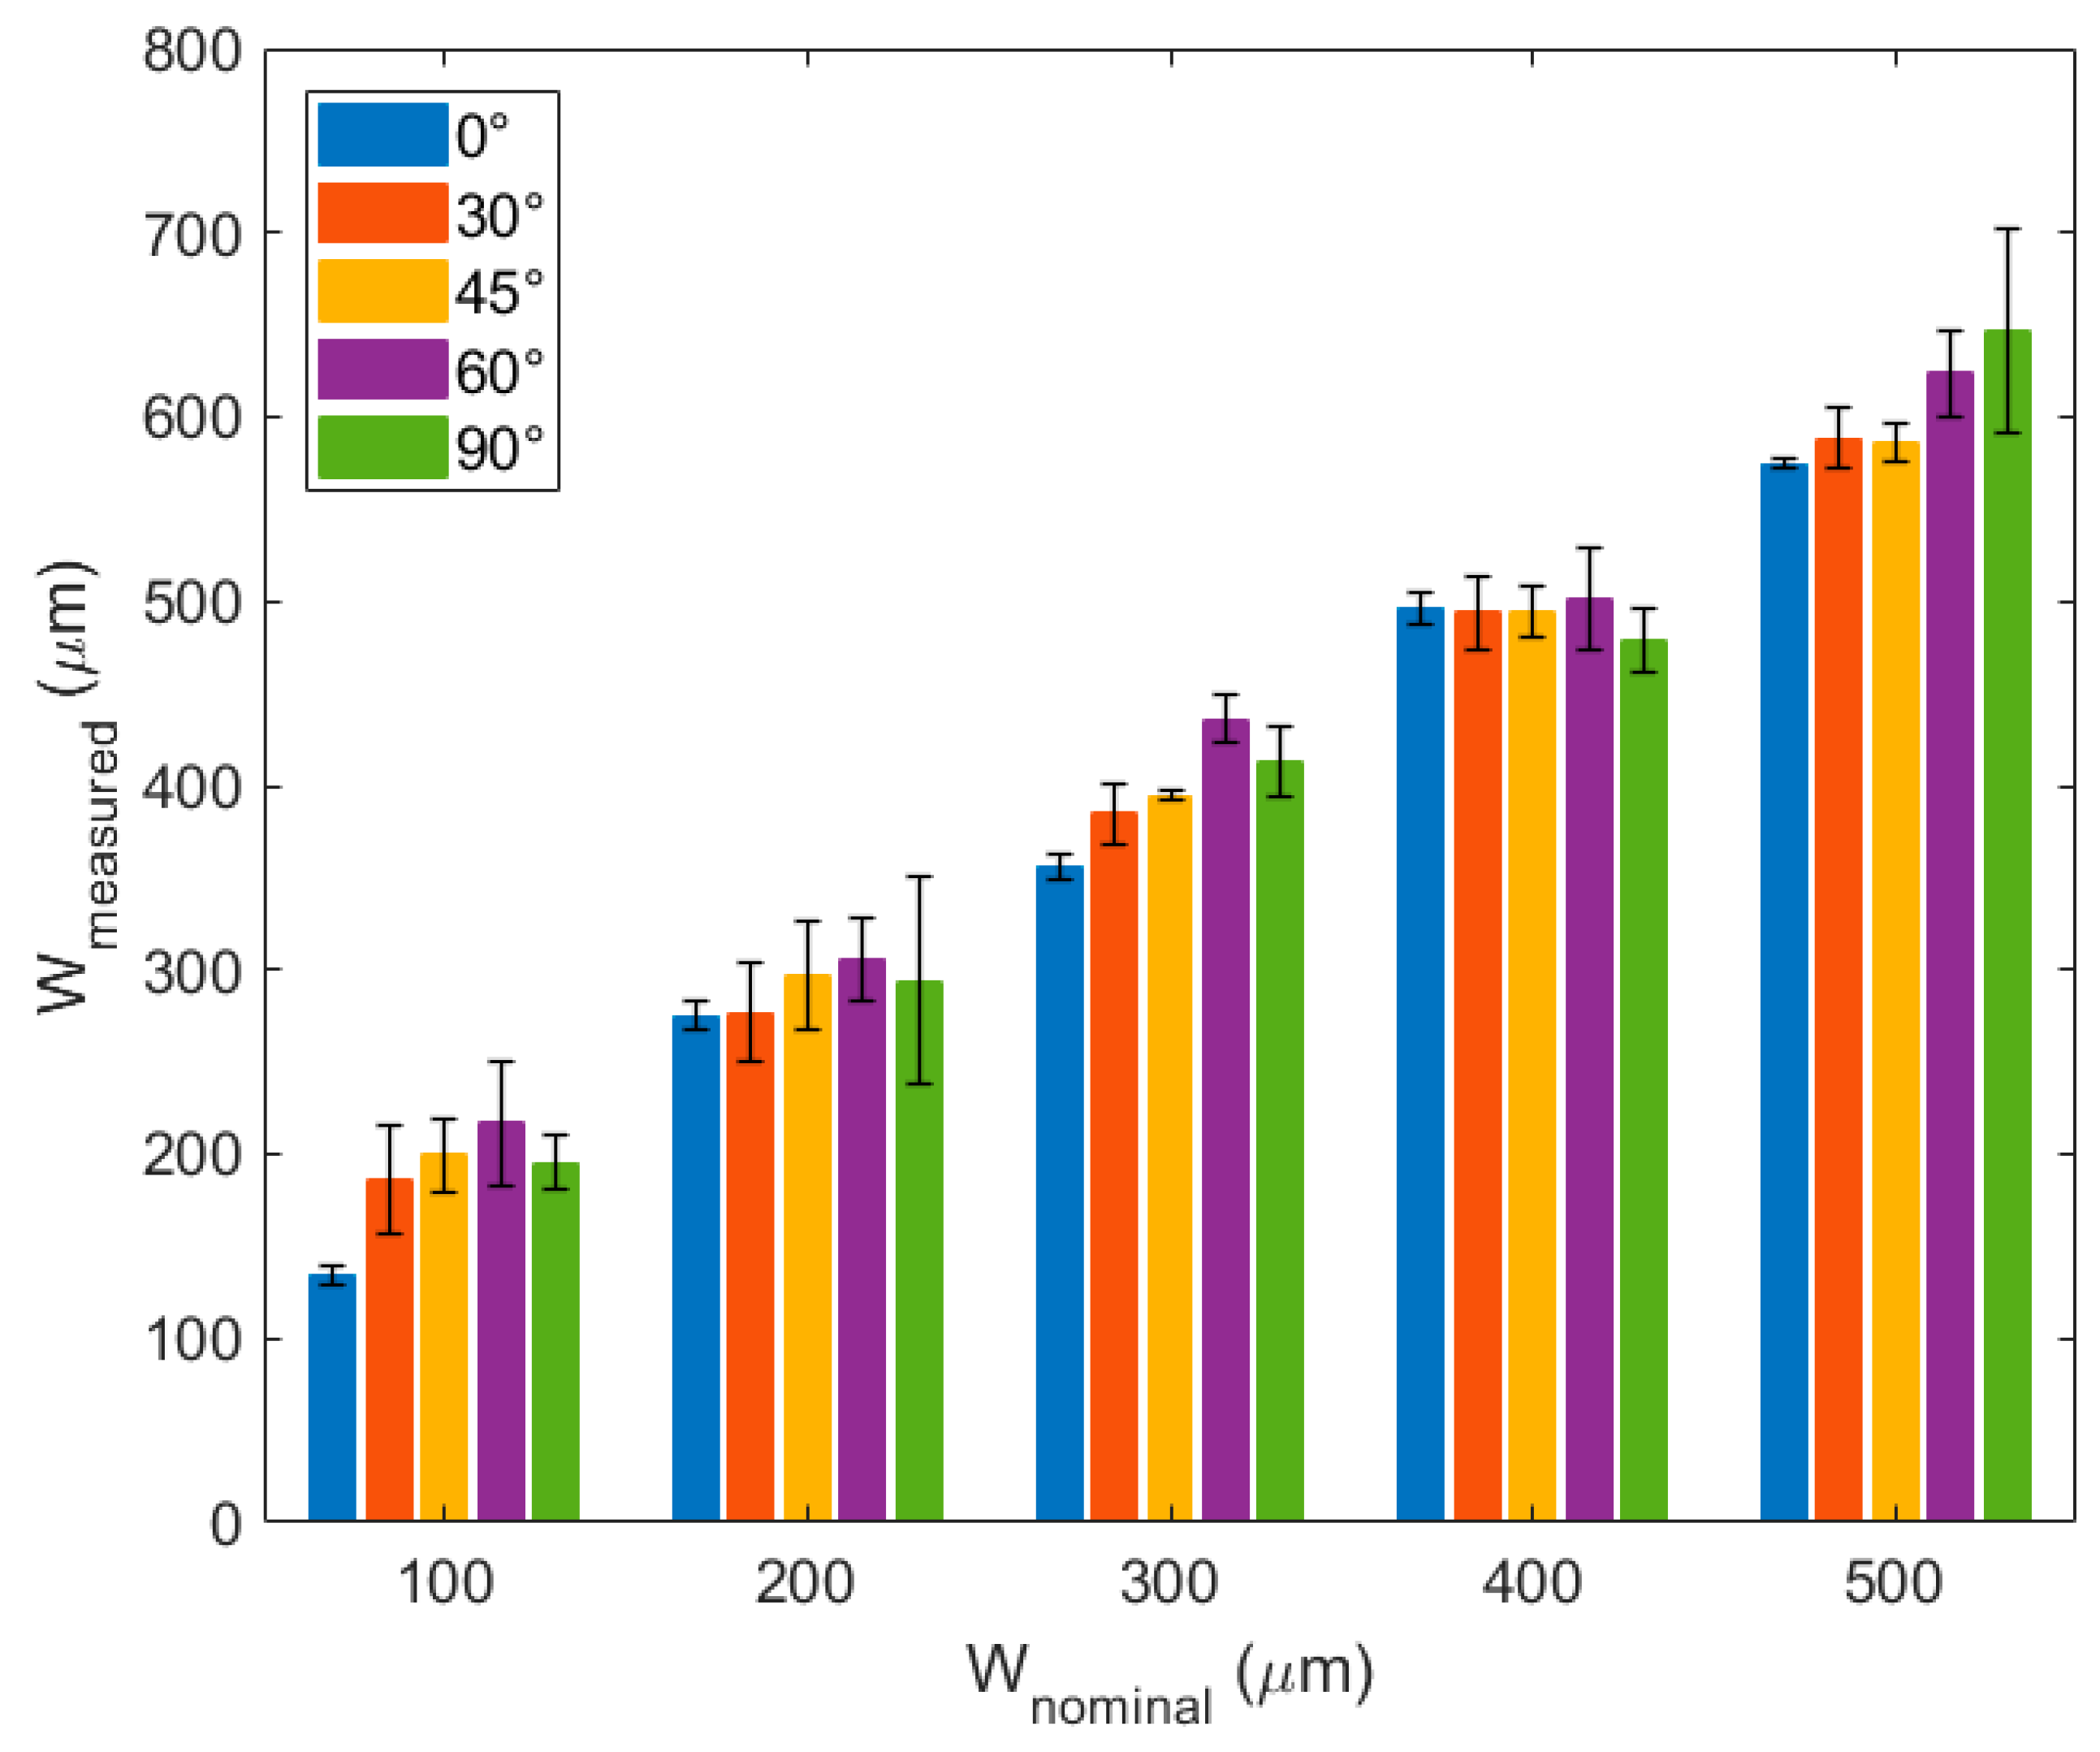
21]. However, this was done only for lines printed in the print head movement direction (horizontal lines). Since in this work we needed to design more complex layouts, we studied the actual width of lines printed at different angles with respect to the print head movement. These results are depicted in
Figure 4, where 0° lines are the horizontal ones.
As expected, the lines printed at 0° were those with the lowest difference between the measured and nominal widths. Interestingly, there are particular widths at which the line angle did not particularly influence the measured width. This depends on the printing resolution of the AutoCAD software [
21].
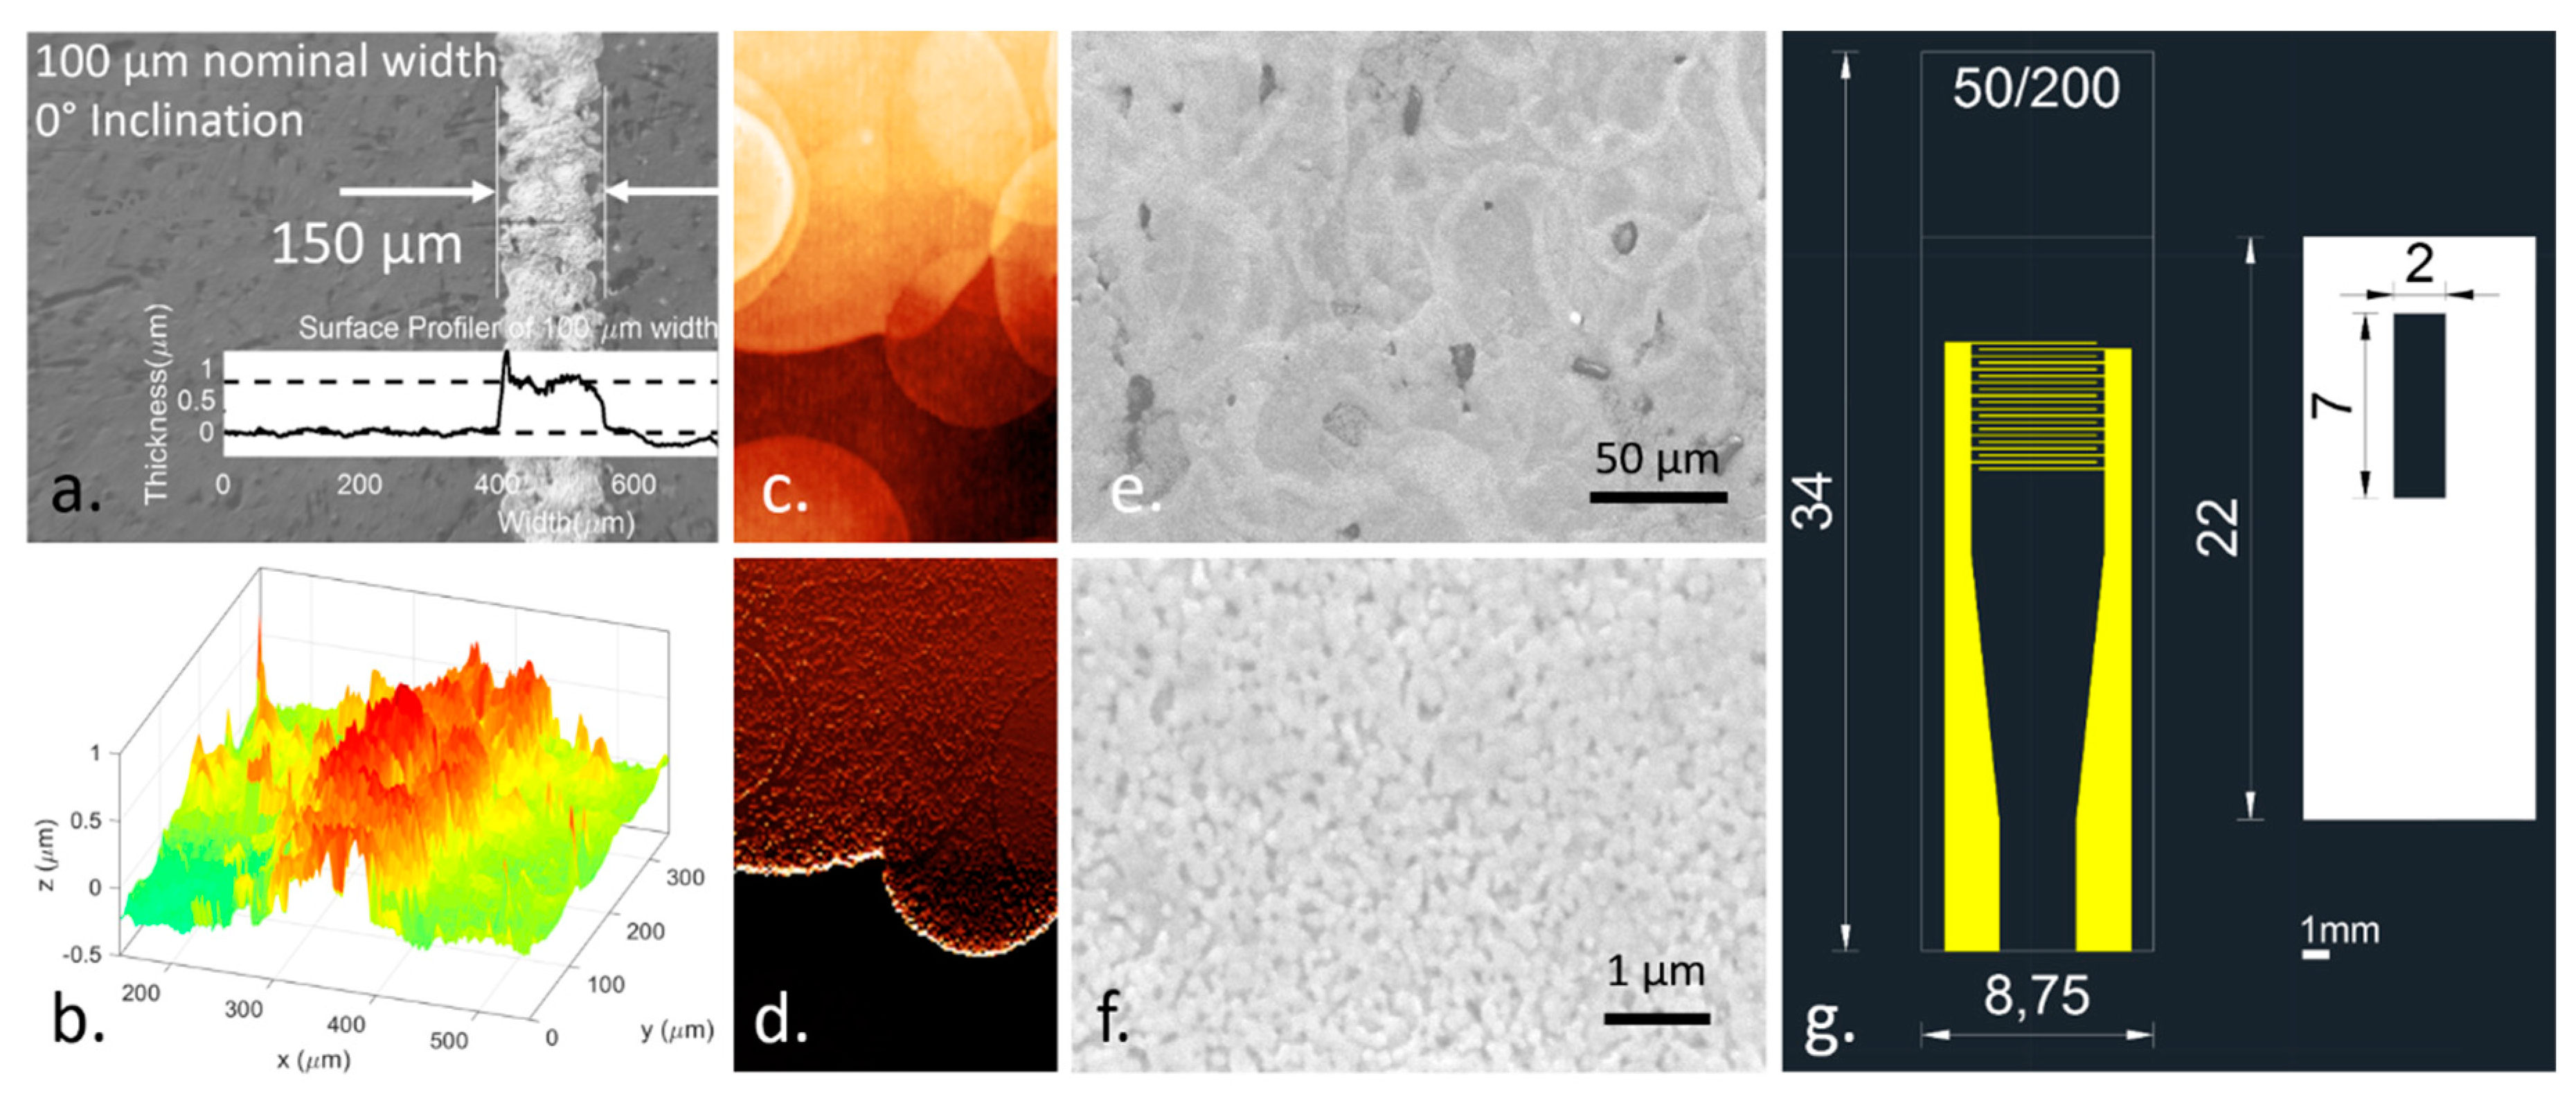
The morphological characterizations of the printed lines are reported in
Figure 5a–f. The figure shows that the printed lines have an average thickness of 800 µm (
Figure 5a,b), obtained by the overlapping of multiple ink drops allowing for the AgNPs conduction (
Figure 5c–e). The single AgNPs are visible in
Figure 5f, with an average diameter of 150 nm.
Figure 5g shows the IDE AutoCAD layout, both of the printed electrodes and of the passivation patch. The devices produced with this layout were used to study both the electrodes and the passivation window width effect on the EIS measurements in PBS.
3.2. Interdigitated Electrodes Modeling and Optimization
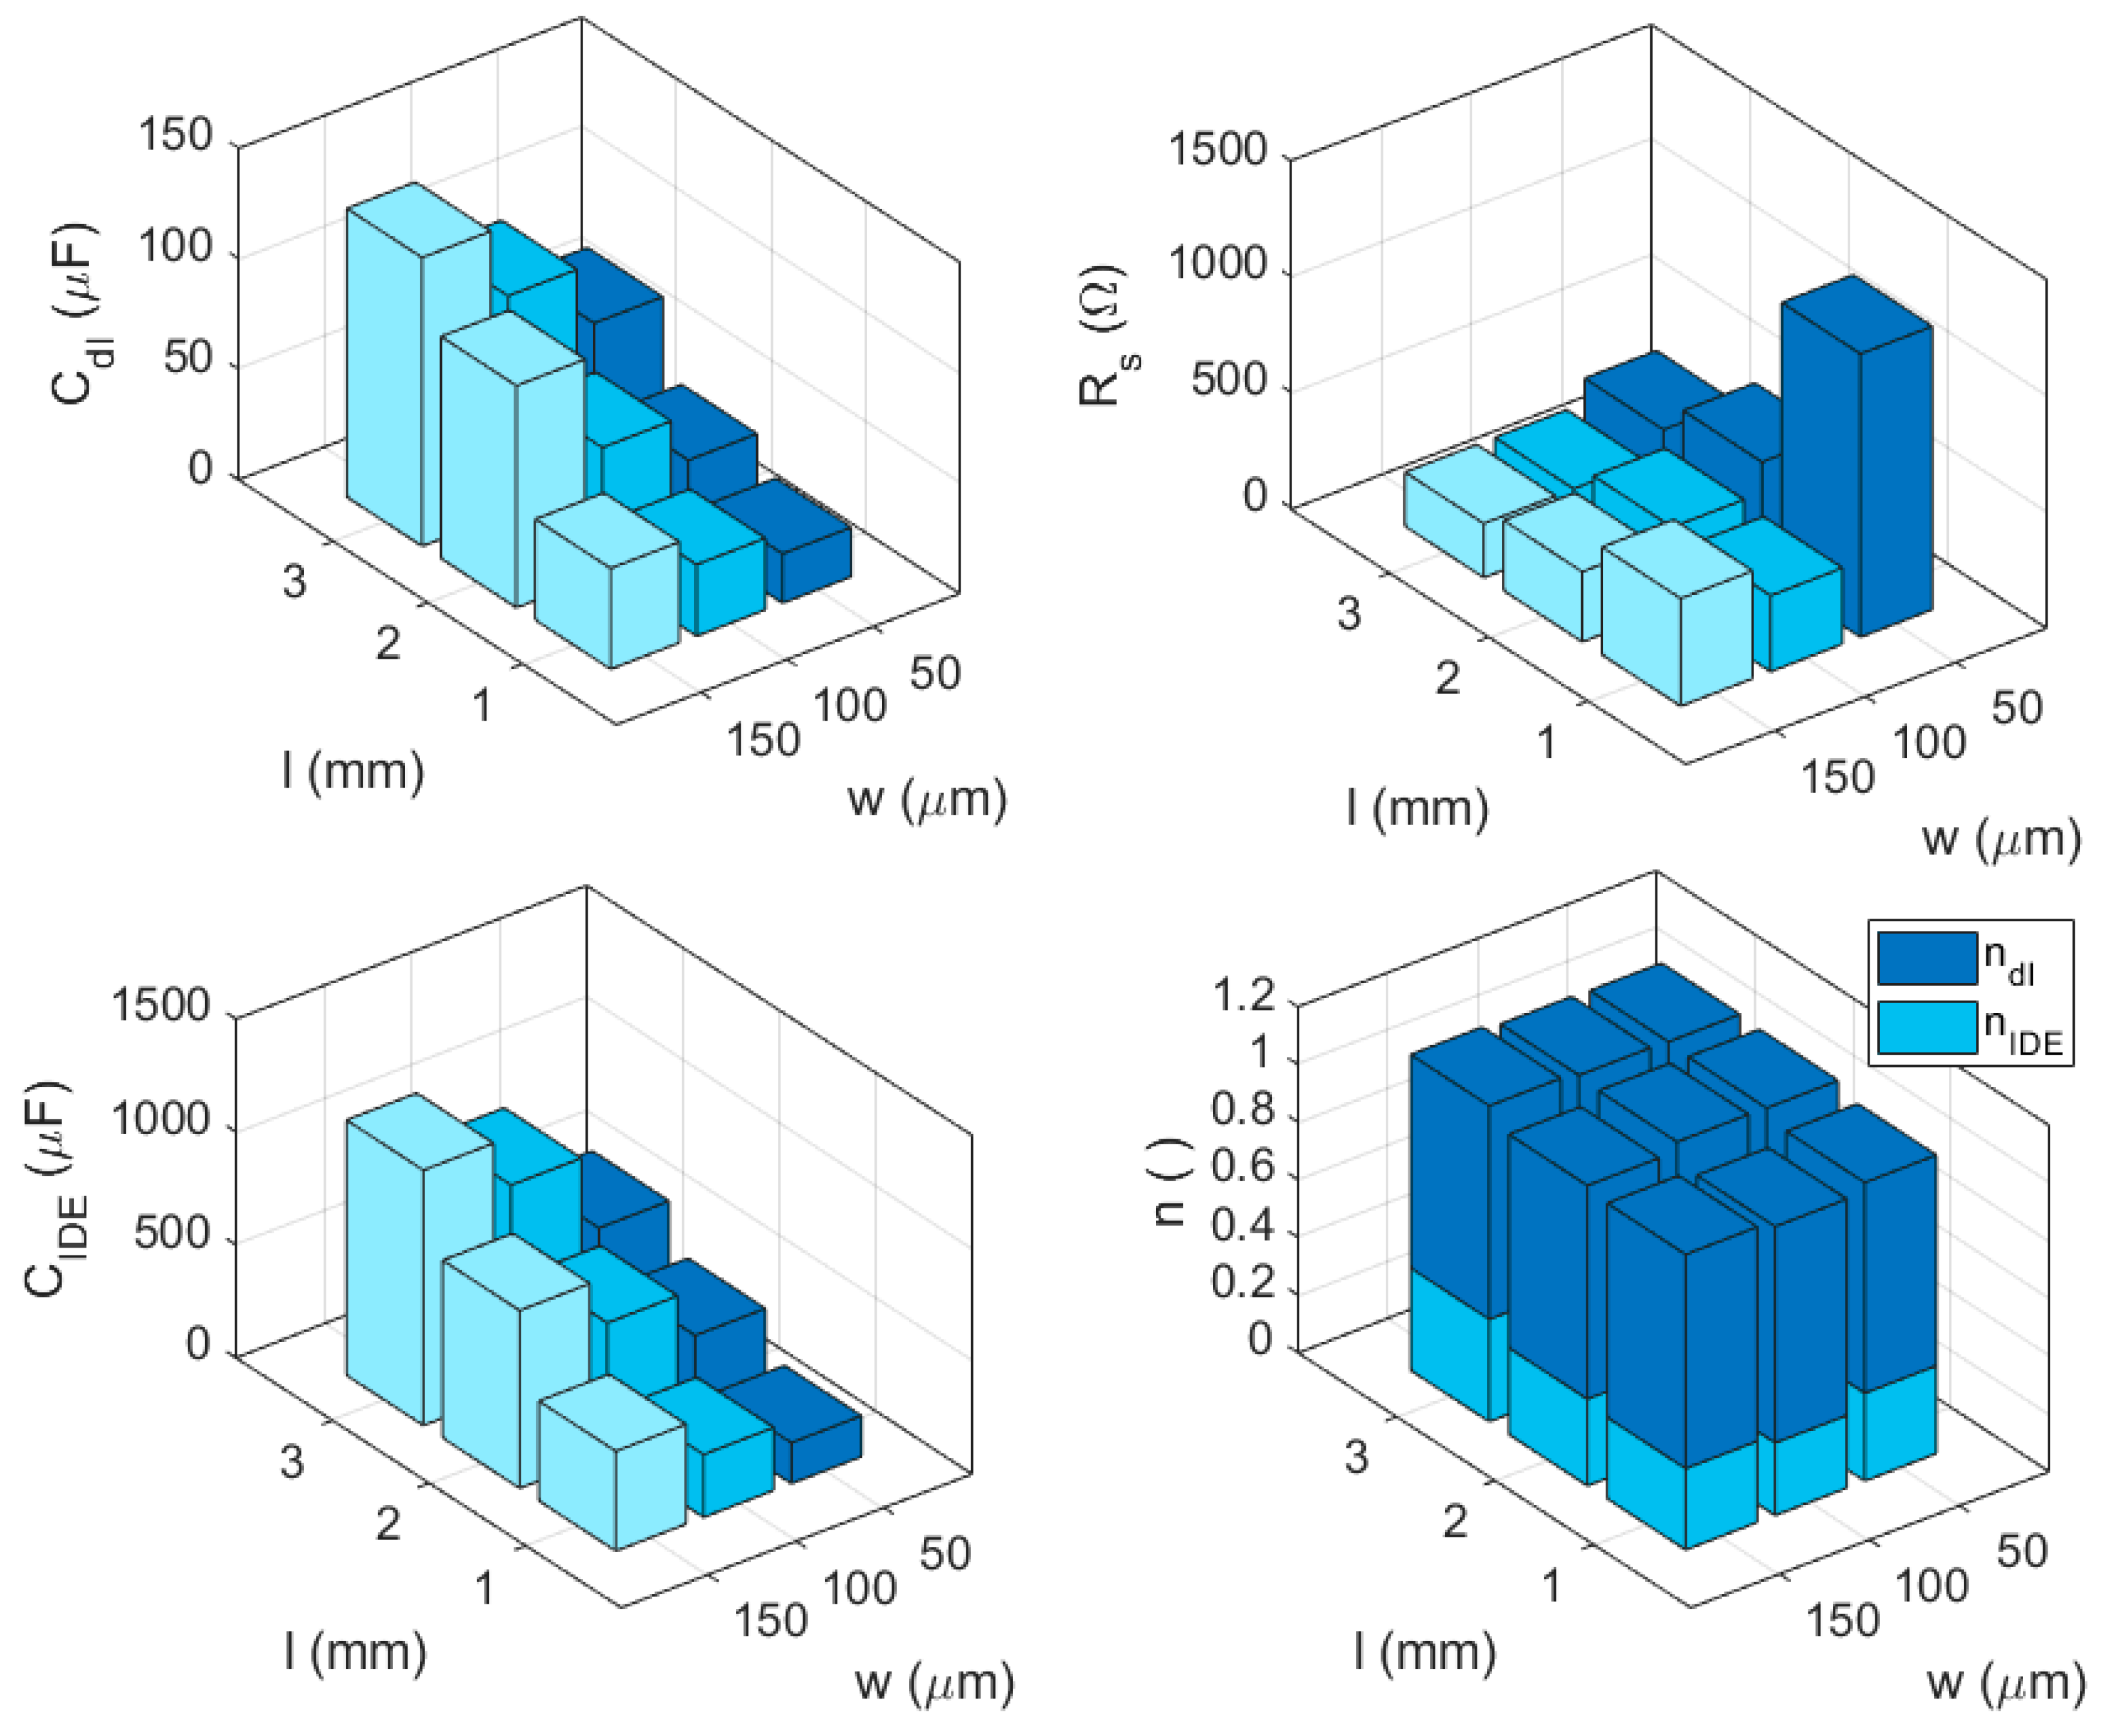
The EIS measurements were performed on three IDE devices per each combination of electrodes and passivation window widths values. The average data were fitted by the equivalent electrical model of
Figure 1c. The obtained parameter values showed a fitting error lower than 5% for all the parameters and
χ2 < 0.001. The fitting results are depicted in
Figure 6 as a function of the IDE geometrical characteristics.
As expected, the Rs values decreased with larger passivation windows, and the double layer capacitance (Cdl) and IDE capacitance (CIDE) showed very similar trends with the geometrical characteristics of the IDE, despite the values’ difference of one order of magnitude. The n values obtained are very interesting: in fact, they seem not to be influenced by the geometrical characteristics, showing almost constant values of 0.8 for ndl and of 0.3 for nIDE.
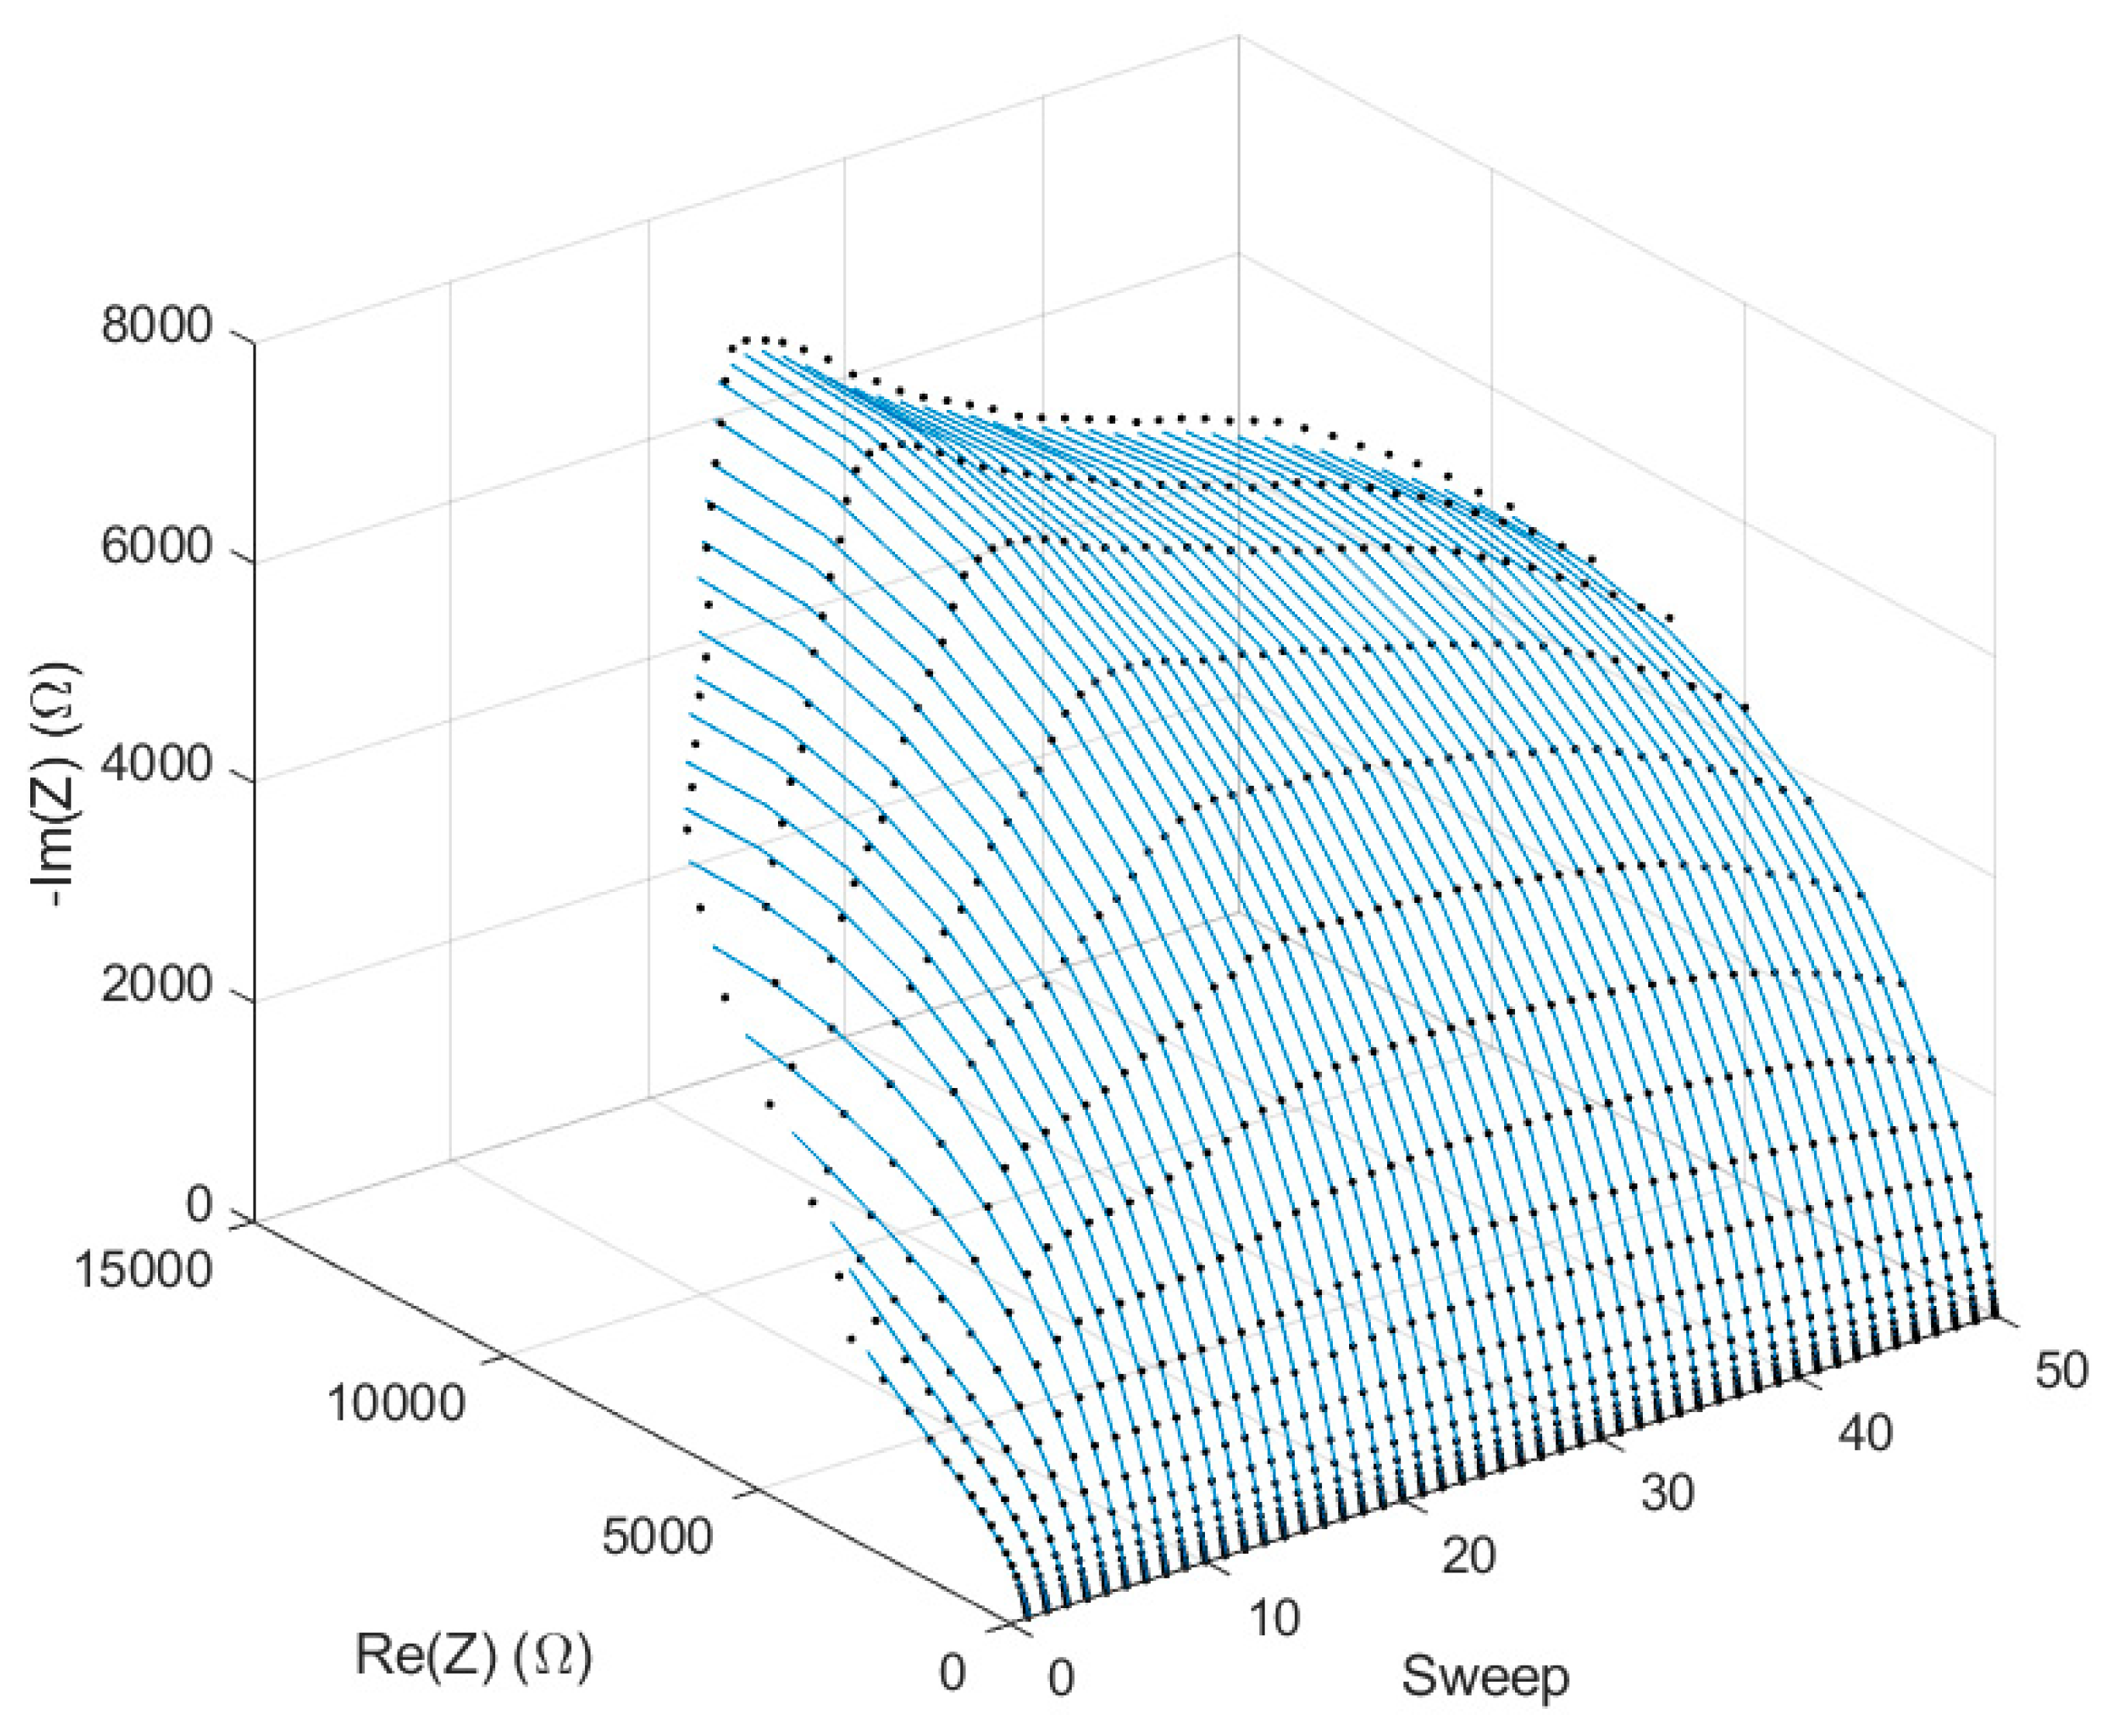
We chose to use 100 µm wide electrodes and 2 mm wide passivation windows for the following studies of the inkjet-printed IDE devices. With these characteristics, we produced and tested the stability of the response of three devices by repeating 50 consecutive EIS measurements, for a period of 90 min.
Figure 7 depicts the Nyquist diagrams of the average of the EIS measurements, and the fits of the data with the electrical model of
Figure 1c.
We expected some initial variations, since the PBS absorption by the substrate coating changed the conduction between the electrodes until it was not completely wet. Indeed, this was evident for the first 15 EIS spectra, i.e., for the first 15–20 min after the PBS drop-casting on the IDEs. The obtained fits in
Figure 7 are very close to the experimental data, and the χ
2 values were always smaller than 0.00065, thus validating our model for these electrodes.
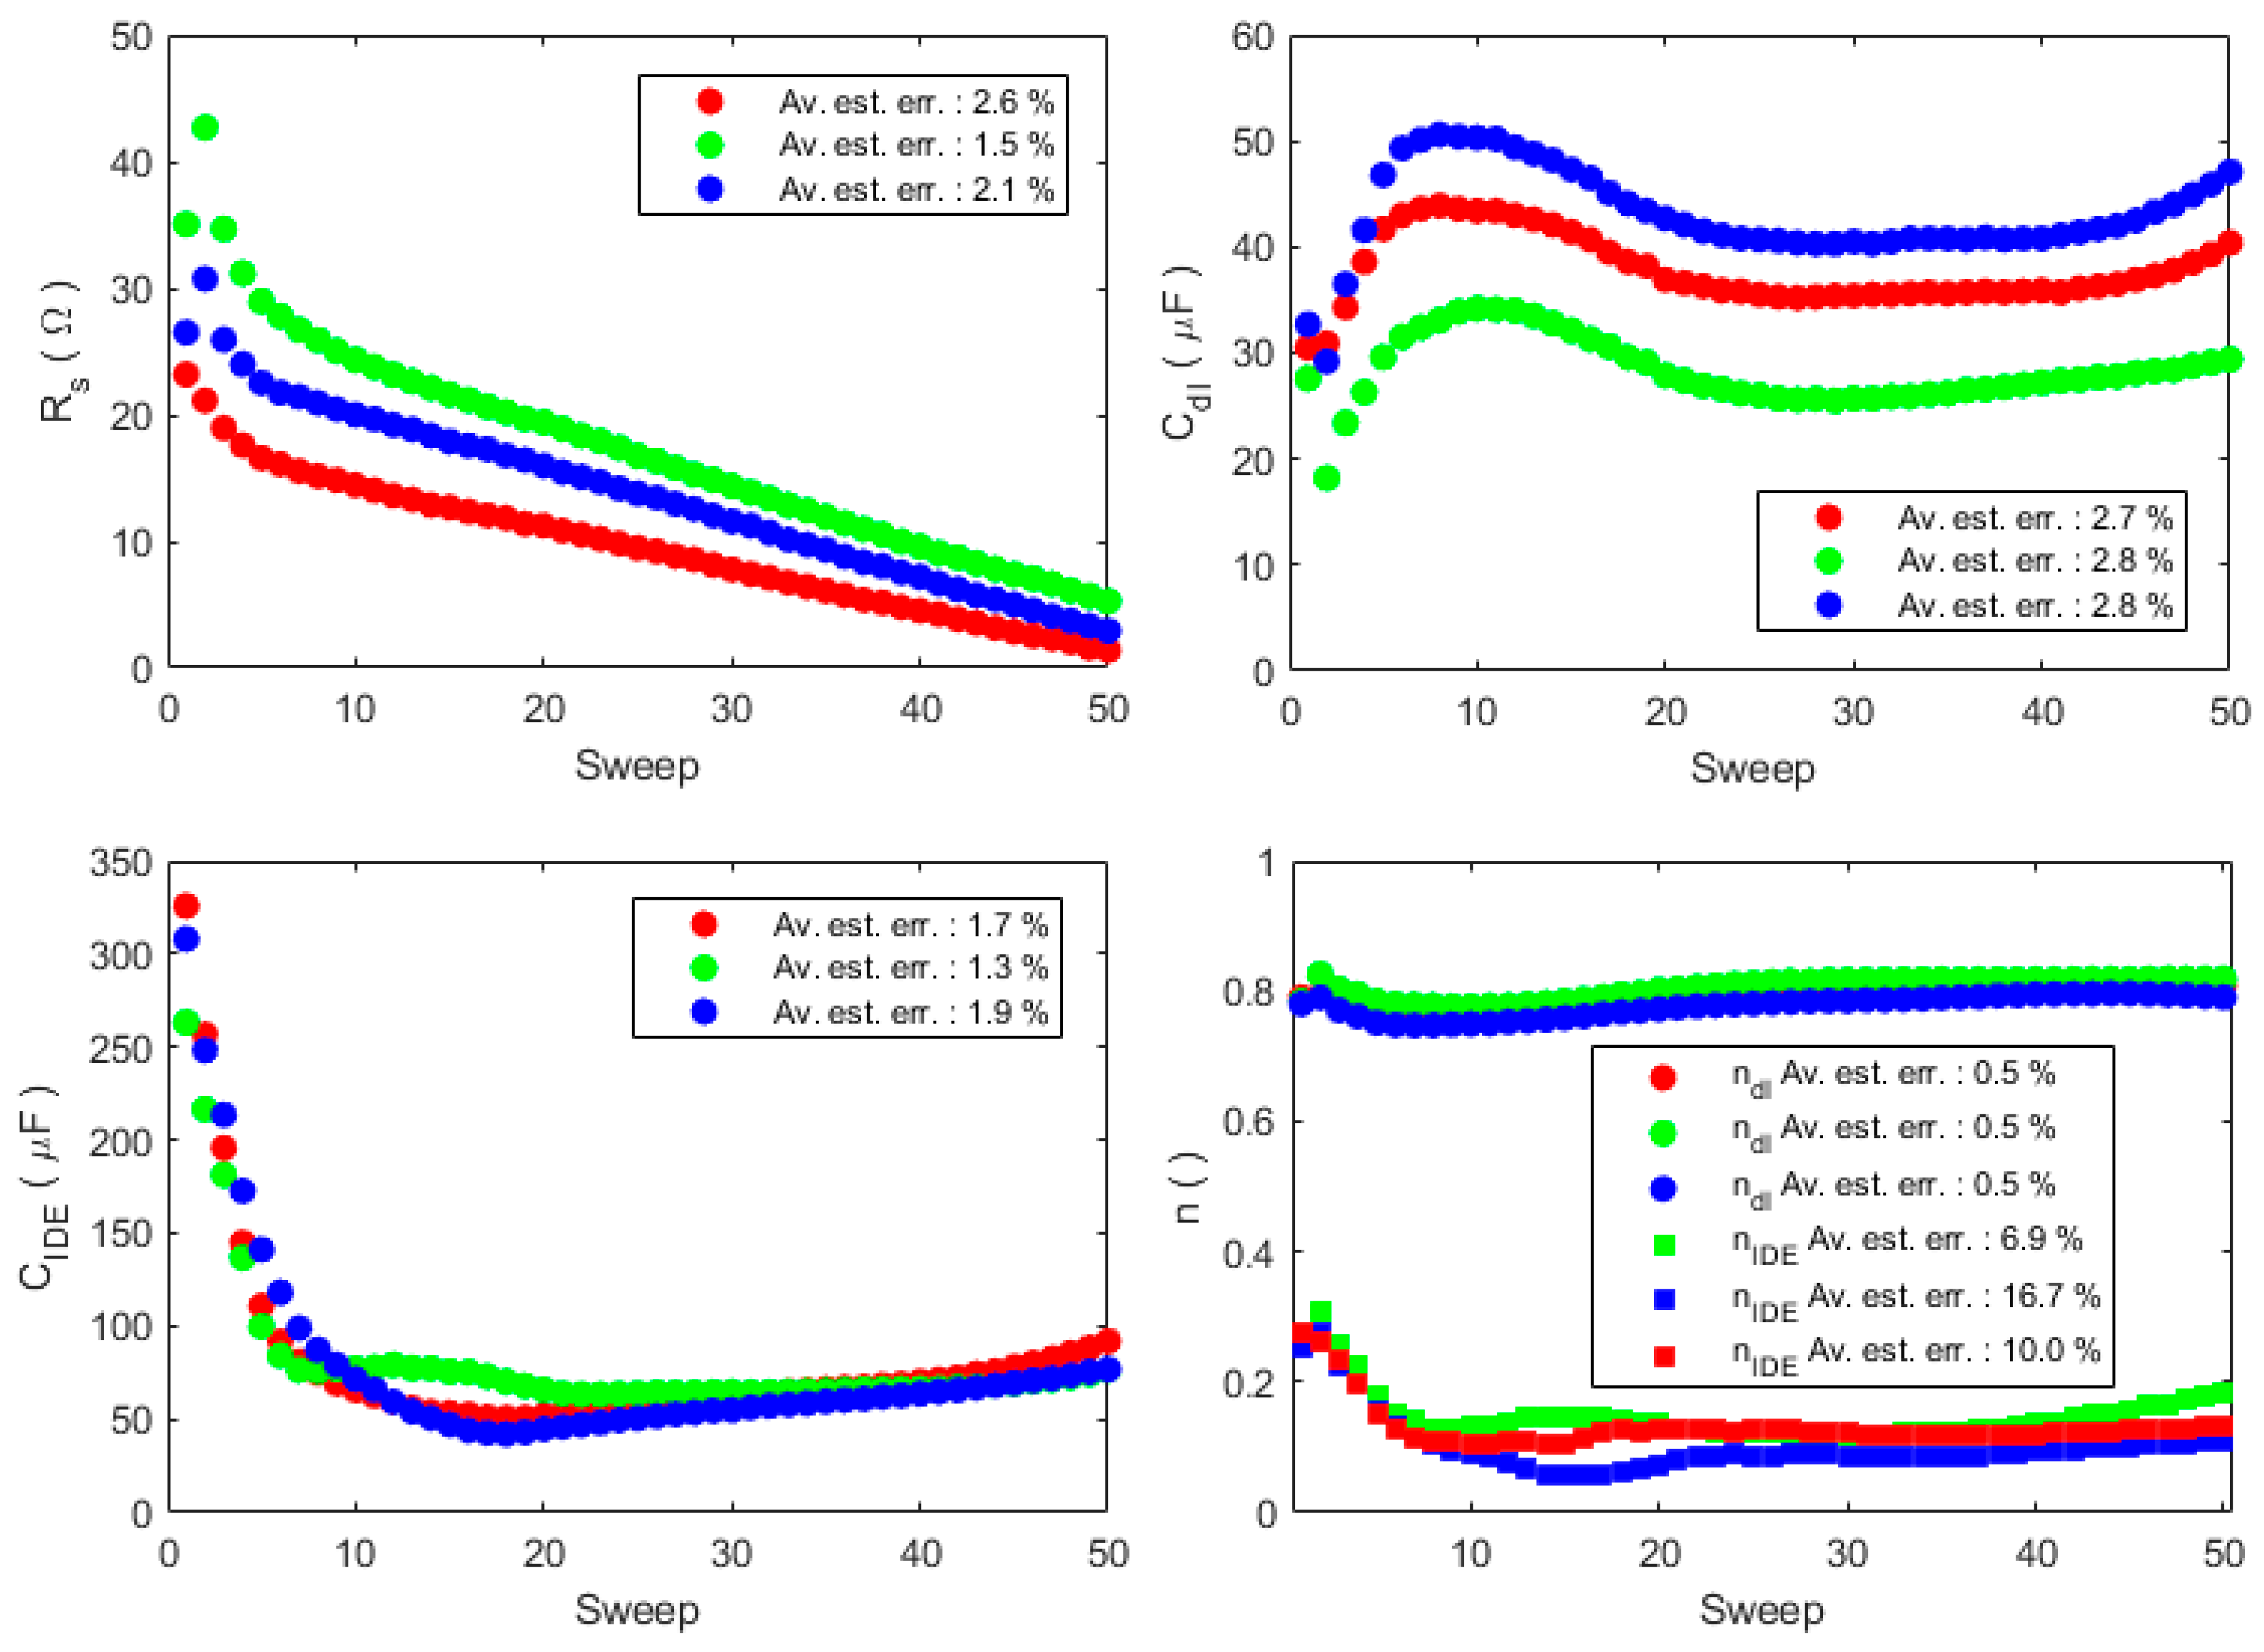
Figure 8 shows the variations of the
Figure 1c model parameters over the EIS sweeps for the three IDE devices tested. The legends report the average estimation error obtained by the fitting procedure in Zview.
After the first 5 min, the Rs values decreased linearly; this is coherent with the evaporation of the 25 µL PBS drop, which up-concentrated the solution, thus making it more conductive. Since the electrode surface does not really change, the double layer capacitance shows an oscillation but not a relevant change in value. Conversely, the IDE constant phase element drastically changed during the first 10 sweeps, and the n value drop suggests that it behaved more like a resistance: this can be explained by the PBS absorption into the coating, which creates a conductive channel between the electrodes.
3.3. Phage Detection
The host bacterium
Lactococcus lactis was grown on Petri dishes to give a confluent growth. Serial dilutions of the P008 phage in its buffer (phosphate buffered saline, PBS) were tested to define which concentration showed lytic plaques after 6 h. The results are depicted in the inset of
Figure 9. We chose a phage concentration of 1:100 for the following experiments.
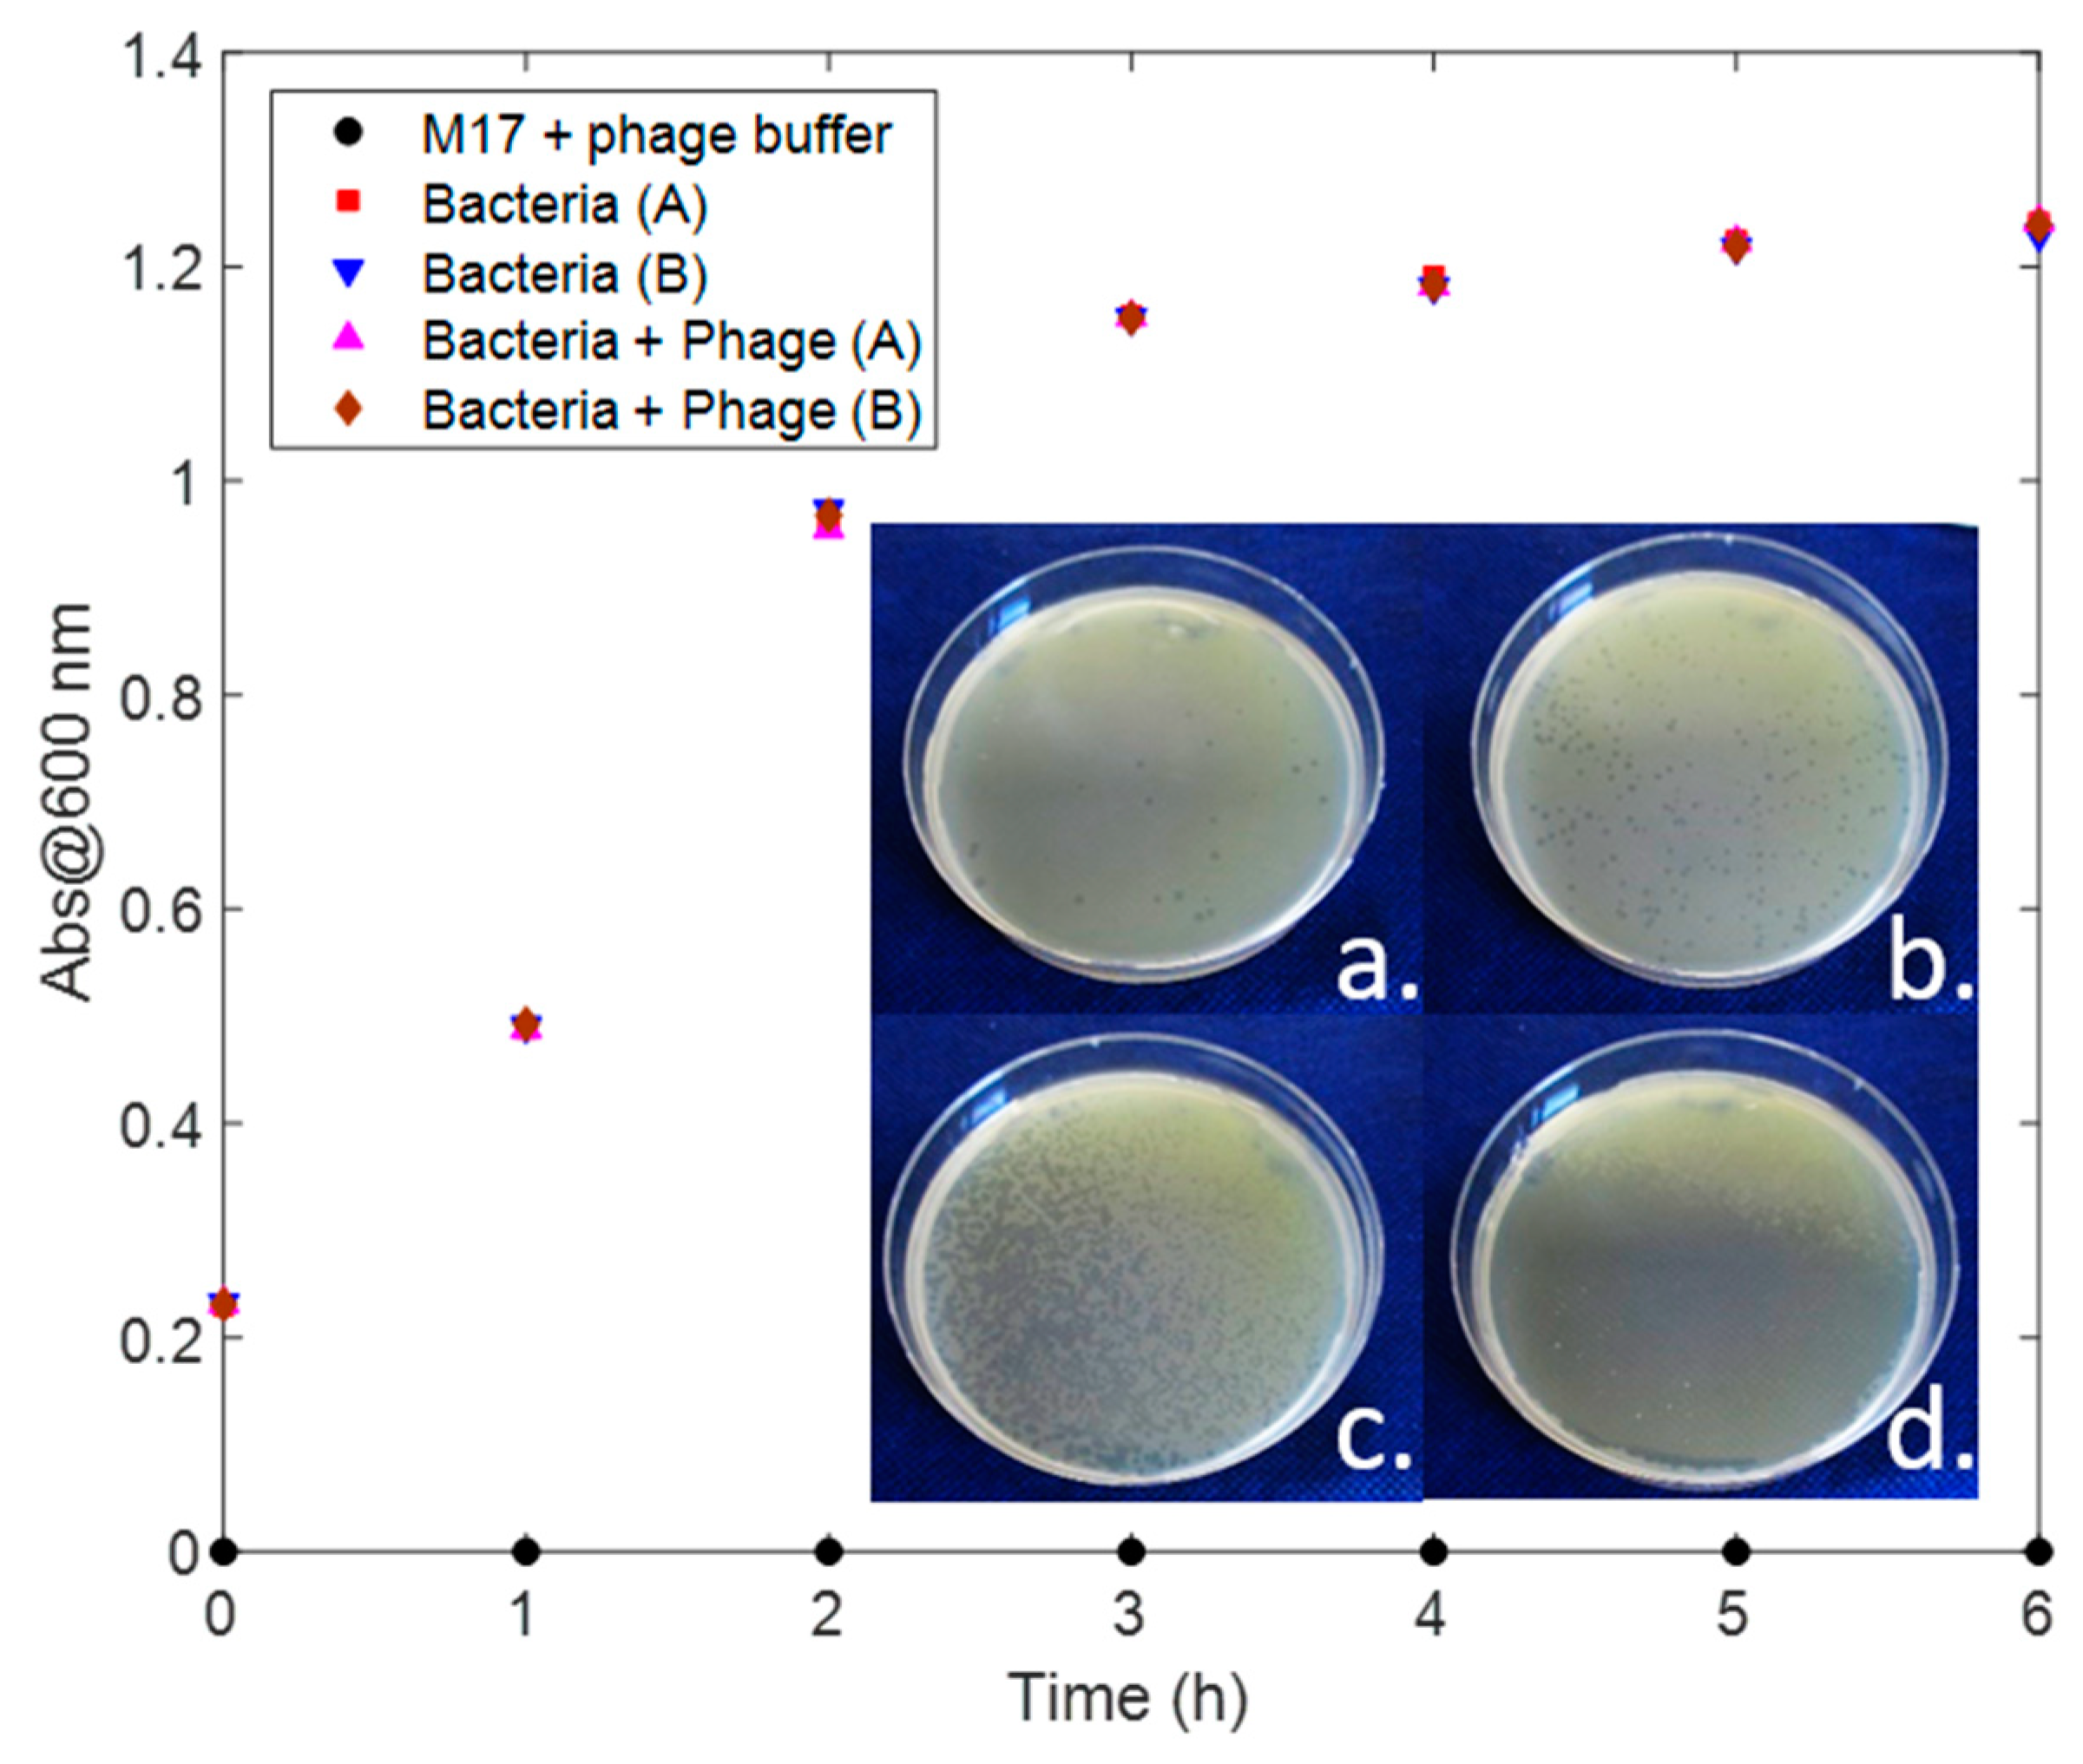
To test the phage infection, we used also the turbidity method by monitoring the 600 nm absorbance of 5 vials over time. The first vial was used as control test and contained only M17 medium and phage PBS buffer. The second and third vials were inoculated with
Lactococcus lactis, and the last 2 vials were inoculated with both bacteria and phages. The absorbance of all the vials were measured every hour, as depicted in
Figure 9.
Even if the phages had abundant time to infect the bacterial cells and cause their lysis, the absorbance of the vials with and without the phages did not show any variation. This is probably due to the fact that the lysed bacteria still absorb at 600 nm. Pujato et al. (2018) observed that turbidity was only positive for 90% of a group of samples for which lysis plaques were observed on plaque assays [
1]. This proves that even standard detection techniques are not always reliable, reinforcing the importance of the introduction of a new phage detection method.
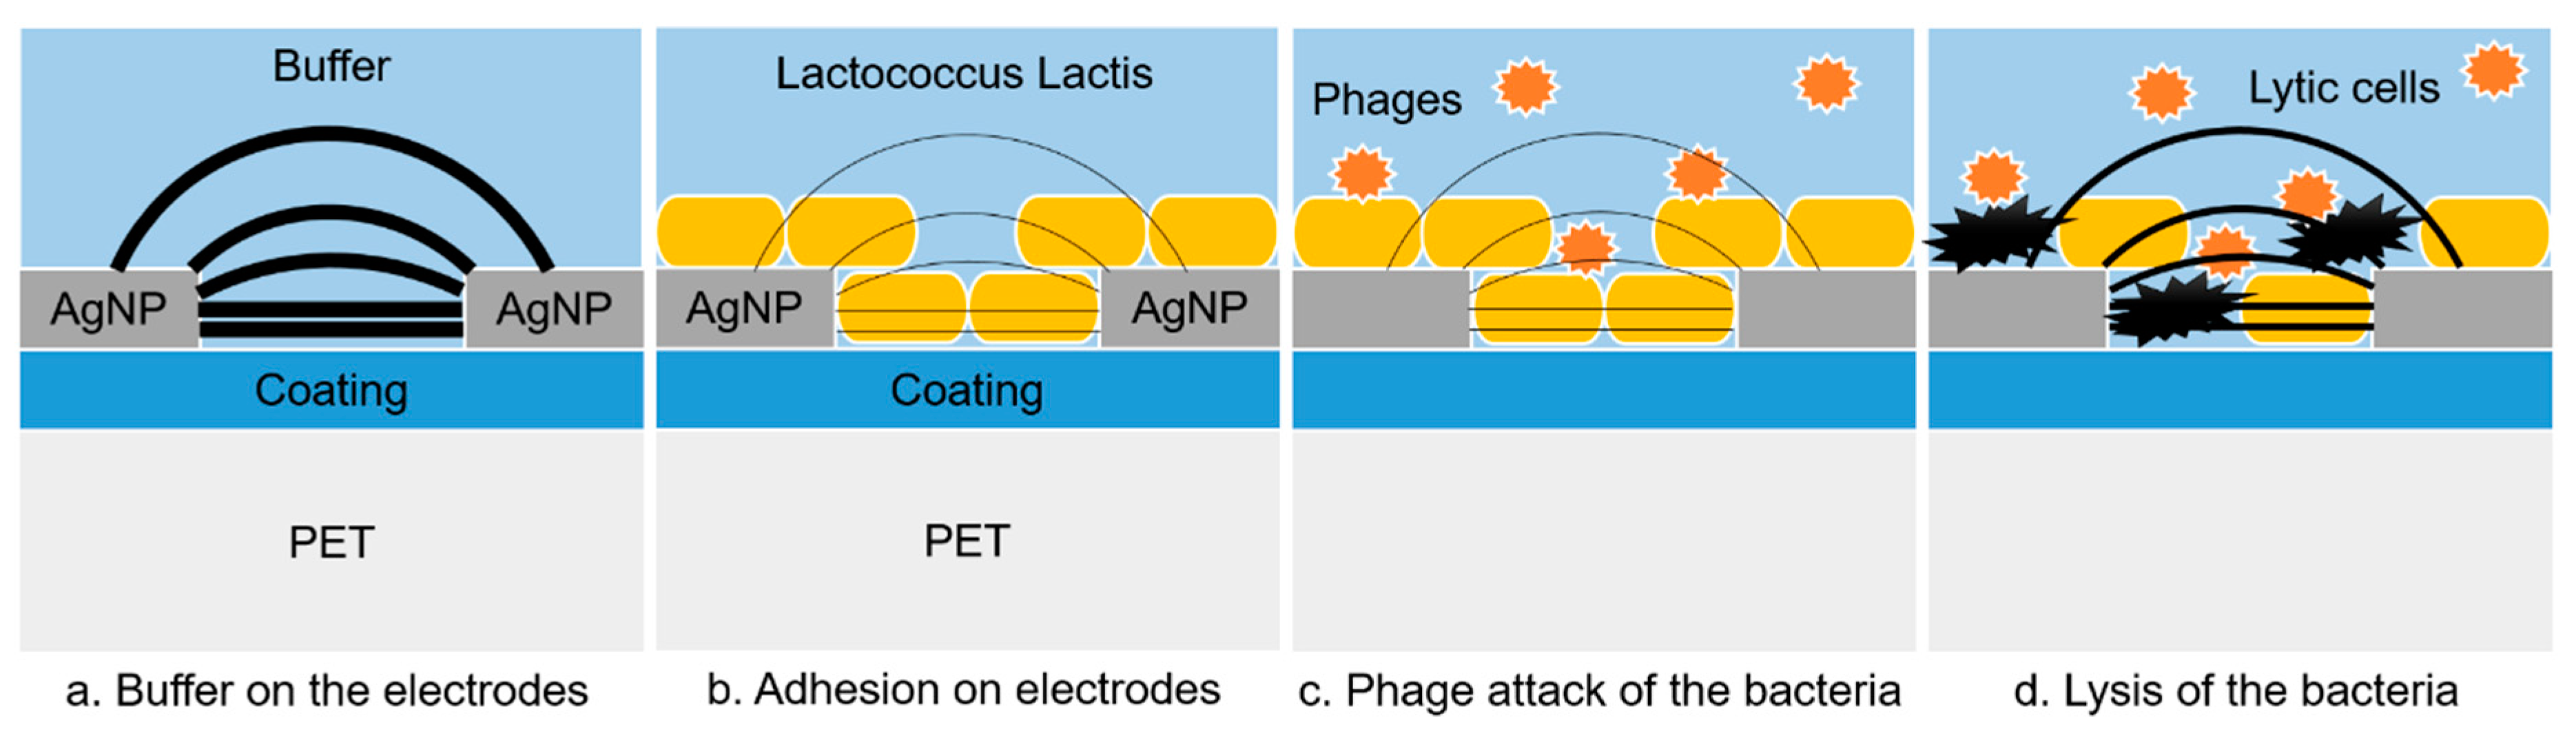
The EIS measurements performed on the IDEA and MEA systems were performed with a control and a test experiment, with a control and a test experiment. With the IDEA system, both the experiments were performed at the same time, using 4 wells each one. As depicted in
Figure 10, after an initial stabilization, we expected to see an increase of the impedance during the bacterial incubation, due to their overlap on and between the interdigitated electrodes. Conversely, during the phage infection we expected a decrease of the impedance due to the bacterial lysis, and thus to the increase of the current flowing between the electrodes.
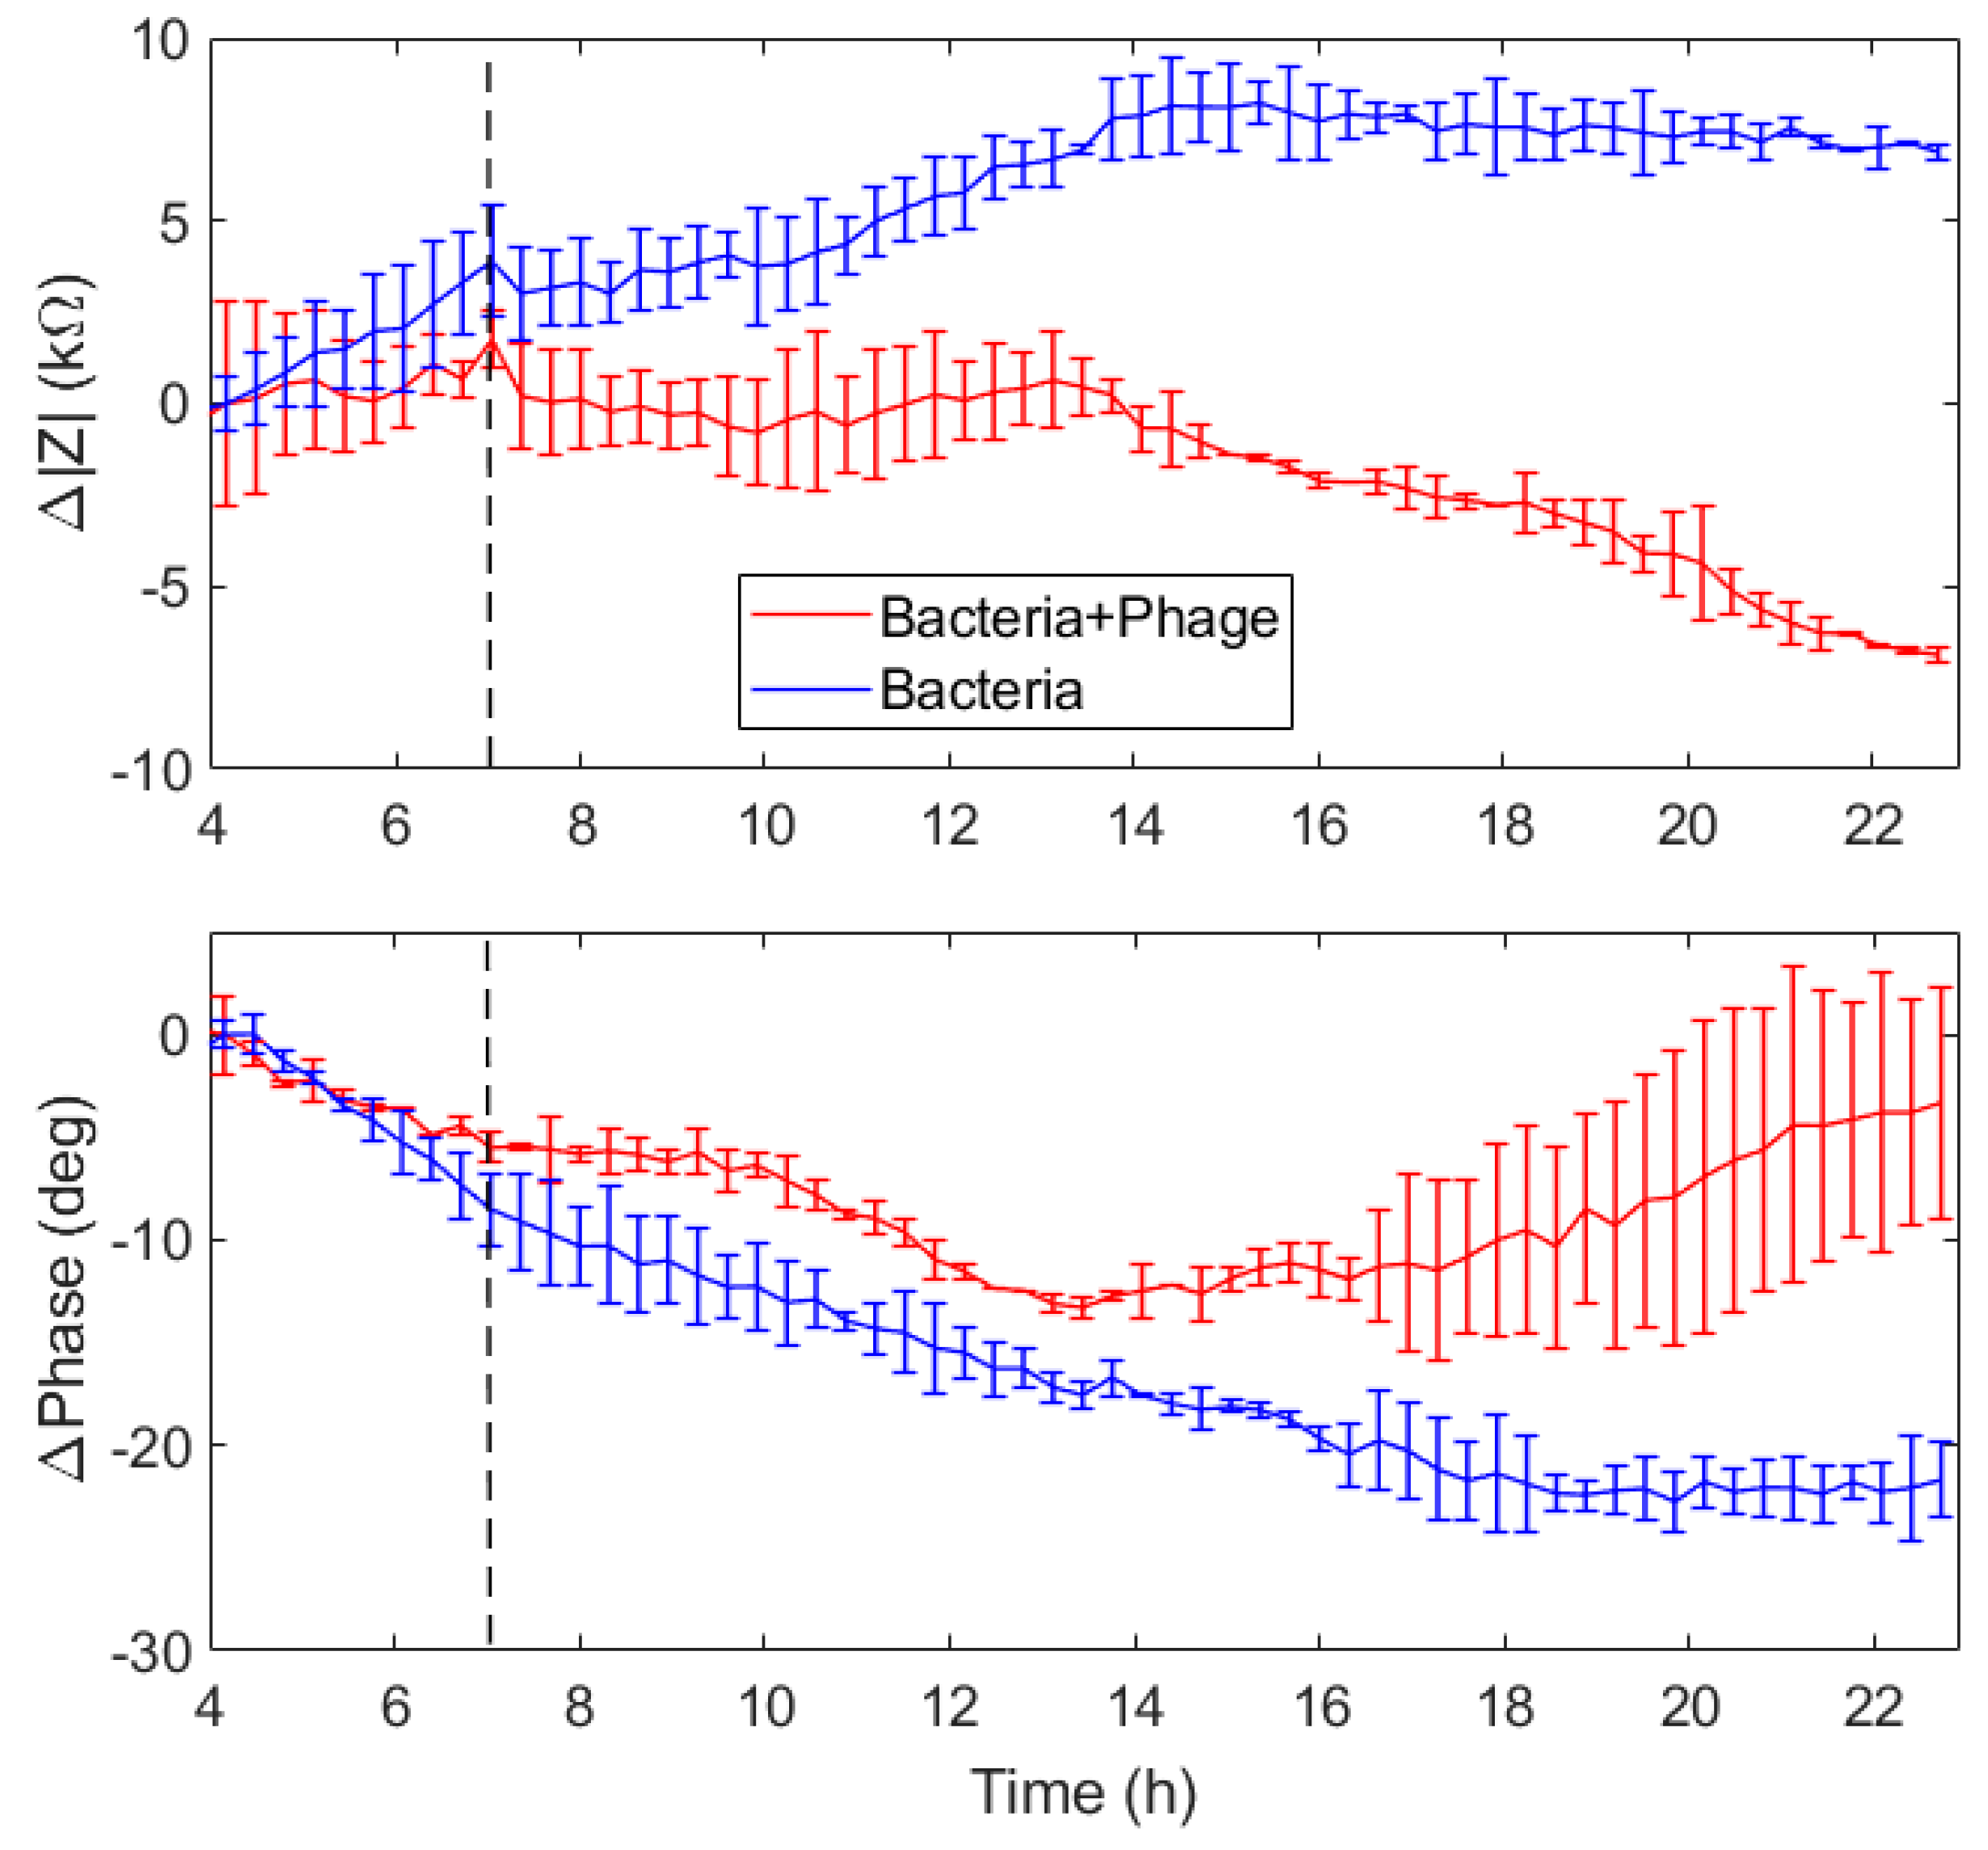
The impedance data were analyzed by two methods, i.e., impedance variation analysis at fixed frequency and equivalent modeling of the impedance data. First, we analyzed the 100 mHz impedance variations obtained within the test and control experiment with respect to the 4 h value, when the bacteria were inoculated in the wells, as described in Equation (1).
where Z
i(t) is the impedance measured at time t of the i well. The module and phase values of the impedance variations of the test and control experiments are depicted in
Figure 11.
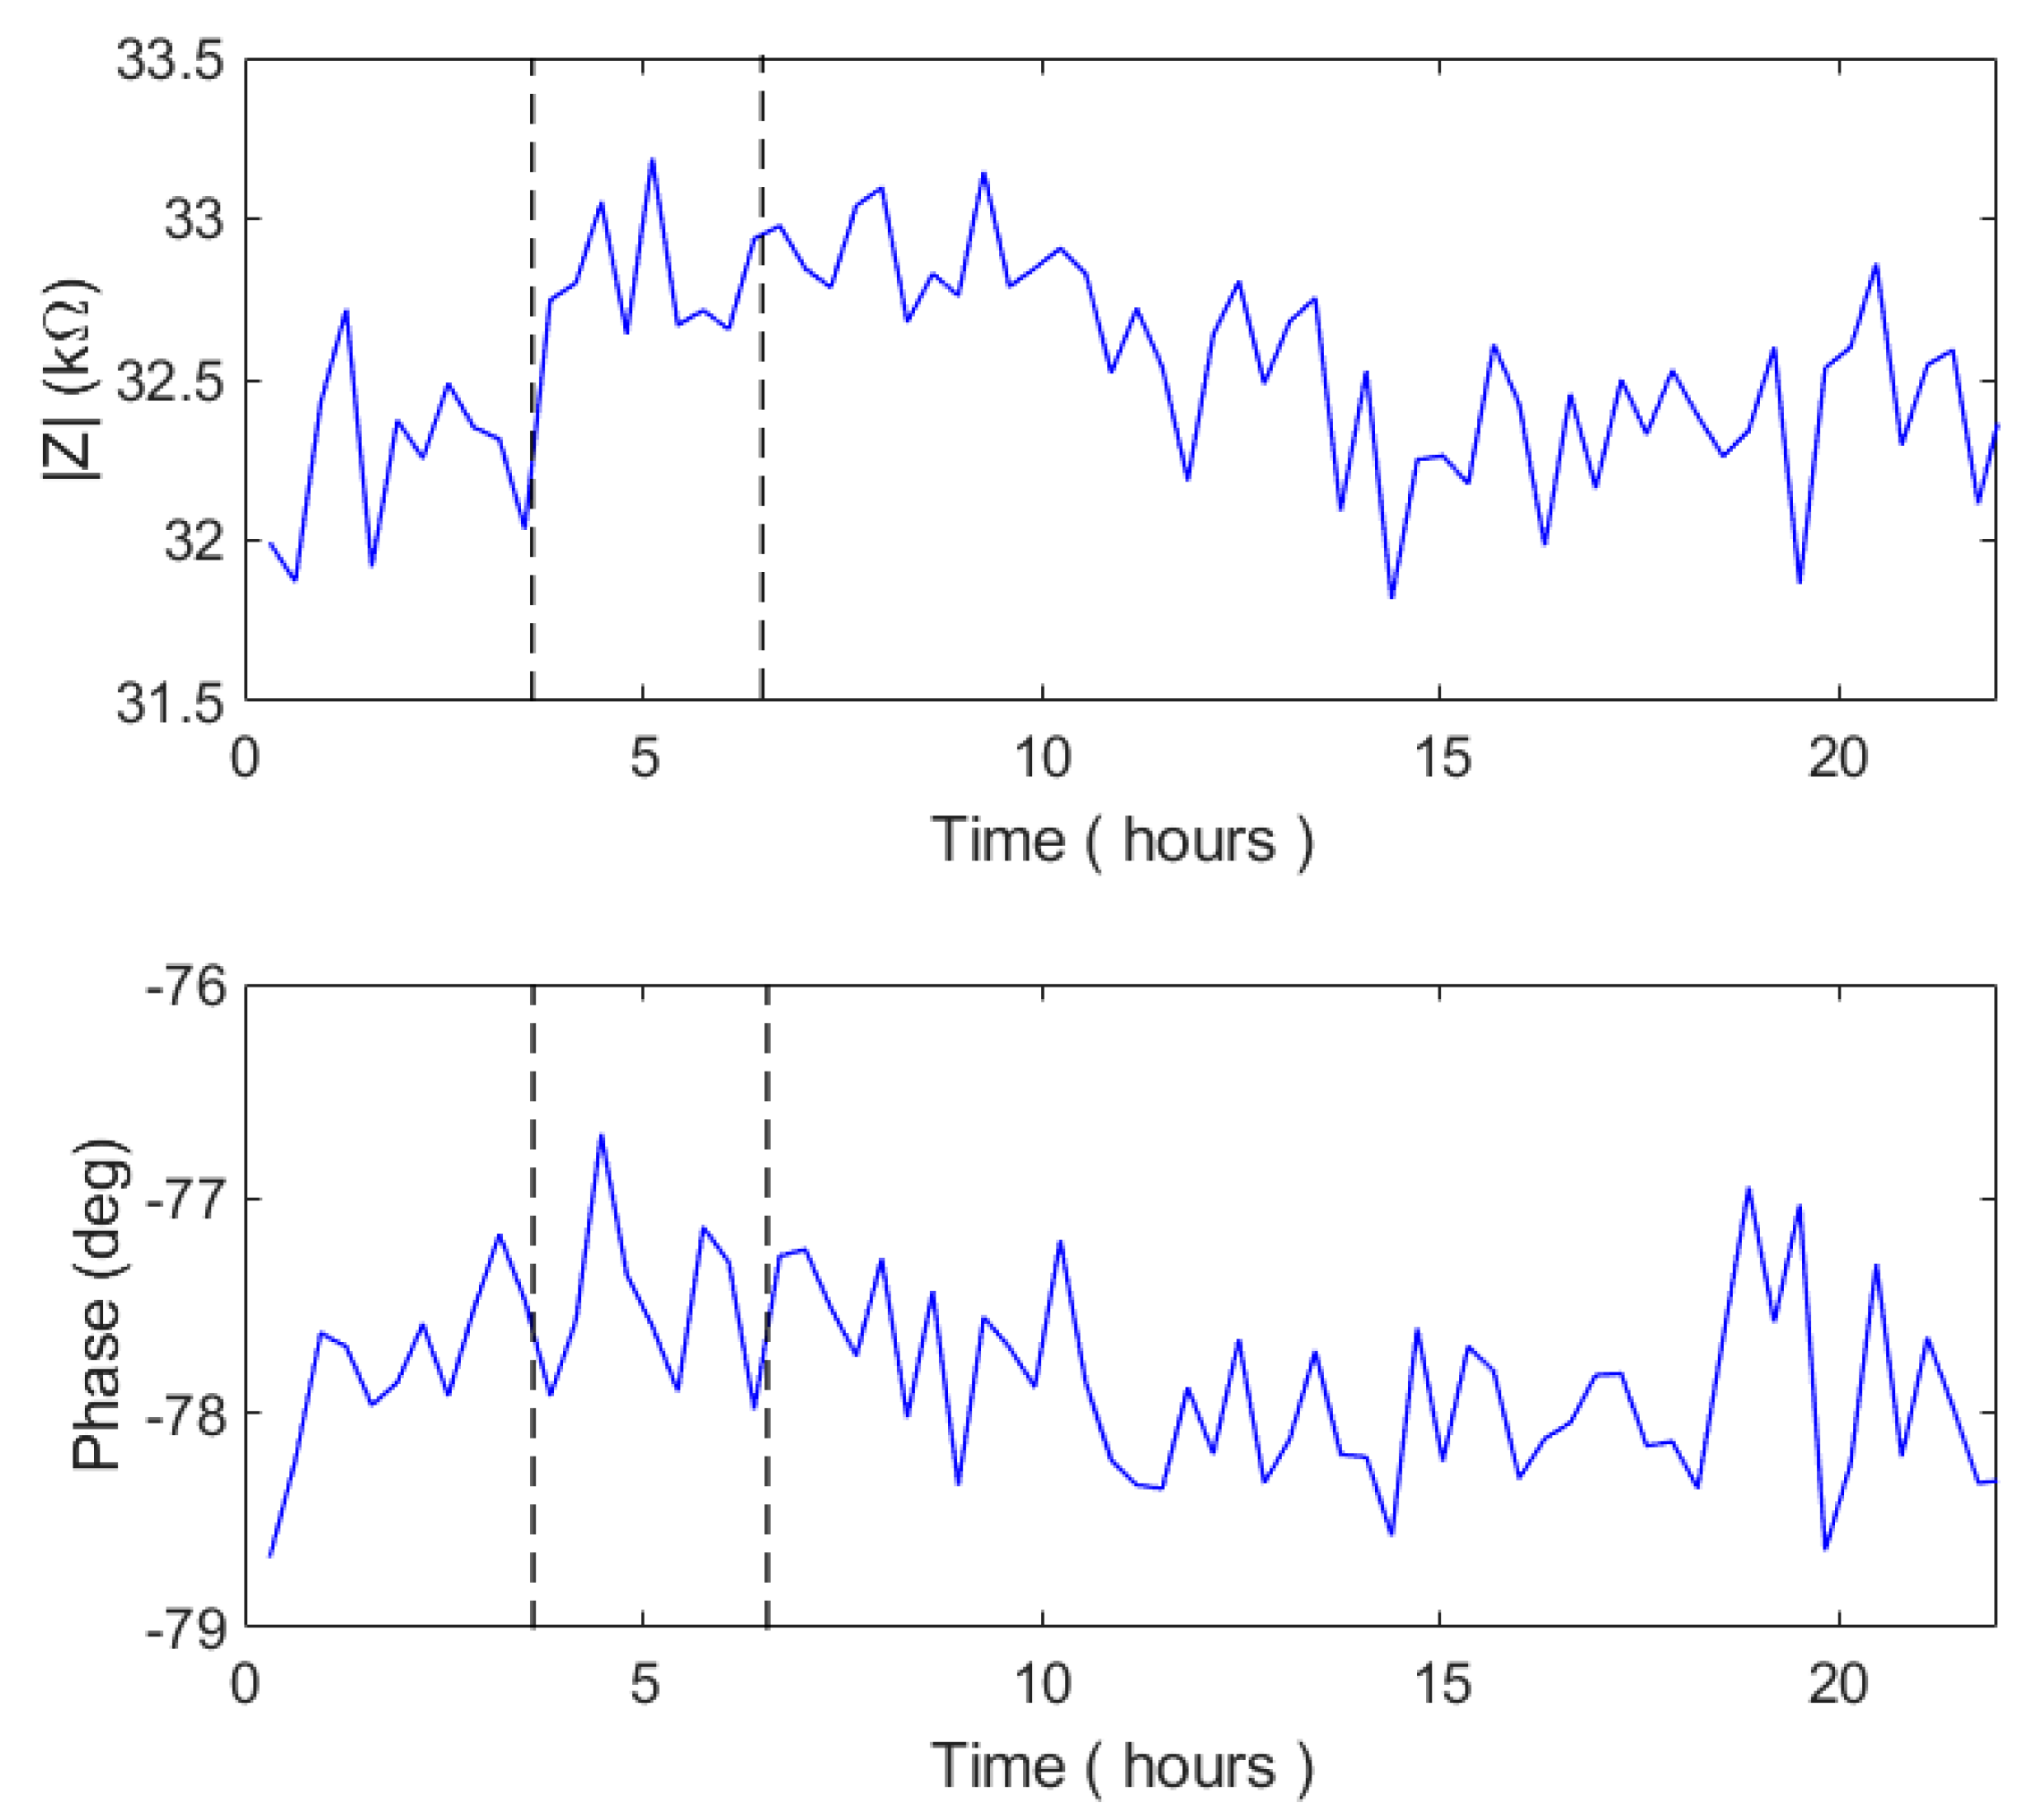
In
Figure 12, we show the impedance module and phase measured during the test experiment on the MEA system.
Before the phage inoculation, the impedance variation overlaps. Immediately after the phage inoculation, the impedance variations of the test experiments stopped growing, and after 7 h started decreasing. Conversely, the control experiment showed a constant increase before and after the buffer PBS inoculation, and a stabilization 7 h after the inoculation. These results are coherent with a desorption of material from the electrode surface, i.e., a decrease of the electrode coverage by the bacteria as an effect of the phage infection.
The 100 mHz impedance data obtained by the MEA system were affected by noise, and showed only slight variations during the entire experiment. In fact, the impedance module showed a slight increase after the bacterial inoculation, and a slow decrease 4 h after phage inoculation. The maximum decrease slope took place at 14 h. Conversely, the phase remained constant during the entire experiment.
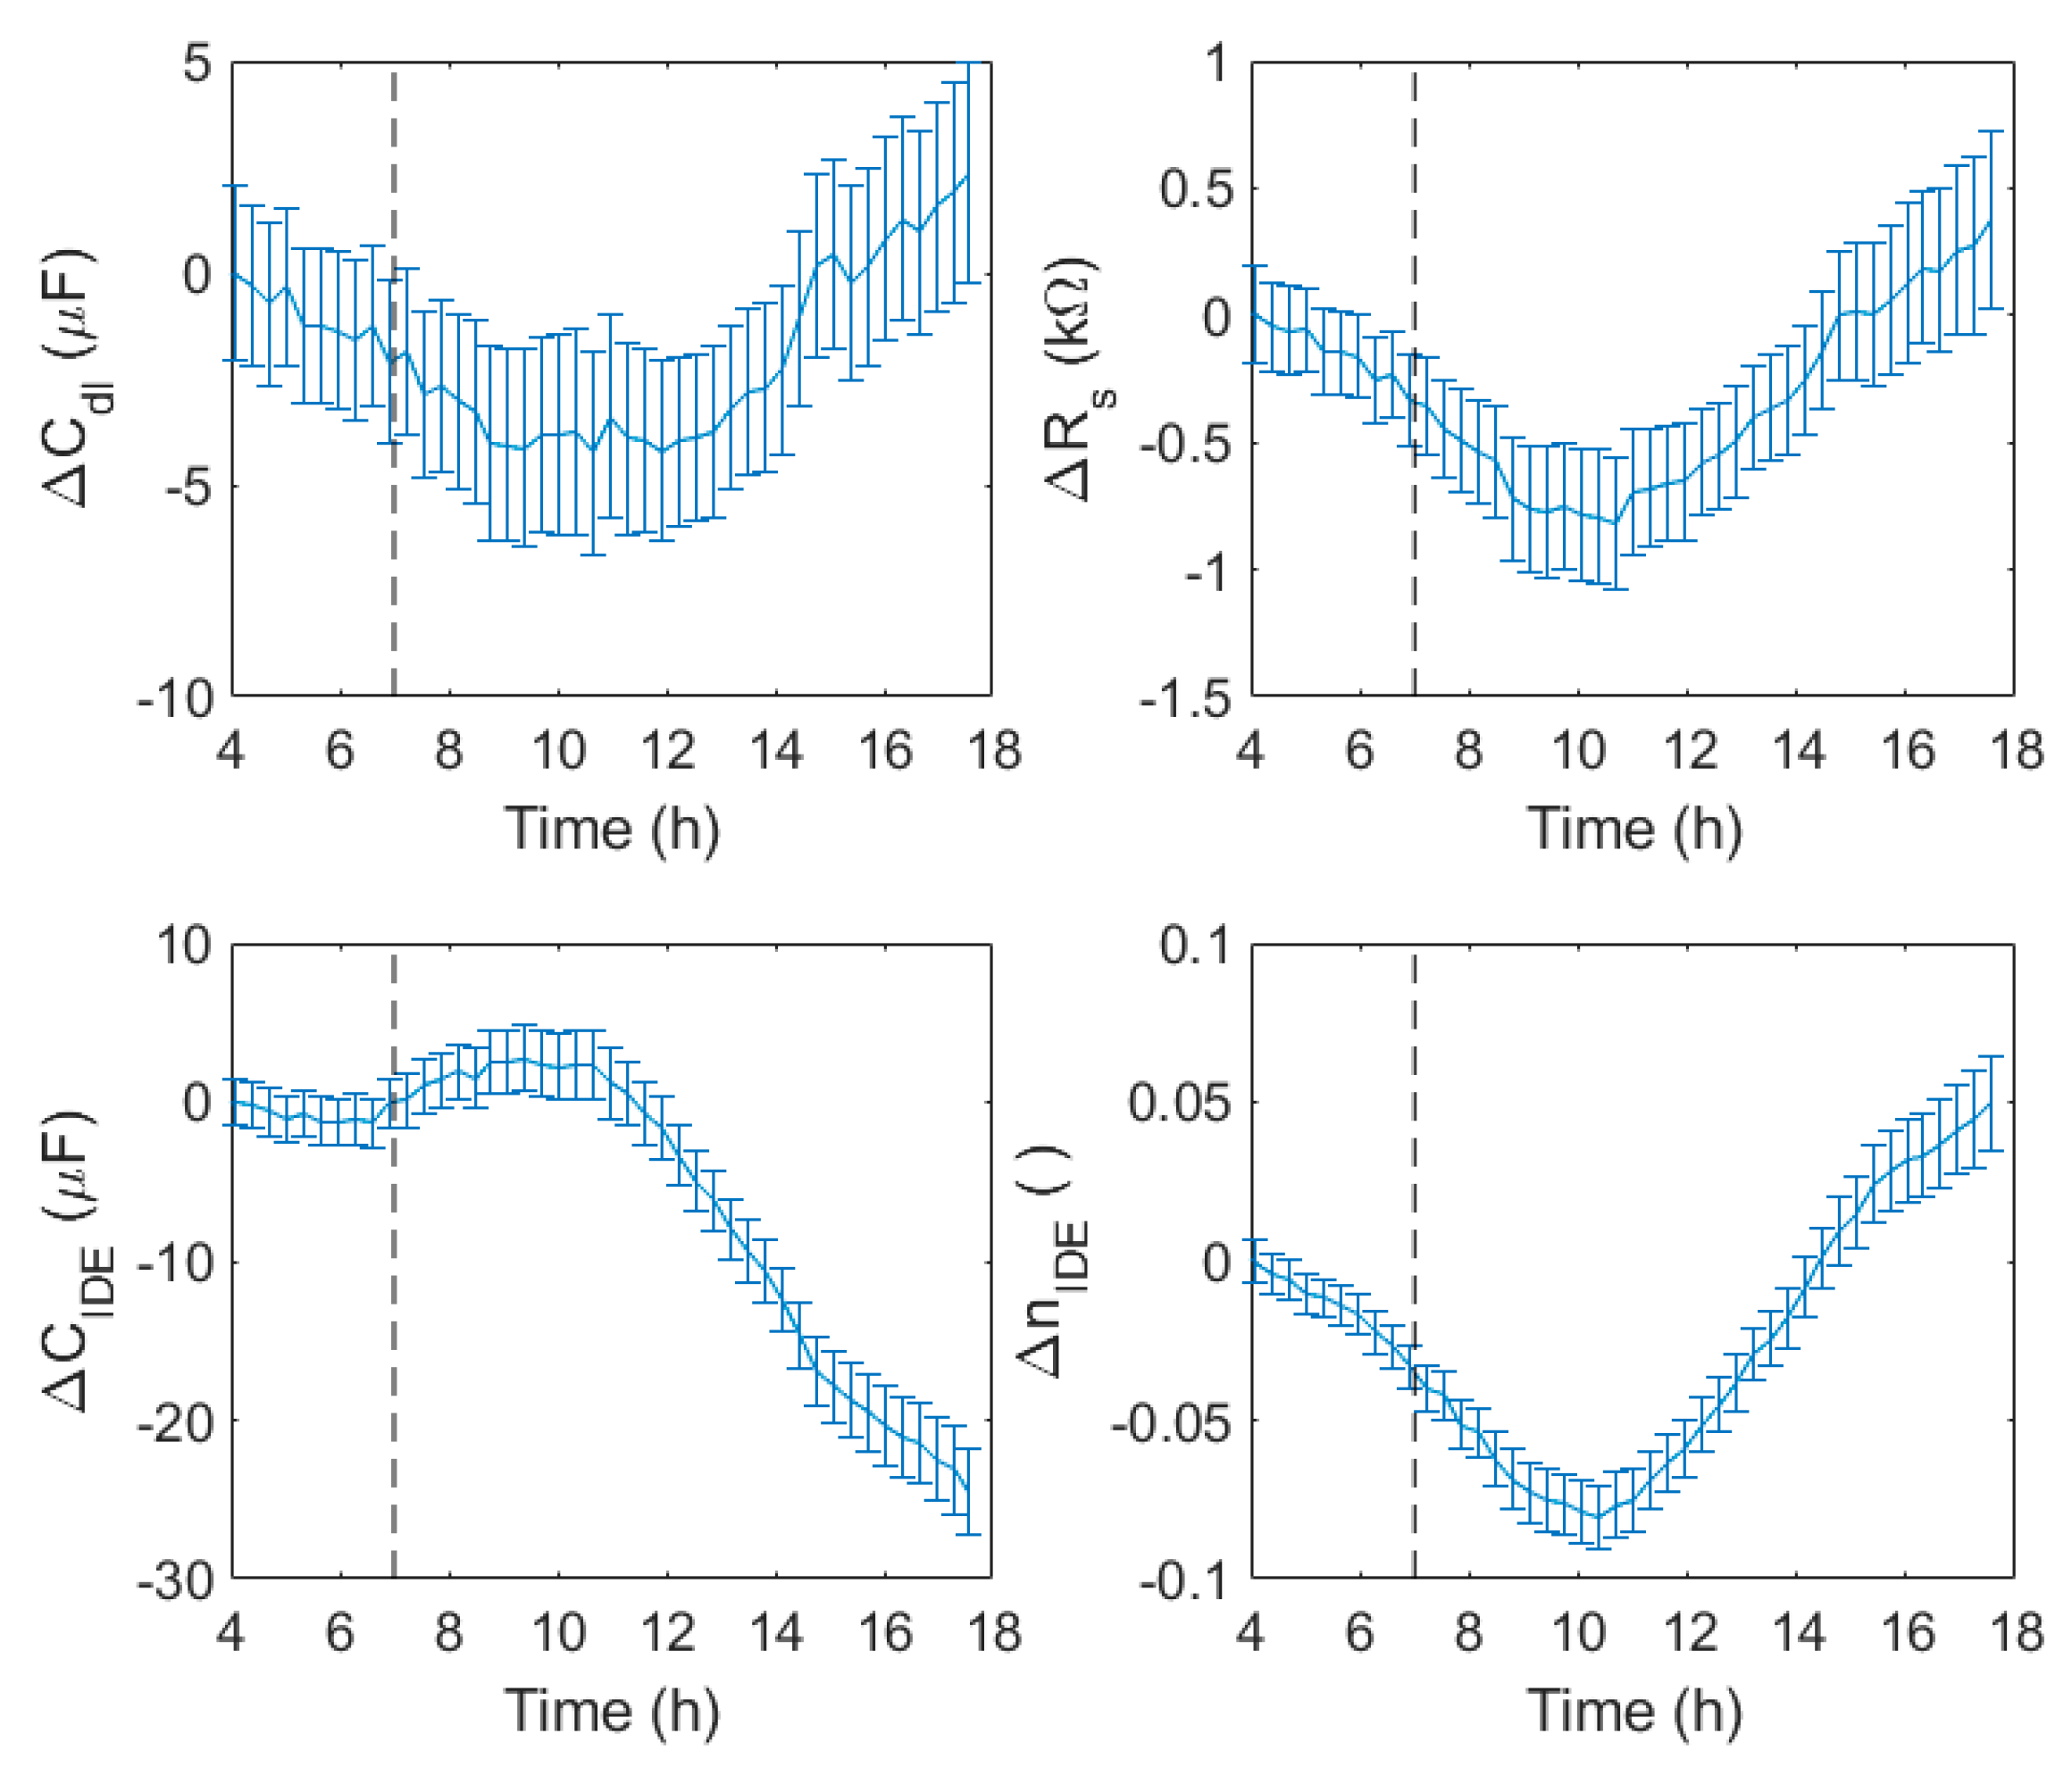
The impedance data obtained by the IDEA system were fitted by the model in
Figure 1c.
Figure 13 reports the variations of the
Cdl, Rs, CIDE, and
nIDE parameters of the model. The variations were calculated as for
Figure 11, obtaining the differences of the test and control well values, and subtracting the values at 4 h.
The double layer capacitance was stable before the phage inoculation, decreased right after, and increased again 7 h later. The solution resistance showed the same trend, with a total variation of less than 1 kΩ. Conversely, the IDE capacitance and its n value showed more important variations. The capacitance was characterized by an initial rapid increase, followed by a stabilization, and then an important decrease 3 h after the phage inoculation, with a change of more than 30 µF. The nIDE values initially decreased with a constant slope, but, 3 h after phage inoculation, the nIDE values rapidly increased.
The IDE capacitance and n values seemed to be very sensitive to the phage infection, and showed a response to it less than 3 h after phage inoculation. Referring to
Figure 10, the observed parameter variations were perfectly in accord with our model: the impedance module increased after bacterial inoculation was well represented by the decrease of
Cdl. Moreover, the presence of the bacteria between the IDE fingers increased the
CIDE value, because of the capacitance introduced by their membranes.
After the phage inoculation, the infection started, and the lytic process of the bacteria decreased the impedance overall, as shown by the Cdl increase, and drastically reduced the capacitance between the IDE fingers, as represented by the CIDE decrease.

 ,
, 
