1. Introduction
Fermentation is a catabolic process of incomplete oxidation, which does not require oxygen and whose final products are organic compounds, which, depending on factors such as the substrate, culture medium, and type of microorganism, can range from low molecular weight organic acids (acetic acid, lactic acid, butyric acid, etc.) to low molecular weight alcohols (propanol, methanol or ethanol) [
1,
2]. Many efforts have been devoted to the characterization and control of this type of bioprocesses, due to its economic importance for the production of vinegar, wines, and substances of interest such as lactic acid, among many others [
3,
4].
The ethanolic fermentation processes involve the transformation of sugars (mainly glucose, fructose, and sucrose) into ethanol and carbon dioxide. Although several types of microorganisms can drive fermentation processes, industrially, the yeast
Saccharomyces cerevisiae is the most used, because of its tolerance to relatively high concentrations of ethanol. The maximum concentration of ethanol produced in a classical fermentative process is around 12–14 % (
v/
v); over these concentrations, the ethanol acts as a “yeast inhibitor” [
2].
During fermentation, enzyme-mediated oxidation–reduction processes occur simultaneously, which enhances the use of electrochemical analysis techniques as a powerful tool for the characterization of fermentations and in particular of ethanolic fermentations [
3,
4,
5]. In particular, amperometric detection has been used as a tool for the quantification of molecules such as ethanol, glucose, and fructose, which are part of the ethanolic fermentation process. Usually, amperometric detection implies the use of enzymes as recognition elements thanks to the high selectivity that these macromolecules confer, and in addition to the possibility of monitoring molecules such as glucose or fructose, which are non-electroactive species [
3,
4,
5,
6].
From the electrochemical point of view, there are two stages of the reaction in which there is a net charge transfer between molecules. These stages involve the presence of NAD
+ an NADH (Nicotinamide adenine dinucleotide) either during the process of oxidation of glyceraldehyde-3-phosphate to 1,3-diphosphoglycerate (during glycolysis) or in the reduction of acetaldehyde to ethanol (in the final stage of fermentation) [
2,
7,
8].
The stages in which the NADH/NAD+ redox couple participates (glycolysis and fermentation) are the only ones that include an electron transfer process [
8,
9]. The net oxidation–reduction reaction for this redox couple is schematized as showed in Equation (1).
Due to the biological importance of the NADH/NAD+ redox couple, which participates as a cofactor in more than 300 enzymatic reactions, several studies have been conducted to understand its electrochemical behavior that is related to its biological activity [
10,
11,
12].
The oxidation of NADH occurs at relatively high overpotentials and involves the transfer of two electrons, one proton, and the formation of the NAD
+ species. NAD
+ reduction also occurs at high overpotentials and generates the NADH molecule again [
8,
9,
13]. The biological importance of this redox system means that, in addition to the study of electrochemical behavior, it is also of great interest for its application to the design of electrochemical biosensors that include the NADH molecule coupled to enzymatic systems, which allows the possibility of indirectly measuring many substrates of biological interest [
8,
14,
15]. Several studies have shown that the use of carbonaceous materials, as electrodes surfaces, facilitates the oxidation of NADH [
16,
17,
18,
19]. Different allotropes of carbon have been tested, such as graphite, vitreous carbon, and pyrolytic graphite, among others, obtaining good responses related to the overpotential decrease and the increase in the response current for the oxidation of NADH [
8]. Nanomaterials have received great attention in recent years in different fields, in particular in analytical chemistry, due to their enormous potential, thanks to their excellent unique optical, electrical, magnetic, catalytic, biological, or mechanical properties [
20,
21]. Indeed, nanostructured sensors allow improving the sensitivity and selectivity providing larger surface area and faster electron transfers in comparison with their bulk counterparts [
21,
22].
For these reasons, in the last years, several works have been reported on the carbon nanomaterials as electrode modifier, showing remarkable electrocatalytic properties towards several species of analytical interest [
22,
23,
24,
25], allowing the realization of a new electrochemical device [
26,
27,
28]. Among these materials, carbonaceous nanomaterials have been largely successfully exploited to realize NADH sensors, showing improved properties in term of selectivity, sensitivity, and catalytic activity [
15,
17,
19].
The catalytic property of the oxidized-multiwalled carbon nanotubes (O-MWCNT) via controlled microwave towards the NADH oxidation, has been recently demonstrated. In the proof of concept of sensor usability, the MWCNT-controlled oxidation has been optimized, obtaining superficial oxygenated groups able to facilitate the NADH’s deprotonation during the oxidative process [
19]. The achieved sensors designed with this material showed good reproducibility and repeatability. The possibility of quantifying glucose in white wine using a commercial enzymatic kit coupled to the designed sensor has been reported [
29].
The aim of this work was to demonstrate the utility of screen-printed electrodes modified with O-MWCNTs for monitoring glucose in a fast and easy way in an ethanolic fermentation real process.
2. Materials and Methods
2.1. Materials and Reagents
NADH, with a purity of 99.9 %, was acquired in Panreac® (Barcelona, Spain). The phosphate buffer (PBS) was prepared at a concentration of 0.01 mol·L−1 at pH 7.0 from potassium monobasic phosphate (KH2PO4, Sigma, St. Louis, MO, USA) and potassium dibasic phosphate (K2HPO4, Sigma); potassium chloride, (KCl, Merck, Darmstadt, Germany) 0.1 mol·L−1 was used as supporting electrolyte. Potassium hexacyanoferrate (II) trihydrate solution K3[Fe(CN)6] · 3H2O (Sigma, St. Louis, Missouri, USA) was prepared at a concentration of 1 × 10⁻³ mol·L−1 in 0.1 mol·L−1 KCl. Commercial sucrose (98 % purity), peptone (Merck, Darmstadt, Germany), and Saccharomyces cerevisiae were employed to carry out the fermentation. Other reagents used were methylene blue (Sigma, St. Louis, MO, USA), sodium chloride (Merck, Darmstadt, Germany), and ethanol (Merck, Darmstadt, Germany).
Screen printed electrodes (SPE) manufactured by DropSens
® (DS) (Llanera, Asturias, Spain) with a three-electrode configuration (geometric areas of 7.06 mm
2) were employed. Commercially available, multi-walled carbon nanotubes (MWCNTs, Nano-Lab, Waltham, Massachusetts, USA) were oxidized in a microwave-assisted acid medium for 15 min according to Blandón-Naranjo et al. [
15]. The oxidized nanotubes were denominated CNT15. All electrochemical measurements were performed with a prior nitrogen purge.
The electrochemical and spectrophotometric measurement of glucose was performed using the commercial enzyme kit for glucose GAHK-20 (Sigma, St. Louis, MO, USA), composed of NAD+ 1 mmol·L−1, ATP 1.0 mmol·L−1, hexokinase 1.0 U·mL−1, and glucose-6-phosphate dehydrogenase 1 U·mL−1. All reagents were dissolved in a buffer prepared with sodium benzoate and potassium sorbate at pH 7.8.
2.2. Screen Printed Electrode Modification and Characterization
Prior to the O-MWCNT modification of the SPEs, they were washed with Milli Q water and cycled 10 times in PBS (0.01 mol·L−1; KCl 0.1 mol L−1 at pH 7.0) using a potential window form −0.2 to 1.0 V at a scan rate of 0.1 V·s−1, to ensure a constant capacitive current. For the SPEs modification, an aqueous dispersion of O-MWCNT (1 mg·mL−1) was prepared with 2 h of stirring (DLAB, MS-H280-Pro) followed by 2 h of sonication. Ten microliters of the prepared dispersion (two additions of 5 μL) were drop cast upon the SPE’s surface and dried at room temperature. After immobilization, the modified electrode was cycled between −0.2 V and 1.0 V in PBS (0.01 mol·L−1; KCl 0.1 mol·L−1 at pH 7.0) until a constant capacitive current was obtained. The prepared electrode was named SPE/O-MWCNT. In addition, electrodes modified with non-oxidized MWCNT (SPE/MWCNT) were prepared in order to compare the electrochemical behavior of both systems.
Morphological and surface characterization of SPE, SPE/MWCNT, and SPE/O-MWCNT was carried out by Scanning Electron Microscopy (SEM) in a JEOL-JSM 6490LV (JEOL Ltd. Akishima, Tokyo, Japan) microscope using augments of ×10,000 and ×40,000.
The electrodes were characterized electrochemically by calculating the electroactive area and the heterogeneous transfer constant. The electroactive area was calculated by cyclic voltammetry at different scan rates (5, 10, 20, 40, 80, 100, and 200 mV·s
−1), calculating the slope obtained by plotting the square root of the scanning rate (
v1/2) vs. the anodic and cathodic peak current value (i
p), using a solution of Potassium hexacyanoferrate (II) 1 mmol·L
−1 in 0.1 KCl mol·L
−1 To determine the electroactive area, the Randles–Sevcik equation was used [
30]. The heterogeneous transfer constant (k
0) was calculated using the difference of the anodic and cathodic oxidation potentials obtained in the cyclic voltammetry experiments used to calculate the electroactive area, employing the method proposed by Nicholson [
31], and considering α = 0.5 (taking into account that the ratio between the anodic and cathodic peak currents (i
p,a/i
p,c) is close to 1). For each electrode, a voltammetric measurement (potential window 0.1–0.6 V, scan rate 10 mV·s
−1) of NADH 1 mmol·L
−1 was also carried out to verify the oxidation potential and the current response.
2.3. Ethanolic Fermentation
The ethanolic fermentation was carried out using a destructive sampling methodology. Eight parallel experiments were prepared with the objective of taking each one as a specific point of measurement in a determined time. For each experiment, a culture medium composed of sucrose 25% (m/v) and peptone 1% (m/v) as sources of carbohydrates and nitrogen, respectively, was used. The medium was sterilized and inoculated with 10 g·L−1 of commercial Saccharomyces cerevisiae that was “activated” at 37 °C for 10 min. The selected times to carry out the fermentation monitoring were: 0, 3, 5, 7, 24, 26, and 30 h. For each time, total soluble solids (TSS), pH, cell viability, and ethanol concentration were measured.
The pH of the samples was determined immediately after each fermentation time, using an Orion SA720 pH-meter (Waltham, Massachusetts, USA) directly on the “fermentation broth”.
TSS were measured in a Brixco Instruments refractometer. The “fermentation broth” was previously centrifuged at 6000 rpm for 5 min and then filtered through a cellulose filter paper (pore size 0.2 μm), the results have been expressed as °Brix, which is understood as grams of soluble solids per 100 g of solution (g·100 g−1).
For viability, 10 mL of “fermentation broth” was centrifuged at 6000 rpm for 5 min, the supernatant was discarded and 5 mL of PBS was used to resuspend the yeast “pellet”. The obtained yeast solution was then centrifuged again at 6000 rpm for 5 min and the supernatant was discarded again. The yeast was finally resuspended in 5 mL of NaCl 0.9 mol·L−1. The yeast viability was evaluated mixing 0.5 mL of the yeast suspension with 0.5 mL of methylene blue. The yeast viability evaluation was performed with an optical microscope. The results are expressed as percent of stained cells.
The percentage of ethanol was measured by Gas chromatography (Hewlett Packard, Santa Clara, California, USA), using the supernatant obtained in Step 1 in
Section 2.1. The sample was previously filtered through a cellulose filter (pore size of 0.2 μm). The results have been expressed in mL of ethanol per 100 mL of solution. (mL·100 mL
−1).
2.4. Electrochemical Measurements: Cyclic Voltammetry and Chronoamperometry
All electrochemical measurements were carried out in a PGSTAT 101 potentiostat/galvanostat (Autolab, Utrecht, the Netherlands) with NOVA 1.11 software. All the potentials referred in the results correspond to the difference of the working electrode vs. the silver reference pseudo-electrode, which has a difference of +100 mV with respect to an Ag|AgCl|KCl reference electrode.
Cyclic voltammetry was used to verify the electrochemical behavior of all the components in the sample and check the possibility of interferences for the quantification step. All cyclic voltammetry experiments were carried out between +0.1 and +0.9 V at a scan rate of 10 mV·s−1.
The electrochemical quantification of glucose was carried by chronoamperometry, according to a procedure previously reported by Blandón-Naranjo [
19], with some modifications to adapt the methodology to the commercial kit employed [
32].
Chronoamperometry was used in a 2 mL cell with constant stirring. To account for the matrix effect, the calibration curves were constructed in the fermentation broth. To this aim, 10 μL of doped yeast culture medium with different concentrations of glucose (5, 10, 50, 75, 100, 150, and 200 mg·L−1) were added to 90 μL of the commercial glucose-kit mixture. Then, it was incubated for 15 min at 30 °C in accordance with the kit supplier guidance, mixing 100 μL of the commercial glucose-kit mixture with 1.9 mL of phosphate buffer. A potential difference of 0.3 V was applied and the current was recorded at 1 min (time needed to reach the steady state) and the corresponding calibration curve was made.
To monitor the fermentation, samples were taken at different times. The samples were diluted 1:10 in PBS (0.01 mol·L−1; KCl 0.1 mol·L−1 at pH 7.0), and then 10 µL of the diluted samples were mixed with 90 µL of the commercial glucose kit. Then, the mixture was incubated for 15 min at 30 °C, and subsequently added to 1.9 mL of phosphate buffer and measured.
All measurements were performed using SPE/O-MWCNT, and each point of the curve was carried out with a different electrode (even for monitoring the fermentation).
3. Results and Discussions
3.1. Sensor Characterization
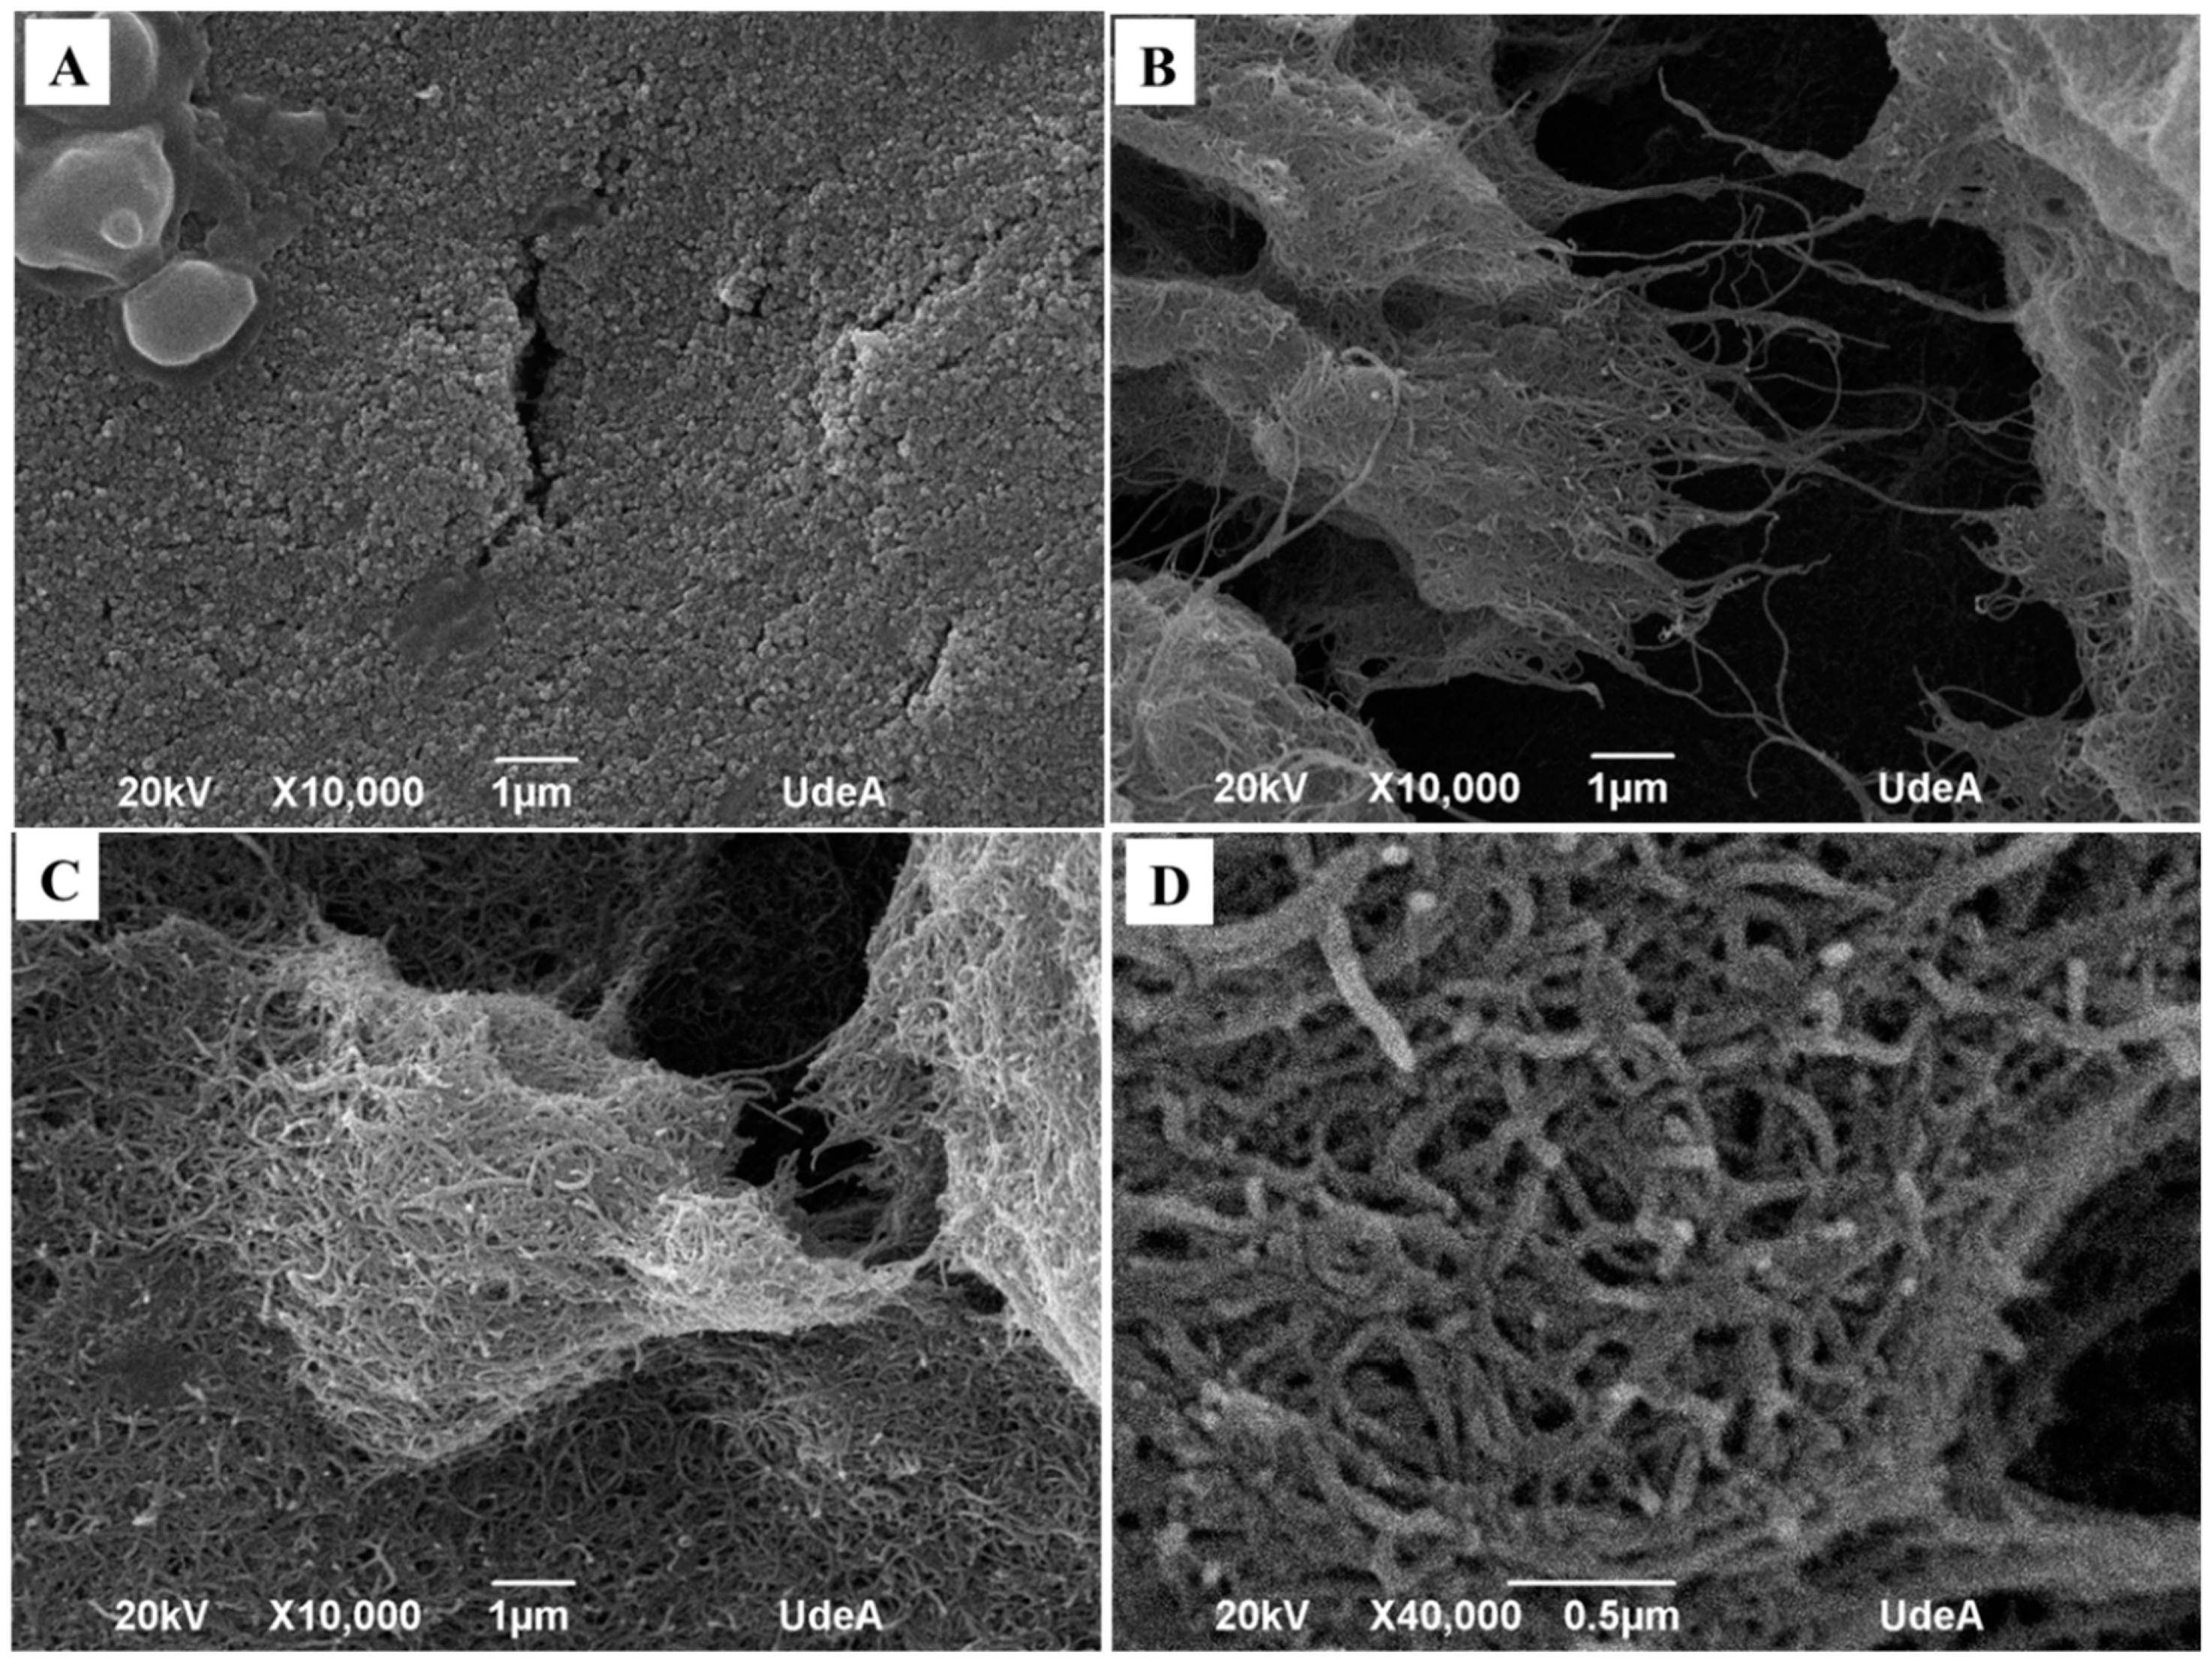
To verify the morphology of the sensor surface, SEM micrographs were taken for the unmodified SPE, an SPE modified with MWCNT before surface oxidation and after the microwave oxidation. The images are shown in
Figure 1.
Figure 1A shows the unmodified electrode, in which a rugose surface can be seen which is common in this kind of electrodes.
Figure 1B shows the surface of the electrode covered by non-oxidized MWCNT. It must be noted that, although carbon nanotubes were observed, the surface was not regular and agglomerates were formed. On the other hand, when O-MWCNT were deposited over the surface of SPE, well-dispersed clusters of nanotubes were observed and the uncoated areas decreased significantly. This is confirmed in
Figure 1D with higher magnification. A well covered dispersed O-MWCNT was observed. The effect of the well-organized surface over the SPE for the NADH oxidation is discussed in a previous work [
19], in which it is reported that the presence of oxygenated groups facilitates the dispersion of the material in water and, then, it improves the material dispersion when a drop is coated over the surface of SPE.
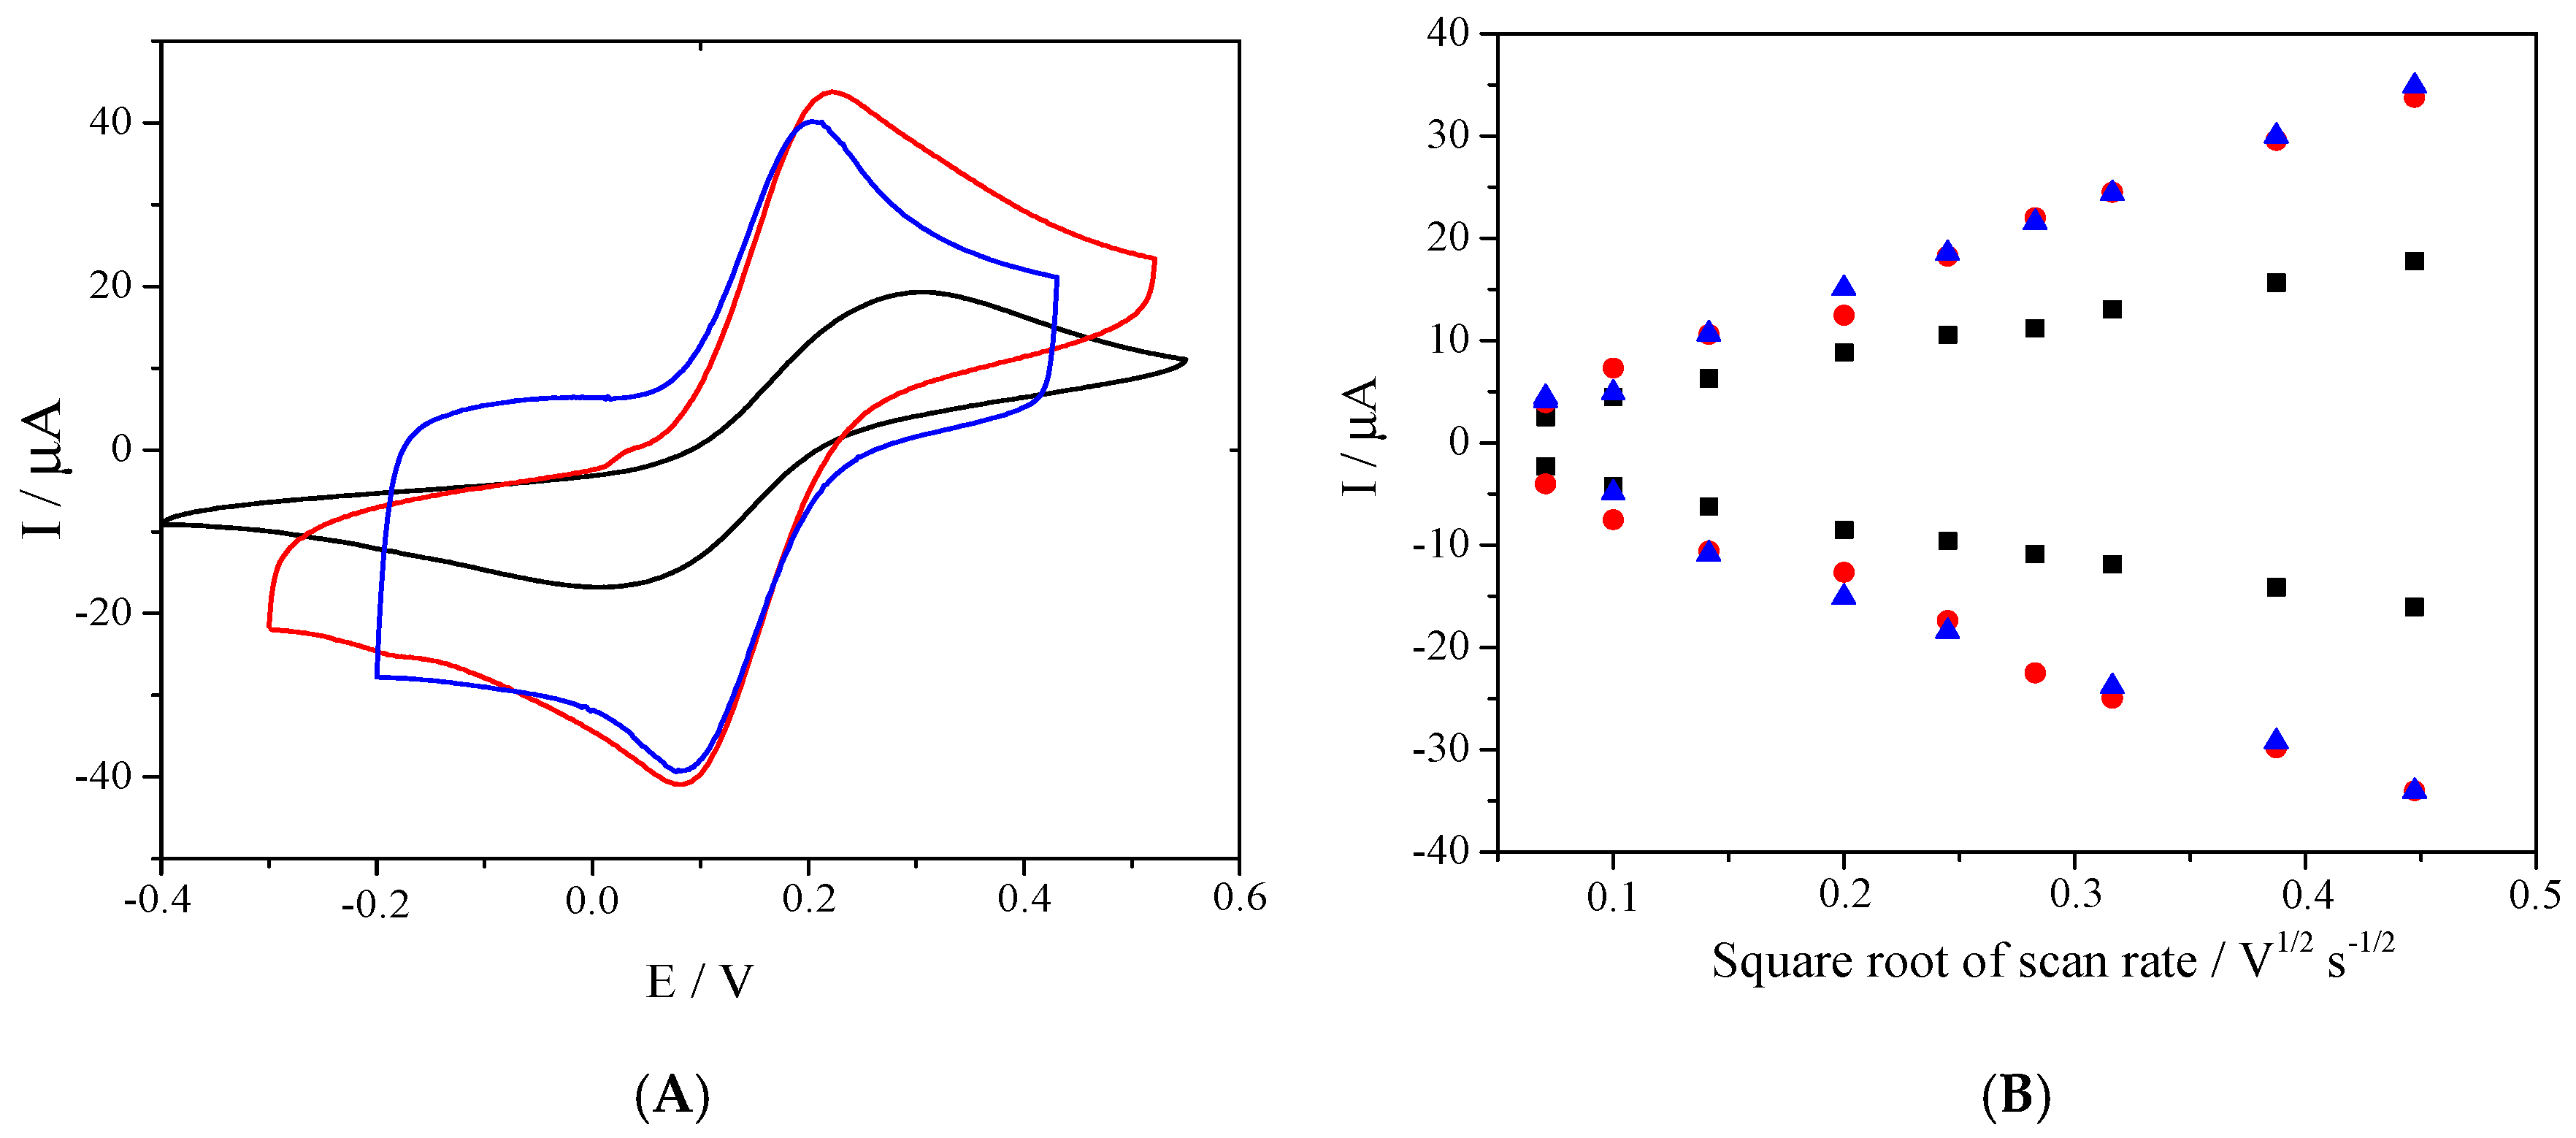
Figure 2 shows the voltammetric studies carried out in a Potassium hexacyanoferrate (II) solution as a redox reference system. In
Figure 2A, the comparison of the three electrodes at the same scan rate is shown. It can be noted that, when the electrode was covered by carbon nanotubes (oxidized and non-oxidized), the current peak increased considerably due to the augment in the electroactive area improved by the carbon nanomaterial. In addition, the difference between the oxidation and reduction potential of peaks decreased, which was related to the augment in the heterogeneous constant transfer according to Nicholson proposal [
31]. Based on the Randles–Sevcik equation, if the redox process were controlled by diffusion, a linear relationship between the oxidation and reduction currents, as well as the square root of scan rate, would be obtained.
Figure 2B shows the behavior of the relationship previously described. A significant augment in the slope of the graphs for SPE/MWCNT and SPE/O-MWCNT was observed, which was related with the augment in the electroactive area of the material, covered by the nanomaterial immobilized in the surface of SPE. On the other hand, there was no important difference between the slope of SPE/MWCNT and SPE/O-MWCNT as the oxygenated surface did not significantly improve the electroactive area. This agrees with previously obtained results [
15,
19].
To verify the SPE/O-MWCNT modification reproducibility, the electroactive area (A) and k0 were calculated from the obtained voltammograms at different scan rates using the redox couple K3[Fe(CN)6]/K4[Fe(CN)6] as a reference system. Measurements were carried out for 20 different modified electrodes, in which the RSDs of the A and k0 obtained were 3.95 % and 15.3 %, respectively, showing an acceptable reproducibility inter-electrode. Furthermore, both A and k0 values resulted significantly increased compared to the bare electrode. Indeed, the average (n = 20) area obtained was 10.14 mm2 ± 0.40, while k0 was 0.021 cm2·s−1 ± 0.003. All results shown below are reported in terms of the mean electroactive area obtained.
3.2. Verification of the Concept
Previously [
19], we reported the possibility of quantifying glucose based on the use of a commercial glucose quantification kit [
29] that measures the production of NADH after a series of enzymatic reactions described below in Equations (2) and (3).
In the first step, glucose is converted to glucose-6-phosphate (G6P) by the enzymatic action of hexokinase, present in the commercial kit. In the second step, G6P is oxidized to D-glucono-d-lactone-6-phosphate through an enzymatic reaction where glucose-6-phosphate dehydrogenase (G6P-DH) participates and NAD+ acts as a cofactor of the reaction and is reduced to form NADH.
The commercial kit relates the absorption of NADH at 340 nm with the concentration of glucose, accounting for the stoichiometrically relation between both molecules. The modification proposed here implies the electrochemical detection and quantification of the NADH produced in the second stage (Equation (3)).
Afterwards, with the aim to verify the possible culture media matrix interferers, cyclic voltammetric measurements were performed in NADH free fermentative broth and with the addition of different concentrations of NADH. The obtained voltammograms are presented in
Figure 3A. Culture broth (red curve, formed by glucose 25 % and peptone 1 %) showed an oxidation peak around +0.6 V. The signal obtained was attributable to the peptone. Indeed, it is reported that glucose at this potential and with this kind of electrode is not able to give an electrochemical response [
33]. On the other hand, the voltammogram corresponding to the culture medium with an addition of NADH (blue curve) showed the presence of two signals. The first was at 0.3 V and attributable to the oxidation of NADH, as confirmed with the voltammogram corresponding to the NADH standard in PBS solution (black dashed curve). Instead, the second signal corresponding to peptone appeared in around 0.6 V, separated approximately by 0.3 V from NADH peak, thus it can be concluded that there was no interference between the electrochemical responses of electroactive species present in the culture broth. Because, during fermentation, one of the main components of the medium is yeast, cyclic voltammetry of
Saccharomyces cerevisiae was also performed at the initial concentration at which the culture medium was prepared prior to fermentation (10 g·L
−1). It was observed that the capacitive current for the yeast was significantly higher than that of the other components evaluated, probably due to its high concentration in the medium. In addition, an oxidation peak was observed at approximately 0.8 V, as reported previously [
34,
35]. This signal was not identified but it did not interfere with the signal presented by NADH. It is clear that, to evaluate the presence of interferers during fermentation, a much more exhaustive characterization is necessary taking into account the complexity of the matrix; however, in these voltammograms, it was found that none of the components of the fermentation interfered with the signal of NADH, at least while this biochemical process was not taking place.
It has been widely reported that NADH’s oxidation peak potential, using unmodified graphite SPEs, shows oxidation values close to 0.6 V [
16,
19,
36]. Thus, O-MWNCT, used for SPE modifications, significantly decreased the NADH overpotential required to the oxidation of NADH. This behavior, particularly in this case, allowed selectively monitoring the NADH in the presence of other electroactive substances present in the matrix such as peptone.
To verify if the commercial glucose kit modified the NADH’s oxidation potential or interfered with its measurement, cyclic voltammograms of the kit, the kit with the addition of NADH, and of an NADH standard solution were also carried out.
Figure 3 shows the obtained voltammograms. It was found that the kit (red line) showed an oxidation signal at 0.3 V, which could be attributed to NADH produced from the balance with NAD
+ that is present in the mixture. This was confirmed by the NADH fortification (blue line), in which the signal increased. In addition, in this case, when this signal was compared with the NADH standard in PBS (dashed line), it could be confirmed that the oxidation potential is the same.
3.3. Electrochemical Glucose Quantification Using Chronoamperometry
Considering the CV results (
Figure 3A,B), a potential of 0.3 V was selected for the chronoamperometric quantification of glucose. Firstly, the peptone and glucose un-reactivity was evaluated, and no electrochemical response was obtained at 0.3 V (data not shown).
Figure 4A shows that stationary current was obtained from 100 s of chronoamperometric polarization. It is clear that the current increased as a function of glucose concentration. This agrees with the expected behavior for the current at a planar electrode and governed by the Cottrell equation [
37].
The calibration curve (
Figure 4B) was constructed from the average of the measured currents between 100 and 200 s. Each point obtained for the different concentrations was subtracted from the average current obtained for the background. It can be seen that the curve showed good linearity (R
2 = 0.9931), and a linear range between 5 mg L
−1 and 200 mg·L
−1. Limit of detection (LOD) and limit of quantification (LOQ) were calculated using the equations: LOD = (3SD
B/m
cc) and LOQ = (10SD
B/m
cc), where SD
B is the standard deviation of the blank and m
cc is the slope of the linear calibration curve obtained for both equations [
38]. The obtained LOD and LOQ were 16.2 mg·L
−1 and 54.1 mg·L
−1, respectively.
Comparing the obtained analytical performance with the spectrophotometric method employed to read the glucose kit response, the sensitivity increased and the linear range covered two orders of magnitude as well as the glucose kit (50–5000 mg·L
−1) [
32]. Thus, the obtained LOD allows detecting, through the electrochemical process proposed, the presence of glucose in a fermentation process in a very sensitive way without optical interferers (naturally present in the fermentation broth).
3.4. Ethanolic Fermentation Kinetics Monitoring and Glucose Evaluation Using the Proposed Strategy
To prove the exploitability of glucose assessment using the proposed SPE/O-MWCNT-based strategy, a lab-scale fermentation was carried out. Conventional fermentation parameters as well as the decrease of glucose, using the proposed sensor, were monitored at different fermentation times.
Table 1 shows the results obtained.
Table 1 shows a constant decreasing, during the fermentation, of the parameters pH, TSS, and vitality, while the percentage of ethanol increased. The pH decrease was related to the consumption of nitrogen since for each mole of assimilable nitrogen that was consumed (in the form of ammonium or as an amino acid) a proton was released into the medium [
2,
39]. At the same time, secondary metabolites, including organic acids, increased and accumulated [
2,
6].
At the same time, the TSS value, related to dissolved sugars, decreased because yeasts metabolized these sugars to produce ethanol [
2,
6,
7], which, as shown in
Table 1, increased as a function of time. Furthermore, as expected, the yeasts cell viability decreased during the fermentation time because of metabolism inhibition related both to the increasing ethanol concentration and adverse pH [
2].
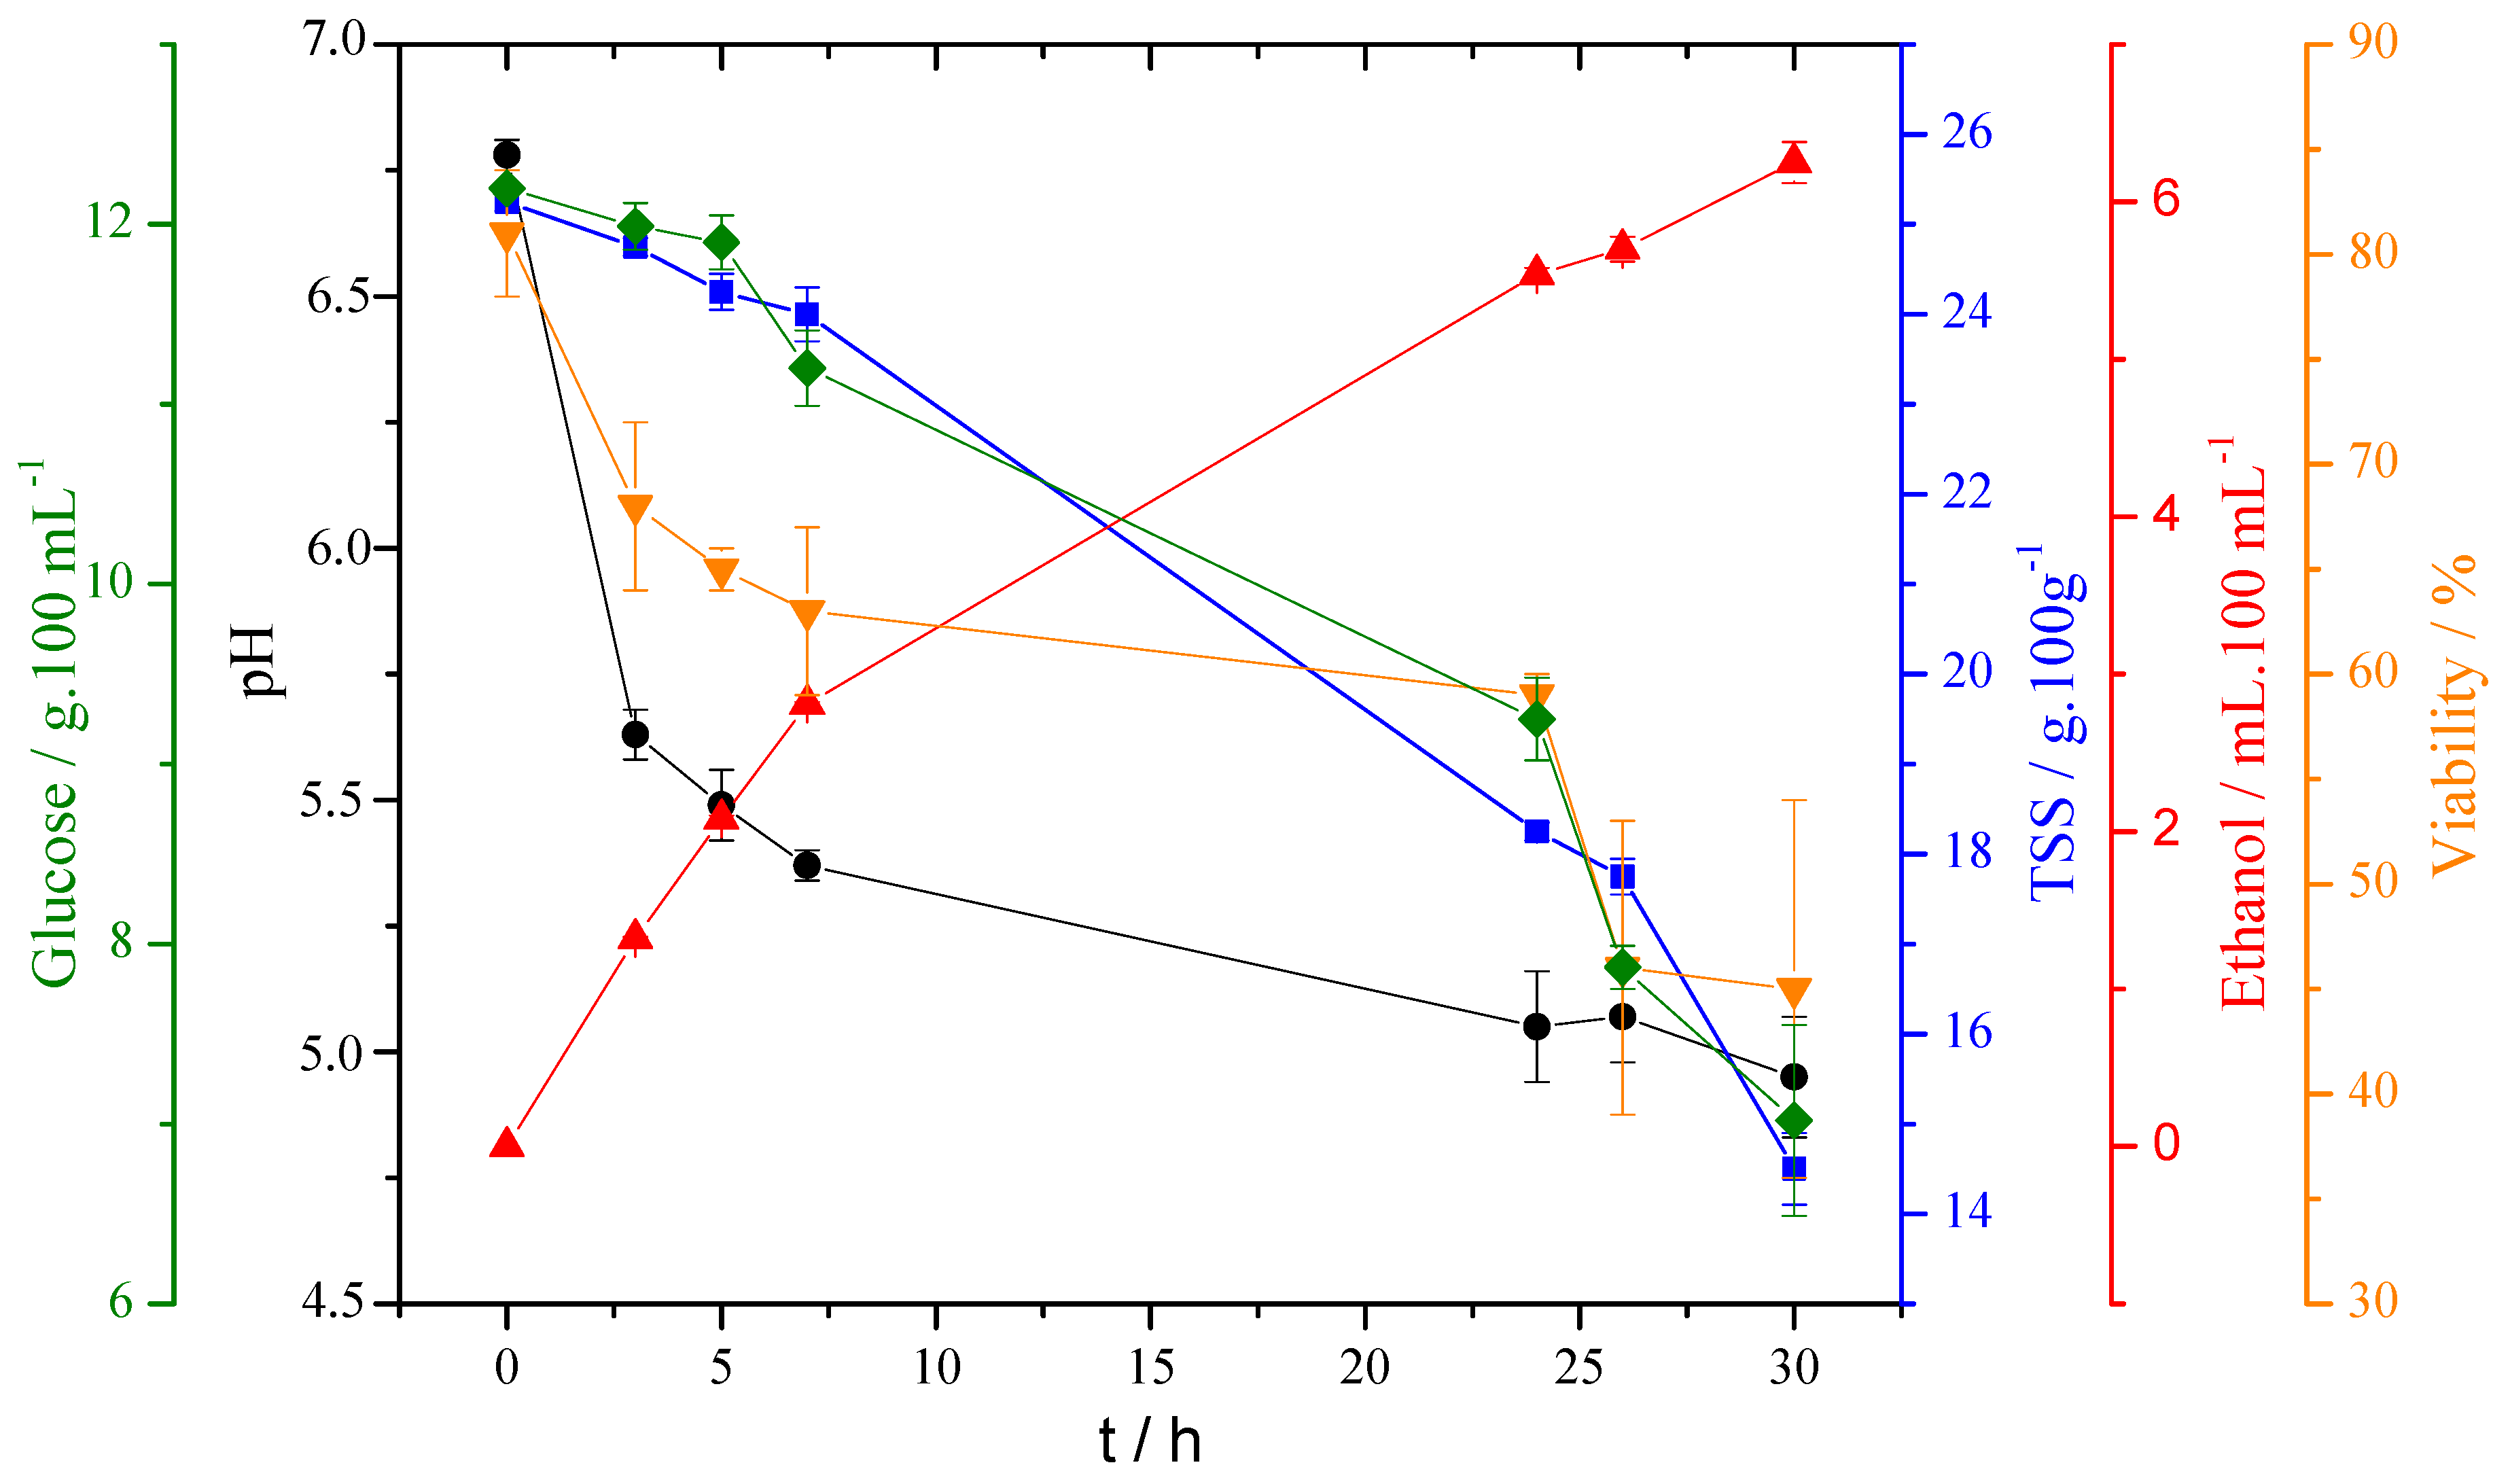
3.5. Correlation of Results for the Monitoring of Fermentation Kinetics
Figure 5 presents the data shown in
Table 1 and the results from the glucose quantification at different stages of the fermentation.
Considering the information presented in
Table 1 and
Figure 5, it is evident that the TSS estimation followed the same decreasing trend as the glucose value obtained by the proposed method. The magnitude of each electrochemically measured point corresponded to approximately half that obtained by the other technique. Indeed, TSS measures, in a non-selective way, the total “sucrose” content; in fact, the TSS technique quantifies the total soluble solids. On the other hand, the electrochemical quantification is selective for glucose, which stoichiometrically was approximately half of sucrose.
A linear correlation between the percent of glucose obtained and TSS with the proposed method was constructed. The general equation was percent glucose = 0.489TSS − 0.1807 with a linear correlation coefficient of 0.9632 and a p-value < 0.05. The slope of 0.489 indicates an underestimation (as hypothesized of two-fold) of the proposed method, justifiedm as already mentioned, by the selectivity of the glucose method.
The measurement of TSS is related to the number of soluble solids dissolved in a liquid matrix. In this sense, for a relatively simple matrix such as a fermentation carried out under laboratory conditions, it is possible to correlate the measurement with the percentage of glucose (or sucrose) present in the sample. However, for more complex matrices, the measurement does not give a result that is absolutely correlated with glucose, since, in real systems, it is possible to find other types of soluble non-fermentable solids such as fibers, non-reducing carbohydrates, etc. For these reasons, the proposed selective and quantitative glucose measurement can be a more efficient control tool considering that the analyte of interest can be quantified directly. The obtained correlation indicates that the electrochemical method allows satisfactorily determining the glucose concentration with the advantage that it is not susceptible to matrix problems (chemical and optical) under the studied conditions. Furthermore, in several foodstuff and production processed, it is useful to selectively estimate the amount of glucose to drive a production process or to understand the maturity of a product. For these reasons, the proposed strategy could become a valid tool able to be used in microbiology, food technology, and industrial application.
Although in the designed sensor an enzyme is used for the quantification of glucose, it is not necessary to immobilize it, as is usually proposed in the literature for the quantification of this type of molecules [
40,
41]. On the other hand, other sensors propose the detection of glucose by “no enzyme” strategies [
42,
43]. While these sensors are efficient, they lose selectivity when compared to their enzyme counterparts. From this point of view, the sensor proposed in this work can be considered a hybrid between both types of detection since it is based on the indirect measurement of glucose as a result of an enzymatic reaction in homogeneous phase. In this sense, in addition to glucose quantification, the same design could be used to monitor other types of molecules, changing the type of enzyme in solution, as long as NADH is maintained as a redox mediator, which gives this electrode, greater versatility.
4. Conclusions
The possibility of electrochemically monitoring an ethanolic fermentation at laboratory scale was suggested. The construction of the electrode was relatively simple and reproducible. It did not require the use of intermediaries or an enzymatic modification procedure of the electrodes, which can be problematic.
Because the glucose sensor is based on the measurement of the enzymatically generated NADH, the electrochemical response of this molecule was probed against the components of the commercial enzymatic kit and the components of the culture media used for fermentation, which can act as interferers present in the matrix. It was proved that it is possible to measure NADH without matrix interferences. Additionally, NADH measurements were tested against glucose concentration. In this experiment, the stoichiometric relationship between these two molecules was confirmed.
To evaluate the application of this system in a real domain, a lab-scale fermentation was used to determine if the built sensor was suitable for measurement in complex matrices. For indirect glucose quantification, LOD and LOQ were 16.2 mg·L−1 and 54.1 mg·L−1, respectively. Conventional parameters such as total soluble solids, percent ethanol, cell viability, and pH were measured. Electrochemical quantification of glucose, using the proposed methodology, showed a good correlation with TSS, obtaining a correlation of 0.9632 with a p-value <0.05, which, considering the complexity of the matrix, is an acceptable value.
Finally, the proposed strategy could become a valid tool able to be used in microbiology, food technology, and industrial application considering the simplicity of the method and the ability to work in real systems. In addition, the proposed strategy allows measuring samples that could present color interferences, in which the commercial spectrophotometric kit cannot be usable.

 ,
, 


