Article

Raman Spectroscopy as an Assay to Disentangle Zinc Oxide Carbon Nanotube Composites for Optimized Uric Acid Detection

Chemistry Department, Middle Tennessee State University, Murfreesboro, TN 37130, USA
*
Author to whom correspondence should be addressed.
Chemosensors 2018, 6(4), 65; https://doi.org/10.3390/chemosensors6040065
Submission received: 26 October 2018 / Revised: 3 December 2018 / Accepted: 6 December 2018 / Published: 12 December 2018
(This article belongs to the Special Issue Carbon Nanotube Sensors)

Abstract

:
Refluxed zinc oxide (ZnO) nanoparticles (NPs) were prepared and attached to carboxylic acid functionalized multi-walled carbon nanotubes (COOH-MWNTs) via sonication. Practical optimization of electrocatalysts using sonication to disentangle a carbon nanotube composite for monitoring uric acid (UA) is shown. Monitoring UA is important for the management of medical disorders. Selection of sonication time is a crucial step in producing the desired composite. We report, for the first time, the practical use of Raman spectroscopy to tune the sonication involved in tethering ZnO NPs to the multi-walled carbon nanotube (MWNT) surface. Maximum current for detecting UA, using chronoamperometry and cyclic voltammetry, correlated with the highest sp2-hybridized carbon signal, as seen in the integrated Raman G band peak areas denoting maximum COOH-MWNT disentanglement. An array of ZnO/COOH-MWNT composites were prepared ranging from 60 to 240 min sonication times. Optimum sonication (150 min) corresponded with both maximum measured current and MWNT disentanglement. The sensor was able to quantitatively and selectively measure UA at clinically relevant concentrations (100–900 μM) with rapid current response time (< 5 s).

1. Introduction

Uric acid (UA) is a byproduct of purine metabolism and its monitoring is important for management of medical disorders. Its overproduction, that is, hyperuricemia, often signals kidney dysfunction. Elevated serum UA concentrations have been strongly linked to hypertension [1,2], coronary heart disease [2], kidney stones [3], gout [4], Lesch-Nyhan syndrome [5], cardiovascular and kidney disease via impairment of endothelial integrity and function [2,6,7], and is one of the most reliable predictors of diabetes. An increase in UA levels typically precedes the development of both insulin resistance and Type 2 diabetes [7]. It has been shown that lowering uric acid in blood serum to levels at least below 6 mg/dL results in the disappearance of the clinical features of gout [8,9]. Gout patients, whose conditions result from elevated UA in blood [9,10], are susceptible to cardiovascular risk factors [2,10,11,12].
Conventional UA assaying methods, for example, liquid chromatography mass spectrometry (LC-MS) and high performance liquid chromatography (HPLC) [13], often require time-consuming analysis of blood and urine, during which many of these pathologies can escape diagnosis. Hence, improved methods for rapid, accurate UA concentration monitoring are needed. The development of electrochemical electrode composites for improved UA sensing is an active area of research [14,15,16,17,18,19,20]. The state-of-the-art UA sensing composite employs precious metals in its fabrication [21]. Due to limitations of resources, sensors employing earth-rich materials that can be facilely fabricated are desirable. One such type of material is zinc oxide (ZnO). ZnO is an n-type semiconductor. Because of its wide band gap (3.37 eV), relatively high conductivity, excitation binding energy (60 eV), and high breakdown strength, the material is an attractive candidate for biosensing applications [22,23], and has been shown to be effective in the quantitative detection of UA. A detailed review of UA sensors is given elsewhere [24].
Carbon nanotube composites offer new avenues for practical electrocatalyst preparation. Multi-walled carbon nanotubes (MWNTs) have been shown to serve as effective supports for tethering electrocatalytically active nanoparticles (NPs), thereby improving even distribution for a host of electrochemical sensing applications [14]. Cavitation offered by sonication is often employed to maximize the even distribution of electrocatalytically active NPs [25,26]. A challenge in optimizing carbon nanotube based electrocatalysts is controlling the degree of dispersion and uniformity of the tethered ZnO NPs to maximize redox signal. The composite’s relatively less-defined morphology as a result of carbon nanotube entanglement affects the degree of exposed electroactive surface area. Too little sonication and the NPs sparsely attach to the MWNT sidewalls and remain insufficiently distributed. Excessive sonication results in surface damage to carboxylic acid (COOH) acid moiety tethering points that would result in agglomeration of the NPs, leading to reduced electrocatalytic activity [27]. Our laboratory has applied this same principle of optimized sonication for tethering ZnO NPs for various analyte sensing applications [16,28].
An overlooked variable for material preparation is adjusting the MWNT surface entanglement itself, which can be achieved via adjusting sonication time. We show in this report, for the first time, the utility of Raman spectroscopy for assaying various ZnO/COOH-MWNT composites produced by varying sonication times, in particular, to optimize the sensitivity of the ZnO/COOH-MWNT composite for detecting UA. Rapid D-to-G band ratio monitoring permits facile identification of the optimum sonication time for electrocomposite preparation to achieve maximum sensing performance. This monitoring technique may prove to be universally applicable to optimize a host of electrochemical sensors (to detect and measure any analyte) that employ the attachment of nanoparticles to COOH-functionalized carbon nanotube surfaces for its fabrication. In this study, the Raman G band integrated peak areas are used to quantify the degree of exposed sp2-hybridized carbon, denoting carbon nanotube disentanglement affecting the electrocatalyst’s sensitivity for UA sensing.

2. Materials and Methods

2.1. Materials

Bamboo structure COOH-MWNTs (95% purity, 30 nm diam) were purchased from Nanolab, Inc. (Waltham, MA, USA), and were used as received. Reagent grade (99% purity) UA, phosphate buffer solutions (PBS, pH = 7.0), dopamine (DA), acetaminophen (AP), zinc nitrate hexahydrate (98% purity), L-ascorbic acid (AA) (99%) and folic acid (FA) were all purchased from Sigma-Aldrich (St. Louis, MO, USA). Hydrogen peroxide (H2O2) (30 wt. %) and NaOH were purchased from Fischer Scientific (Fair Lawn, NJ, USA). Absolute anhydrous ethyl alcohol (AAEA) was obtained from Pharmco-AAPER (Shelbyville, KY, USA). Nafion™ binder was purchased from Ion Power, Inc. (New Castle, DE, USA). All solutions were prepared using Millipore water (18 MΩ·cm).

2.2. Nanocomposite Synthesis

A series of nanocomposites incorporated onto glassy carbon electrode (GCE) surfaces for electrochemical analysis of UA via Nafion film were synthesized using two steps: (i) refluxed synthesis of ZnO nanostructures, followed by (ii) attachment to COOH-MWNTs. Refluxed ZnO NPs were synthesized following a procedure developed by Fang et al. [29]. A 20-mL volume of 1 M NaOH was added into a round bottle flask. A separatory funnel containing 0.5 M of 20 mL of Zn(NO3)2·6H2O was attached to the flask. The NaOH solution was heated to 100 °C, while Zn(NO3)2·6H2O was added dropwise for 60 min under continuous stirring (with a magnetic stirrer) under inert N2 atmosphere to obtain the ZnO NPs. Refluxing under these conditions continued for an additional 2 h at 100 °C. After obtaining white precipitation, ZnO was filtered and washed with Millipore water. After several washings, the obtained NPs were dried in a desiccator overnight. The ZnO NPs were dried in an oven for one hour at 65 °C. To fabricate the ZnO/COOH-MWNT electrocatalyst composite, 2.0 mg of the refluxed ZnO and 2.0 mg of the COOH-MWNTs in 1.0 mL AAEA solvent were placed in a polyethylene tube and sonicated at preselected times. An array of ZnO/COOH-MWNT composites were produced, varying sonication times at 60, 90, 120, 150, 165, 180 and 240 min, for each electrocatalyst. A direct reduction of electroactive surface area was measured with reduced G band intensity to validate this correlation (vide infra). The resulting ZnO nanostructures were tethered to the COOH groups as verified by the disappearance of the carboxylate symmetric and asymmetric peaks in the ATR-IR [16], also observed in our laboratory with other NPs [27]. Each ZnO/COOH-MWNT nanocomposite was drop-casted onto glassy carbon electrodes (GCE), 5 mm in diam. A 10-μL colloidal aliquot of the composite as a colloidal suspension was pipetted onto the GCE surface. The GCE was then placed into the oven for 15 min at 80 °C. After drying, a second 10-μL aliquot of 2% Nafion solution was added on top, and dried in an oven at 80 °C for additional 15 min to obtain the Nafion/ZnO/COOH-MWNTs/GCE sensor.

2.3. Characterization

Cyclic voltammetry (CV) and chronoamperometry (CA) were performed using WaveNano™ potentiostat software (Pine Instruments, Inc.; Durham, NC, USA). Electrochemical experiments were performed in a 3-electrode electrochemical cell system consisting of a Pt wire auxiliary electrode, an Ag/AgCl (3.5 M KCl) reference electrode, and a glassy carbon electrode modified with a ZnO/COOH-MWNT composite as the working electrode. The electrochemistry medium was PBS (pH = 7.0). All experiments were performed in a deoxygenated electrolyte solution prepared by bubbling 99.9% purity N2 gas flow (Air Gas Products, Radnor, PA, USA) through the solution for 15 min prior to each measurement. The solution was bubbled with N2 at room temperature (22 ± 1 °C) inside a copper-grid Faraday cage. CVs were carried out between potentials ranging from −1.00 to +1.00 V at a scan rate of 50 mV·s−1. Raman spectroscopy was performed using an Enwave Optronics ProRaman-L spectrometer with a 500 mW Class 3B laser (λ = 785 nm). Raman samples were prepared by pipetting colloidal suspensions of the ZnO/COOH-MWNTs in absolute anhydrous ethanol onto Si(100) wafers. X-ray photoelectron spectroscopy (XPS) was carried out using a Perkin-Elmer PHI 560 spectrometer with a double-pass cylindrical mirror analyzer operated at 225 W and 13 kV using a Mg Kα (hν = 1253.6 eV) anode, with narrow scans acquired using a 50 eV pass energy. The optimized composite sample was analyzed as a solid applied to double-sided electrically conductive tape (Ted Pella Inc., Redding, CA, USA), which was outgassed via a turbo-pumped antechamber. TEM was carried out using a Hitachi H-7650 microscope operated at 100 kV, applying the colloidal samples to a 200-mesh copper grids. The procedure of isoelectric point measurements, involving pH measurements with a spear-tipped electrode, have been described elsewhere for experiments involving carbon nanomaterial composites [30,31,32,33,34,35]. Briefly, pH solutions varying in values from 1 to 12 were prepared, to which 2.0 mg of the solid material were introduced. After 16 h equilibration periods, the final pH was measured, resulting in observed plateaus in the initial versus final pH plots that denote the isoelectric points for each solid. Plots of initial versus final pH revealed plateaus, denoting the point-of-zero (PZC) charge of the electrocatalyst.

3. Results and Discussion

XPS signals of O 1s, C 1s, and Zn 2p orbitals were detected in the ZnO/COOH-MWNT nanocomposites. The composite produced using a 150 min sonication time was found to have the highest electrocatalytic activity, as shown in Figure 1. There was no variation or trend in XPS scans between composites prepared at different sonication times (60 to 240 min). High-resolution peaks were deconvoluted from the XPS narrow scans to analyze using CasaXPSTM VAMAS curve-fitting software 2.2.107 (Devon, UK). The atomic percent composition measured from the C 1s, O 1s, and Zn 2p orbitals after normalizing their integrated peak areas to their atomic sensitivity factors were 93.1%, 5.2%, and 1.7%, respectively. The C 1s binding energy (BE) at 284.4 eV was used as a charge reference denoting sp2-hybridized C from the carbon nanotube graphene sheets [36].
Figure 1B shows the O 1s XPS spectrum for ZnO/COOH-MWNTs. The O 1s core levels of the composite shows two major peaks: one at 531.1 eV, which we assign to –C=O from the tethered COOH moieties to the MWNT surface [26]. The other peak at 532.2 eV, which corresponds to adsorbed hydroxyl oxygen [37], is obtained during its synthesis from exposure to aqueous solution. The O 1s BE at 532.1 eV instead is indicative of adsorbed interstitial OH in vacant sites within the ZnO [38]. The C 1s BE peak at 285.8 eV denotes a polymeric C–O structure due to the presence of –COOH units [39]. The XPS spectrum of Zn 2p orbital in Figure 2C shows a doublet separation of 2p3/2 and 2p1/2 orbitals at 1045.1 and 1022.4 eV is 22.7 eV, matching the literature values for ZnO [40,41]. The oxidation state for pure metal oxide O, expected at ~530 eV for ZnO NPs [34,35,42], is greatly attenuated by adsorbed OH overlayers and not readily resolved. The greatly attenuated O 1s metal oxide oxidation state signal is also consistent with the low atomic % Zn 2p observed, that is, the OH overlayers also attenuate the ZnO signal. The red arrow in Figure 1A denotes the attenuated BE position of the ZnO oxidation state.
The lowered O 1s BE peak center at 531.1 eV (relative to 531.3 eV) [26], denoting –C=O, can be attributed to extra-atomic relaxation of the O 1s photoelectrons due to interactions with the tethered ZnO NPs. Signals from the deconvoluted O 1s XPS BE showed a 0.87:0.13 ratio of adsorbed OH to interstitial OH within the ZnO/COOH-MWNT composite surface (Figure 1A).
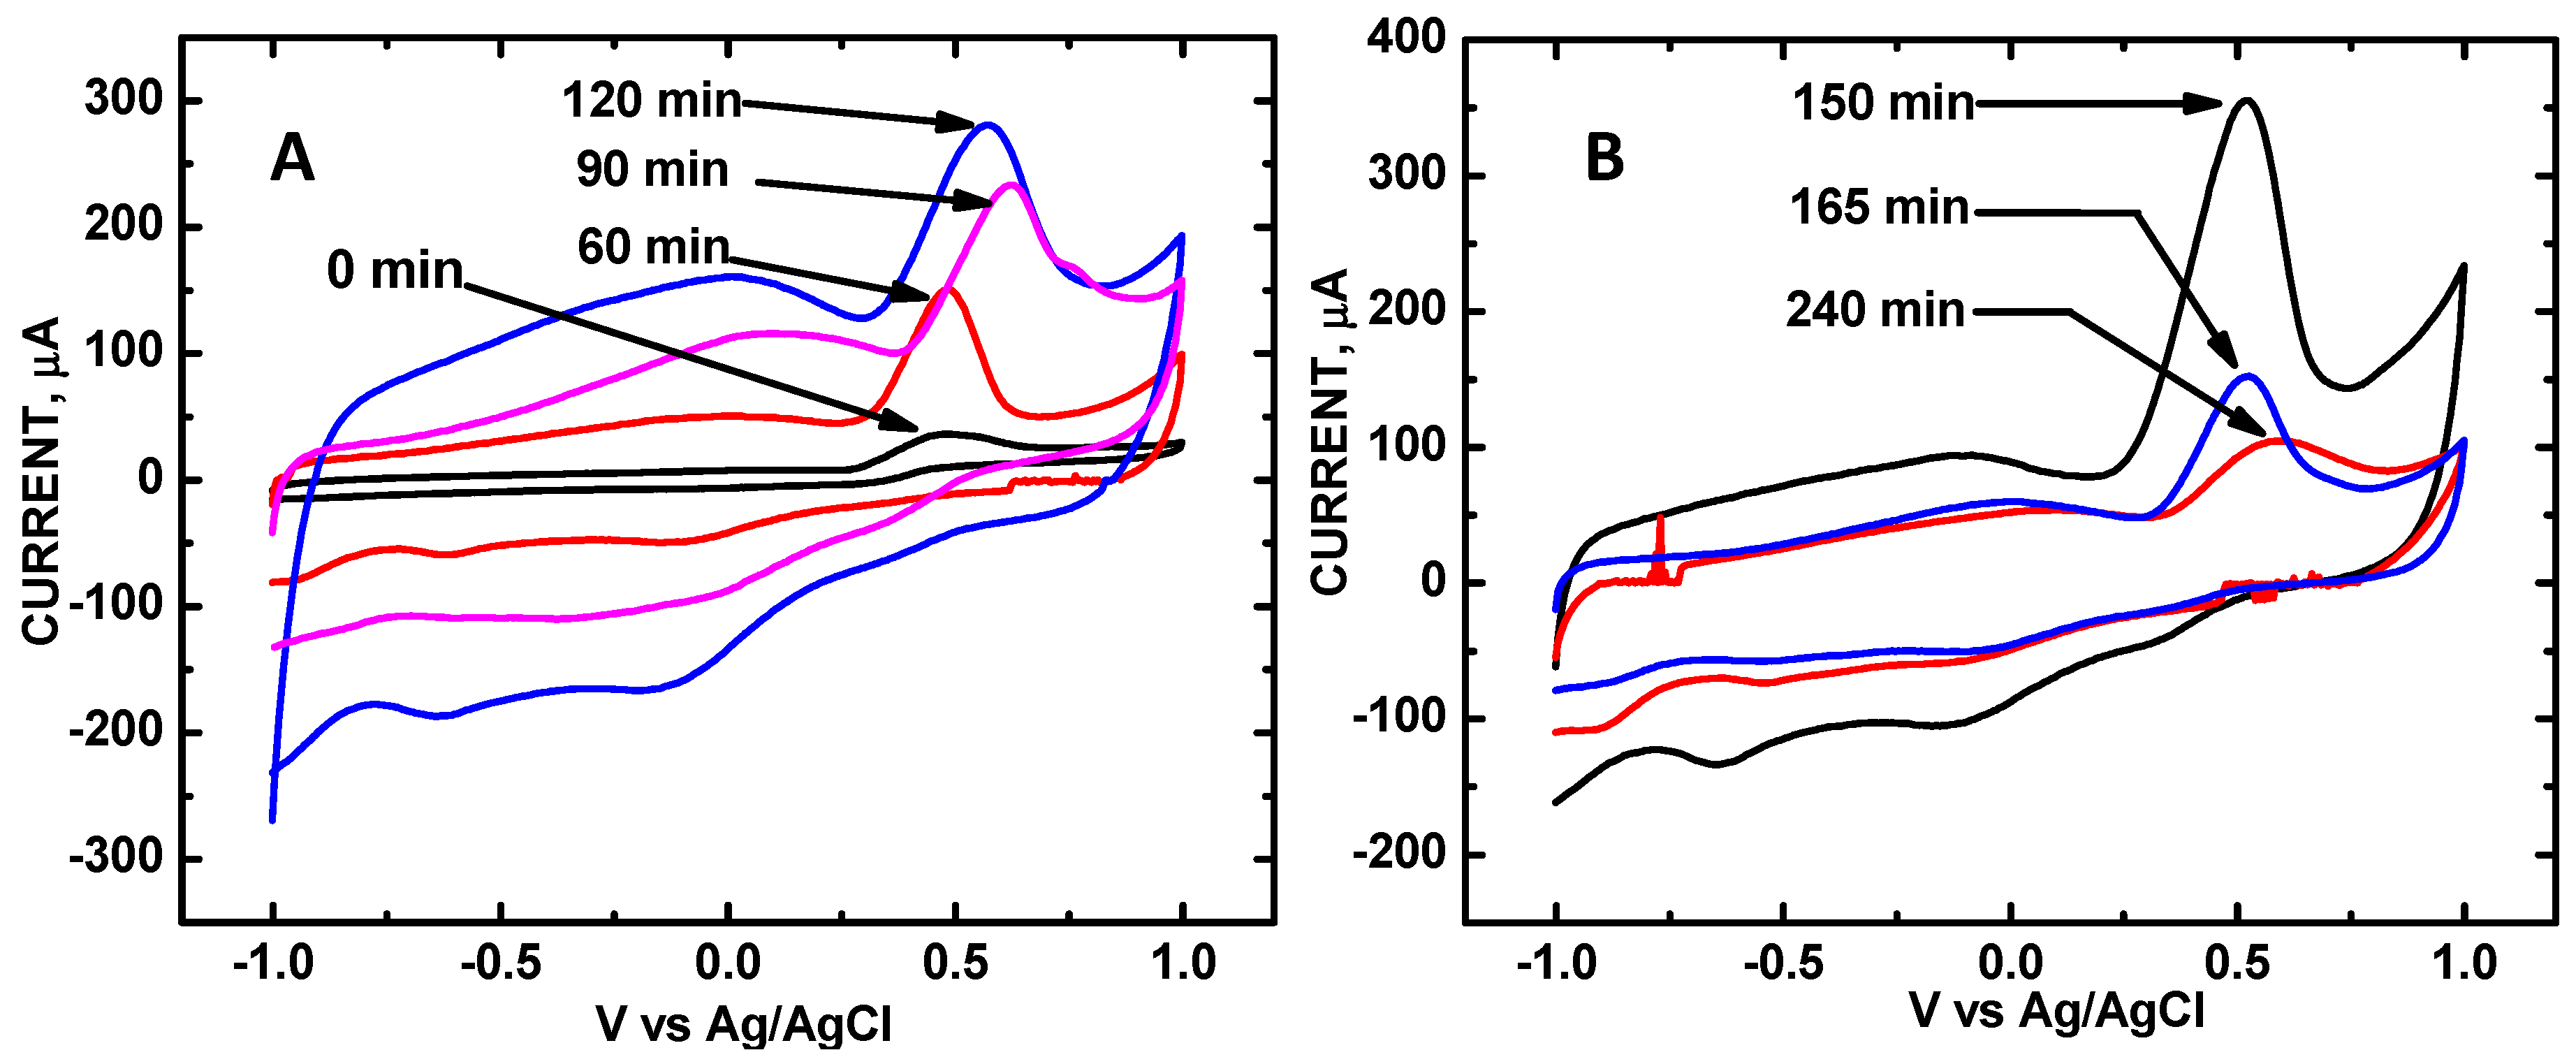
Figure 2 shows CV scans for each of the ZnO/COOH-MWNT composites during redox cycles of 10 mM UA with increasing sonication times from 0 to 240 min. The zero sonication time denotes the electrode surface reaction with the COOH-MWNT surface only and without attached ZnO NPs, which was used as a control. The CV of UA shows a distinct oxidation peak at +0.5 V vs. Ag/AgCl (3.5 M KCl). The oxidation peaks are in agreement with previous ZnO–carbon nanotube based electrochemical sensing composite measurements [16]. Increased peak heights in the CVs denote increased electrocatalytic activity. The peak current heights along with voltages are summarized in Table 1. Randles–Sevcik (RS) analysis was performed for all of the composites, varying the scan rates from 10 to 100 mV·s−1. The asymmetrical shape indicates that the CV redox reaction is irreversible. The CV shown at 0 min (Figure 2) denotes the electrocatalytic activity of the bare COOH-MWNT surface without attached ZnO NPs; the reduction current observed was 36 μA. A control CV for the ZnO NPs only is shown in Figure S1 (in the Supplementary Materials); the observed reduction current was 45 μA. The control CV for the refluxed ZnO NPs applied to the bare GCE surface shows a mere 45 μA reduction signal for UA under these same pH 7.0 conditions, which is markedly less current as compared to the 150 min sonicated ZnO/COOH-MWNT composite.
The CV current follows the RS relation for a quasi-reversible reaction [43]:
ip = 2.99 × 10⁵ n(αn)1/2A·C°·D1/2·v1/2
where n is the number of electrons, A the electrode area (in cm2), C° the concentration (mol·cm−3), D the diffusion coefficient (cm2·s−1), and v the scan rate (V·s−1). Plots of measured current versus the square root of the scan rate were linear for all of the prepared ZnO/COOH-MWNT composites with least square correlation coefficient R2 values of 0.94 or higher (Figures S2–S8 in the Supplementary Materials), indicating diffusion controlled processes at the electrode surface. The relative electroactive surface area (relative area) in Table 1 was calculated by algebraic comparison of RS equations with respect to the relative electroactive surface area of the 60 min sonicated ZnO/COOH-MWNT composite. For instance, RS equations for the 60 and 90 min sonicated composites are shown in Equations (2) and (3), respectively:
ip60 = 0.149 × 10⁻³ A = 2.99 × 10⁵ n(αn)1/2A60C°D1/2v1/2
ip90 = 0.233 × 10⁻³ A = 2.99 × 10⁵ n(αn)1/2A90C°D1/2v1/2
Dividing Equation (3) by Equation (2) and arranging algebraically yields A90/A60 = 1.56 as the relative surface area in Table 1.
Cavitation provided by sonication enhances the tethering of the ZnO NPs to the COOH-MWNT surface and disentangles the MWNTs to maximize the electroactive surface area. Hence, measured current could directly be used to quantify relative electroactive surface area (Table 1). Employing RS analysis (varying the scan rates for 60 to 240 min sonicated composites yields 7 independent equations for comparison), relative electroactive surface areas were calculated by normalizing the area for the 60 min sonicated composite as 1.00. As sonication proceeded from 0 to 240 min, an increase followed by a decrease in electroactive surface area is observed with highest surface area. Maximum electrocatalytic activity was attained at 150 min of sonication, which is in excellent correlation with the Raman data (vide infra). For example, in comparing currents listed in Table 1, a 2.4-fold increase in the electroactive surface area, and hence sensitivity, is observed when comparing the 150 min sonicated ZnO/COOH-MWNT composite with that of 60 min, that is, 355 ÷ 149 ≈ 2.4. We attribute the enhanced electrochemical activity for UA oxidation to the greater electrode surface area resulting from the largest degree of disentanglement produced by sonication.
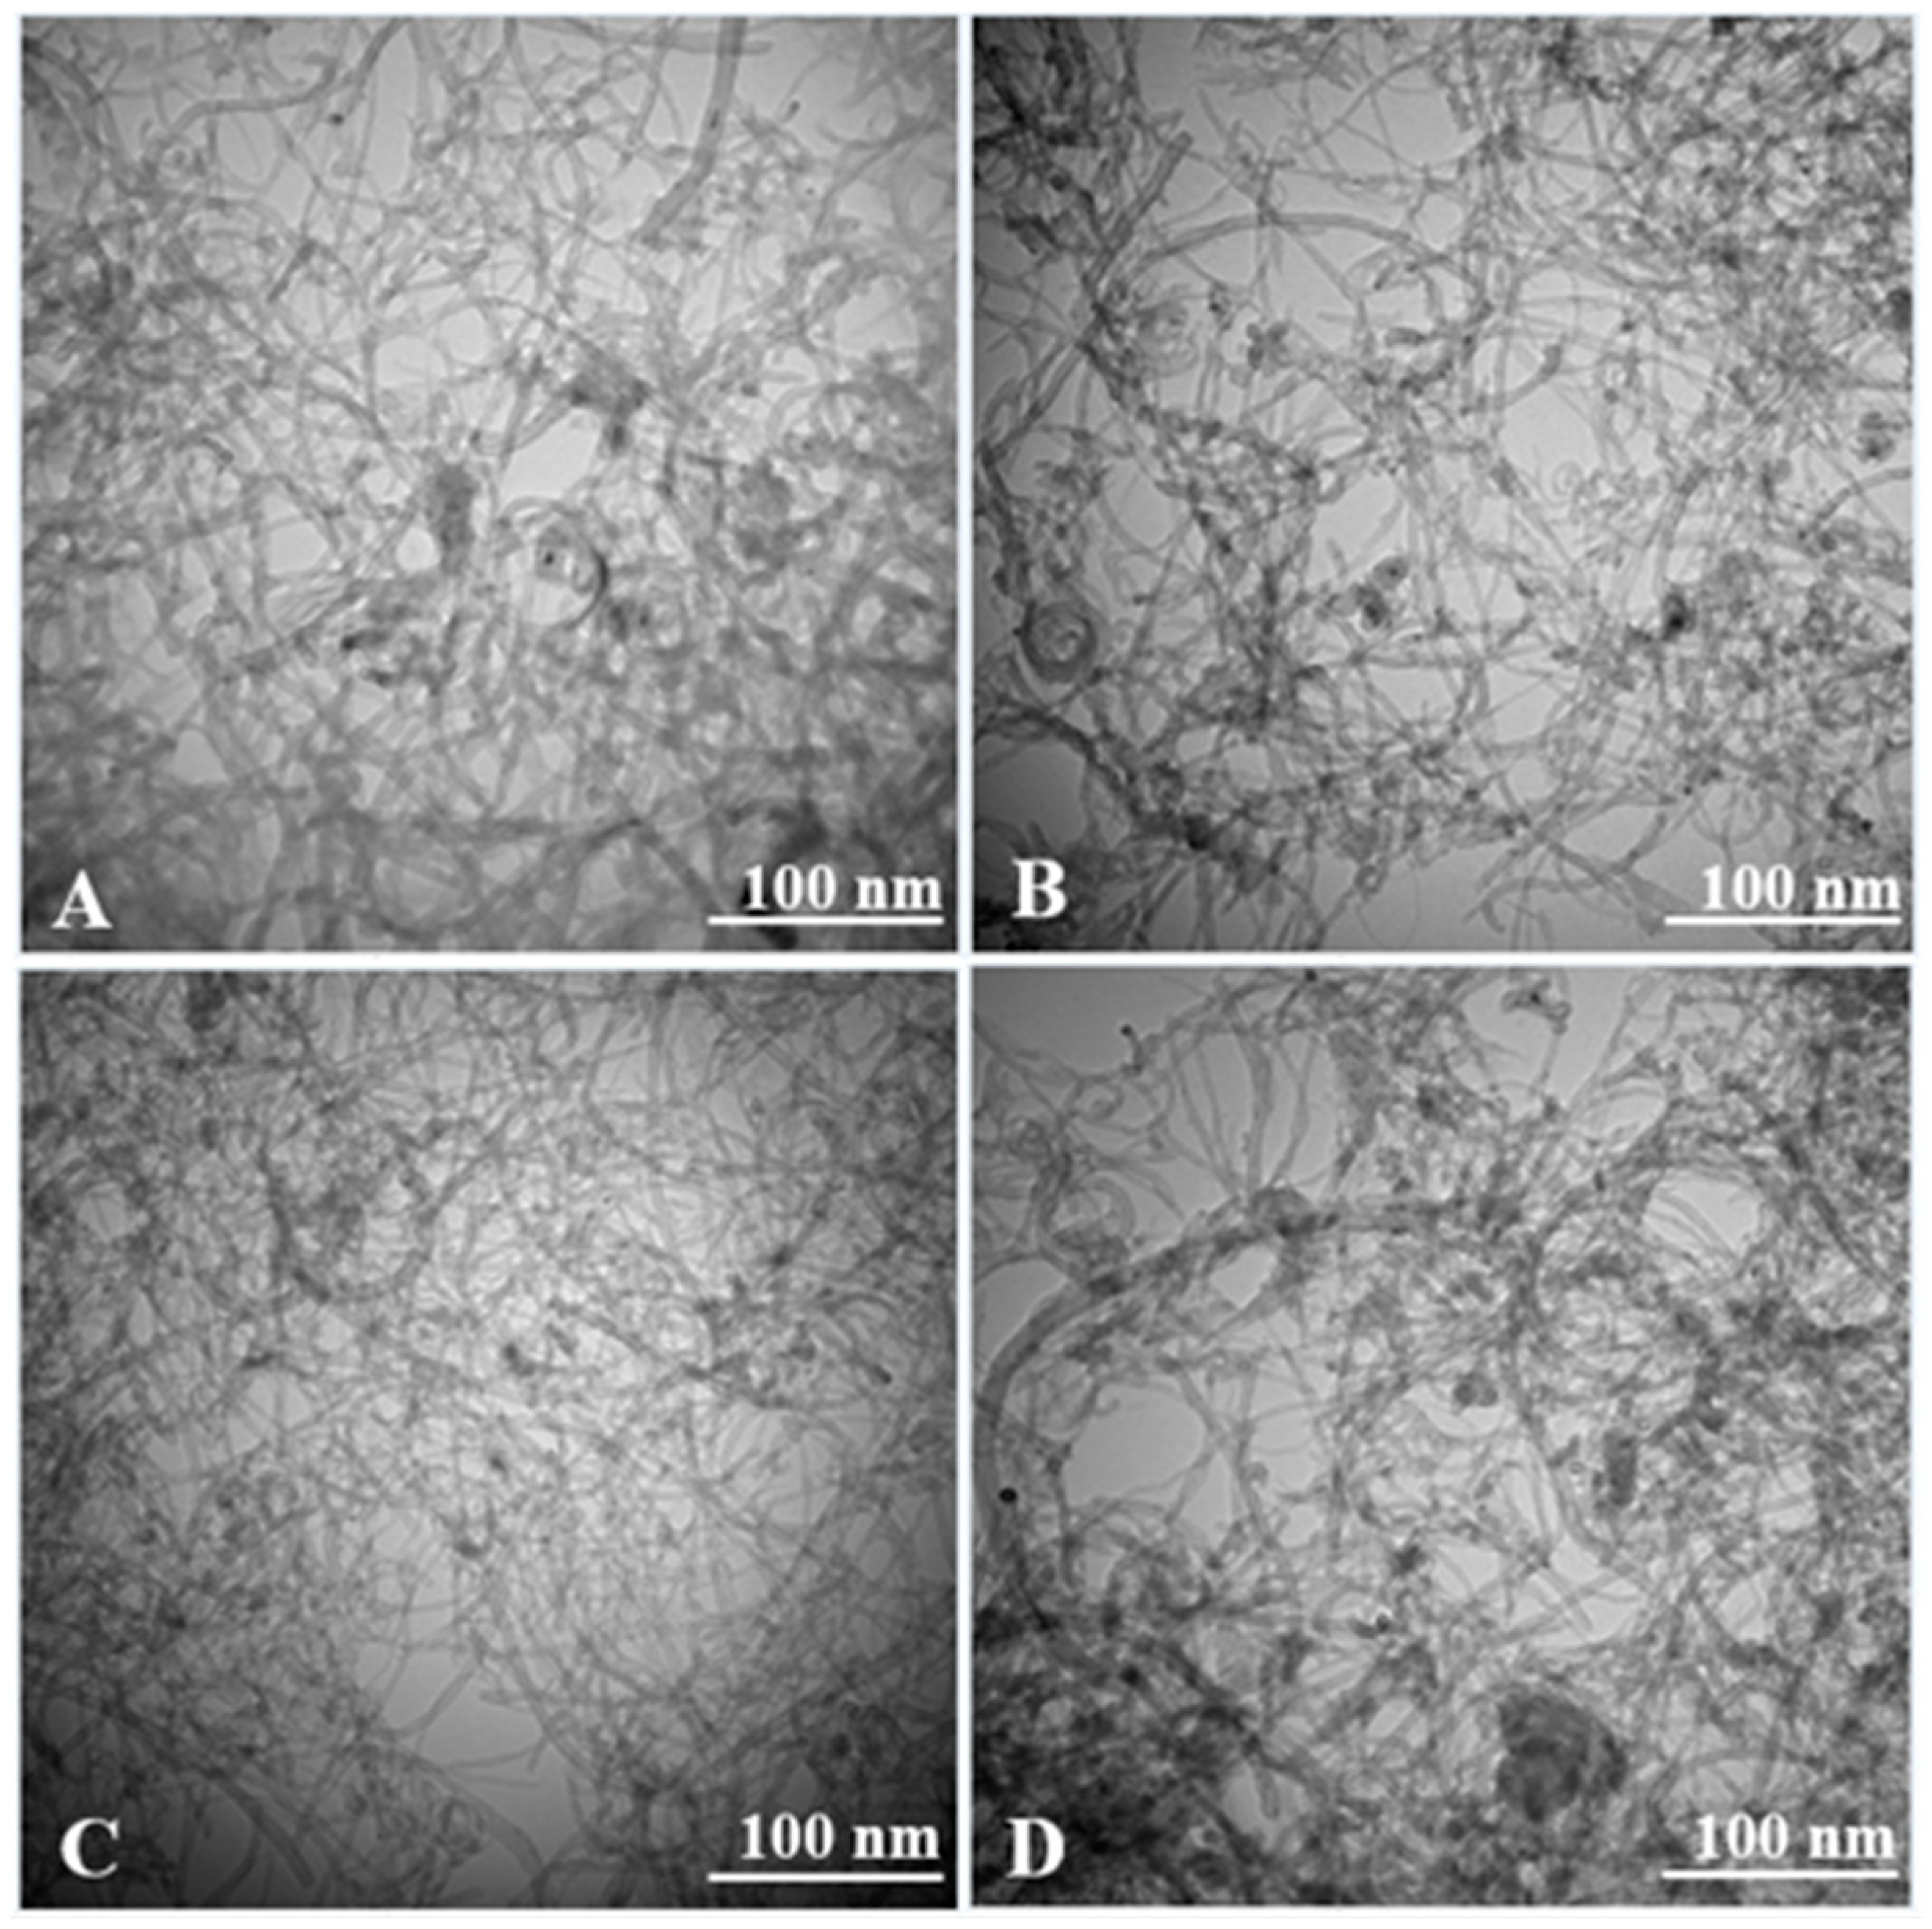
Figure 3 shows TEM images of the ZnO/COOH-MWNT composites produced at varying sonication times of 60, 120, 150 and 165 min. The composite becomes disentangled with increasing sonication times, with the 150 min sonicated composite having the most disentanglement with the lowest number of overlapping MWNT strands. The composite becomes disentangled with increasing sonication time, with the 150 min sonicated composite (Figure 3C) having the most disentanglement. As sonication ensues beyond the 150 min time point, the composite becomes more entangled. The trend in disentanglement observed coincides with increasing and decreasing Raman G band intensity (vide infra) along with measured electrochemical signals for UA. The average ZnO NP size maximized at 150 min of sonication. The degree of electrocatalytic activity for UA detection, instead, is predominantly governed by carbon nanotube disentanglement within the composite.
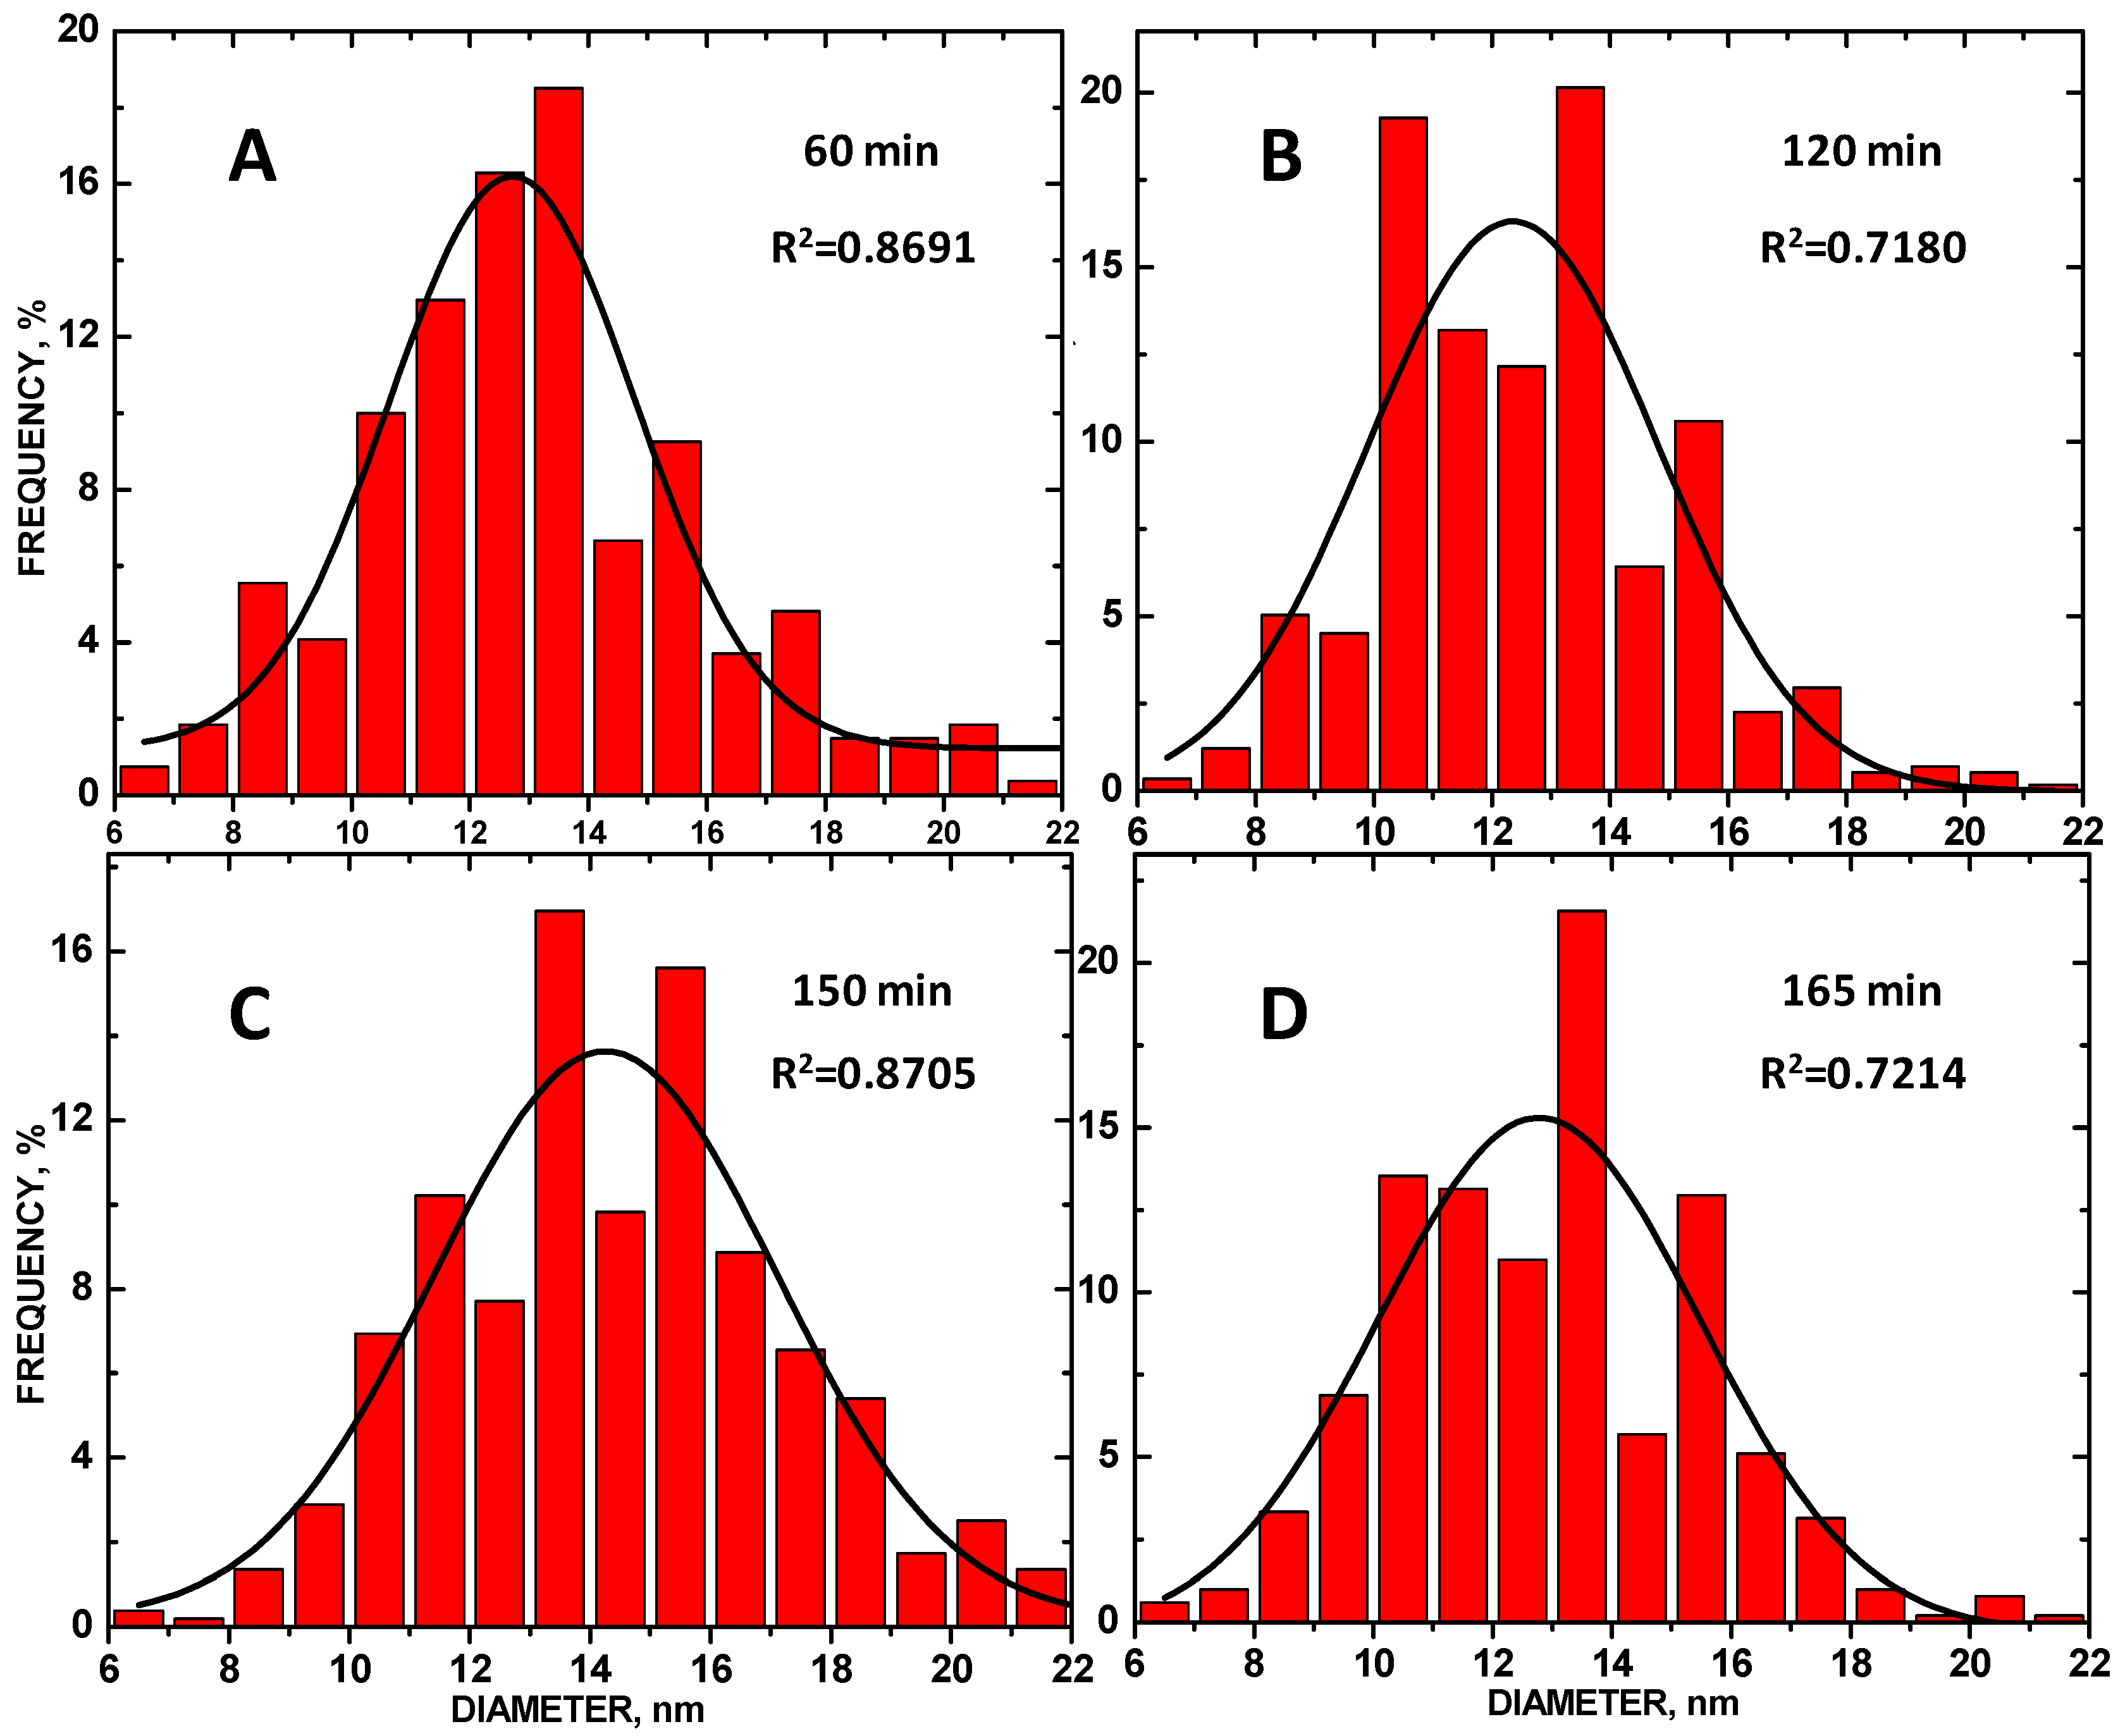
Size histograms of the ZnO NP diam are shown in Figure 4 along with Gaussian fit overlays. The average diam ± STD for the ZnO NPs at 60, 120, 150, and 165 min sonication times was 12.72 ± 0.21, 12.35 ± 0.37, 14.25 ± 0.25 and 12.78 ± 0.38 nm, respectively. The 150 min sonicated composite had the largest average diameter and the most even size distribution, as compared to the other composites, as shown by the R2 values. The average ZnO NP size maximized at 150 min of sonication.
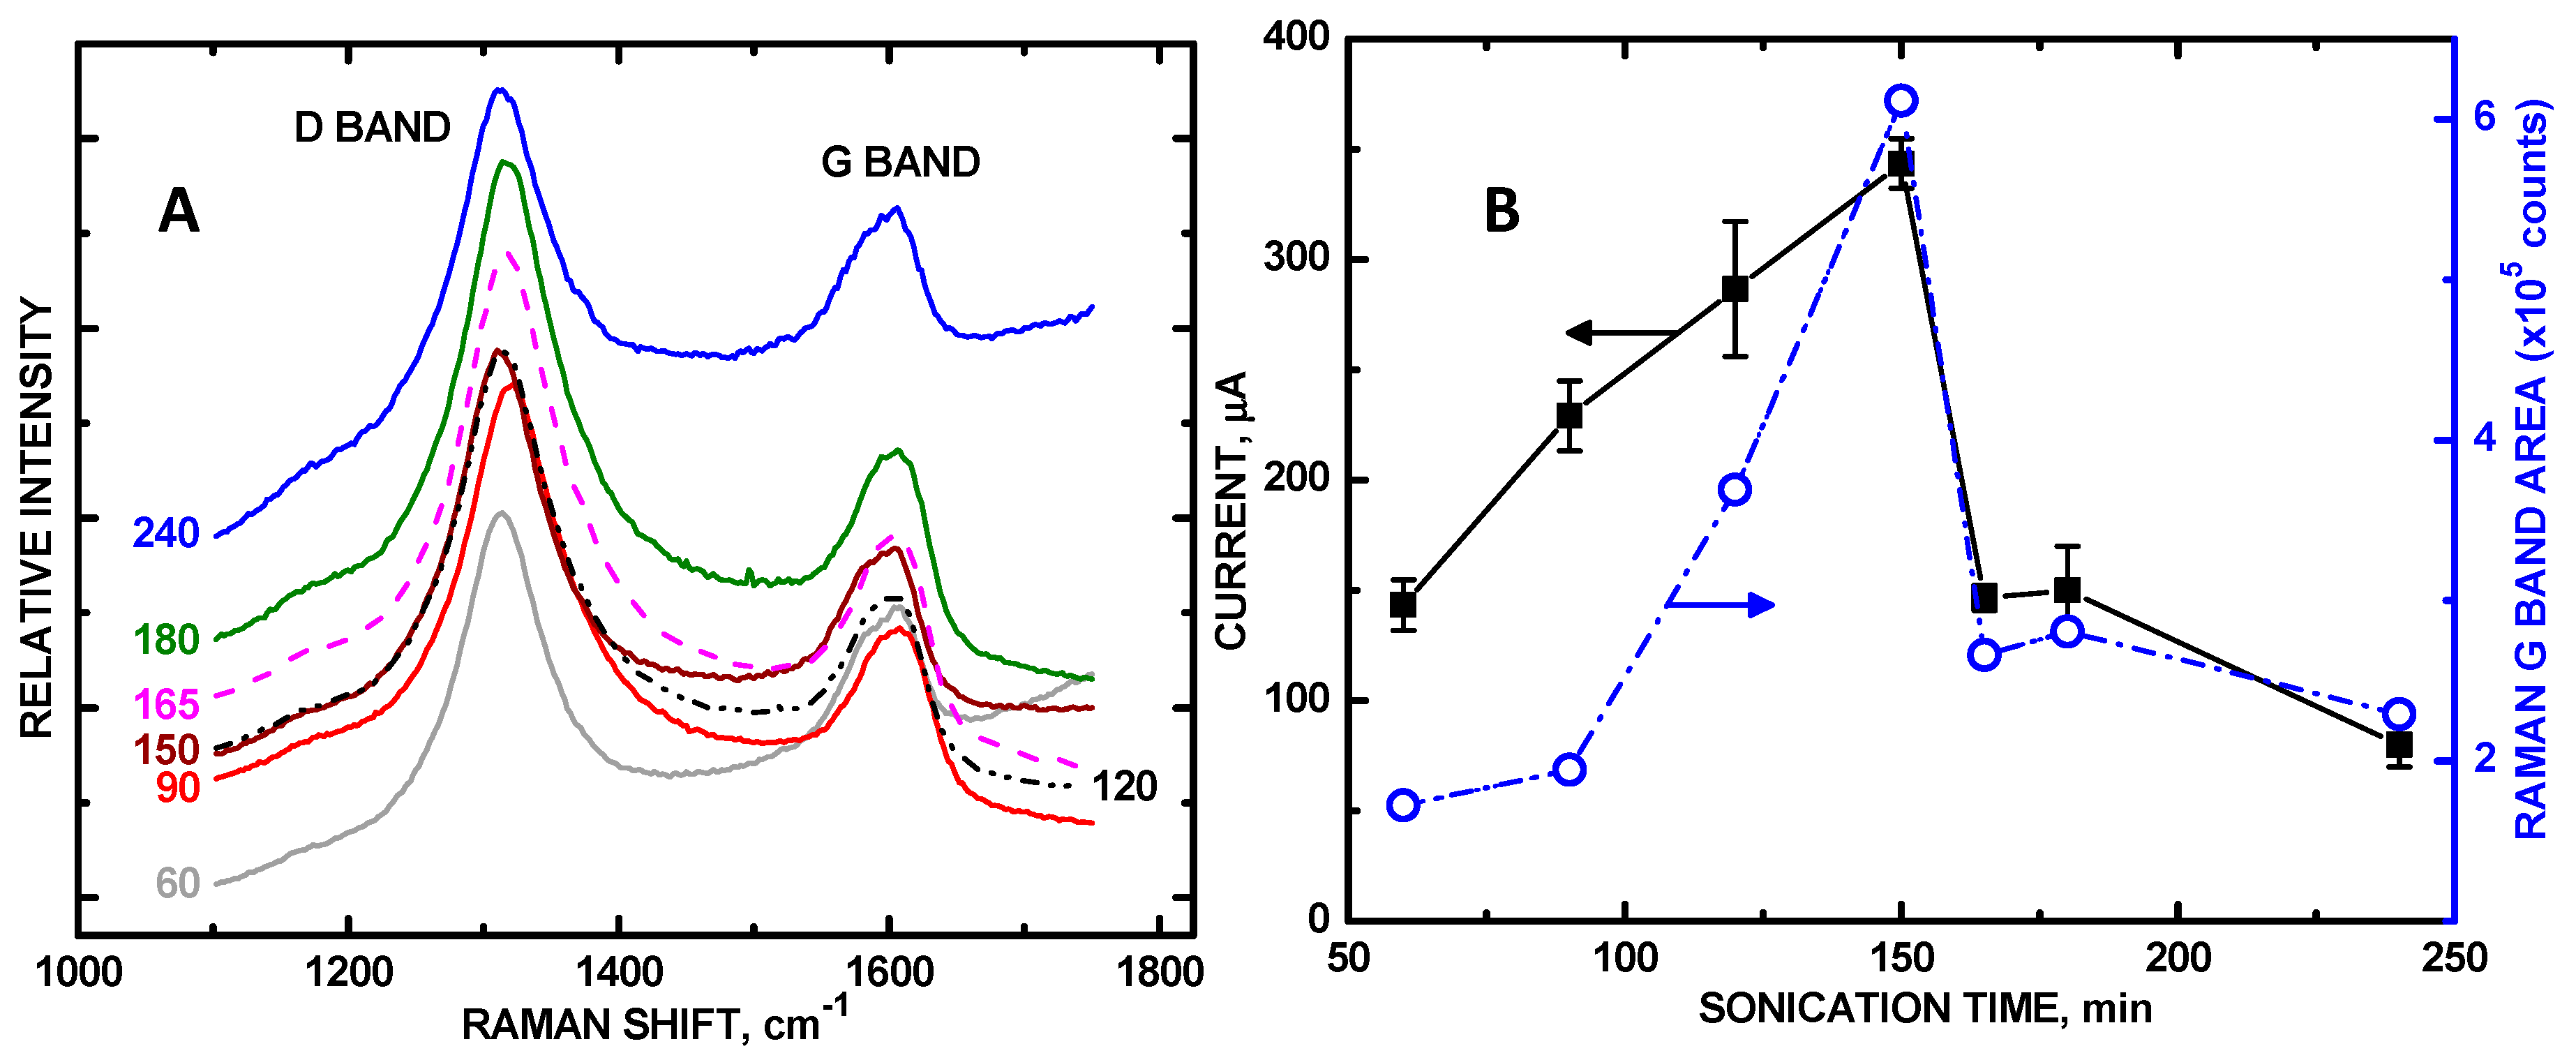
Raman shifts at 1320 and 1600 cm−1 (Figure 5), denoting the D and G bands, match those in the literature [27,44], corresponding to the sp3- and sp2-hybridized carbon atoms indicating disordered graphite and ordered graphene within the MWNTs, respectively, are shown for each composite in Figure 5A; raw data with offsets are shown. Integrated areas of the Raman D band also tracked well as a function of sonication time with maximum current at 150 min, but had more scatter in the trend at other sonication times, likely due to sp3-hybridized carbon bond formation as a result of the creation of more sites to bind with ZnO during sonication. The degree of carbon nanotube disentanglement is directly quantified via integrated peak areas of the Raman G band, which denotes the amount of exposed sp2-hybridized carbon of the graphene sheet [45,46]. Since the sp2-hybridized carbon, represented by the G band, was never altered in the tethering of ZnO NPs, the G band intensity better represents the degree of MWNT disentanglement than that of the D band. The more disentangled the ZnO/COOH-MWNTs, the more sp2-hybridized carbon is exposed and the greater the electroactive surface area and Raman G band intensity becomes. The integrated G band peak area, calculated from the series of spectra in Figure 5A, increased from 60 to 150 min, and then decreased from 150 to 240 min of sonication (Figure 5B, right-hand axis, blue trace). Sonication beyond 150 min resulted in re-entanglement of the MWNT support as indicated by the Raman spectra. This trend also corresponded with variations in measured current in the CVs. In Figure 5B, both maximum current and maximum G band area were observed at 150 min, showing a direct correlation of analyte signal intensity with a fully disentangled ZnO/COOH-MWNT composite.
The degree of disentanglement affected the size distribution of the tethered ZnO NPs. Of all of the ZnO NPs, the 150 min sonication produced the most even TEM size distribution in this series (Figure 4), which also correspond to highest electroactive surface areas as measured by RS analysis along with the most disentangled underlying MWNT substrate. Optimized sonication as observed by Raman spectroscopy resulted in a 9.8-fold increase in UA signal intensity. To our knowledge, this is the first systematic report monitoring the Raman G band intensity accompanying enhanced electrocatalytic activity. The closest related study is that of Wayu et al. [18], who employed sonication to tether β-cyclodextrin to COOH-MWNTs for UA sensing. In comparing the sensitivities with and without employing sonication, they reported a 3.7-fold increase in sensitivity to UA. We posit that the MWNT substrate disentanglement that occurred during their sonication step was responsible for this signal increase. A direct correlation of increased electrode UA signal with G band intensity denoting MWNT disentanglement was observed.
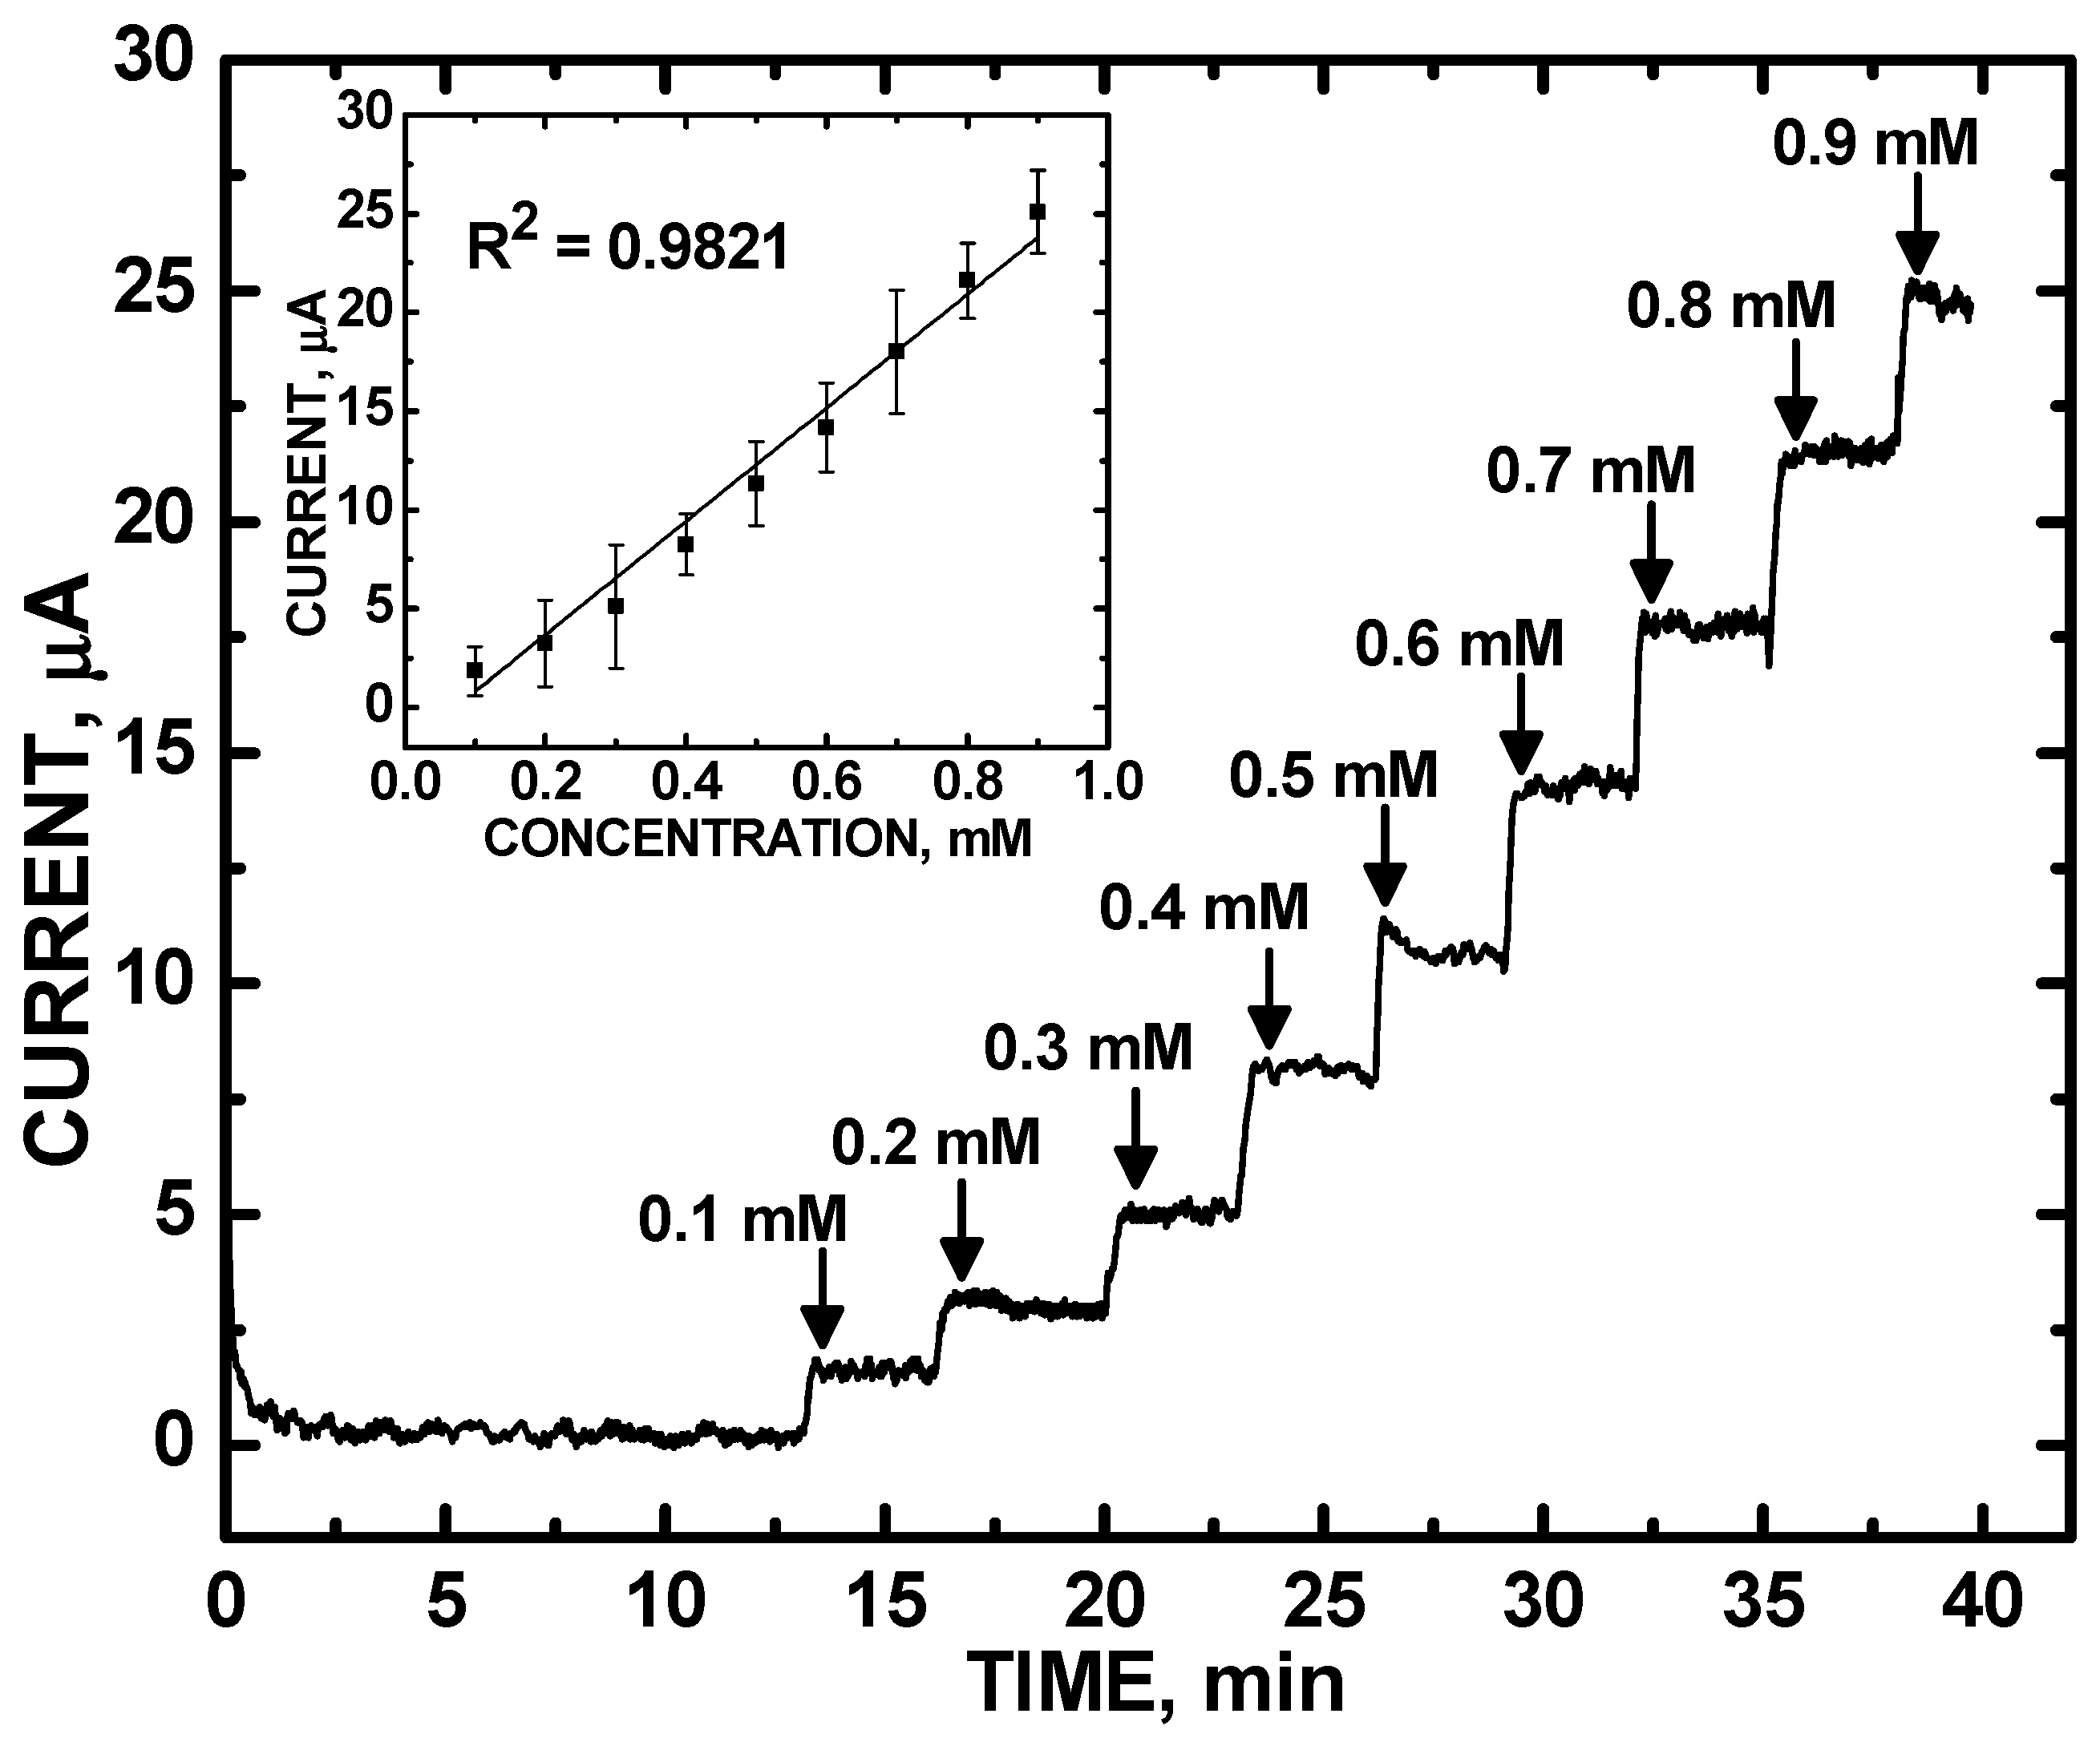
Our optimized ZnO/COOH-MWNT composite was also selective against an array of interfering analytes. Figure 6 shows quantitative CA measurements of UA, ranging from 100 to 900 µM concentrations with current measurements obtained at a +0.577 V in PBS (pH = 7.0) under N2 bubbling. The ZnO/COOH-MWNT/GCE electrode exhibited a linear response; the inset in Figure 6 shows the calibration curve (R2 = 0.9821). The limit of detection based on CA was 2.34 ± 0.63 μM. Normal UA levels in human blood are in the concentration range of 130–380 μM (2.4 mg/dL to 7.0 mg/dL) [47,48], which is well within the practical analysis range of our composite. In addition, the linearity range is capable of detecting UA levels marking the onset of health risk. The detection limit is comparable to those of Wayu et al. [18,19,20] of UA using a β-cyclodextrin-based electrocatalyst composite in place of the refluxed ZnO NPs.
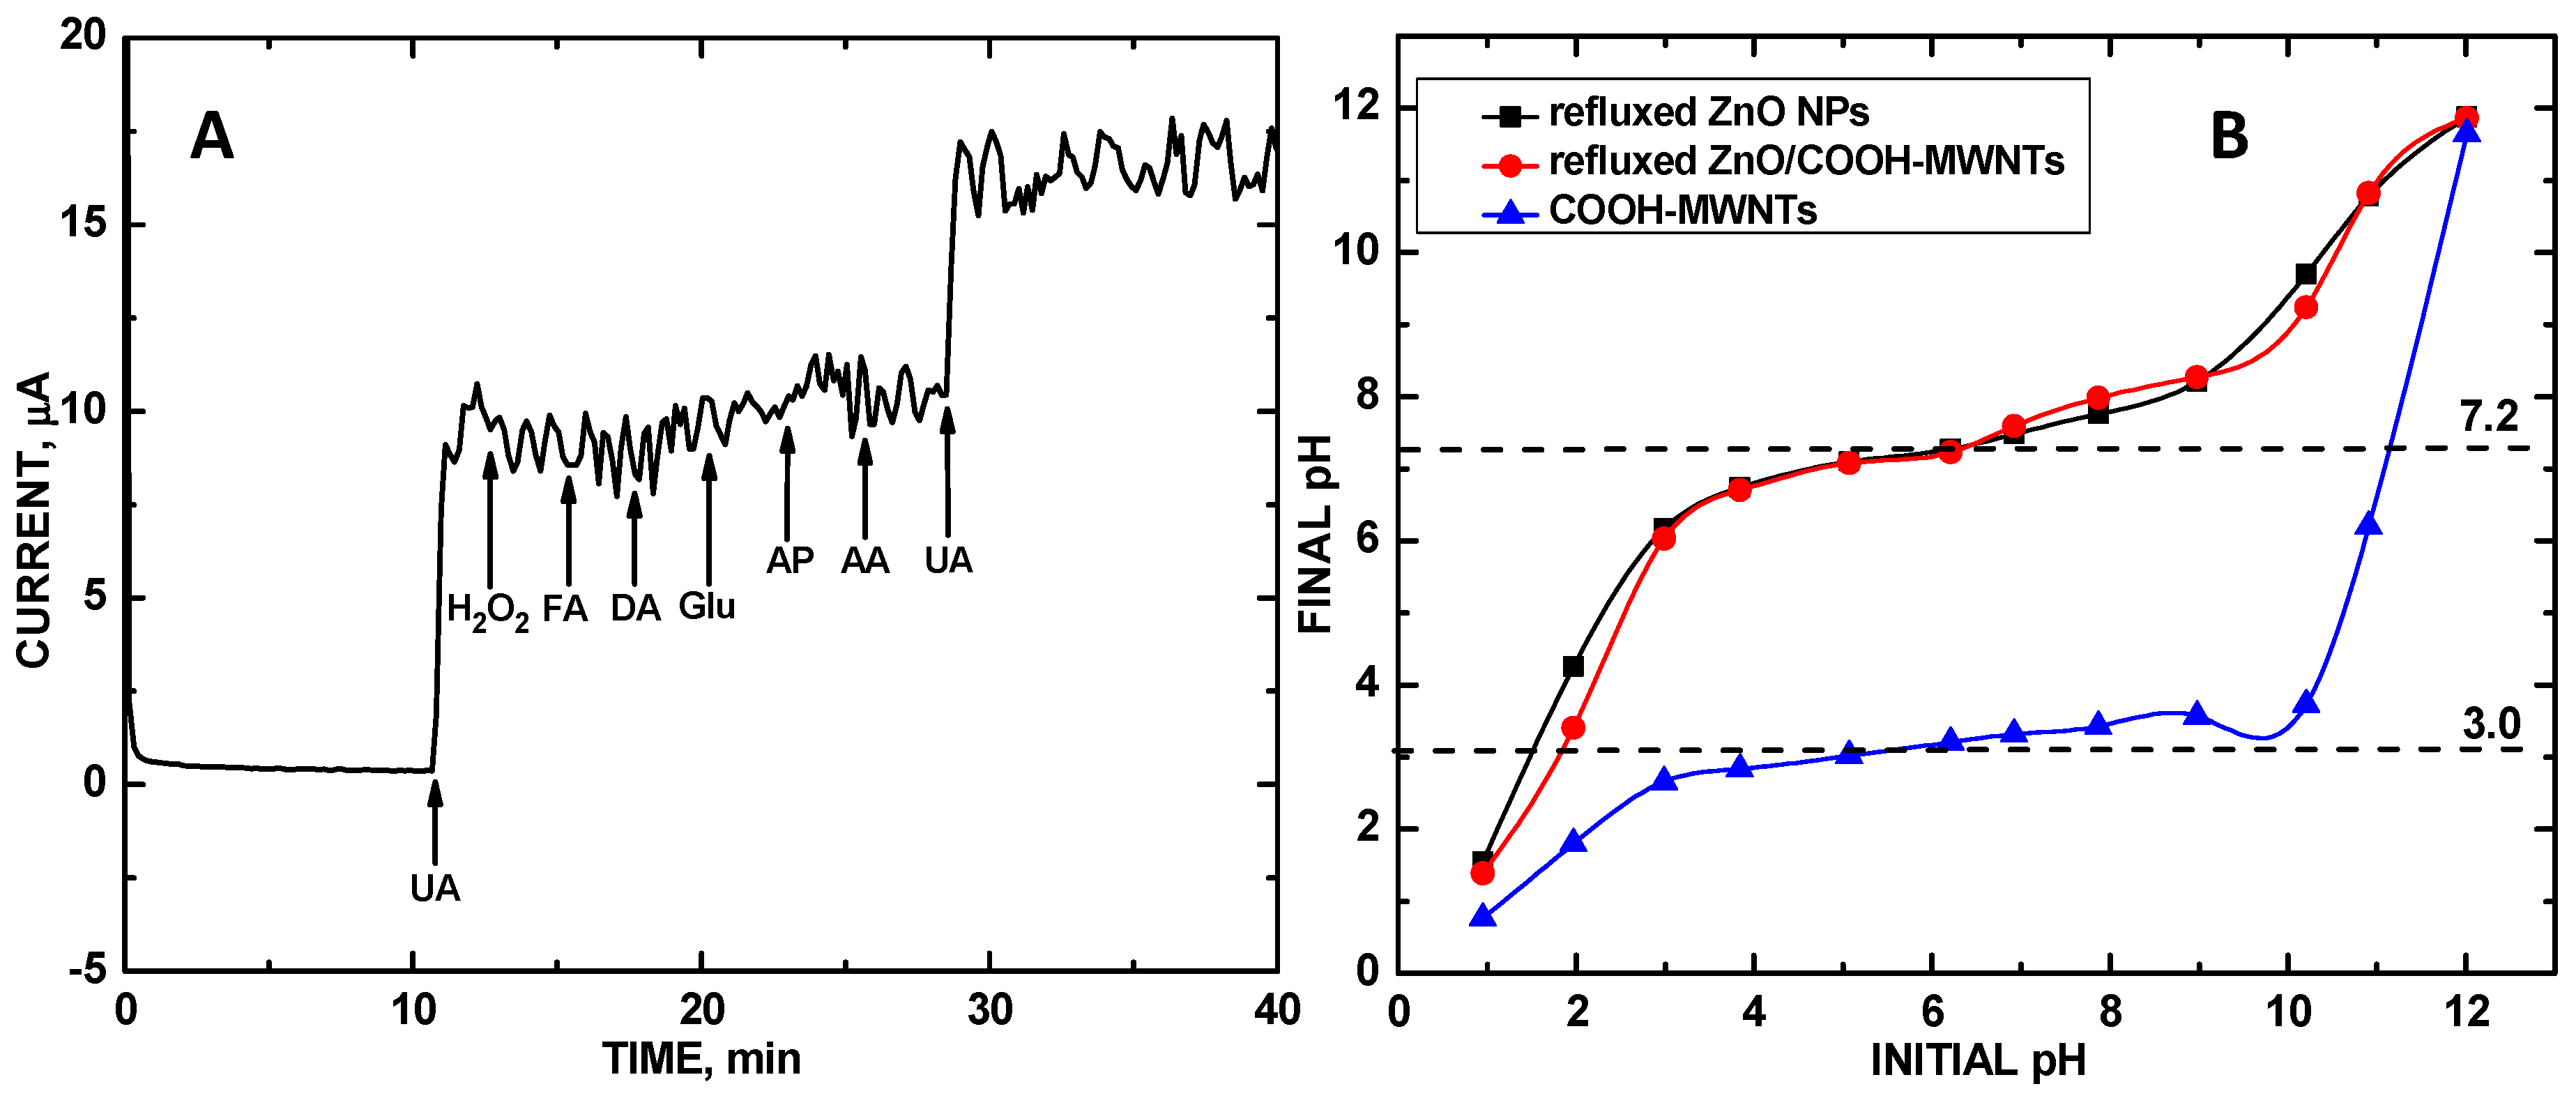
Figure 7A shows the chronoamperometry response of ZnO/COOH-MWNTs modified glassy carbon electrode at +0.577 V vs. Ag/AgCl upon addition of 100 μM concentrations of UA, H2O2, FA, DA, Glu, AP, AA and UA, respectively. The ZnO/COOH-MWNTs/GCE can selectively detect UA in the presence of FA, DA, AA, H2O2 and AP. Noteworthy is the fact that the introduction of 100 μM of UA at the 970 s and 2012 s time points resulted in an observed CA signal for UA, but addition of FA, AA, DA, H2O2, and AP at 1138, 1307, 1488, 1645 and 1805 s time points resulted in no signal, showing selectivity. The selectivity of the composite can be accounted for by the differing isoelectric points of these analyte molecules.
Figure 7B shows experimentally measured PZC values for the refluxed ZnO NPs, ZnO/COOH-MWNTs, and COOH-MWNTs were found at 7.2, 7.2 and 3.0, respectively, as denoted by the plateaus of the initial versus final pH plot. Separately, the ZnO NPs and COOH-MWNTs have vastly different PZCs. However, when these two are combined, the composite adopts the same PZC as that of the tethered ZnO NPs. If the COOH-MWNTs were to remain unchanged by the ZnO NPs, the composite and all analytes would adopt a positive surface charge, repelling them from the electrode surface. The underlying rationale explaining why the tethered metal oxide NPs alter the composites overall surface charge is unclear and is a subject for future study. Under pH = 7.0 conditions, the ZnO/COOH-MWNT composite adopts a slightly positive surface charge due to greater surface protonation than hydroxylation according to electrical double layer theory [49]. With this series of analytes examined for selectivity, the pKa values of UA, AA, FA, AP, H2O2, and DA are 5.75 [3], 4.10(pK1)/11.79(pK2) [50], 2.38(pK1)/3.46(pK2)/4.98(pK3)/8.08(pK4) [51], 11.08 [52], 11.62 [53], and 8.93 [53], respectively. It should be noted that for AA and FA under pH = 7.0 conditions, the monoionic urate and folate forms of these species dominate, leaving the lower pKa values to be the dominant ones to governing molecular charge in solution. The AP and H2O2 molecules would be repelled from the electrode surface since they adopt positive charge at pH = 7.0. Hence, the resulting ZnO/COOH-MWNT composite is selective against these analytes. The acids UA, AA and FA, on the other hand, would adopt negative charges at this same solution condition and be Coulombically attracted to the sensing electrode. Selectivity, in this case, is governed by differing oxidation potentials of the analytes. Oxidation potentials for voltammetric detection of AA and FA using ZnO-carbon nanotube composites have been observed at ca. +0.2 [54] and +0.9 V [55], respectively, which are well separated from that of UA oxidation at +0.577 V.
In summary, the results demonstrate a facile method for preparing an optimized ZnO/COOH-MWNT electrocatalyst material. Refluxed ZnO NPs were produced, followed by the attachment to COOH-MWNTs to form the ZnO/COOH-MWNT electrode composite for the selective and sensitive detection of UA, which had an effective measurement within the 100 to 900 μM concentration range. For the first time, we have shown the utility of monitoring the Raman G band to rapidly identify the surface produced by the cavitation process to create an optimized sensing composite. The optimized structure coincides with maximum electrocatalytic activity (Figure 5), with the most even size distribution of ZnO NPs tethered to the COOH-MWNT surface (Figure 3 and Figure 4) permitting rapid detection of UA that is both quantitative (Figure 6) and selective (Figure 7). UA can be selectively detected in the presence of FA, DA, AA, H2O2, and AP. RS analysis revealed diffusion-controlled processes occurring on the electrode surface. During fabrication, ZnO NPs were attached via cavitation process afforded by sonication, while at the same time the underlying carbon nanotube support was disentangled the ZnO/COOH-MWNTs, resulting in increased electroactive surface area and enhanced sensitivity for UA detection. The ideal sonication time (150 min) corresponded with the largest integrated Raman G band area, which can be readily monitored for optimization purposes.
A suggested preparation protocol would be to Raman scan an array of ZnO/COOH-MWNT composites prepared at different sonication times and the one yielding the largest G band would denote the optimum prepared composite for UA sensing. This approach of employing Raman analysis for electrocatalysis may well be universal for preparing various sensors for detecting and quantifying a host of other similar, pharmacologically related analytes.

Supplementary Materials

The following are available online at https://www.mdpi.com/2227-9040/6/4/65/s1, Figure S1: CV of 10 mM UA using only ZnO NPs, Figure S2: CVs and RS plot of 10 mM UA with 60 min composite, Figure S3: CVs and RS plot of 10 mM UA with 90 min composite, Figure S4: CVs and RS plot of 10 mM UA with 120 min composite, Figure S5: CVs and RS plot of 10 mM UA with 150 min composite, Figure S6: CVs and RS plot of 10 mM UA with 165 min composite, Figure S7: CVs and RS plot of 10 mM UA with 180 min refluxed composite, Figure S8: CVs and RS plot of 10 mM UA with 240 min composite.

Author Contributions

Conceptualization, C.C.C.; Data Curation, S.C.D., T.D. and R.R.P.; Software, C.C.C.; Validation, S.C.D. and R.R.P.; Formal Analysis, S.C.D., T.D. and C.C.C.; Investigation, S.C.D.; Resources, C.C.C.; Writing—Original Draft Preparation, S.C.D.; Writing—Review and Editing, S.C.D., R.R.P., T.D. and C.C.; Visualization, R.R.P. and C.C.C.; Supervision, C.C.C.; Project Administration, C.C.C.; Funding Acquisition, C.C.C.

Funding

This research received no external funding.

Acknowledgments

We gratefully acknowledge support for this work from the Faculty of Research and Creative Activity Committee (FRCAC), the Molecular Biosciences (MOBI) PhD program and the Office of Research Services (ORS) of Middle Tennessee State University. We thank Joyce Miller for assistance in obtaining the TEM data. S.C.D. thanks Mulugeta B. Wayu for helpful discussions that inspired this work.

Conflicts of Interest

The authors declare no conflict of interest.

References

  1. Perlstein, T.S.; Gumieniak, O.; Williams, G.H.; Sparrow, D.; Vokonas, P.S.; Gaziano, M.; Weiss, S.T.; Litonjua, A.A. Uric acid and the development of hypertension: The normative aging study. Hypertension 2006, 48, 1031–1036. [Google Scholar] [CrossRef] [PubMed]
  2. Usama, A.A.; El Din, S.; Salem, M.M.; Abdulazim, D.O. Uric acid in the pathogenesis of metabolic, renal, and cardiovascular diseases: A review. J. Adv. Res. 2017, 8, 537–548. [Google Scholar]
  3. Sakhaee, K. Epidemiology and clinical pathophysiology of uric acid kidney stones. J. Nephrol. 2014, 27, 241–245. [Google Scholar] [CrossRef] [PubMed] [Green Version]
  4. Kelley, W.N.; Rosenbloom, F.M.; Henderson, J.F.; Seegmiller, J.E. A specific enzyme defect in gout associated with overproduction of uric acid. Proc. Natl. Acad. Sci. USA 1967, 57, 1735–1739. [Google Scholar] [CrossRef] [PubMed]
  5. Luo, Y.-C.; Do, J.-S.; Liu, C.-C. An amperometric uric acid biosensor based on modified Ir-C electrode. Biosens. Bioelectron. 2006, 22, 482–488. [Google Scholar] [CrossRef] [PubMed]
  6. Perez-Ruiz, F.; Dalbeth, N.; Bardin, T. A review of uric acid, crystal deposition disease, and gout. Adv. Ther. 2015, 32, 31–41. [Google Scholar] [CrossRef] [PubMed]
  7. El Ridi, R.; Tallima, H. Physiological functions and pathogenic potential of uric acid: A review. J. Adv. Res. 2017, 8, 487–493. [Google Scholar] [CrossRef] [PubMed]
  8. Zhang, W.; Doherty, M.; Bardin, T.; Pascual, E.; Barskova, V.; Conaghan, P.; Gerster, J.; Jacobs, J.; Leeb, B.; Lioté, F.; et al. EULAR evidence based recommendations for gout. Part II: Management. Report of a task force of the EULAR standing committee for international clinical studies including therapeutics (ESCISIT). Ann. Rheum. Dis. 2006, 65, 1312–1324. [Google Scholar] [CrossRef] [PubMed]
  9. Khanna, D.; Fitzgerald, J.D.; Khanna, P.P.; Bae, S.; Singh, M.K.; Neogi, T.; Pillinger, M.H.; Merill, J.; Lee, S.; Prakash, S.; et al. 2012 American College of Rheumatology Guidelines for Management of Gout. Part 1: Systematic Nonpharmacologic and Pharmacologic Therapeutic Approaches to Hyperuricemia. Arthritis Care Res. 2012, 64, 1431–1446. [Google Scholar] [CrossRef] [PubMed]
  10. Stack, A.G.; Hanley, A.; Casserly, L.F.; Cronin, C.J.; Abdalla, A.A.; Kernan, T.J.; Murthy, B.V.R.; Hegarty, A.; Hannigan, A.; Nguyen, H.T. Independent and conjoint associations of gout and hyperuricemia with total and cardiovascular mortality. J. Med. 2013, 106, 647–658. [Google Scholar]
  11. Choi, H.K.; Curhan, G. Independent impact of gout on mortality and risk for coronary heart disease. Circulation 2007, 107, 894–900. [Google Scholar] [CrossRef] [PubMed]
  12. Krishnan, E.; Svendsen, K.; Neaton, J.D. Long-term cardiovascular mortality among middle-aged men with gout. Arch. Intern. Med. 2008, 168, 1104–1110. [Google Scholar] [CrossRef] [PubMed]
  13. Kim, K.M.; Henderson, G.N.; Ouyang, X.; Frye, R.F.; Sautin, Y.Y.; Feig, D.I.; Johnson, R.J. A sensitive and specific liquid chromatography-tandem mass spectrometry method for the determination of intracellular and extracellular uric acid. J. Chromatogr. B 2009, 877, 2032–2038. [Google Scholar] [CrossRef] [PubMed]
  14. Wang, J. Carbon-nanotube based electrochemical biosensors: A review. Electroanalysis 2005, 17, 7–14. [Google Scholar] [CrossRef]
  15. Erden, P.E.; Kiliç, E. A review of enzymatic uric acid biosensors based on amperometric detection. Talanta 2013, 107, 312–323. [Google Scholar] [CrossRef] [PubMed]
  16. Wayu, M.B.; Spidle, R.T.; Devkota, T.; Deb, A.K.; Delong, R.K.; Ghosh, K.C.; Wanekaya, A.K.; Chusuei, C.C. Morphology of hydrothermally synthesized ZnO nanoparticles tethered to carbon nanotubes affects electrocatalytic activity for H2O2 detection. Electrochim. Acta 2013, 97, 99–104. [Google Scholar] [CrossRef] [PubMed]
  17. Conway, G.E.; Lamberston, R.H.; Schwarzmann, M.A.; Pannell, M.J.; Kerins, H.W.; Rubenstien, K.J.; Dattelbaum, J.D.; Leopold, M.C. Layer-by-Layer desgin and optimization of xerogel-based amperometric first generation biosensors of uric acid. J. Electroanal. Chem. 2016, 775, 135–145. [Google Scholar] [CrossRef]
  18. Wayu, M.B.; DiPasquale, L.T.; Schwarzmann, M.A.; Gillspie, S.D.; Leopold, M.C. Electropolymerization of ß-cyclodextrin onto multi-walled carbon nanotube composite films for enhanced selective detection of uric acid. J. Electroanal. Chem. 2016, 783, 192–200. [Google Scholar] [CrossRef]
  19. Wayu, M.B.; Pannell, M.J.; Leopold, M.C. Layered xerogel films incorporating monolayer-protected cluster networks on platinum-black-modified electrodes for enhanced sensitivity in first-generation uric acid biosensing. ChemElectroChem 2016, 3, 1245–1252. [Google Scholar] [CrossRef]
  20. Wayu, M.B.; Schwarzmann, M.A.; Gillespie, S.D.; Leopold, M.C. Enzyme-free uric acid electrochemical sensors using ß-cyclodextrin-modified carboxylic acid-functionalized carbon nanotubes. J. Mater. Sci. 2017, 52, 6050–6062. [Google Scholar] [CrossRef]
  21. Donniah, S.K.; Periakarruppan, P.; Vellaichamy, B. New electrochemical sensor based on a silver-doped iron oxide nanocomposite coupled with polyaniline and its sensing application for picomolar-level detection of uric acid in human blood and urine samples. J. Phys. Chem. B 2018, 122, 3037–3046. [Google Scholar]
  22. Wu, C.; Qiao, X.; Chen, J.; Wang, H.; Tan, F.; Li, S. A novel chemical route to prepare ZnO nanoparticles. Mater. Lett. 2006, 60, 1828–1832. [Google Scholar] [CrossRef]
  23. Bai, H.P.; Lu, X.X.; Yang, Y.H. Hydrogen peroxide biosensor based on electrodeposition of zinc oxide nanoflowers onto carbon nanotubes film electrode. Chin. Chem. Lett. 2008, 19, 314–318. [Google Scholar] [CrossRef]
  24. Baig, N.; Rana, A.; Kawde, A.-N. Modified electrodes for selective detection of biomolecules. Electroanalysis 2018, 30, 2551–2574. [Google Scholar] [CrossRef]
  25. Xing, Y. Synthesis and electrochemical characterization of uniformly-dispersed high loading Pt nanoparticles on sonochemically-treated carbon nanotubes. J. Phys. Chem. B 2004, 108, 19255–19259. [Google Scholar] [CrossRef]
  26. Xing, Y.; Li, L.; Chusuei, C.C.; Hull, R.V. Sonochemical oxidation of multiwalled carbon nanotubes. Langmuir 2005, 21, 4185–4190. [Google Scholar] [CrossRef] [PubMed]
  27. Hull, R.V.; Li, L.; Xing, Y.; Chusuei, C.C. Pt nanoparticle binding on functionalized multiwalled carbon nanotubes. Chem. Mater. 2006, 18, 1780–1788. [Google Scholar] [CrossRef]
  28. Deb, A.K.; Das, S.C.; Saha, A.; Wayu, M.B.; Marksberry, M.H.; Baltz, R.J.; Chusuei, C.C. Ascorbic acid, acetaminophen, and hydrogen peroxide detection using a dendrimer-encapsulated Pt nanoparticle carbon nanotube composite. J. Appl. Electrochem. 2016, 46, 289–298. [Google Scholar] [CrossRef]
  29. Fang, B.; Zhang, C.; Zhang, G. A novel hydrazine electrochemical sensor based on a carbon nanotube-wired ZnO nanoflower-modified electrode. Electrochim. Acta 2009, 55, 178–182. [Google Scholar] [CrossRef]
  30. Park, J.; Regalbuto, J.R. A Simple, Accurate Determination of Oxide PZC and the Strong Buffering Effect of Oxide Surfaces at Incipient Wetness. J. Colloid Interface Sci. 1995, 175, 239–252. [Google Scholar] [CrossRef]
  31. McPhail, M.R.; Sells, J.A.; He, Z.; Chusuei, C.C. Charging Nanowalls: Adjusting the Carbon Nanotube Isoelectric Point via Surface Chemical Functionalization. J. Phys. Chem. C 2009, 113, 14102–14109. [Google Scholar] [CrossRef]
  32. Chusuei, C.C.; Wayu, M. Characterizing functionalized carbon nanotubes for improved fabrication in aqueous solution environments. In Electronic Properties of Carbon Nanotubes/Book 5; Marulanda, J.M., Ed.; InTech: Rijeka, Croatia, 2011; pp. 55–66. [Google Scholar]
  33. Deb, A.K.; Chusuei, C.C. Aqueous solution surface chemistry of carbon nanotubes. In Physical and Chemical Properties of Carbon Nanotubes; Suzuki, S., Ed.; InTech: Rijeka, Croatia, 2013; pp. 263–283. [Google Scholar]
  34. Chusuei, C.C.; Wu, C.-H.; Mallavarapu, S.; Stephen Hou, F.Y.; Hsu, C.-M.; Winiarz, J.G.; Aronstam, R.S.; Huang, Y.-W. Cytotoxicity in the age of nano: The role of fourth period transition metal oxide nanoparticle physicochemical properties. Chem.-Biol. Interact. 2013, 206, 319–326. [Google Scholar] [CrossRef] [PubMed]
  35. Chusuei, C.C.; Wu, C.-H.; Mallavarapu, S.; Stephen Hou, F.Y.; Hsu, C.-M.; Aronstam, R.S.; Huang, Y.-W. Physicochemical structure effects on metal oxide nanoparticulate cytotoxicity. In Recent Progress in Surface and Colloid Chemistry with Biological Applications; Wang, C., Hauserman, B., Eds.; American Chemical Society: Washington, DC, USA, 2015; Volume 1215, pp. 137–155. [Google Scholar]
  36. Weiler, M.; Sattel, S.; Jung, K.; Ehrhardt, H.; Veerasamy, V.; Robertson, J. Highly tetrahedral, diamond-like amorphous hydrogenated carbon prepared from a plasma beam source. Appl. Phys. Lett. 1994, 64, 2797–2799. [Google Scholar] [CrossRef]
  37. McCafferty, E.; Wightman, J.P. Determination of the concentration of surface hydroxyl groups on metal oxide films by a quantitative XPS method. Surf. Interface Anal. 1998, 26, 549–564. [Google Scholar] [CrossRef]
  38. Haber, J.; Stoch, J.; Ungier, L. X-ray photoelectron spectra of oxygen in oxides of cobalt, nickel, iron, and zinc. J. Electron Spectrosc. Relat. Phenom. 1976, 9, 459–467. [Google Scholar] [CrossRef]
  39. Kanik, F.E.; Kolb, M.; Timur, S.; Bahadir, M.; Toppare, L. An amperometric acetylcholine biosensor based on a conducting polymer. Int. J. Biol. Macromol. 2013, 59, 111–118. [Google Scholar] [CrossRef] [PubMed]
  40. Langer, D.W.; Vesely, C.J. Electronic core levels of zinc chalcogenides. Phys. Rev. B 1970, 2, 4885–4892. [Google Scholar] [CrossRef]
  41. Strohmeier, B.R.; Hercules, D.M. Surface spectroscopic characterization of the interaction between zinc ions and γ-alumina. J. Catal. 1984, 86, 266–279. [Google Scholar] [CrossRef]
  42. Wayu, M.B.; King, J.E.; Johnson, J.A.; Chusuei, C.C. A zinc oxide carbon nanotubed based sensor for in situ monitoring of hydrogen peroxide in swimming pools. Electroanalysis 2015, 27, 2552–2558. [Google Scholar] [CrossRef]
  43. Zanello, P. Inorganic Electrochemistry: Theory, Practice and Application; Royal Society of Chemistry: London, UK, 2003. [Google Scholar]
  44. Dresselhaus, M.S.; Dresselhaus, G.; Avouris, P. Carbon Nanotubes: Synthesis, Structure, Properties and Applications; Springer: New York, NY, USA, 2001. [Google Scholar]
  45. Lehman, J.H.; Terrones, M.; Mansfield, E.; Hurst, K.E.; Meunir, V. Evaluating the characteristics of multiwall carbon nanotubes. Carbon 2011, 49, 2581–2602. [Google Scholar] [CrossRef]
  46. Kim, J.H.; Hwang, J.Y.; Hwang, H.R.; Kim, H.S.; Lee, J.H.; Seo, J.W.; Shin, U.S.; Lee, S.H. Simple and cost-effective method of highly conductive and elastic carbon nanotube/polydimethylsiloxane composite for wearable electronics. Sci. Rep. 2018, 8, 1375. [Google Scholar] [CrossRef] [PubMed] [Green Version]
  47. Yamanaka, H.; Togashi, R.; Hakoda, M.; Terai, C.; Kashiwazaki, S.; Dan, T.; Kamatani, N. Optimum range of serum urate concentrations to minimize risk of gouty attacks during anti-hyperuricemic treatment. Adv. Exp. Med. Biol. 1998, 431, 13–18. [Google Scholar] [PubMed]
  48. Kuo, C.C.; Weaver, V.; Fadrowski, J.J.; Lin, Y.S.; Guallar, E.; Navas-Acien, A. Arsenic exposure, hyperuricemia, and gout in US adults. Environ. Int. 2015, 76, 32–40. [Google Scholar] [CrossRef] [PubMed]
  49. Sposito, G. On points of zero charge. Environ. Sci. Technol. 1998, 32, 2815–2819. [Google Scholar] [CrossRef]
  50. Lide, D.R. (Ed.) CRC Handbook of Chemistry and Physics, 71st ed; CRC Press: Boca Raton, FL, USA, 1990. [Google Scholar]
  51. Szakács, Z.; Noszál, B. Determination of dissociation constants of folic acid, methotrexate, and other photolabile pterdines by pressure-assisted capillary electrophoresis. Electrophoresis 2006, 27, 3399–3409. [Google Scholar] [CrossRef] [PubMed]
  52. Zhang, T.; Lang, Q.; Zeng, L.; Li, T.; Wei, M.; Liu, A. Substituent effect on the oxidation peak potentials of phenol derivatives at ordered mesoporous carbons modified electrode and its application in determination of acidity coefficients (pKa). Electrochim. Acta 2014, 115, 283–289. [Google Scholar] [CrossRef]
  53. Perrin, D.D. Ionization Constants of Inorganic Acids and Bases in Aqueous Solution, 2nd ed.; Pergamon: Oxford, UK, 1982. [Google Scholar]
  54. Ngai, K.S.; Tan, W.T.; Zainal, Z.; Zawawi, R.M.; Zidan, M. Voltammetry detection of ascorbic acid at glassy carbon electrode modified by single-walled carbon nanotube/zinc oxide. Int. J. Electrochem. Sci. 2013, 8, 10557–10567. [Google Scholar]
  55. Raoof, J.B.; Teymoori, N.; Khalilzadeh, M.A.; Ojani, R. A high sensitive electrochemical nanosensor for simultaneous determination of glutathione, NADH and folic acid. Mater. Sci. Eng. C 2015, 47, 77–84. [Google Scholar] [CrossRef] [PubMed]
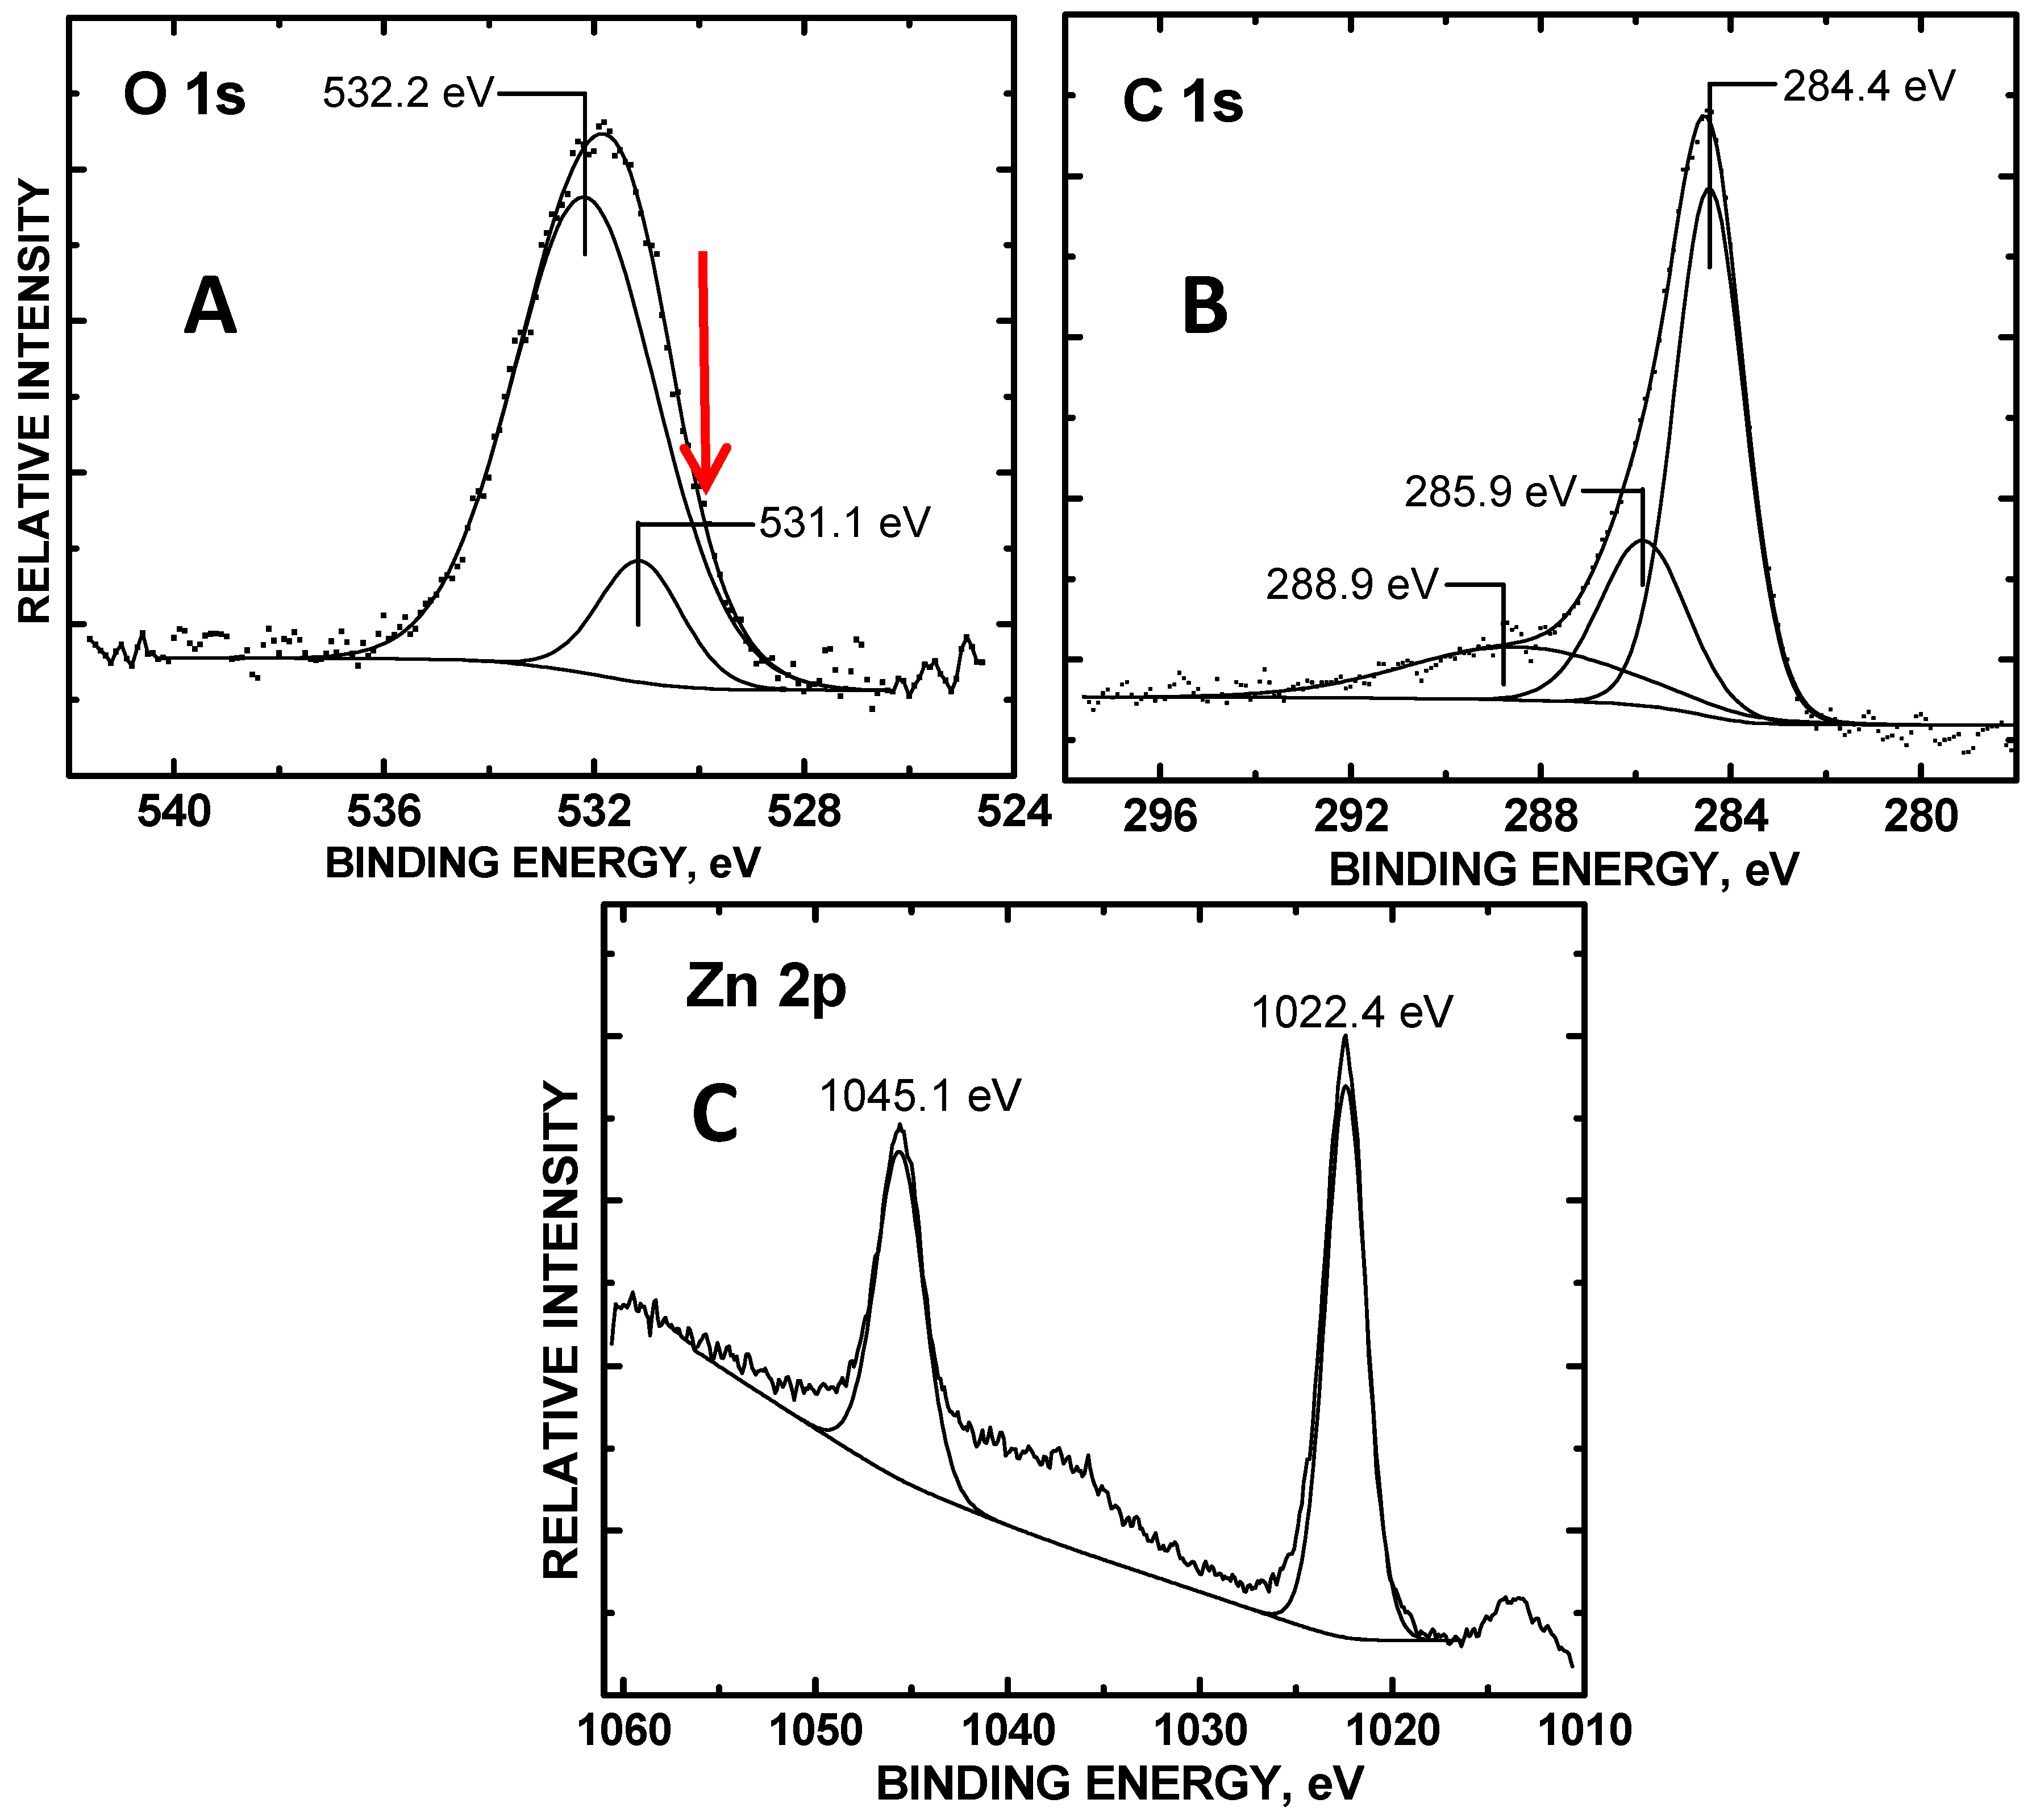
Figure 1. XPS narrow scans of the (A) O 1s, (B) C 1s, and (C) Zn 2p orbitals of the 150 sonicated refluxed ZnO/carboxylic acid functionalized multi-walled carbon nanotube (COOH-MWNT) composite. The red arrow in (A) denotes the BE position of ZnO oxidation state.
Chemosensors 06 00065 g001
Figure 2. Cyclic voltammetry (CV) of 10 mM UA in PBS (pH = 7.0) from ZnO/COOH-MWNT composites produced at sonication times of (A) 0 (control), 60, 90, and 120 min; and (B) 150, 165, and 240 min. Scan rate: 50 mV·s−1.
Chemosensors 06 00065 g002
Figure 3. TEM images of refluxed ZnO/COOH-MWNTs nanocomposites produced at (A) 60, (B) 120, (C) 150, and (D) 165 min sonication times. The scale bar denotes a 100 nm length.
Chemosensors 06 00065 g003
Figure 4. Size histograms of tethered ZnO NPs tethered to the COOH-MWNT surface of the MWNTs, produced at (A) 60, (B) 120 min, (C) 150, and (D) 165 min sonication times.
Chemosensors 06 00065 g004
Figure 5. (A) Stack plot of Raman (raw) data with offset for 60, 120, 150 and 165 min showing diamond D and G bands, respectively; (B) potentiostat current of 10 mM UA in PBS (pH = 7.0) from CVs at +0.577 V vs. Ag/AgCl (left-hand axis) and Raman G band integrated peak area (right-hand axis).
Chemosensors 06 00065 g005
Figure 6. CA response of ZnO/COOH-MWNTs in phosphate buffer solutions (PBS), upon addition of UA from 100–900 μM; inset shows calibration curve.
Chemosensors 06 00065 g006
Figure 7. (A) CA response of the Nafion/ZnO/COOH-MWNTs/GCE at 0.577 V vs. Ag/AgCl electrode upon 100 μM additions of UA, FA, AA, DA, H2O2, AP, and UA, respectively; (B) point-of-zero (PZC) values of refluxed ZnO NPs (-■-), refluxed ZnO/COOH-MWNTs (-●-) and COOH-MWNTs (-▲-).
Chemosensors 06 00065 g007
Table 1. CV current peak heights and voltages of ZnO/COOH-MWNTs.
Sonication Time, min06090120150165180240
V0.5000.4990.6230.5710.5240.5200.5340.524
μA
relative area
36
0
149
1.00
233
1.56
281
1.87
355
2.38
153
1.07
133
0.892
106
0.698