Article

Influence of Water Molecules on the Detection of Volatile Organic Compounds (VOC) Cancer Biomarkers by Nanocomposite Quantum Resistive Vapor Sensors vQRS

by
Abhishek Sachan
1,2,
Mickaël Castro
1,
Veena Choudhary
2 and
Jean-Francois Feller
1,*
1
Smart Plastics Group, Bretagne Loire University (UBL), IRDL CNRS 6027-UBS, 56622 Lorient, France
2
Centre for Polymer Science & Engineering, Indian Institute of Technology (IIT), Delhi 110016, India
*
Author to whom correspondence should be addressed.
Chemosensors 2018, 6(4), 64; https://doi.org/10.3390/chemosensors6040064
Submission received: 28 October 2018 / Revised: 2 December 2018 / Accepted: 5 December 2018 / Published: 10 December 2018
(This article belongs to the Special Issue Electronic nose’s, Machine Olfaction and Electronic Tongue’s)

Abstract

:
The anticipated diagnosis of various fatal diseases from the analysis of volatile organic compounds (VOC) biomarkers of the volatolome is the object of very dynamic research. Nanocomposite-based quantum resistive vapor sensors (vQRS) exhibit strong advantages in the detection of biomarkers, as they can operate at room temperature with low consumption and sub ppm (part per million) sensitivity. However, to meet this application they need to detect some ppm or less amounts of biomarkers in patients’ breath, skin, or urine in complex blends of numerous VOC, most of the time hindered by a huge amount of water molecules. Therefore, it is crucial to analyze the effects of moisture on the chemo-resistive sensing behavior of carbon nanotubes based vQRS. We show that in the presence of water molecules, the sensors cannot detect the right amount of VOC molecules present in their environment. These perturbations of the detection mechanism are found to depend on the chemical interactions between water and other VOC molecules, but also on their competitive absorption on sensors receptive sites, located at the nanojunctions of the conductive architecture. This complex phenomenon studied with down to 12.5 ppm of acetone, ethanol, butanone, toluene, and cyclohexane mixed with 100 ppm of water was worth to investigate in the prospect of future developments of devices analysing real breath samples in which water can reach a concentration of 6%.

1. Introduction

Disease detection and health monitoring by exhaled breath analysis has recently gained huge attention because of its various advantages such as non-invasiveness [1,2,3,4,5,6,7,8,9]. Volatile organic compounds (VOC) are released in breath by venous blood in which they are produced as by-products of metabolic reactions, diseased organs, or infections inside a patient [10,11,12,13,14]. Among all gas molecules produced by the body, the volatolome, some VOC are typical of diseases and called biomarkers. These VOC are sometimes difficult to detect directly from blood analysis [15], therefore breath analysis provides a quick and convenient tool to diagnose diseases such as asthma, lung cancer, inflammatory diseases, and stomach and liver abnormalities [16,17,18,19,20]. However, exhaled breath contains large amounts of nitrogen, oxygen, carbon dioxide and water vapors, and very small fractions of VOC at the ppm (part per million) to ppb (parts per billion) level. Different techniques can be used to sense such low amounts of vapors to monitor health [21,22,23]. Among all methods available, conductive polymer nanocomposites (CPC) sensors [24,25,26,27,28], optical sensors [29,30,31], metal oxide based gas sensors [31,32,33,34,35], and biosensors [36,37,38] have gained popularity for vapor sensing applications and in particular e-noses. In the literature, a special attention is paid to the collection of breath [39,40,41,42] and the detection is mostly done at ppm or ppb concentrations, which more or less satisfies the final objective to develop an e-nose from the assembly of such sensors in array, but in most sensing experiments VOC are tested alone. However, in a real case scenario the VOC are dispersed in huge amounts of water vapors in breath. The amount of water vapor in breath is also an important issue for mechanically ventilated patients for whom an active humidifier is used [21], that varies the amount of water in their breath. To facilitate the analysis of breath biomarkers, despite the presence of variable amounts of water, it can be removed by condensation or pre-concentration using different methods [43,44,45,46]. However, many water-soluble VOC can also be lost in significant amounts, which can make very difficult the analysis of data and complicate the disease prediction. Therefore, it appears useful to understand how a large amount of water molecules can affect the analysis of small concentrations of VOC biomarkers, by a sensor array for breath analysis application [22,47].
In the present study, we have explored some effects of water vapor on the chemo-resistive behavior of a set of different vQRS, exposed to different types of VOC having different polarities and present in exhaled breath. Water molecules can interact with analytes before impacting the transducer but also compete with them upon adsorption in the conductive polymer nanocomposite (CPC) layer and during their diffusion to the nano-junctions of the conducting architecture [48,49,50,51,52]. Polar VOC can be soluble in water at different degrees and sometimes can create hydrogen bondings [53,54,55]. Inversely, non-polar VOC molecules can more freely move within the VOC mixture dominated by water molecules and diffuse to the adsorption sites, which creates different competition pattern [56]. In order to investigate these different aspects, expected to govern the characteristics of the chemo-resistive response of polymer nanocomposite based vQRS, they have been exposed to mixtures of water vapor and VOC mixed in various proportions. Moreover to get closer to the composition of real breath, i.e., only few ppm of VOC were dispersed in thousand ppm of water molecules [57].

2. Experimental Details

2.1. Materials for Sensors’ Selectivity Tailoring

Multi-walled carbon nanotubes (MWCNT), later named CNT in the paper, were NC7000 kindly supplied by Nanocyl SA (Belgium), which are produced via the catalytic carbon vapor deposition (CCVD) process. This grade of MWCNT has a purity of 90%, an average diameter of 9.5 nm, and an average length of 1.5 µm. CNT were used as received without any further purification. The different polymers used for the CPC matrix, which main characteristics are recalled in Table 1, were purchased from Acros Organics (France), for the poly(vinylpyrrolidone) PVP and the amorphous poly(styrene) aPS and from Sigma Aldrich for the amorphous poly(propylene) aPP.
All solvents, chloroform, acetone, ethanol, 2-butanone, cyclohexane, and toluene (see Table 2 for more characteristics), were purchased from Sigma Aldrich and used as received.

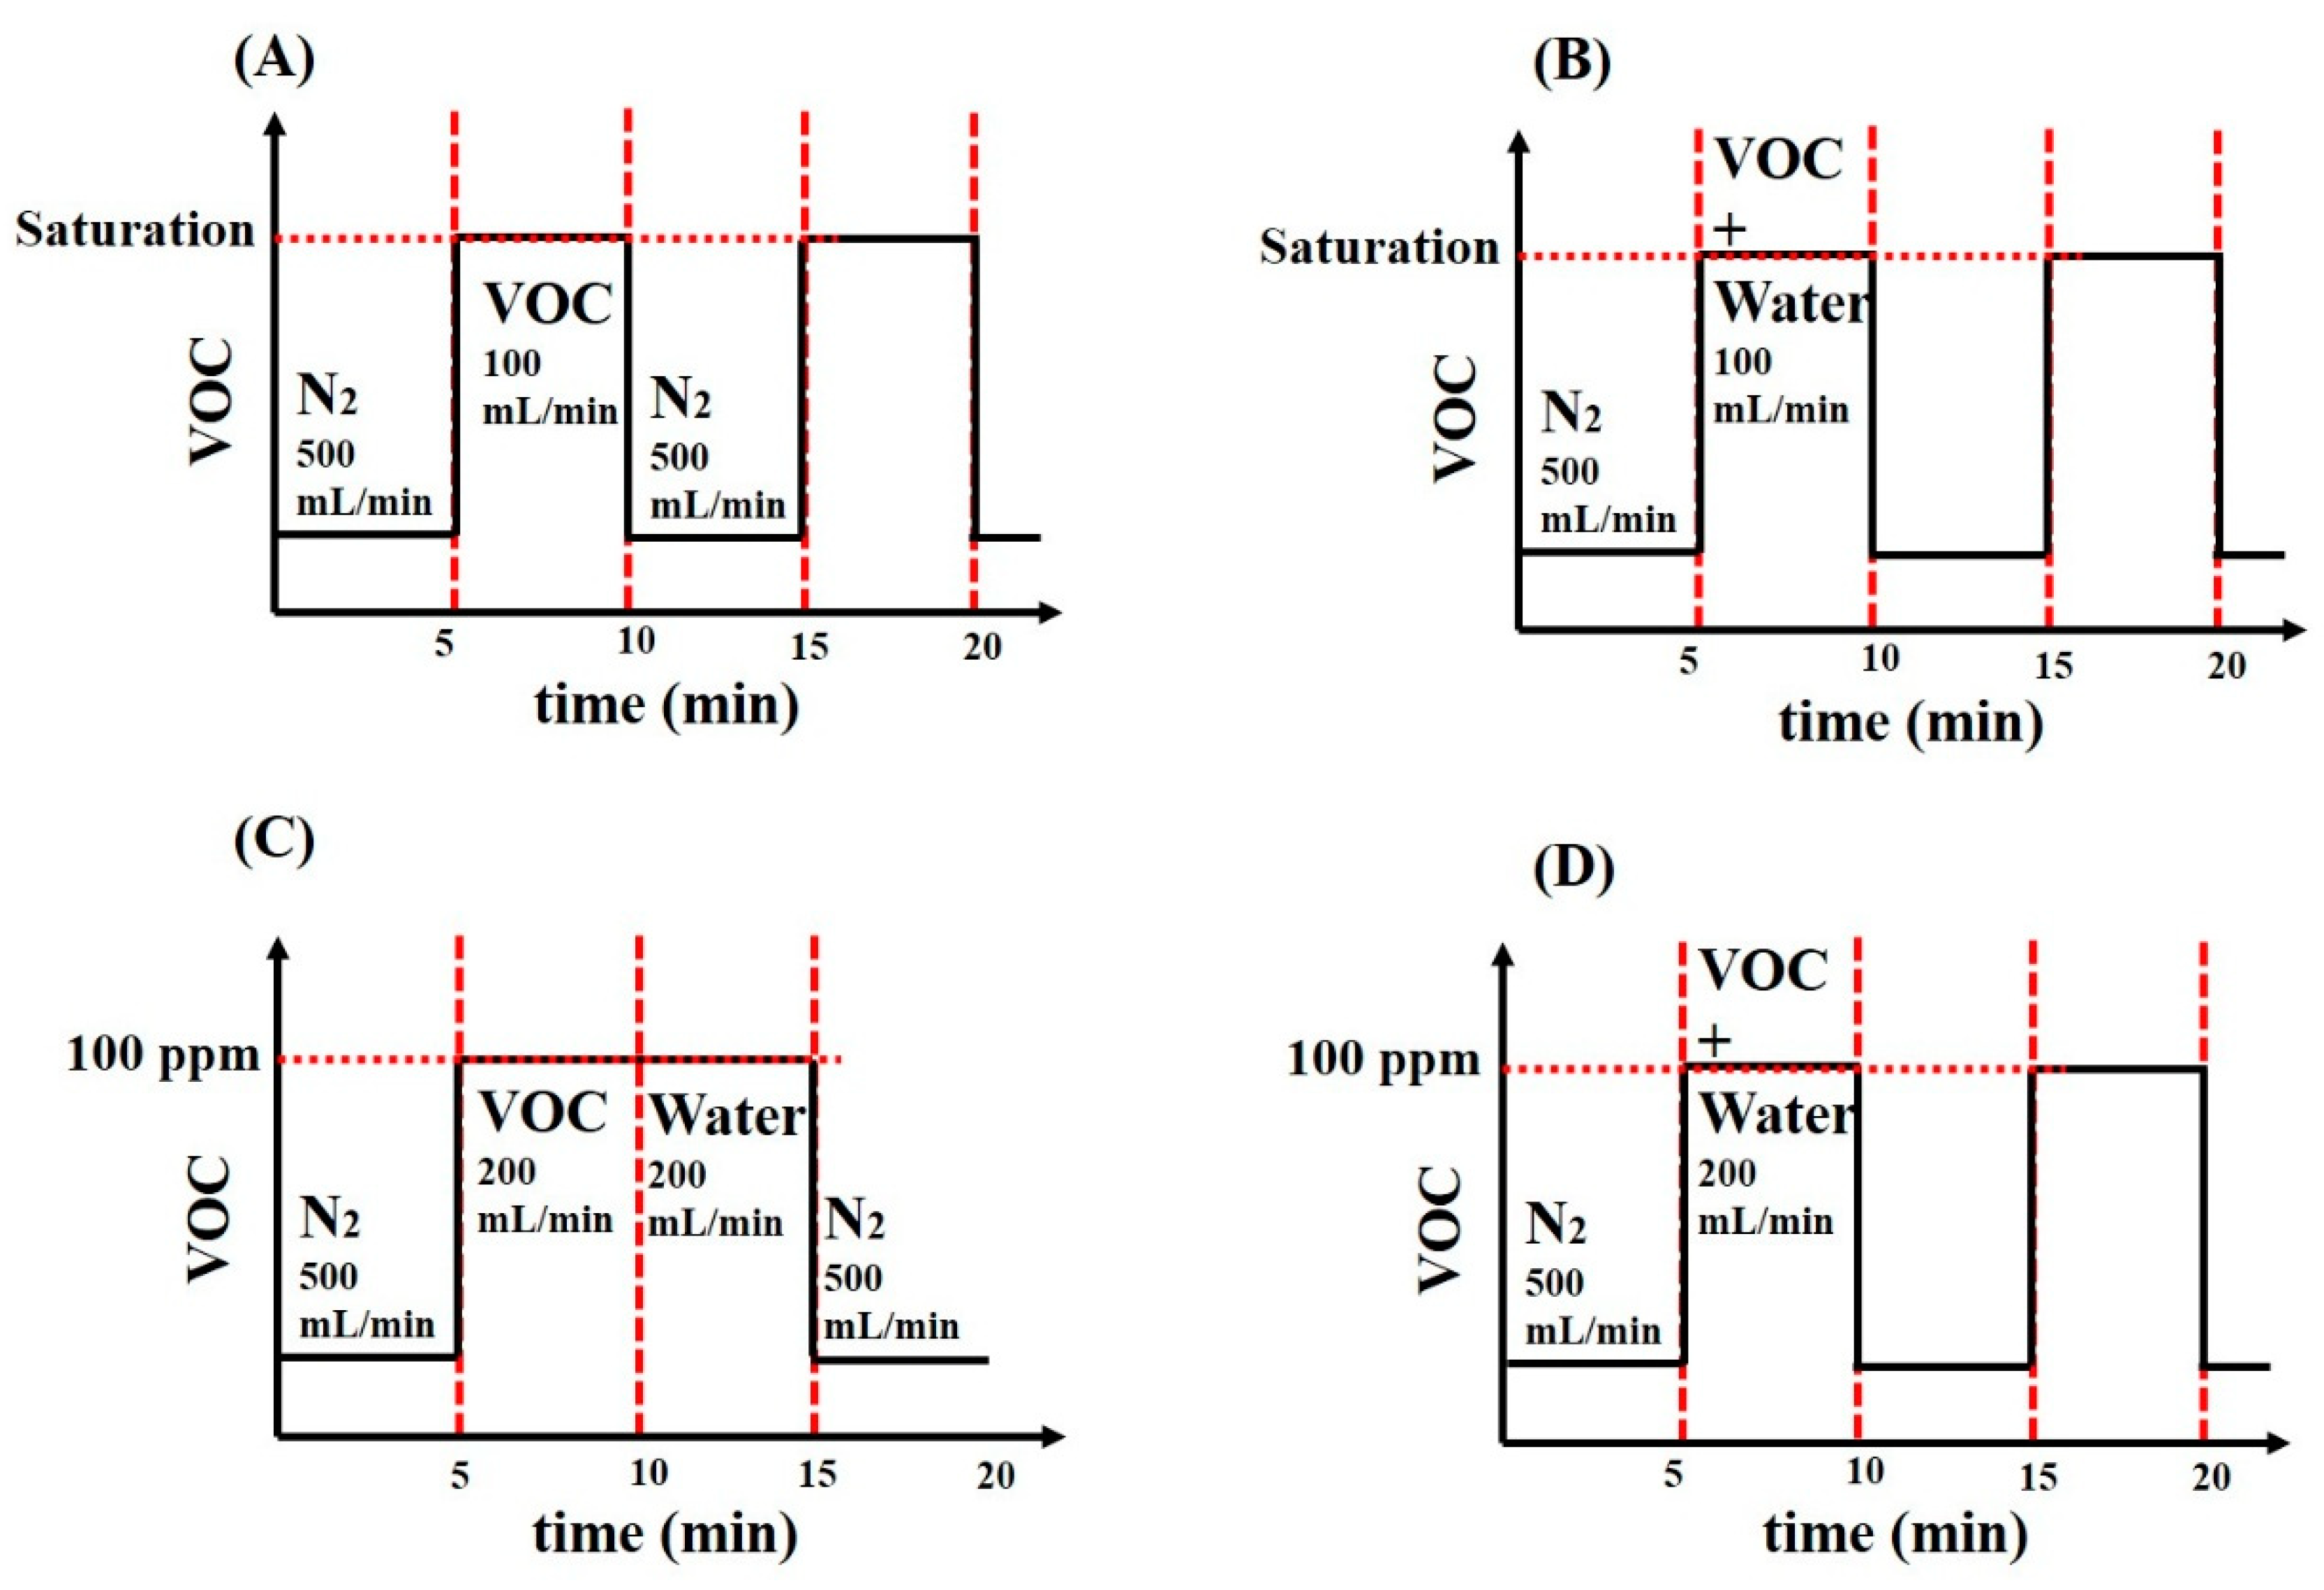
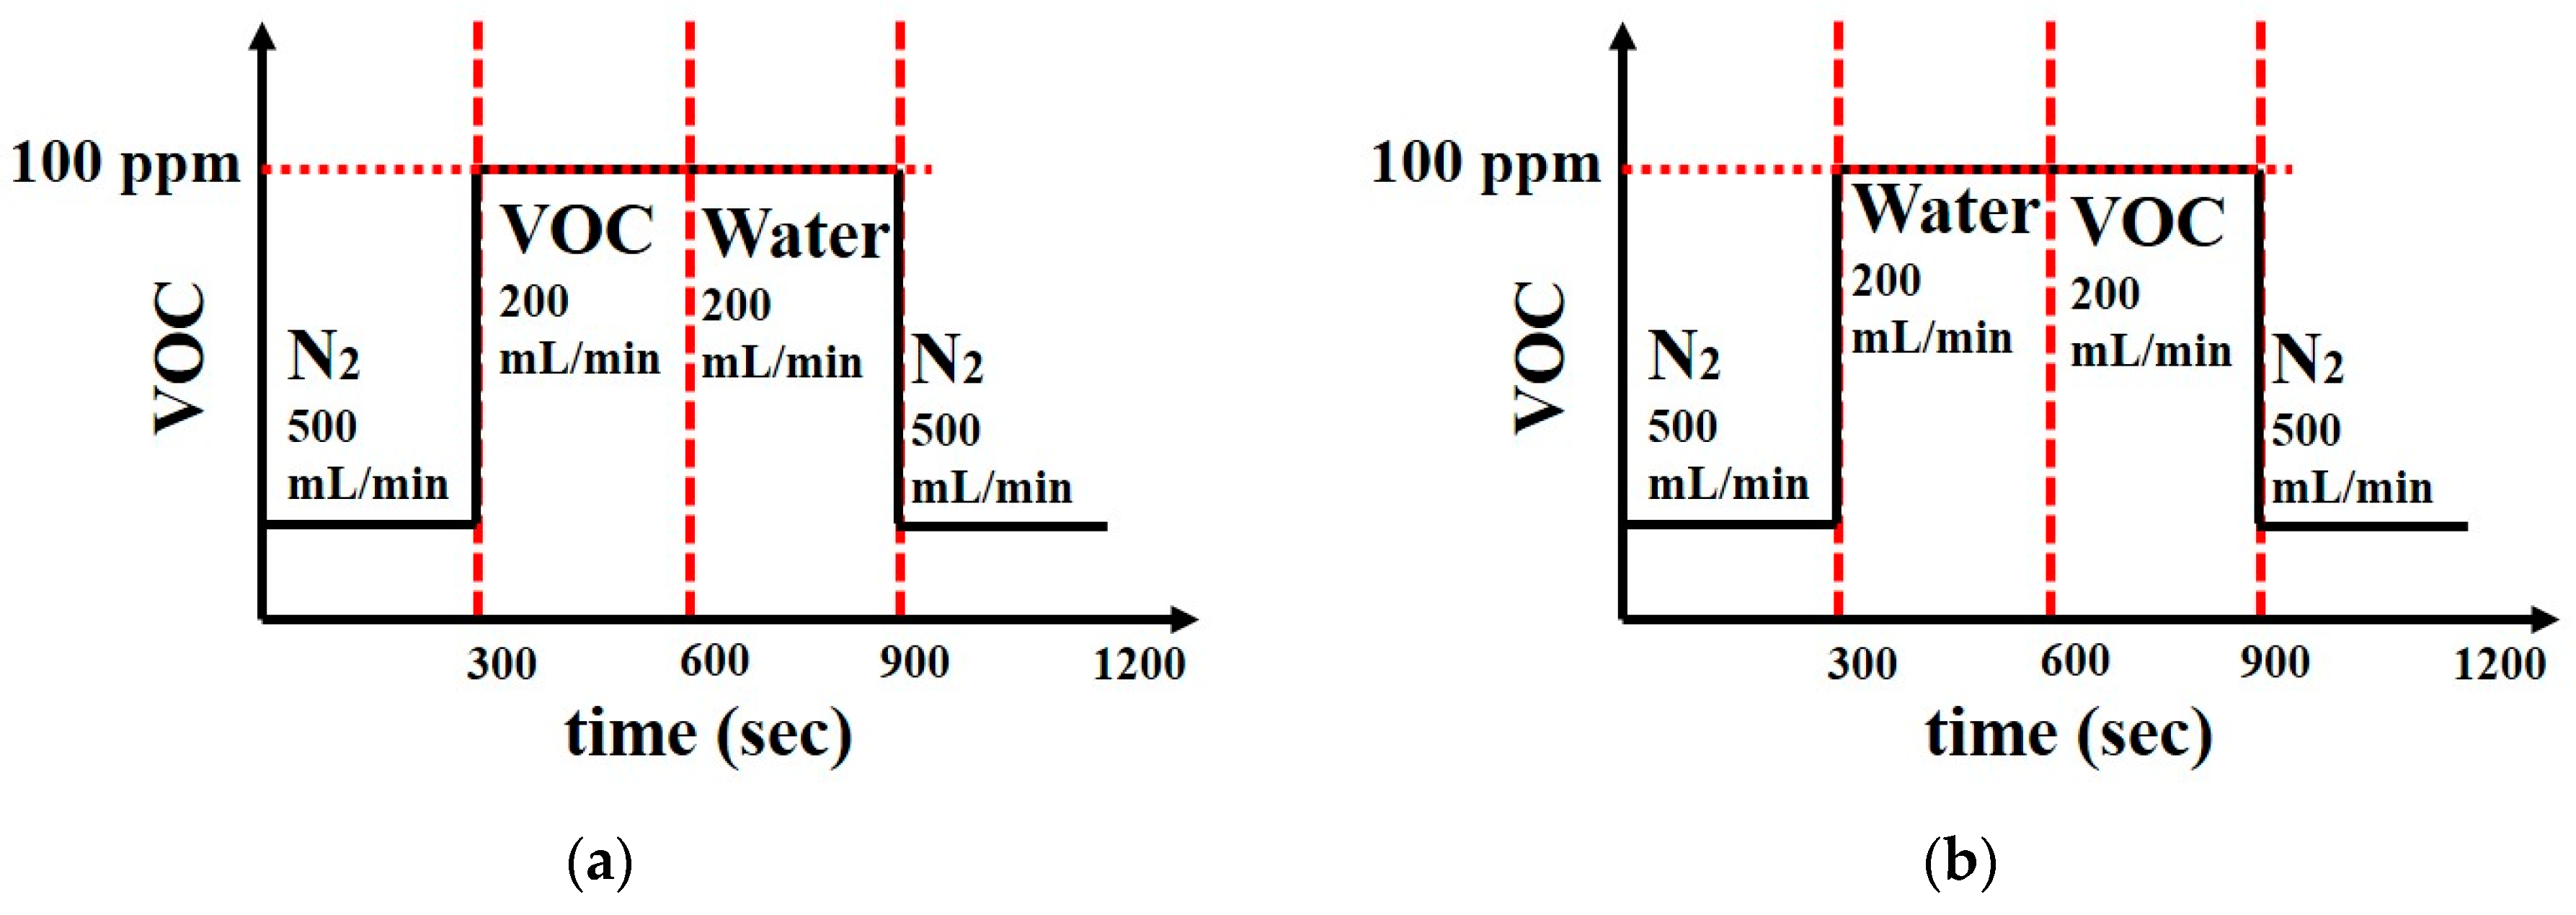
2.2. Sensors’ VOC Supply Protocols

To investigate the effect of the presence of water on the detection of analytes by vQRS, different configurations of the experimental setup have been developed in order to mixt water with organic solvent vapors in different ways and concentrations (Figure 1). In the first configuration VOC are tested alone at saturation, whereas in the second they are mixed with saturated water vapors during two cycles. Sensors are first washed in pure nitrogen for 5 min and then exposed either to the analyte or to its mixture with water for 5 min. In the third configuration water and VOC are introduced successively after N2 washing, firstly both in saturated conditions and then at equal ppm concentrations, to analyze the effect of moisture on the detection of analytes. A final set of experiments was conducted to check whether sensors were able to detect solvent vapors in the presence of equal ppm amounts of water in the same stream.
The concentration of solvent vapors was further decreased to check the performances of sensors when they are exposed to moisture contents closer to real breath, during two cycles. All the experiments have been repeated three times to calculate the average values of all parameters.

2.3. Sensors’ Fabrication by Additive Nano-Structuring

Quantum resistive vapor sensors (QRS) with a PVP matrix were prepared by three different methods to compare the influence of the processing conditions on the chemo-resistive behavior: The first method n°1 (M1) consisted in spraying layer by layer (sLbL) a dispersion of MWCNT in chloroform (0.4 g·cm−3) under sonication with a Bransonic® 3800 (Emerson, Saint-Louis, MO, USA) 40 kHz onto inter-digitated electrodes, and then drop-casting a polymer solution on the random network of CNT fabricated in the first step. In typical conditions, two drops (40 µL) of a PVP solution in chloroform (10 g·cm−3) were deposition on four layers of sprayed CNT. In the second method n°2 (M2) four layers of the above stated PVP solution were sprayed on four layers of CNT. In the third method n°3 (M3), 200 mg of PVP and 4 mg of CNT were co-dispersed in 20 cm−3 of chloroform and four layers of this dispersion were sprayed on electrodes. The initial resistances of the PVP-CNT sensors were 18 ± 9 kΩ, 49 ± 8 kΩ and 31 ± 6 kΩ for methods n°1, n°2, and n°3 respectively. After optimization of the fabrication method, that will be discussed in Section 3.1, the method n°2 was selected to prepare all sensors to test the effect of water on organic vapor sensing. Solutions of PVP, aPS, and aPP in chloroform were prepared with similar concentrations, and the sensors were fabricated by spraying two layers of the polymer solution (to keep constant the initial resistance of sensors) on four layers of CNT. The initial resistances (R0) of sensors were 20 ± 6 kΩ, 24 ± 7 kΩ and 32 ± 14 kΩ for PVP-CNT, aPS-CNT and aPP-CNT respectively.

2.4. Sensors’ Characterization by Dynamic Vapor Analysis (DVA)

The chemo-resistive properties of sensors were analyzed by measuring the changes in their electrical resistance upon exposure to alternate cycles (5 min) of dry nitrogen and pure vapor or mixture of vapors. Sensors were kept in a rectangular chamber (100 mm × 10 mm × 3 mm) with electrical connections for measurement. The dynamic vapor analysis (DVA) was conducted with saturated vapors on a homemade device able control precisely the vapors mass flows, the solvent bubbling, and the valves (opening/closing). The changes in resistance were measured with a Keithley 6517 multimeter and the data were recorded using the LabView software (National Instruments, Paris, France). The flow rates of both cycles were kept constant at 100 cm3·min−1. The response of the sensors can be expressed by calculating the relative amplitude (AR) given in Equation (1):
A R = R R 0 R 0
where R0 is the initial resistance of sensors in dry nitrogen stream and R is the resistance in the presence of pure or solvent-water vapor mix.
An OVG4 organic vapor generator (Owlstone Ltd., Cambridge, UK) was used to generate flows of ppm solvent molecules. The OVG4 oven has three control parameters as sample flow, split flow and oven temperature to regulate ppm of vapor. Therefore, different oven temperatures were used to generate the same ppm amount for the six different solvents used in flows of 200 cm3·min−1 (for mixtures of solvent and water vapors, two ovens were used simultaneously each at 100 cm3·min−1 to make a total flow rate 200 cm3·min−1 as in the case of pure solvent vapors). To check the sensitivity of sensors, a split flow up to 500 cm3·min−1 was used to reduce the amount of solvent vapors down to 12 ppm in the presence of 100 ppm of water molecules.

3. Results and Discussion

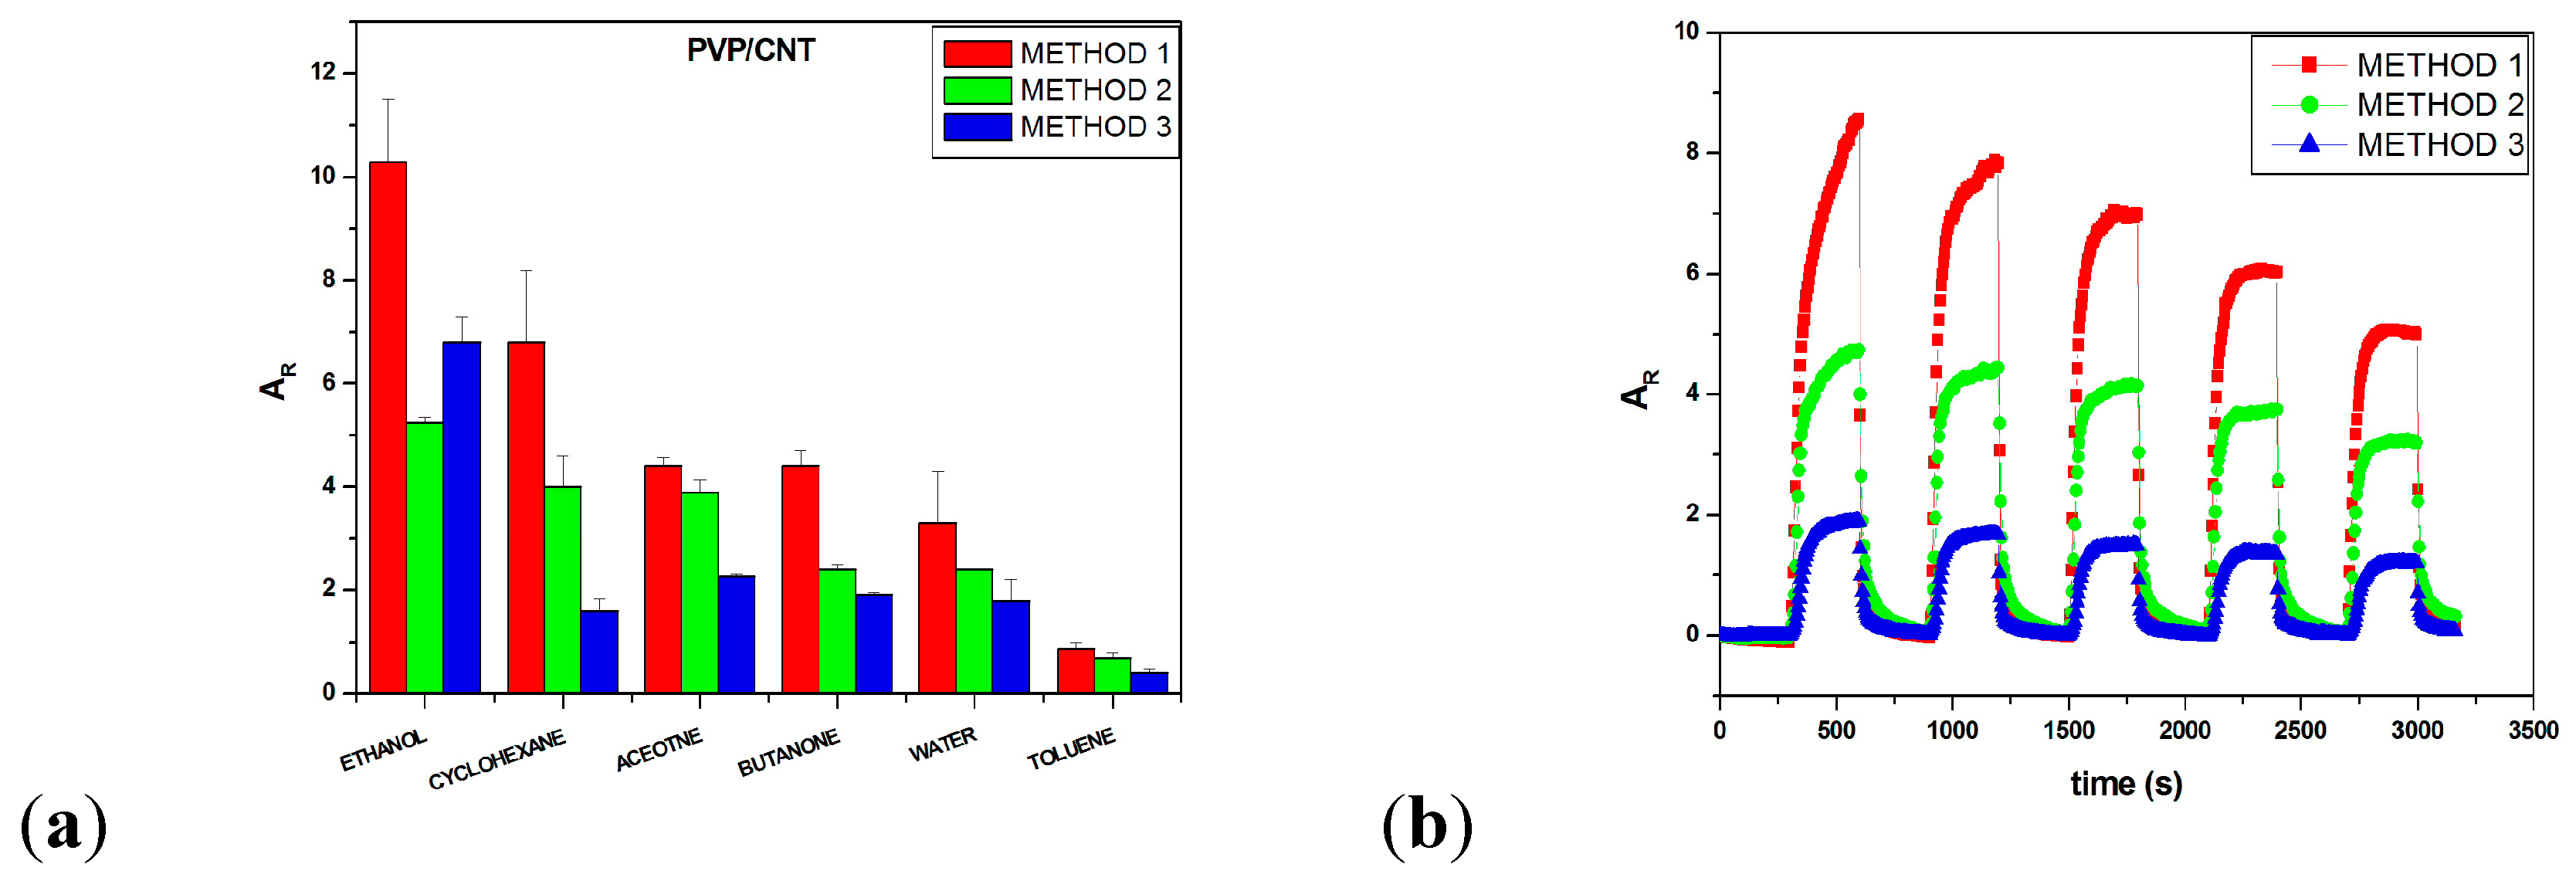
3.1. Optimization of Sensors’ Fabrication

In order to determine the effect of the sensors’ fabrication steps on their chemo-resistive characteristics, they were exposed to a set of five VOC (ethanol, acetone, butanone, cyclohexane, and toluene) also considered as cancer biomarkers [3]. The differences in polarity and water solubility of these VOC are expected to allow a better understanding of the effect of their interactions with water molecules on their detection by the vQRS. Some of these VOC properties are reported in Table 2 [58].
In Figure 2 it can be seen that the sensitivity of poly(vinylpyrrolidone) (PVP)-CNT sensors can be ranked according to their fabrication process, based on the average maximum amplitude of their chemo-resistive responses AR, after alternate exposures to nitrogen and six different VOC. It appears clearly that all the sensors prepared by method n°1 are more sensitive to VOC than those prepared by method n°2 and in turn than those prepared by method n°3. Despite a couple of exceptions can be found, it is striking to notice that simply changing the steps of assembly of CPC transducers results in strong increases in sensitivity: 200% between M1 and M2 for ethanol and even 300% between M1 and M3 for cyclohexane.
However, as expected the selectivity of sensors is almost not altered by their mode of fabrication (Ar Ethanol > Ar Cyclohexane > Ar Acetone > Ar Butanone > Ar Water > Ar Toluene), excepted in the peculiar case of ethanol sensing, where M2 gives a lower response than M3. PVP is sensitive to alcohols like ethanol and methanol due to it’s good solubility in these solvents [60]. Therefore, it can be concluded that the fabrication method only affects the sensitivity of sensors towards VOC, i.e., the amplitude of chemo-resistive signals. Nevertheless, although sensors fabricated with M1 are more sensitive they also lead to responses with larger standard deviation compared to the two other methods. In contrast, M3 is the method giving sensors with the highest stability, least deviation, best characteristics reproducibility (Figure 2). Thus, the sensors fabricated with M2 are found to present the best compromise of chemo-resistive properties: good response, low signal deviation due to the use of spray. Finally, M2 was selected to fabricate all sensors for further investigations of the effect of water on VOC biomarkers’ sensing.

3.2. Effect of Water Vapor on VOC Sensing

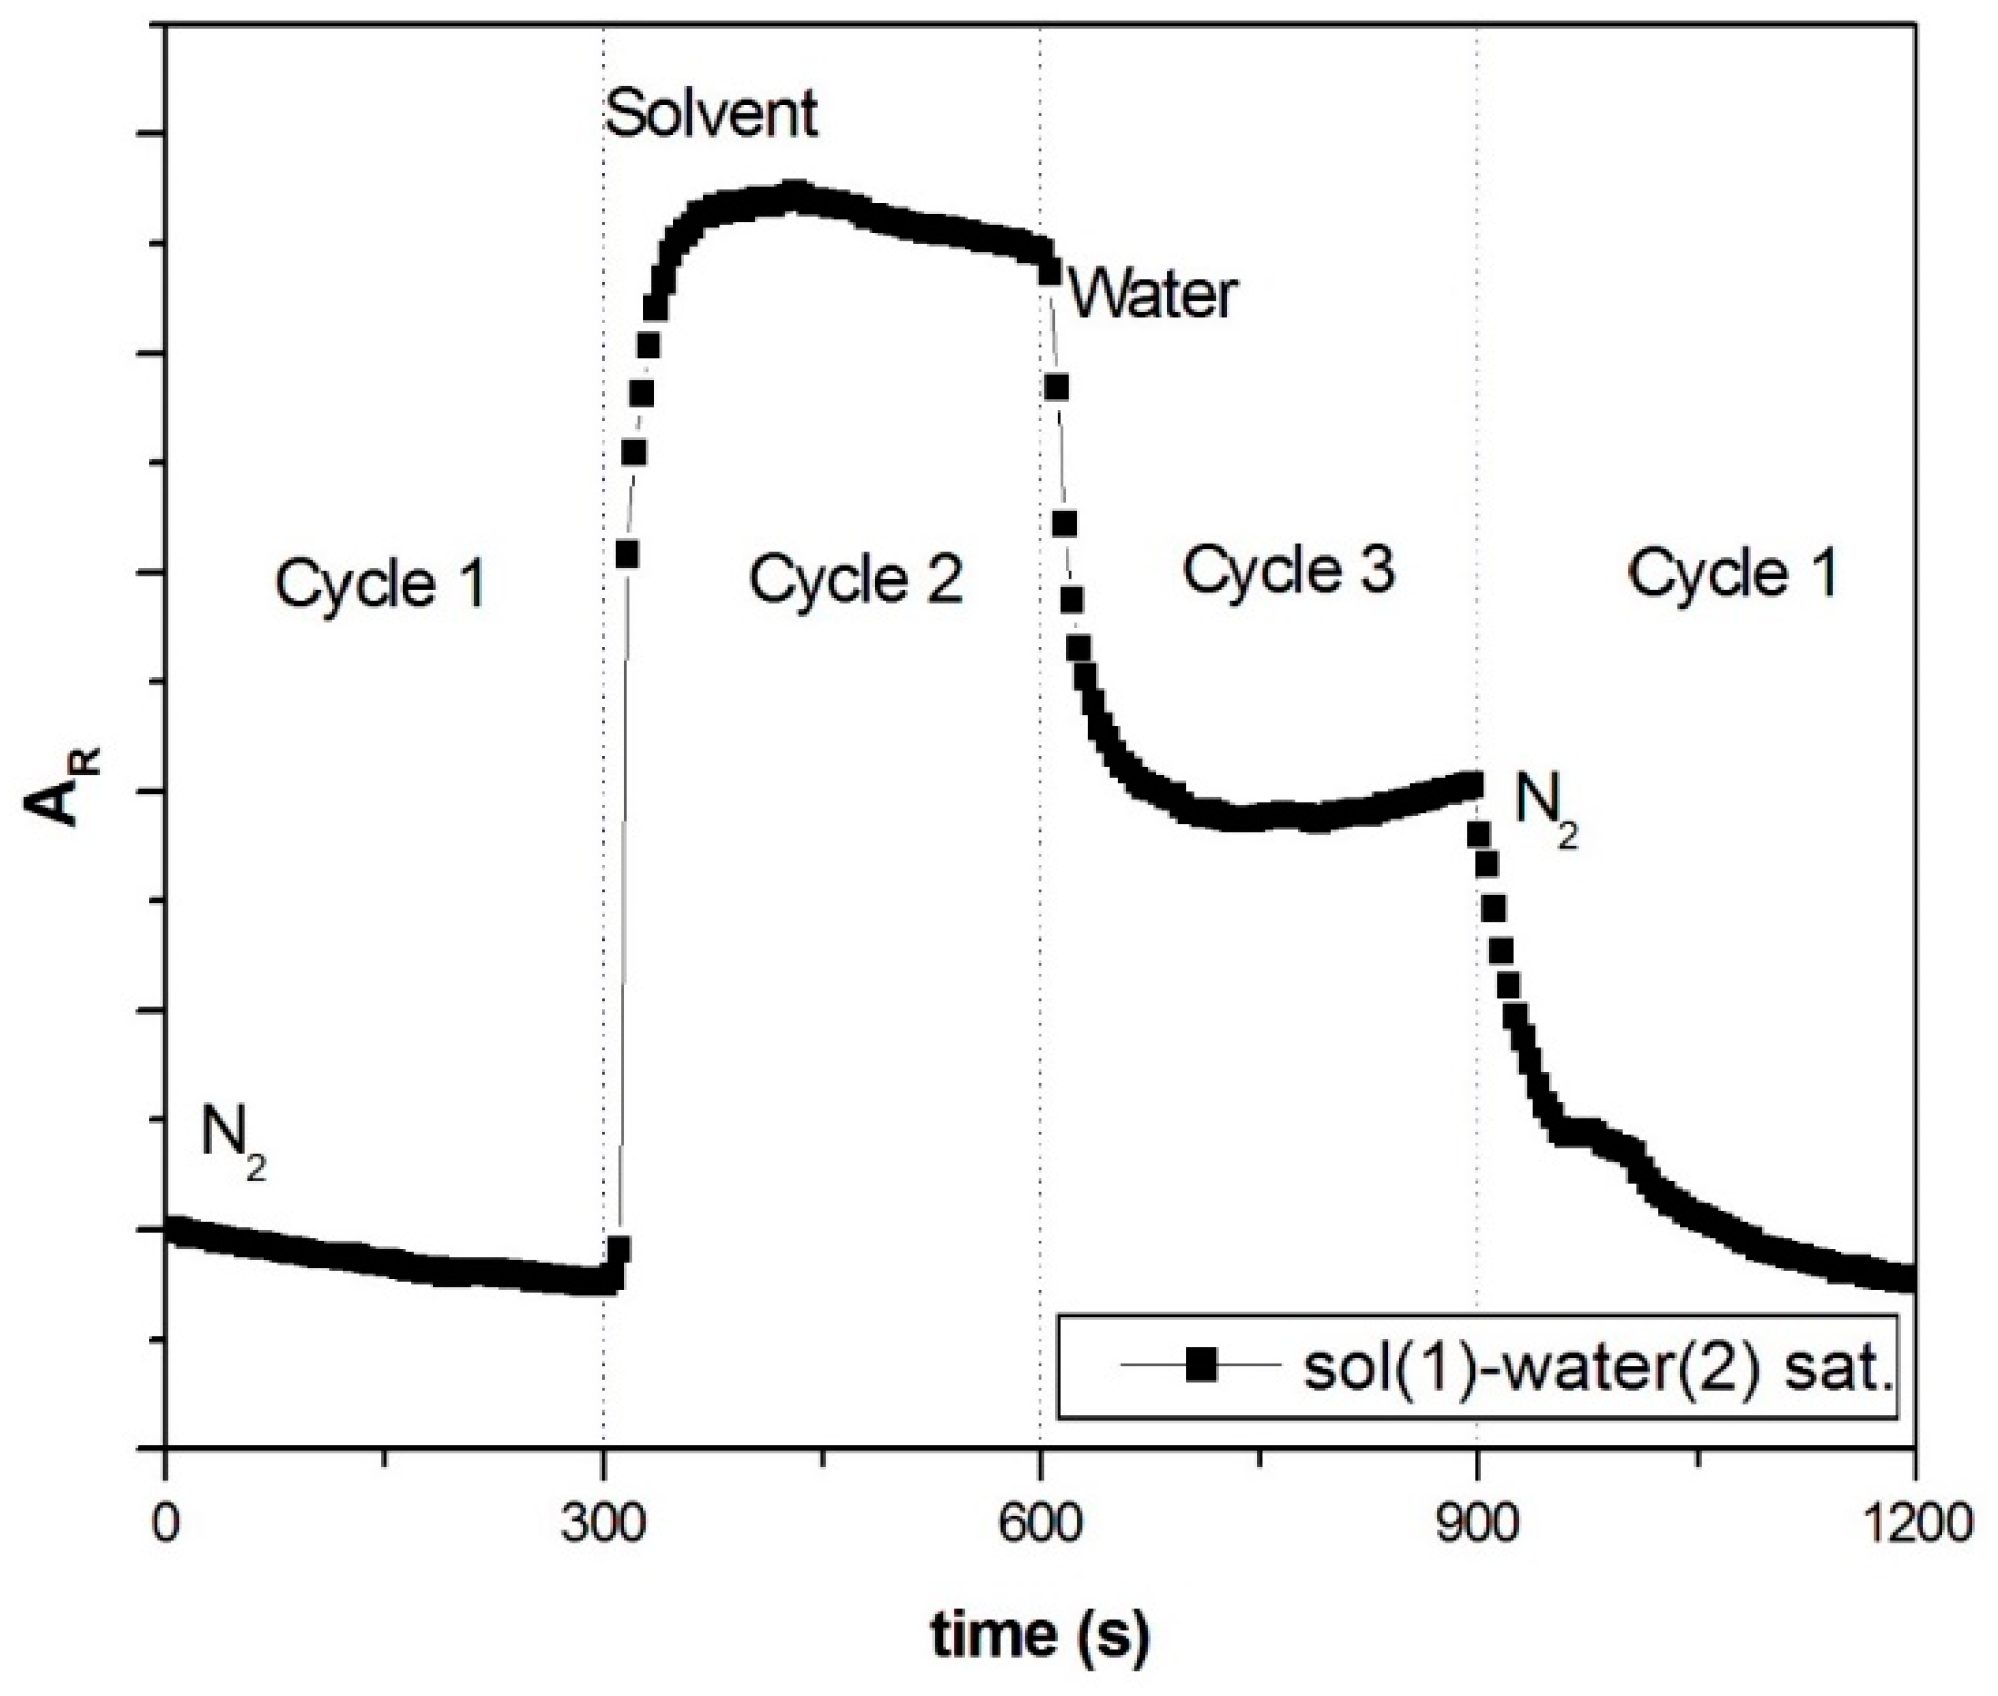
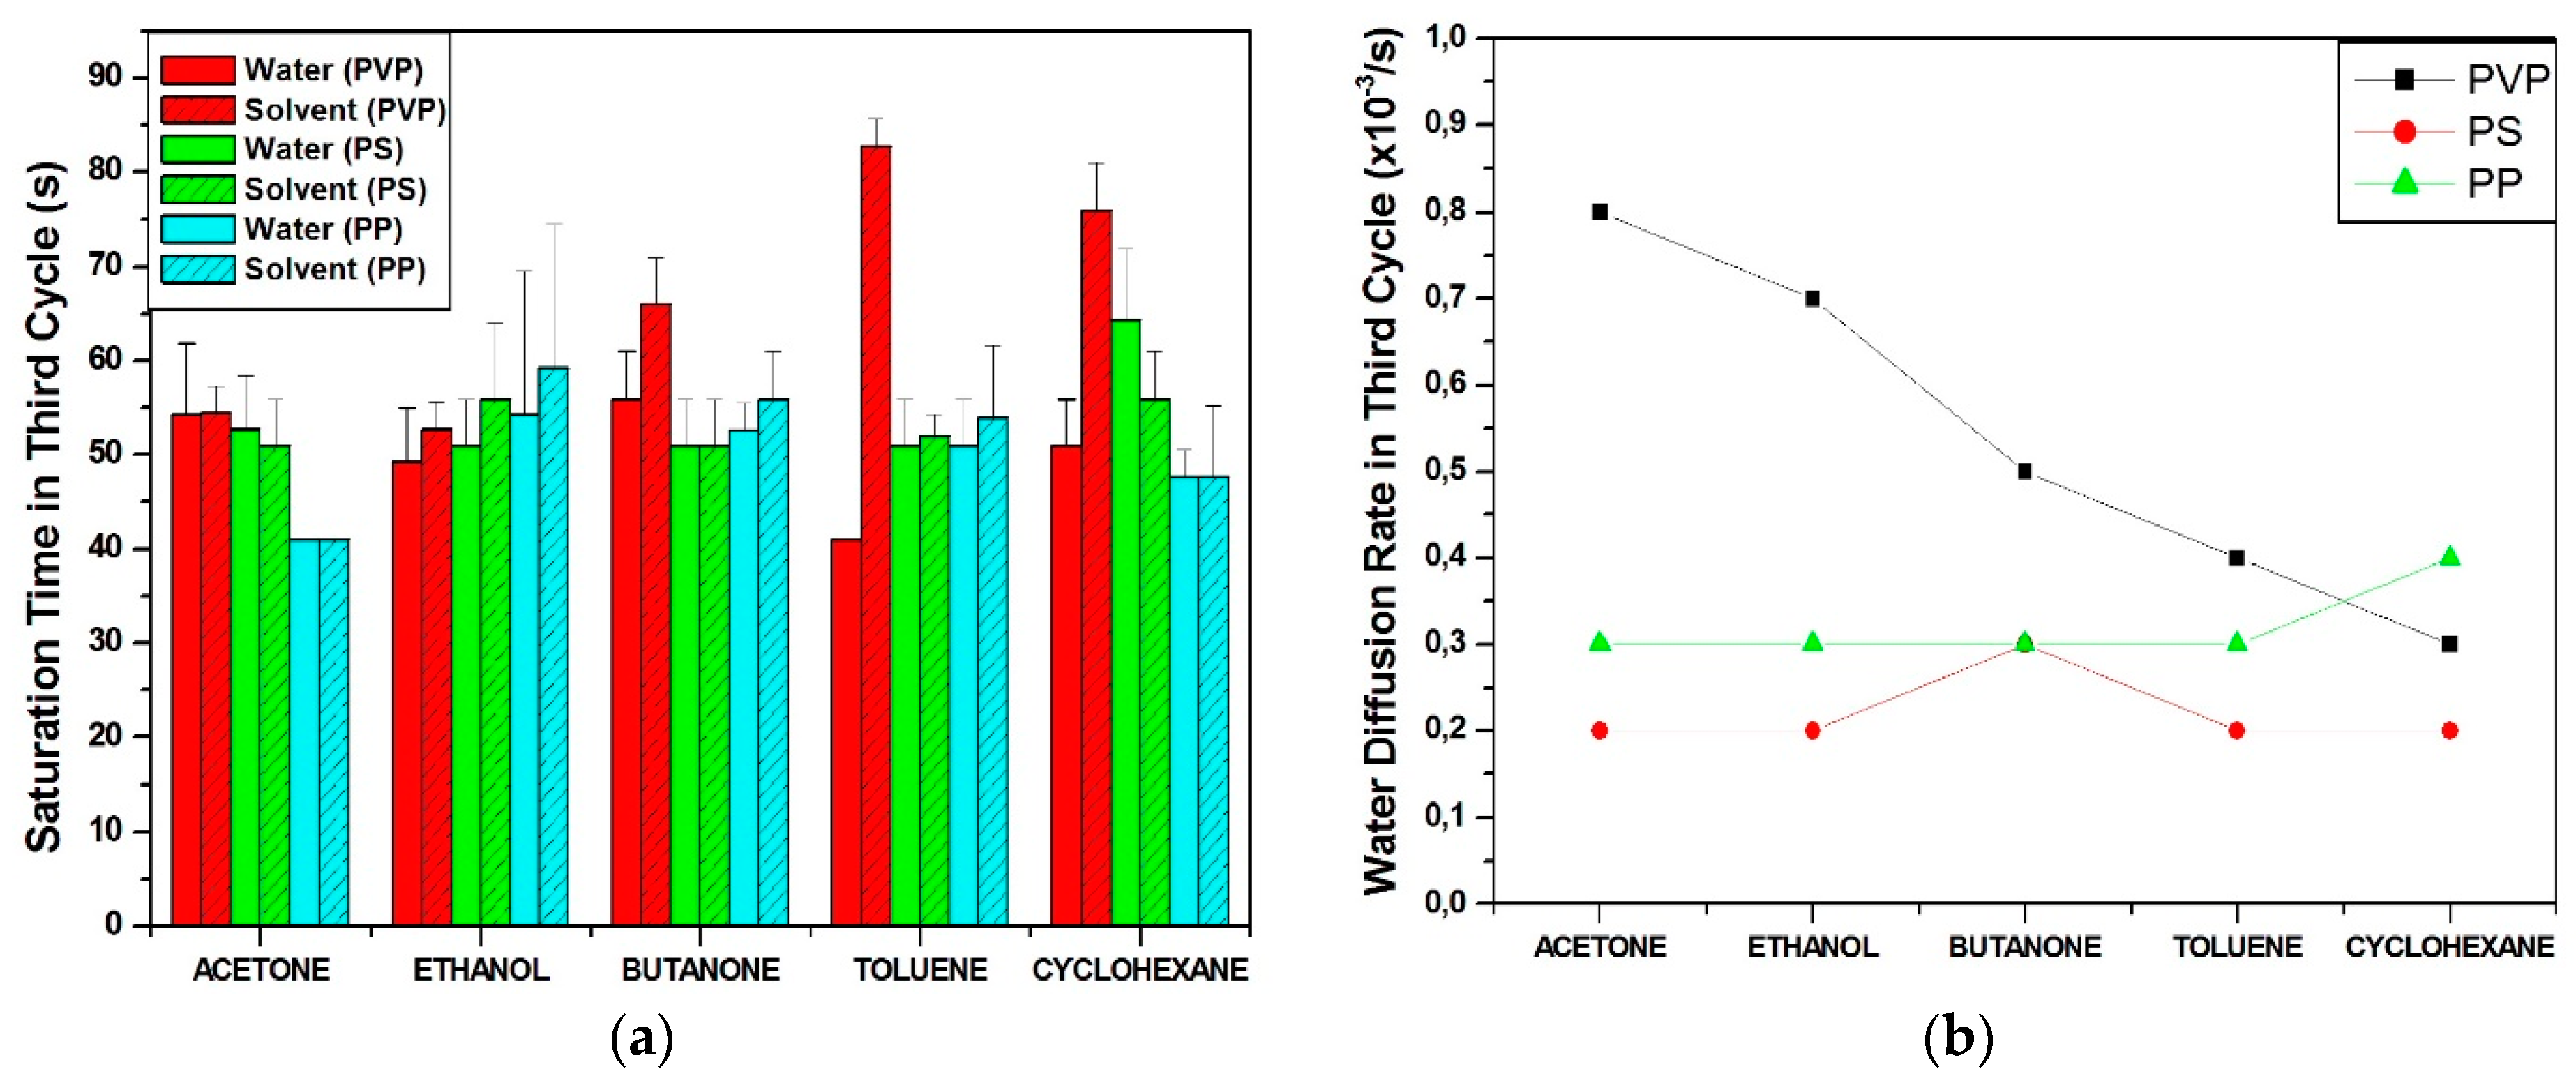
3.2.1. Sensing of VOC in Saturated Conditions

The chemo-resistive responses of three different vQRS prepared by M2, PVP-CNT, PS-CNT, and PP-CNT have been recorded during their exposure to the five selected VOC biomarkers and water at saturation as seen in Figure 3, using the experimental setup described in Figure 1a,b. The vQRS matrices PVP, PS, and PP have been selected for their solubility parameters δt (see Table 1) close to those of the analytes recalled in Table 2, expected to result in good intermolecular interactions [61,62] (expressed by a small value of the χ12 Flory-Huggins parameter of Equation (2)) and therefore large responses that can be correlated by an exponential law to χ12 [63,64,65,66].
χ 12 = V m R T ( δ T   p o l y δ T a n a ) 2
where Vm is the molar volume of the solvent (cm3·mol−1), T is the temperature (K), the ideal gas constant (R = 8.314 J·mol−1), and the analyte and polymer global solubility parameters δTana and δTpoly (J1/2·cm−3/2), respectively.
In the standard device, nitrogen is bubbled in two parallel columns containing the analyte and water to generate two flows of saturated vapors, which are later mixed together. The concentrations of VOC molecules at saturation, expressed in ppm, are given in Table 2. The values of AR maxima of five consecutive vapor/nitrogen cycles have been collected for all VOC, water and their mixtures in order to proceed to a principal component analysis (PCA) with the TANAGRA open software [67]. PCA is an effective method for data dimensionality reduction or denoising, which makes their representation easier, as it can be seen in Figure 3a. This pattern results from the projection of data on two axis PC1 and PC2 with a total variance of 77%, after they were assembled into a 56 × 4 matrix. The chemo-resistive responses of the sensors’ array to pure VOC represented by solid circles on the PCA map are well separated, but in the presence of water vapors (hollow circles) it can be seen that the discrimination ability of the e-nose is strongly decreased, as all the points corresponding to VOC-water mixes get closer to each other on the PCA map. In particular, the responses of the e-nose to toluene and methanol vapors are difficult to separate from the other vapors when combined with a large amount of water molecules.
To go further in the understanding of the PCA map results, it is instructive to come back to the chemo-resistive responses of the single sensors. Thus, it is amazing to notice in Figure 3b–d that depending on the chemical nature of the analyte, water can have an additive, subtractive or null contribution to the chemo-resistive response. For example, Figure 3b shows well that water molecules are bringing a significant additive contribution to the responses of PVP-CNT to ethanol, toluene and to a lesser extend to cyclohexane, but that it is the opposite for acetone and butanone. In Figure 3c, water is negatively affecting the selectivity aPS-CNT, as all responses are strongly decreased excepted for ethanol vapor which amplitude is slightly increased. The chemo-resistive behavior of aPP-CNT in Figure 3d is also upset by water, but differently, this time additionally from levelling the high selectivity of aPP to cyclohexane, water is slightly enhancing the responses of the sensor to acetone toluene and ethanol vapors. Thus, it can be seen that the effect of water on the VOC detection of vQRS depends not only on the chemical nature of the CPC polymer matrix but also on the difference in polarity between the analytes and water molecules. Therefore, it is interesting to refine this analysis by decreasing the number of molecules sent to the sensors for detection, which is the object of the following paragraph.

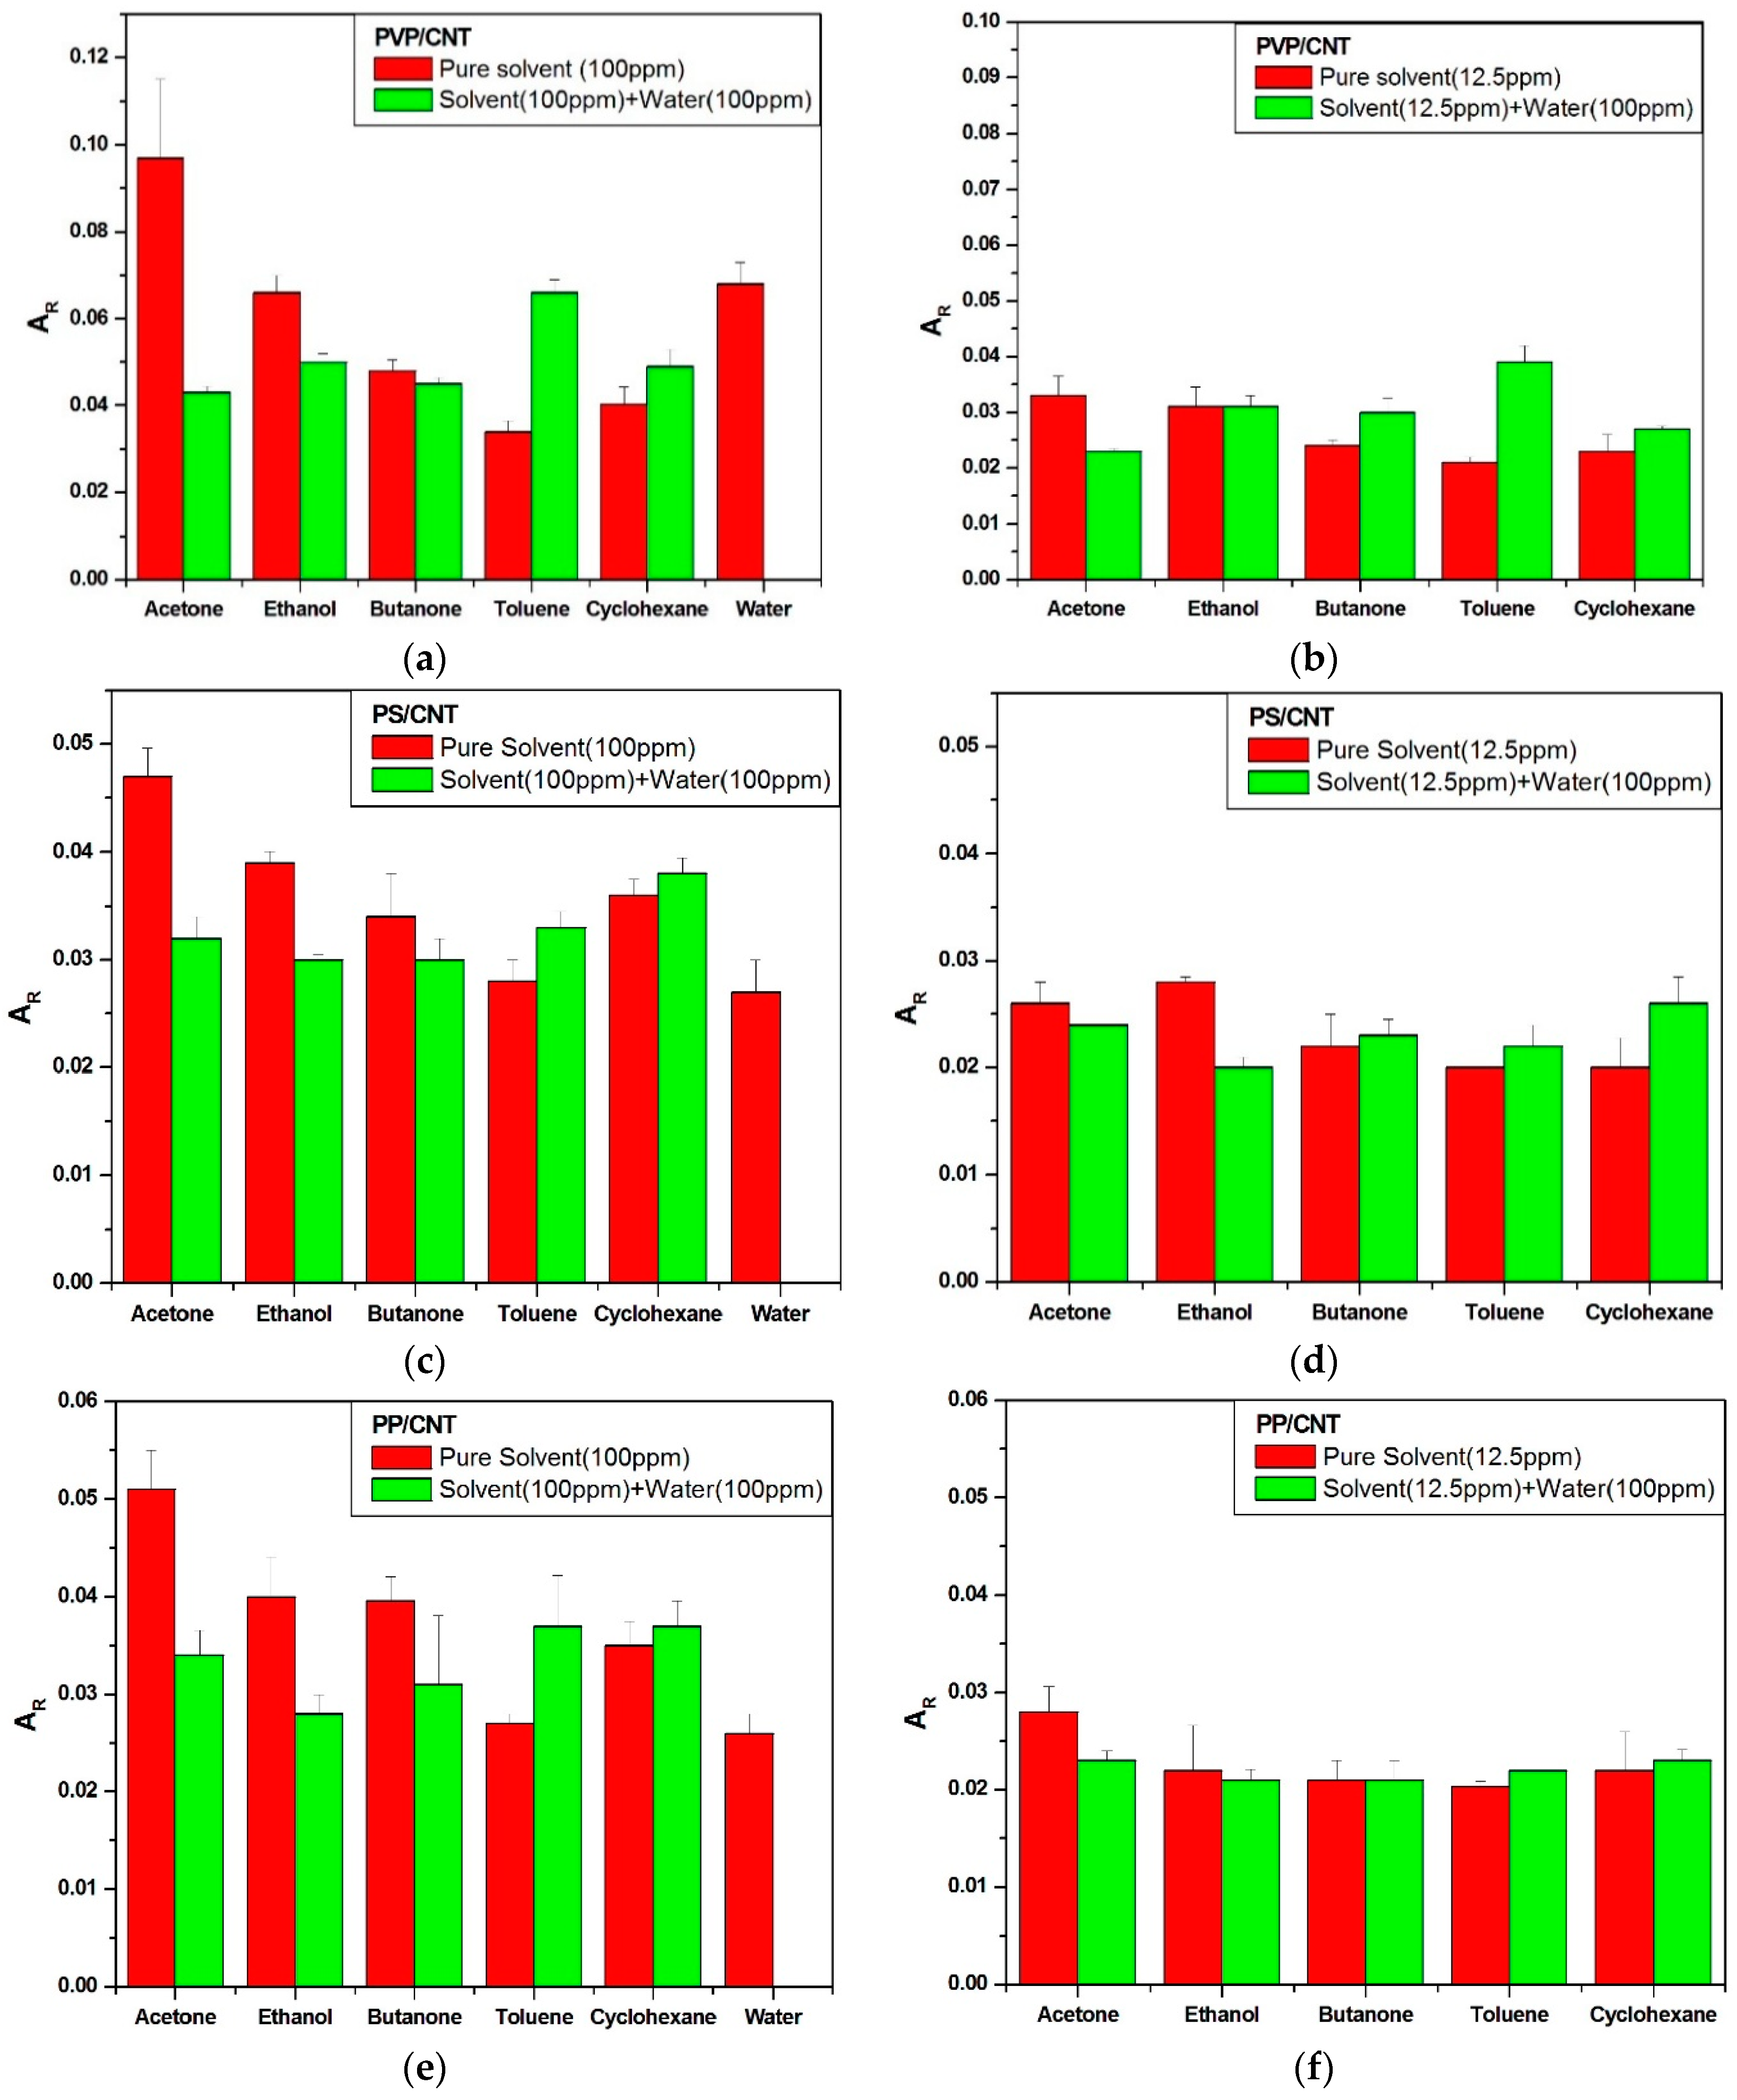
3.2.2. Effects of Water Vapors at Low VOC Concentration

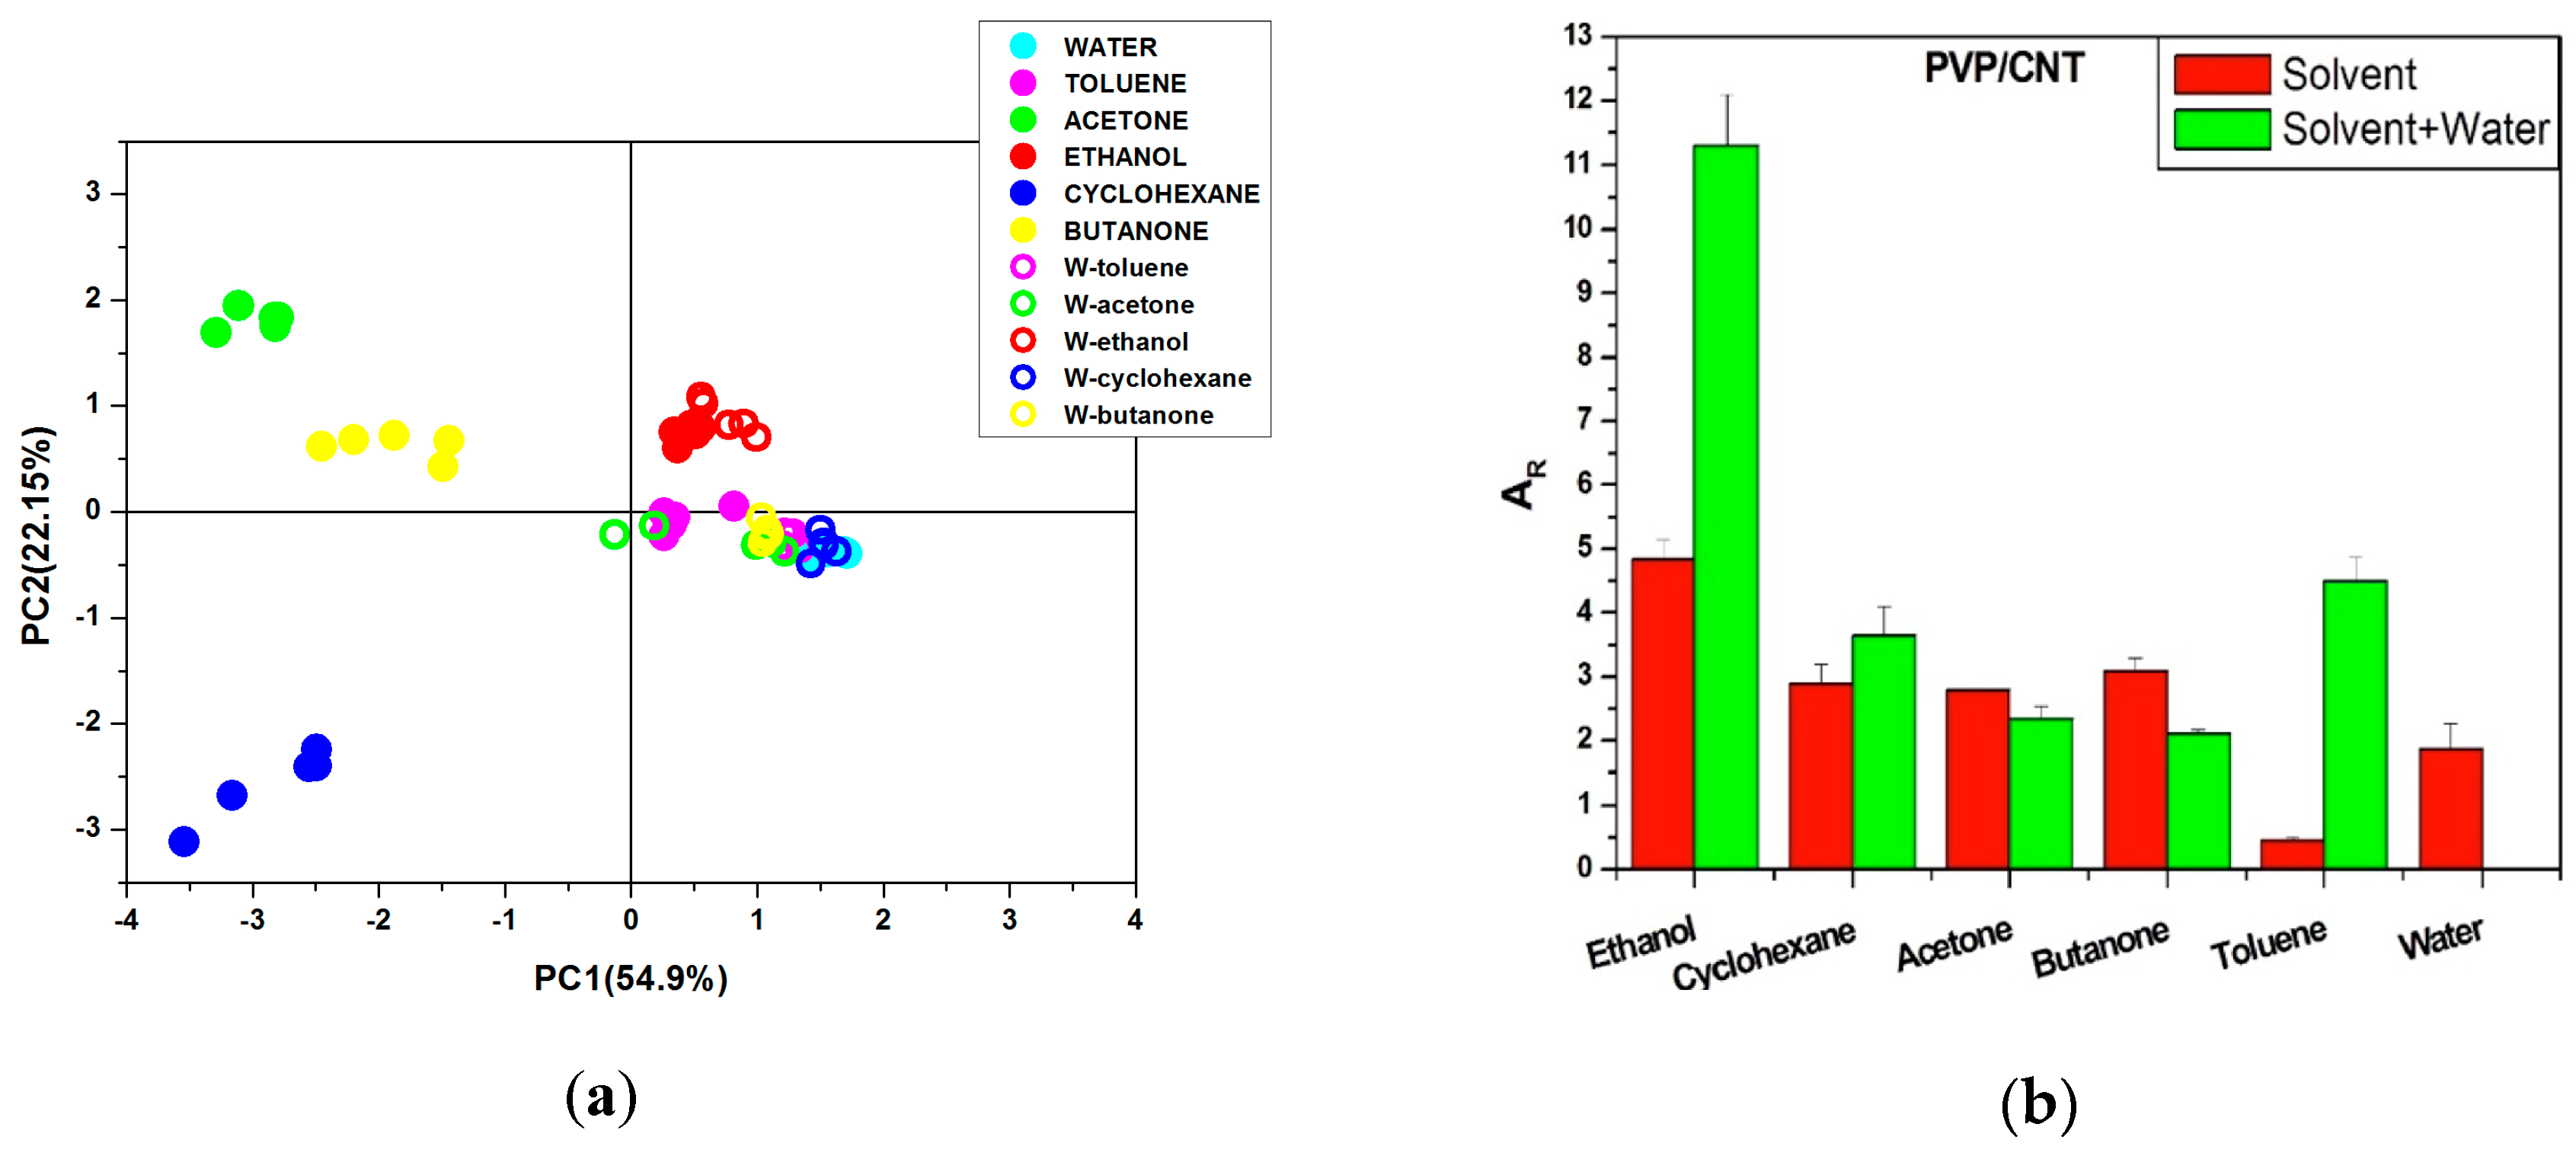
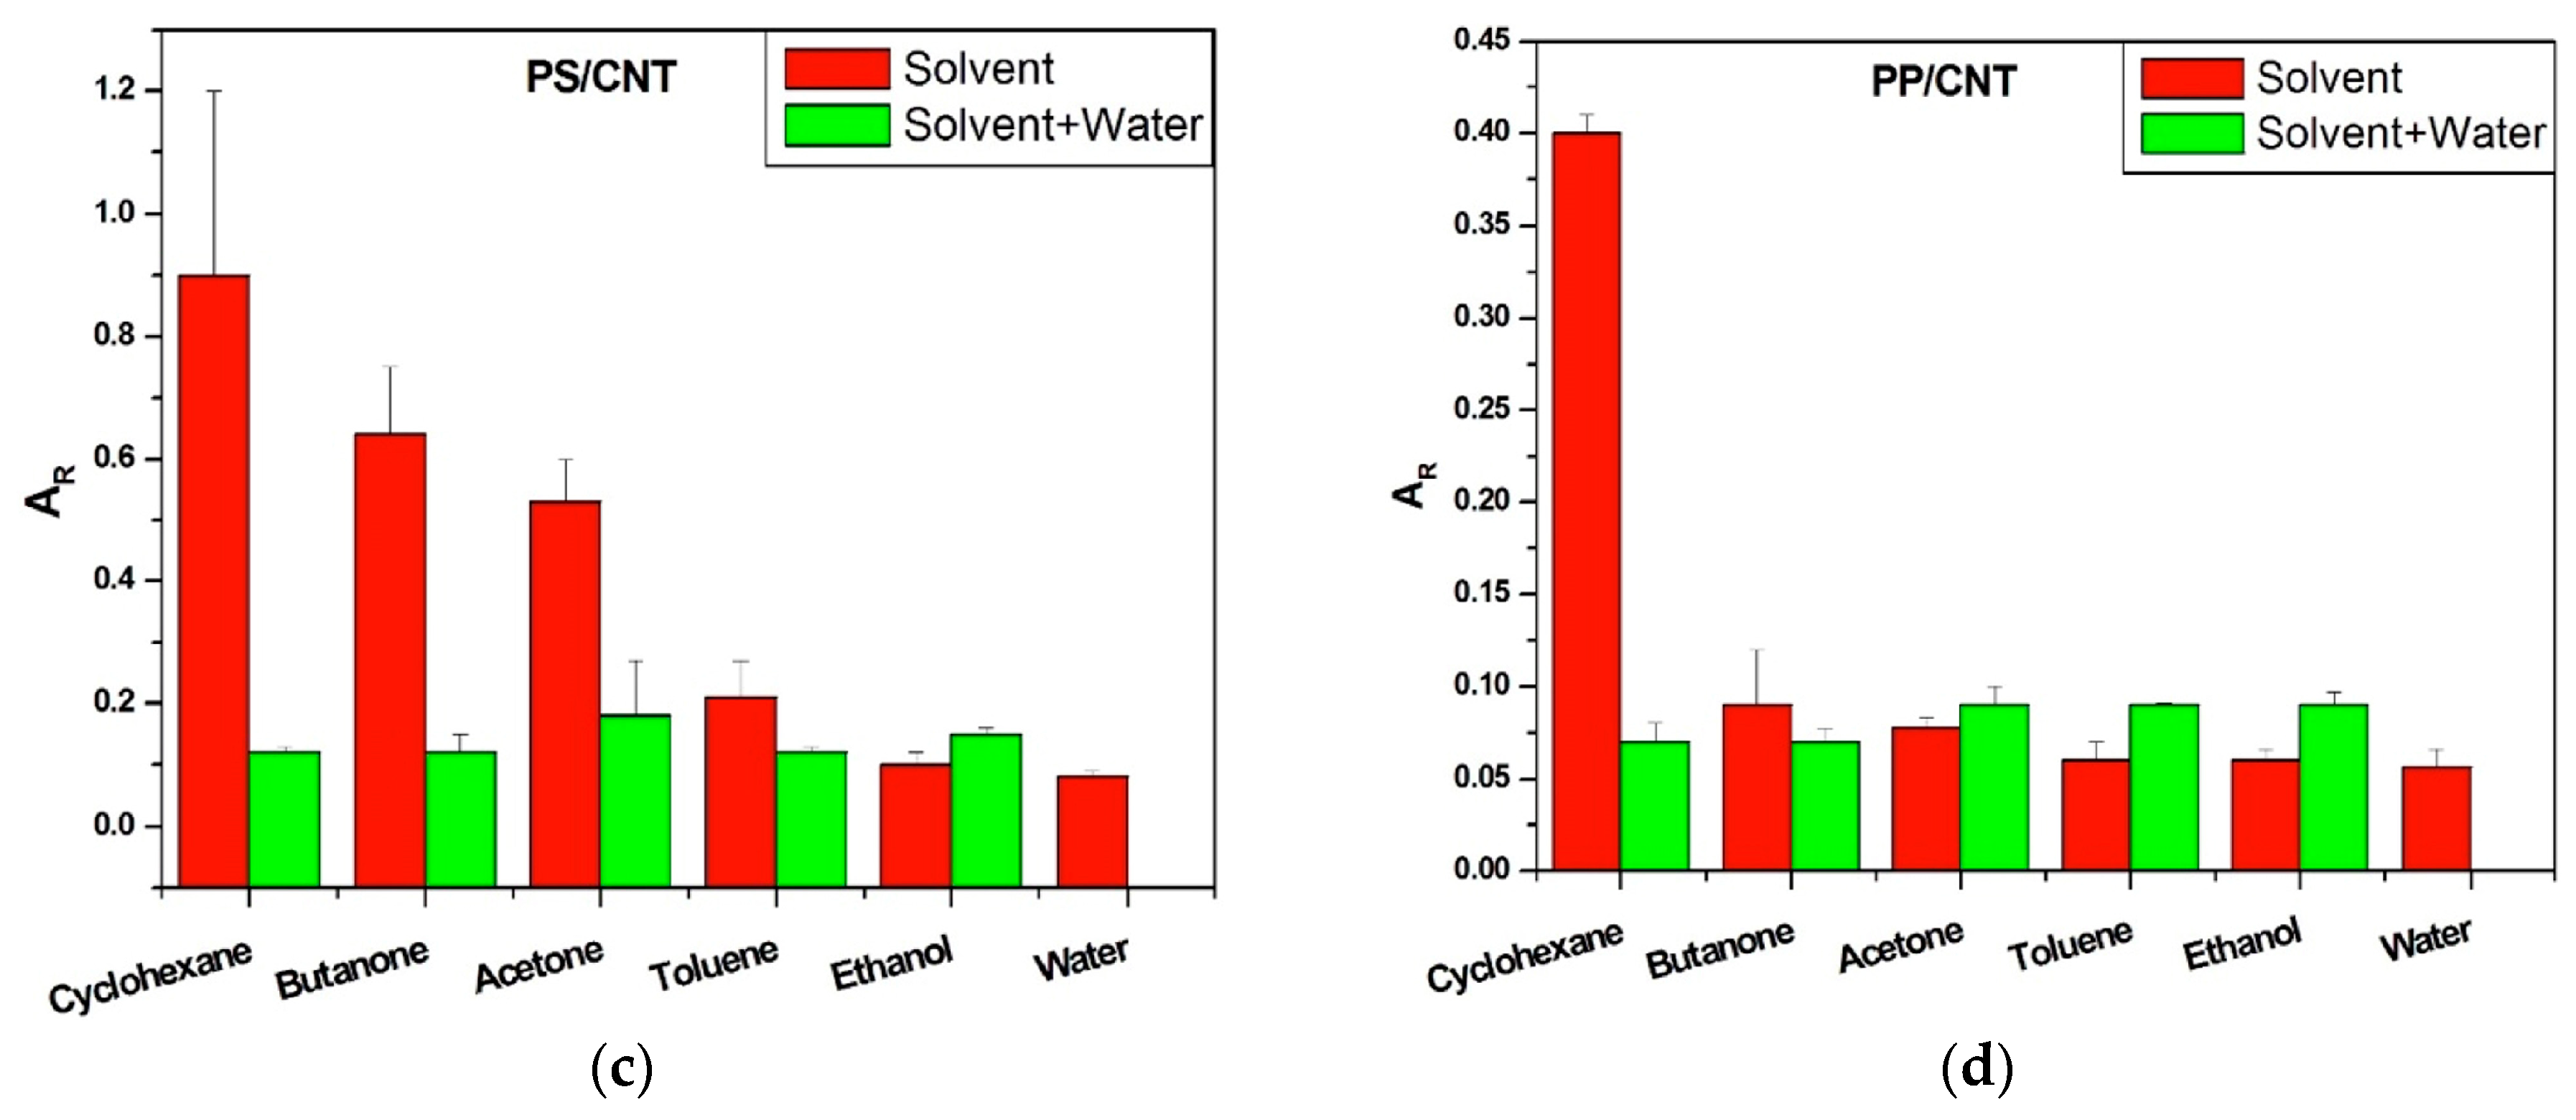
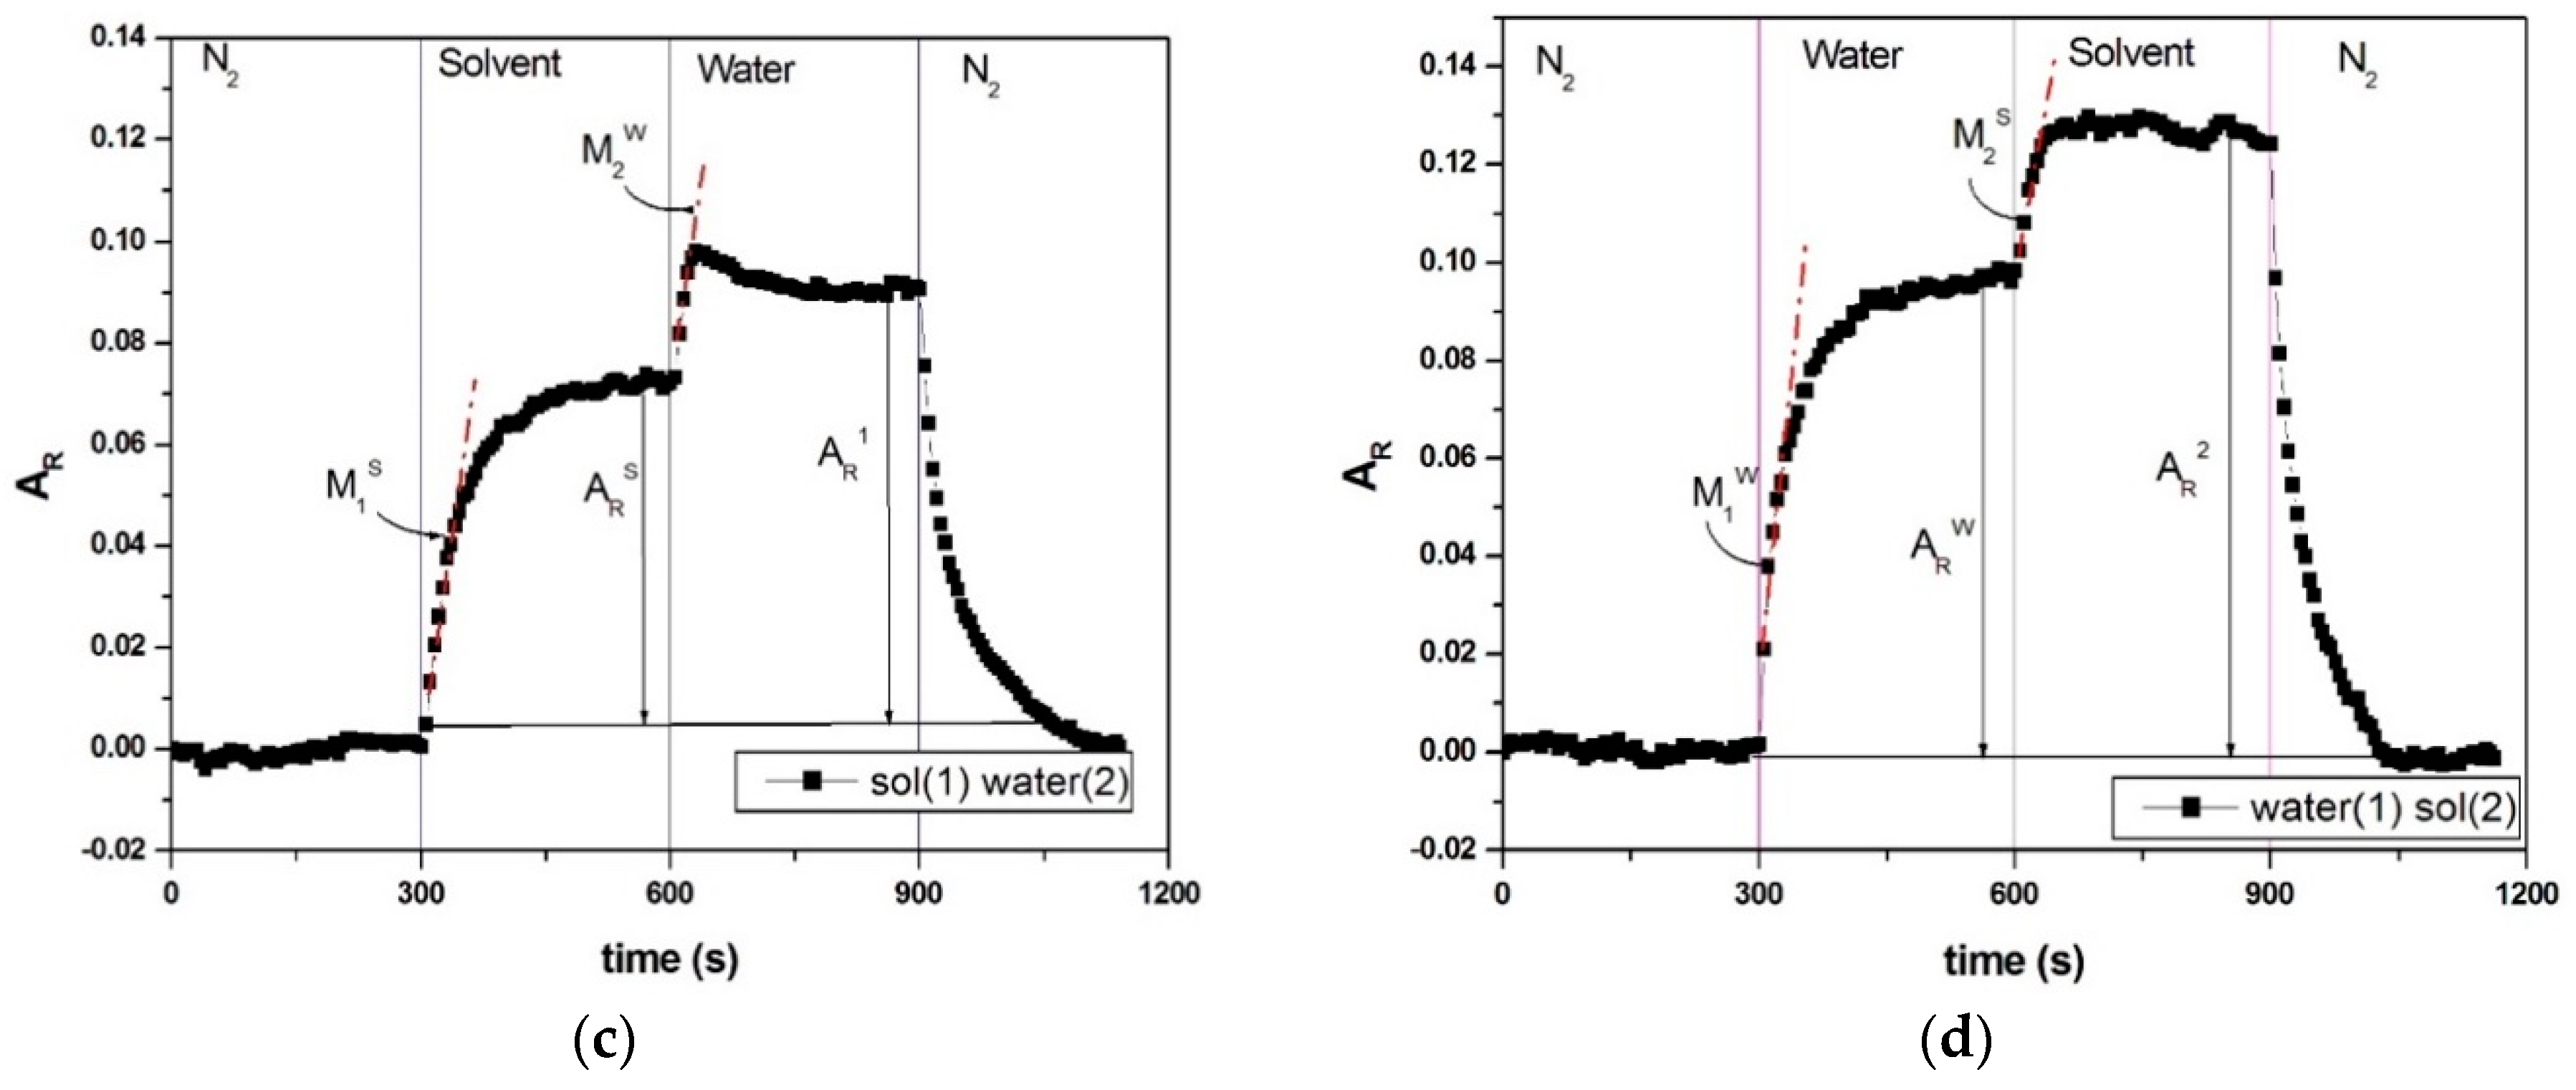
Effects of Interactions between Water and VOC Molecules

Exposing vQRS to N2-VOC-H2O saturated vapors sequences according to the configuration described in Figure 1c yields the striking behavior shown in Figure 4. It can be observed that during the third cycle water molecules are removing the solvent molecules already adsorbed at the sensors’ nano-junctions, resulting in a decrease of responses’ amplitude, a phenomenon which becomes steady after a certain time. This amazing effect may come from the lower concentration in water molecules at saturation (Table 2) leading to a concentration gradient that would initiate the diffusion of solvent molecules out of the sensor, until a dynamic equilibrium is established between adsorption of water molecules and desorption of solvent molecules.
This assumed concentration gradient effect was eliminated by decreasing the number of molecules hitting the vQRS, replacing the bubbling unit with an OVG. This device is able to generate only ppm amounts of VOC and water successively, in controlled conditions using the configuration test of (Figure 5a,b). Two types of experiments were performed by sending in the second and third cycles 100 ppm of VOC or water vapors in the setup, respectively labelled experiment 1 and 2. Surprisingly, similar effects were observed for all vapors in the two experiments as shown in Figure 5c,d. Sending only 100 ppm of VOC or H2O vapors in the sensors’ cell resulted in increasing AR of all sensors in the third cycle for both experiments, whereas using saturated vapors was leading to the opposite effect (a decrease of Ar). It can also be noticed that in all cases AR signals are reaching a plateau after every injection, indicating that 100 ppm of molecules are not sufficient to saturate all the active absorption sites in the sensors and induce the swelled of the matrix by clustering. The clustering step of the diffusion of molecules in a polymer nanocomposite has well been modelled in previous works and cannot be extensively described here [64,67,68]. In few words when the diffusing molecules enter the matrix in too large amount, they see only molecules with the same chemical nature already adsorbed on the sensors sites and thus they are accumulating in large amounts creating a volume expansion of the polymer that leads to very larges Ar characterized by the absence of plateau.
Here, when the second vapor is introduced in the last cycle, there must still be active absorption sites available, that can further increase the AR of the vQRS. However, there could be a competition in the diffusion and/or adsorption on the remaining active sites of transducers, depending on the physico-chemical interactions between the two vapors. Nevertheless in Figure 5c,d, it does not seem to be the case as the features of the AR increment are rather similar in both experiments, whatever the sequence of introduction of water. To check if the presence of water molecules could affect the subsequent absorption of a VOC according to its polarity and water solubility, and determine if there could be a competition between the vapors for the absorption on transducers sites, some parameters have been extracted from the chemo-resistive responses of Figure 5c,d to make a finer analysis of the behaviors.
These parameters are defined as:
A R s : the maximum relative amplitude of the solvent response in a solvent/water sequence,
A R 1 : the maximum relative amplitude of the water response in a solvent/water sequence,
M 1 S : the slope of the curve of the solvent in the second cycle,
M 2 W : the slope of curve of water in third cycle.
A R w : the maximum relative amplitude of the water response in a water/solvent sequence,
A R 2 : the maximum relative amplitude of the solvent response in a water/solvent sequence,
M 1 W : the slope of the curve of water in second cycle,
M 2 S : the slope of the curve of the solvent in third cycle.
The average values of AR parameters were calculated from three data points for each solvent in the two sets of experiments. Although, the trend of all curves looks similar, their amplitudes AR are different for each vapor depending on experimental conditions. Therefore, the behavior of each VOC was analyzed more finely in experiments 1 and 2 by calculating the Z1 and Z2 parameters. Z1 corresponds to the ratio of the solvents’ relative amplitude (at 100 ppm) to the total maximum relative amplitude in third cycle (at 100 ppm) as described in Equation (3):
Z 1 = A R s A R 1 · 100
Z1 is the % of active sites occupied by solvent molecules reported to the total active sites, when the solvent is sensed first.
Similarly, the second experiment in which the three sensors are firstly exposed to 100 ppm of water vapors and secondly exposed to 100 ppm of solvent vapors, makes possible to express the ratio Z2 as defined in Equation (4):
Z 2 = A R 2 A R w A R 2 · 100
Z2 is the % of sites occupied by solvent molecules reported to total active sites when the solvent is sensed after water vapors.
Z1 and Z2 of the five solvents are compared separately for each sensor in Figure 6.
It results that for the PVP-CNT, aPS-CNT and aPP-CNT sensors, the Z1 values were found respectively in the range of 80–90%, 75–89% and 85–95% for all solvents, which means that when the VOC is sent first, it is occupying most of available adsorption sites. Moreover the fact that Z1 values still depend on the interactions between the macromolecules from the matrix and VOC molecules, and eventually their size as pointed out by Bouvrée et al. [68], is a proof that the vQRS is preserved. Thus, for the PVP-CNT sensor, the highest value of Z1 = 89.6% was obtained for ethanol. Similarly, aPS-CNT reached its highest value of Z1 = 88.4% for toluene and aPP-CNT led to Z1 = 86.8%, for cyclohexane, Z1 = 91.9% for toluene and Z1 = 94.5% for ethanol. Therefore, few effects on the adsorption sites of the vQRS are observed, when the VOC molecules are sensed before the water molecules are sent on the sensors’ surface. However, it is very different in the second experiment where the solvent molecules are sensed after the sensors’ have been exposed for 5 min to 100 ppm of water vapor. Now, most sites are occupied by H2O molecules, and the adsorption of new solvent molecules (Z2) will depend on their molecular interactions/competition with water molecules.
Comparing the Z2 values for the three vQRS shows that polar vapors like ethanol and acetone lead to lower Z2 values than non-polar ones such as cyclohexane and toluene. The case of butanone is particularly interesting as it is a semi-polar molecule by nature, that can exhibit a non-polar character with PVP-CNT sensor (hydrophilic) and a polar one with both aPP-CNT and aPS-CNT sensors (hydrophobic), as attested by its Z2 value of 26% for PVP-CNT, 18% for aPS-CNT and 15% for aPP-CNT. Figure 6 shows that 16% of the active sites were occupied by ethanol and acetone in PVP-CNT, and about 20% in aPS-CNT and 15% in aPP-CNT sensors, while the Z2 values of cyclohexane and toluene were 23% for PVP-CNT, 31% for aPS-CNT and respectively 37% and 31% for aPP-CNT. Hence in the third cycle, non-polar vapors can occupy up to 20% more active sites than polar vapors in the presence of H2O molecules.
In summary, the adsorption of VOC is affected by the presence of water in different ways:
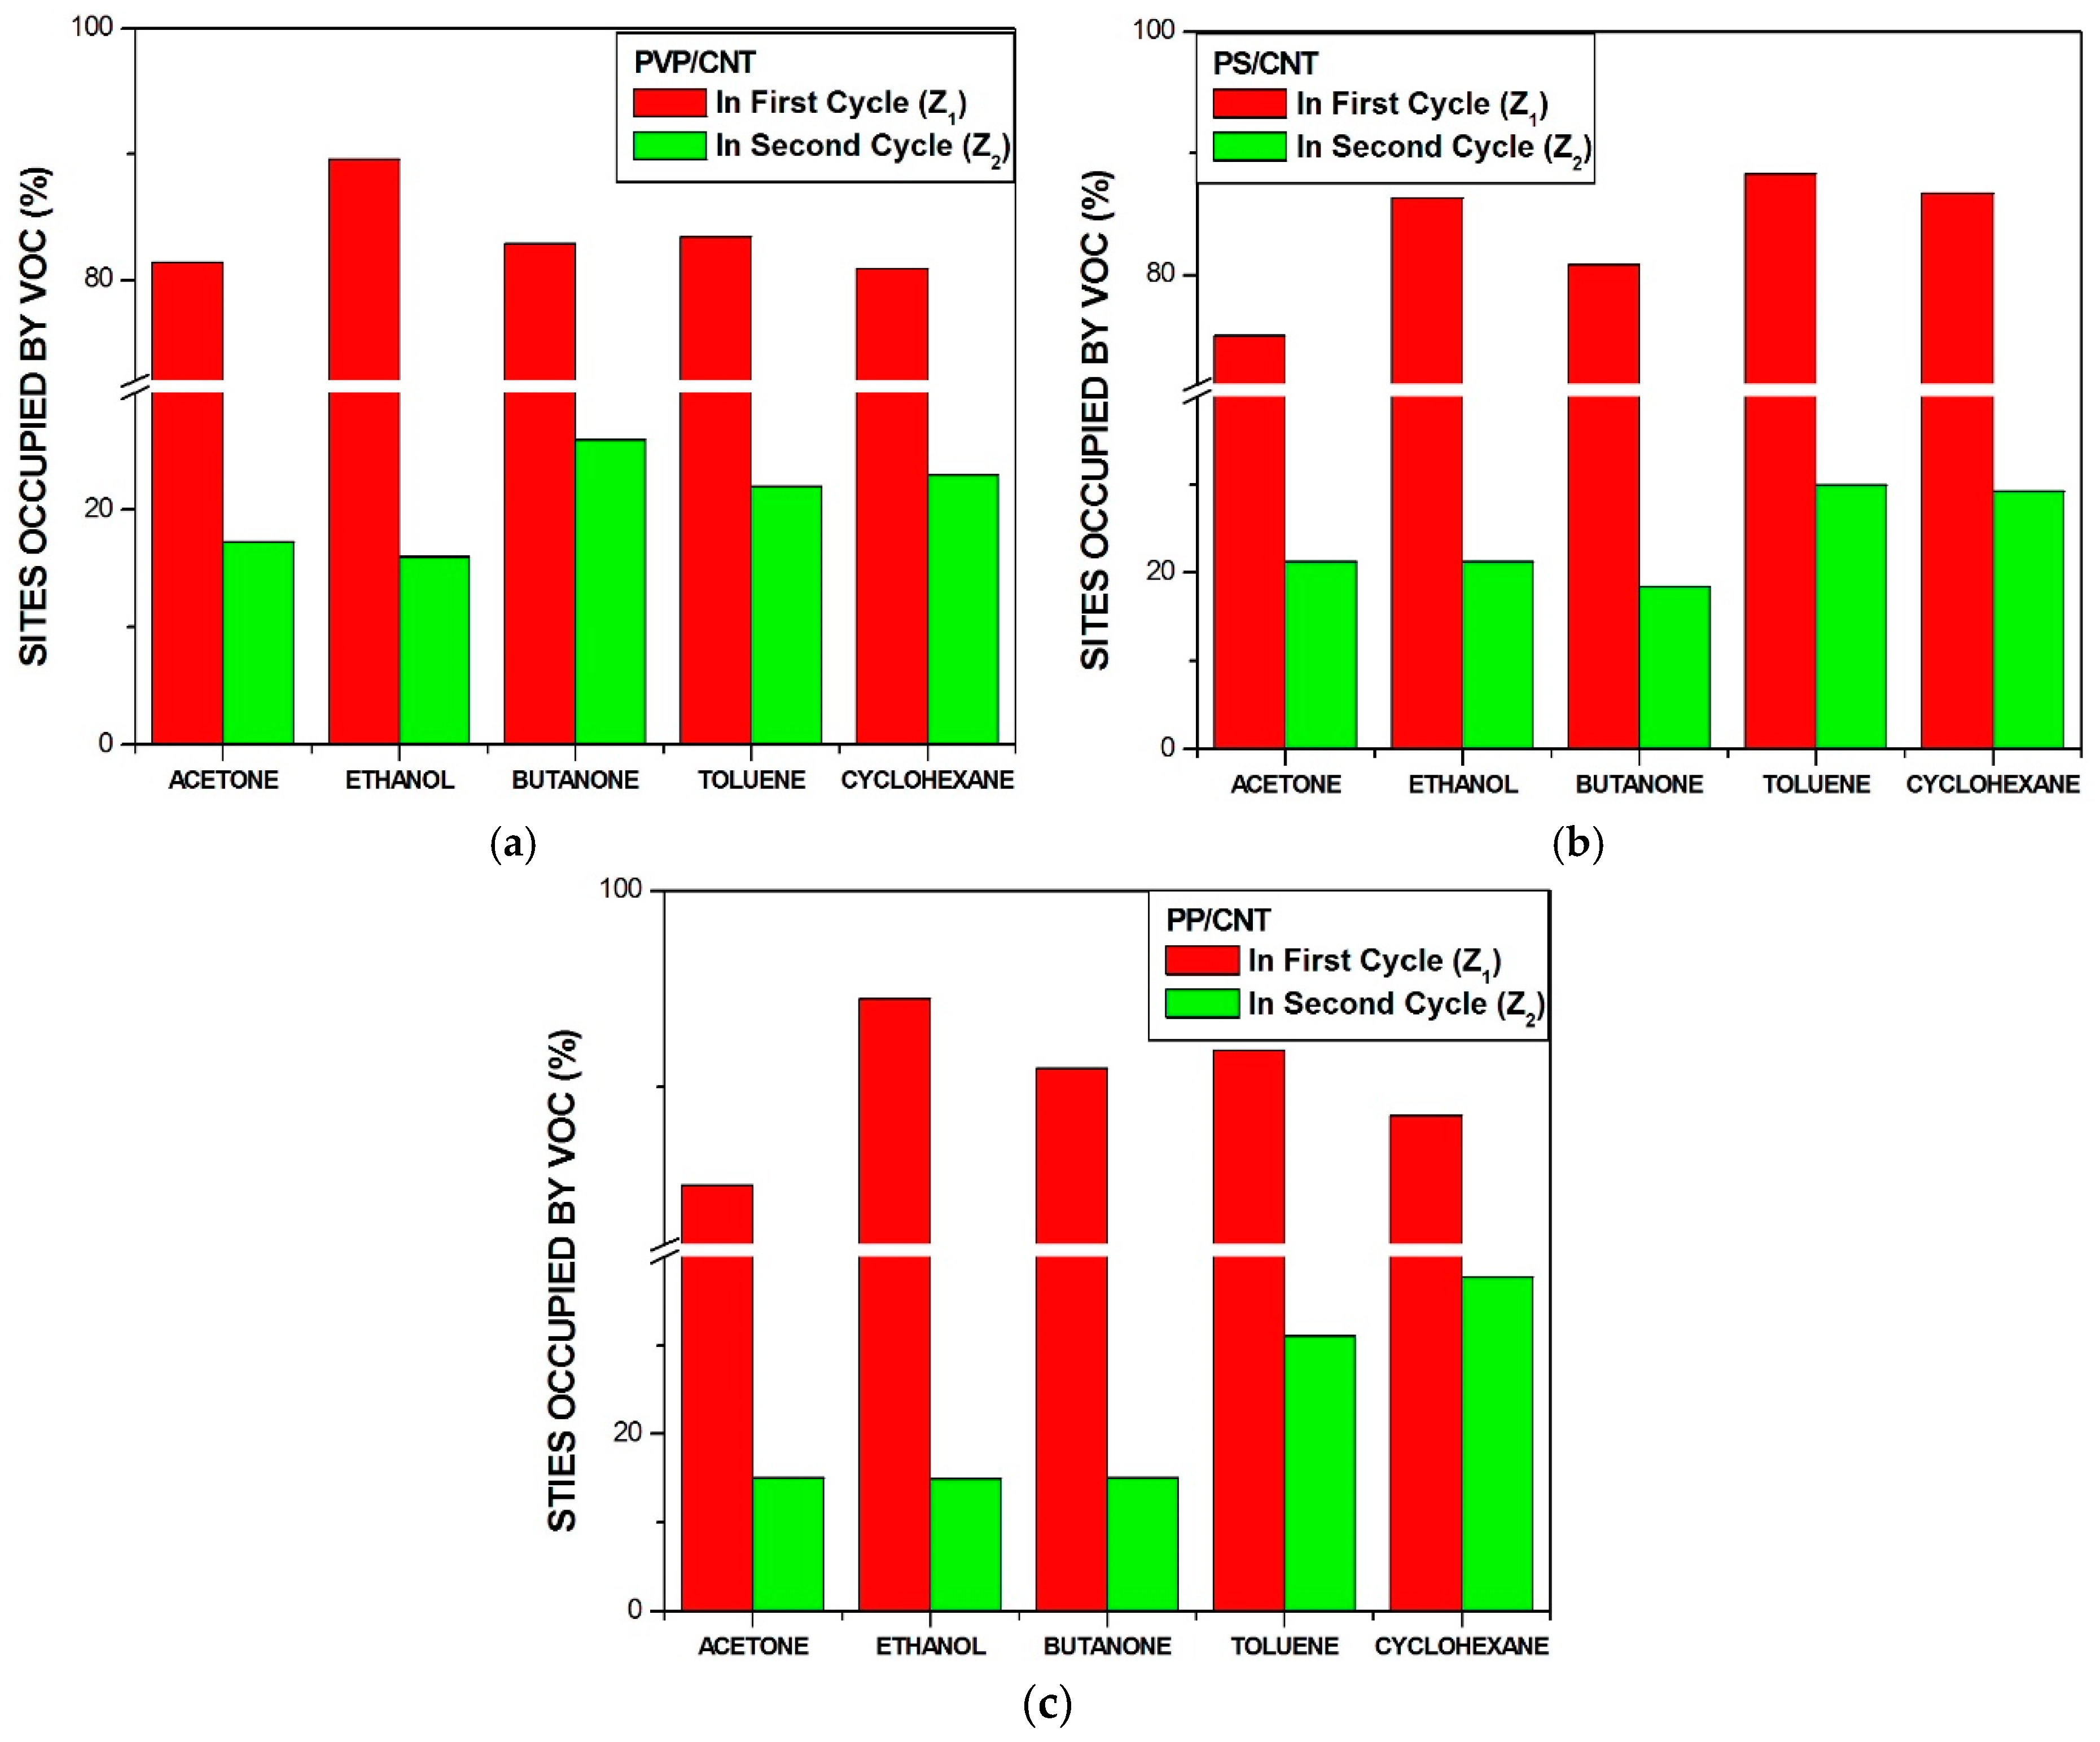
Firstly, when polar molecules such as H2O are occupying active sites, they are hindering the absorption of newly arriving molecules in particular at the conducting junctions but depending on their affinity with the macromolecules of the CPC transducer, some sites can be freed.
Secondly, the non-polar vapors like cyclohexane and toluene are more effective to free the active sites occupied by water at junctions, than polar VOC such as acetone and ethanol because their affinity for the polymer matrices is larger. Additionally, polar–polar interactions resulting in partial solubility of polar solvents molecules in water could prevent them from directly competing on the sites. This behavior is further confirmed in Section 3.3, and the corresponding mechanism is discussed in Section 3.4.
The third kind of effect concerns semi-polar vapors like butanone which adsorption depends on the nature of the macromolecules of sensors, they can behave like non-polar vapors for PVP and like polar ones for aPS and aPP.

Effects of Interactions between VOC Molecules and Sensor’s Macromolecules

As already pointed out in the previous paragraph, the effect of water on VOC detection depends on the number of adsorption sites available, on the polarity of vapors but also on the difference of interactions between these vapor molecules and the polymer matrix of the transducer. Behind the simple statement of the hydrophilic nature of PVP and the hydrophobic behavior of PS and PP that can explain roughly the detection results obtained, it is interesting to refine this analysis by considering the diffusion kinetics of analytes in the transducer. An indirect way to approach this notion is to follow the time required by the transducer to reach a plateau (the saturation time tS is determined by the intercept between the slope at origin and the plateau), and the speed at which this equilibrium is reached (the saturation rate is determined by the slope at origin M 2 W ). These two parameters can be easily determined from the typical curves expressing the chemo-resistive response Ar against time of Figure 5. Data have been collected only from experiments 1and 2 during their third cycle (water in experiment 1 and VOC in experiment 2) and tS and M 2 W have been plotted in Figure 7a,b respectively.
It can be noticed that for a hydrophilic transducer such as PVP-CNT (red bars in Figure 7a), the saturation time of all solvents in the third cycle is always larger than that of water in the third cycle. But, whereas for polar vapors like acetone and ethanol tS is only slightly longer than that of water, for non-polar vapors such as toluene and cyclohexane tS can be respectively 60% and 40% longer than that of water. As already noticed butanone has an intermediate behavior due to its semi-polar nature. This means that when the transducer is hydrophilic, water can diffuse to the remaining junctions almost at the same speed as other polar vapors but much faster than the non-polar vapors, which is providing another way to discriminate analytes than simply using the maximum amplitude of signals.
For transducers with hydrophobic polymer matrices like aPS and aPP (respectively green and blue bars in Figure 7a), the diffusion behavior is rather different from that observed with PVP. All solvents in both experiments have nearly similar saturation times. Only cyclohexane is found to reach quicker the saturation than water with aPS based transducers.
The same trends are observed with the rate of absorption of water in the third cycle, after vQRS have already been exposed to each VOC. Figure 7b shows that while the speed of diffusion of water in PVP is decreasing with the polarity of the solvent that preceded it, in aPS and aPP almost no variation of rate of adsorption is seen. Nevertheless, it seems that water diffuses about 30% more quickly in aPP than in aPS and that when cyclohexane preceded water its rate was slightly increased.
To summarize, for transducers based on non-polar matrices such as aPP and aPS, the order in which the solvents are submitted to the vQRS does not change much their speed of diffusion, whereas for a polar based transducer like PVP, the order matters, and the rate of diffusion of water increases when it has been preceded by a polar vapor. Moreover, in this case, the time of saturation of non-polar vapors preceded by water are increased of 30 to 50%.

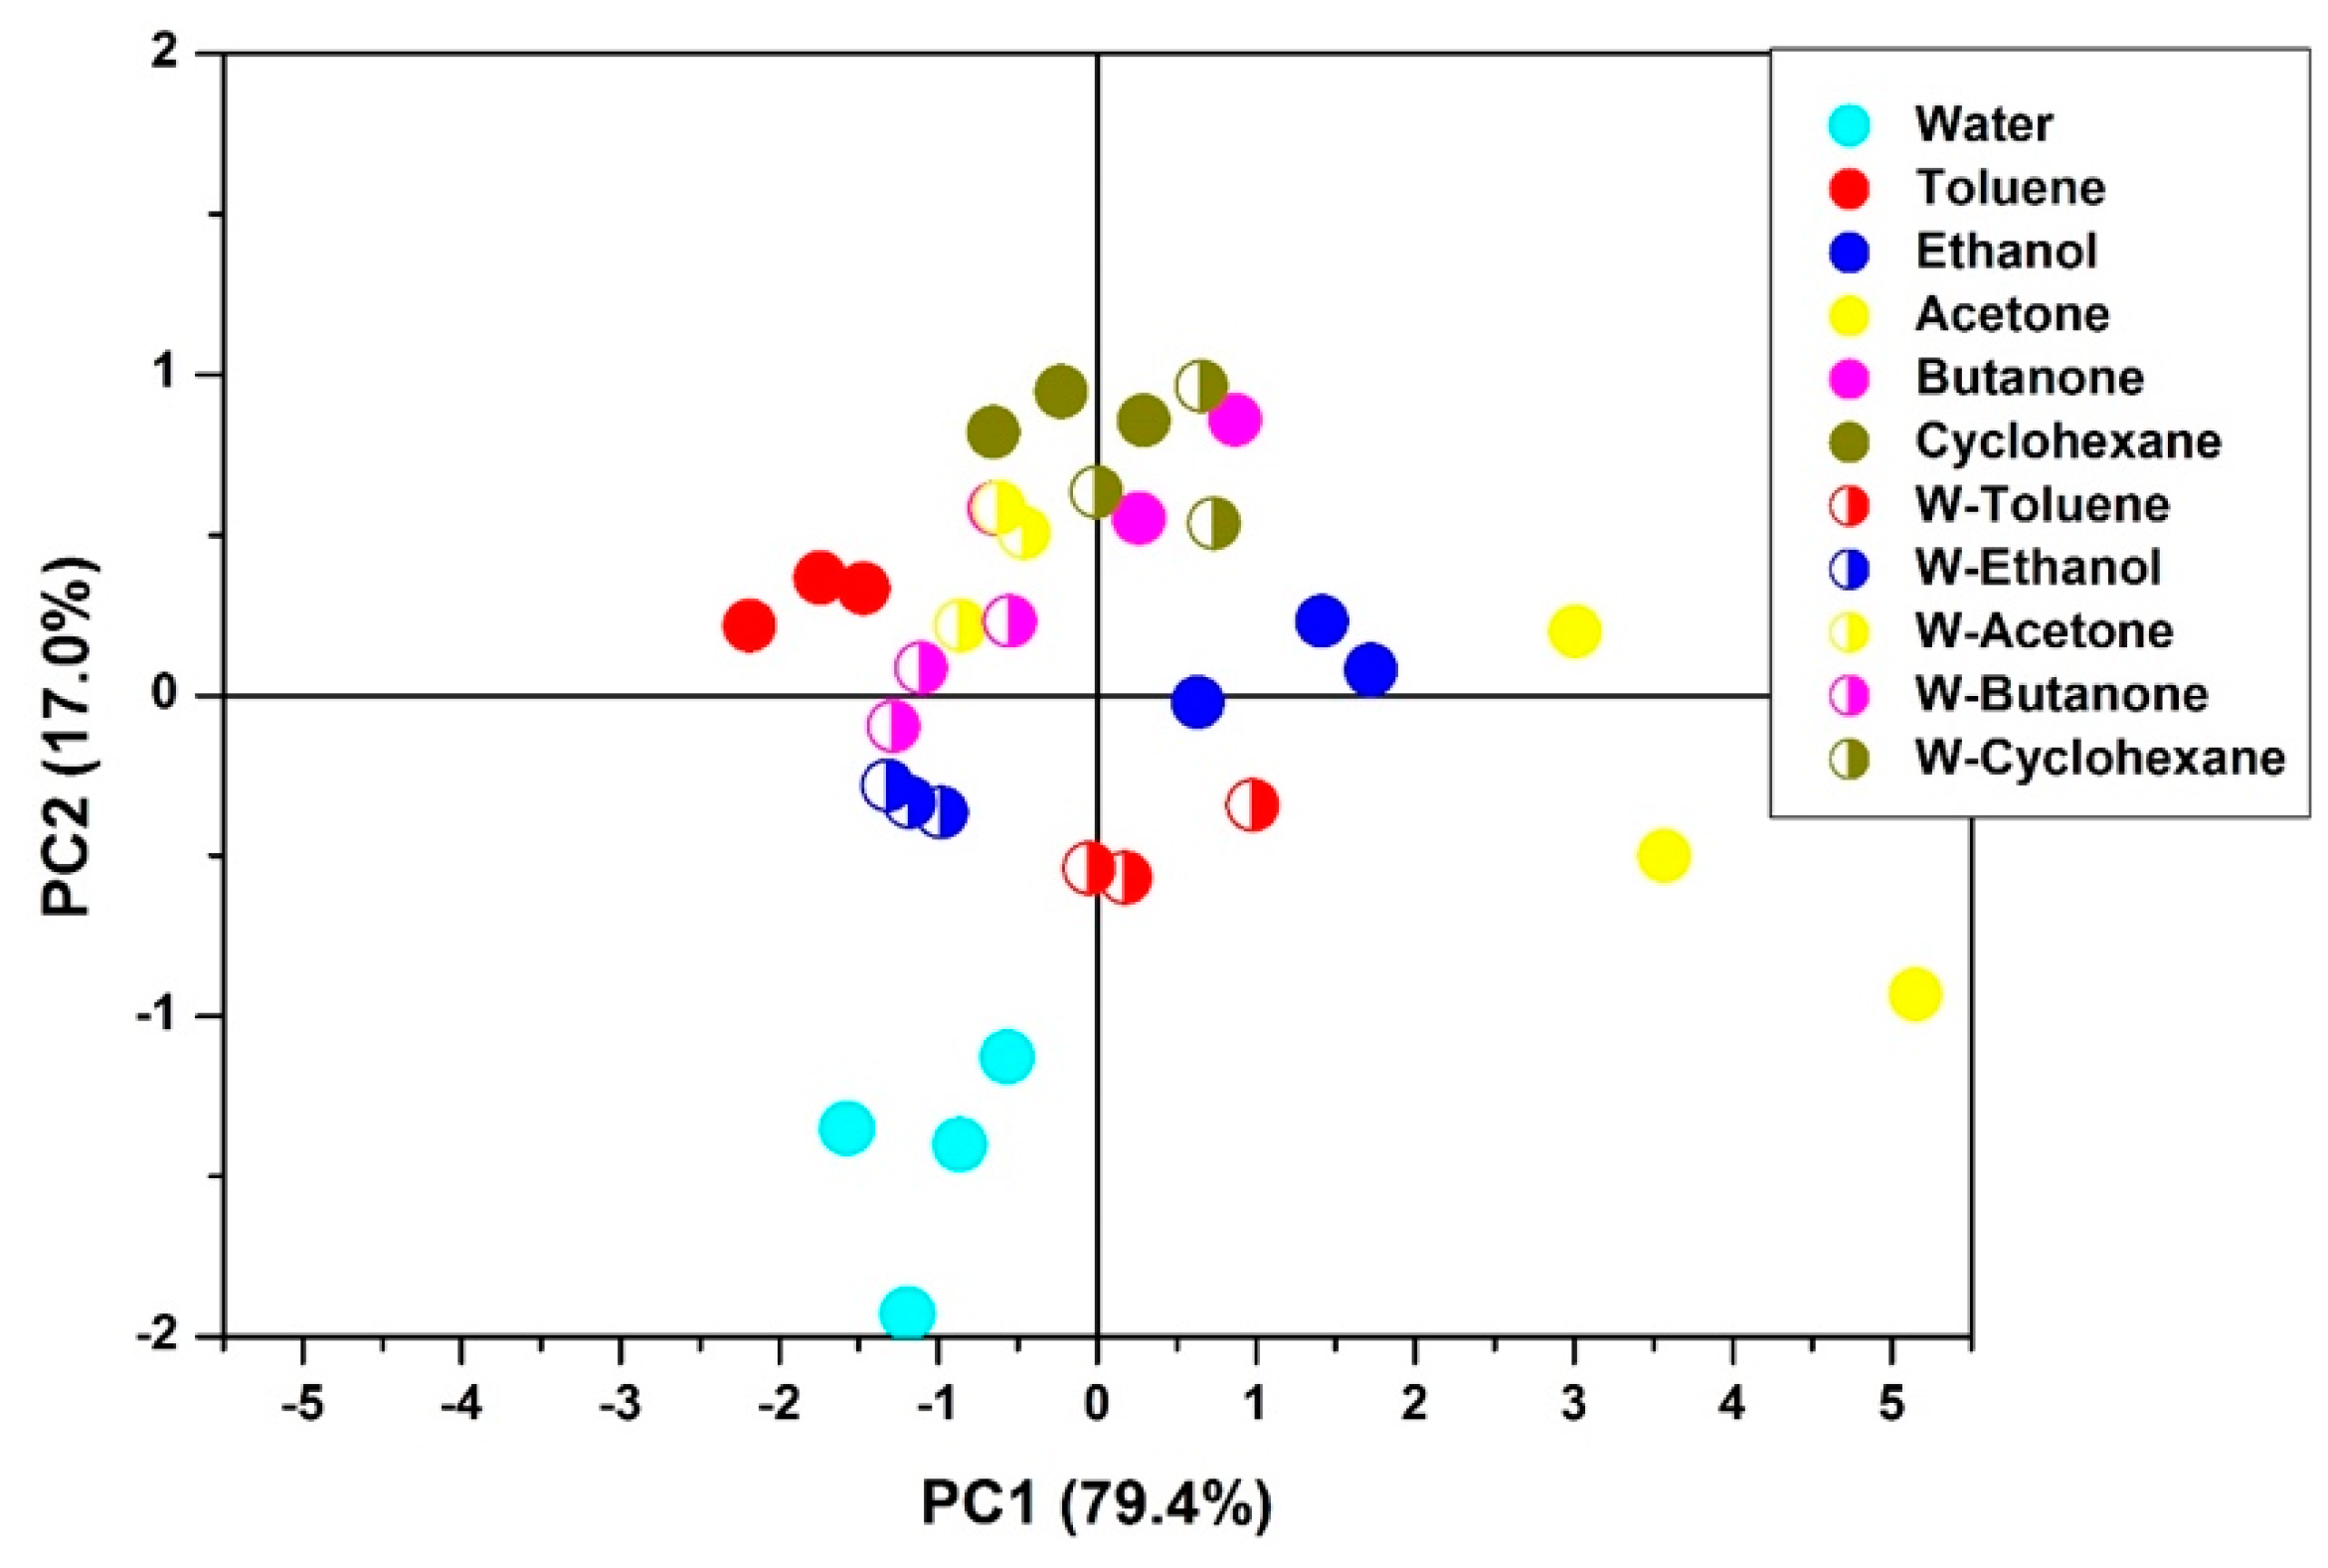
3.3. Sensing Some Tens of ppm of VOC in a Humid Environment

New experiments have been conducted using the setup described in Figure 1d. In a first configuration, both water and VOC streams are blended with an initial concentration of 100 ppm and flow rates of 100 cm3·min−1, yielding a total mixture of 200 ppm concentration and 200 cm3·min−1 flow rate. The resulting relative amplitudes of the three sensors exposed to the set of five VOC are collected in Figure 8. It can be observed that water tends to decrease the response amplitude of all polar VOC (acetone and ethanol) whatever the transducer. Inversely, the response of non-polar VOC (toluene and cyclohexane) is increased when mixed with water. This behavior is found to be similar for the three vQRS at 100 ppm of VOC in a humid atmosphere but also at 12.5 ppm as it will be seen in the following. The response of the semi-polar vapor (butanone) is depending on the nature of the sensor’s polymer matrix according to the discussion made in the previous paragraph.
In the second configuration, the concentration of VOC is decreased from 100 to 12.5 ppm in 100 ppm of water at the same flow rate. It is interesting to note that even at very low content (12.5 ppm), all vQRS can detect the VOC despite a H2O content about eight times larger. Quantitatively, no changes are observed in the responses of the PVP-CNT transducer, when it was exposed to 12.5 ppm of ethanol in 100 ppm of water, whereas its amplitude was decreased of about 30% for acetone. However, the amplitude of the signals obtained for non-polar vapors were increased of 70% and 16% for toluene and cyclohexane respectively. For butanone, AR was decreased of 11.7% at 100 ppm but it was increased of 4.5% at 12.5 ppm (Figure 8 a,b). For the aPS-CNT transducer a decrease in Ar of 8.5% and 26.5% can be seen for an exposure to 12.5 ppm of acetone and ethanol in 100 ppm of water respectively. For non-polar vapors, Ar was increased of 15% and 35% for toluene and cyclohexane respectively whereas the response to butanone was decreased of 11.7% at 100 ppm and increased by 4.5% at 12.5 ppm. Similarly, Ar of aPP-CNT transducer decreased of 18% when exposed to 12.5 ppm of acetone in 100 ppm of water but did not change much more than by a couple of percentage points for cyclohexane, toluene, and butanone.
In summary, the procedure used in this paragraph allowed to see the effect of the amount of water on the detection of VOC, when the VOC:H2O ratio is decreased from 1:1 to 1:8. In the first case Ar of the VOC/H2O mix is inferior to that of the pure solvent when the VOC is polar and superior when the VOC is non-polar. Butanone has the same behavior as the polar solvent. In the second case, the same trends are kept excepted for butanone which behaves like non-polar solvents. Moreover, the aPP-CNT transducer has almost no more selectivity excepted for acetone, whereas PVP-CNT and aPS-CNT have preserved a discrimination ability. Figure 9 is showing a 2D representation of the discrimination ability of the three vQRS after a PCA mapping of their responses to the five pure VOC at a concentration of 100 ppm and to their mixes with 100 ppm of water (in a 1:1 ratio).
Figure 9 shows that using a set of three vQRS (one polar and two non-polar) allows to discriminate well the five pure VOC between them, the mixes between them, but that there can be some overlapping between pure VOC and mixes that could require the use of a third projection PC3, or the introduction in the sensor’s array of a fourth vQRS. Additionally, it is found that the average distance between the cluster’s centres for the pure solvents is 66.54% less important than for the mixes.

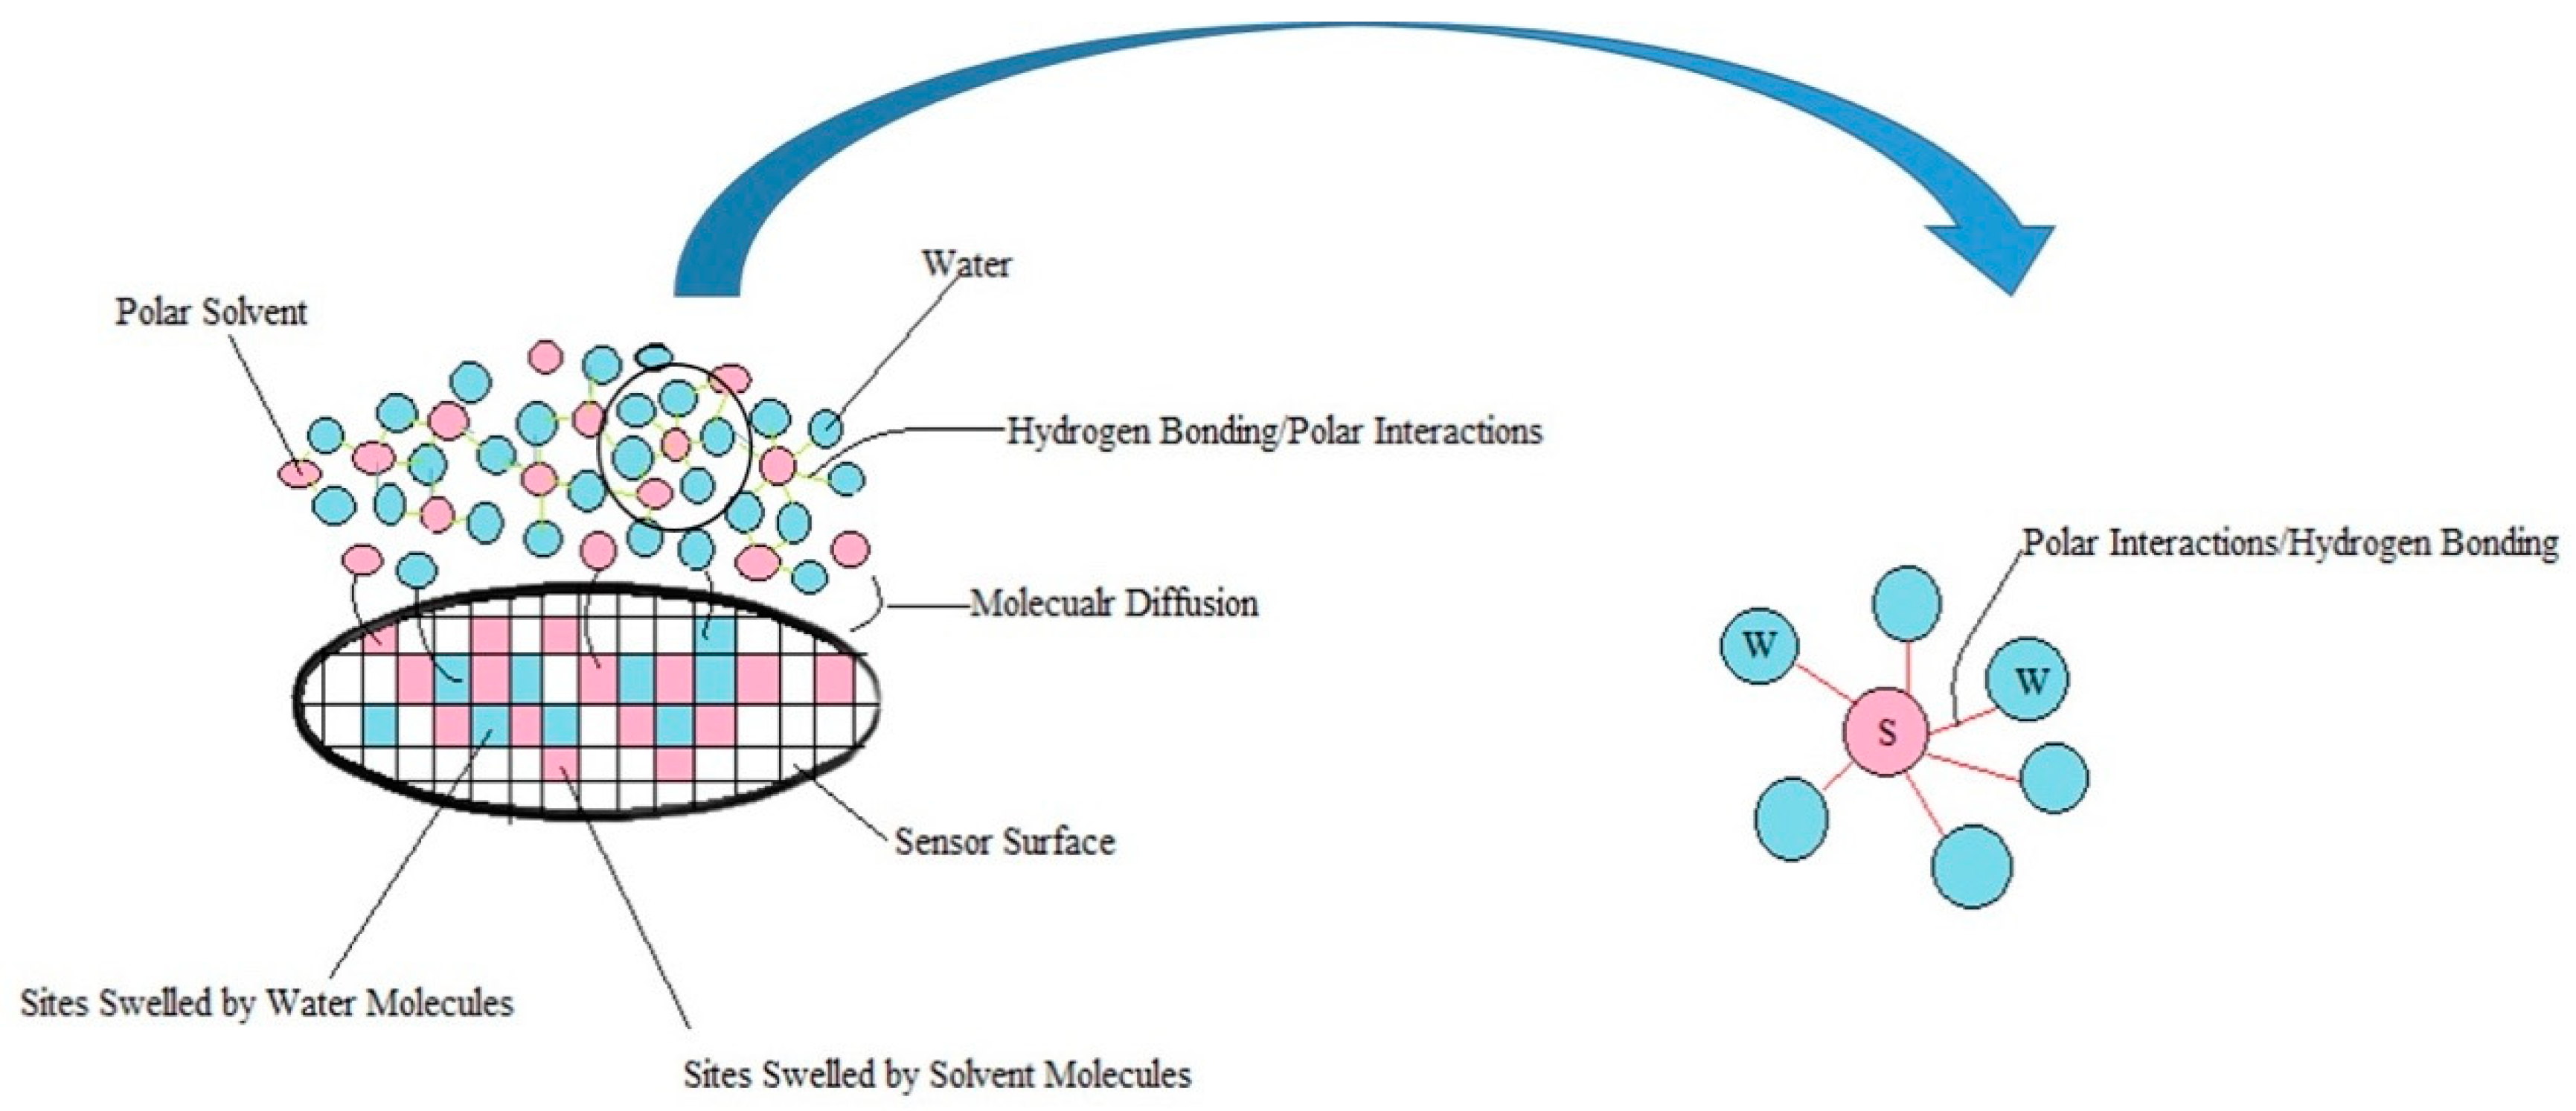
3.4. Chemo-Resistive Behavior of vQRS Exposed to VOC-H2O Mixes

The chemo-resistive behavior of vQRS exposed to mixes of VOC and water vapors is rather complex as it depends on the multiple interactions that the different molecules involved can have together. Actually, vapor molecules can interact together before they can interact with carbon nanotubes and the macromolecules of the matrix. Off course the nature of these complex interactions will also depend on the number of molecules involved and the intensity and polarity of the interactions, what cannot be completely investigated in this paper. Although the polar vapors studied are not true electrolytes, they can give rise to strong H-bonding with water molecules. In the vapor mixture polar molecules like acetone can be surrounded by several water molecules depending on the faction of both, to make a stable quasi clathrate structure [69]. Therefore, the structuring of water and VOC molecules according to the scheme described in Figure 10 could explain the fact that vQRS are not able to detect the same amount of acetone and ethanol molecules, compared to single vapors, when they are blended with the same quantity of water molecules (100 ppm). Thus, the binding of acetone with water molecules could prevent part of them to diffuse and swell the nano-junctions leading to chemo-resistive responses of least amplitude.
For non-polar VOC molecules such as toluene and cyclohexane no strong interactions are expected with the water molecules. When they are mixed with water they just compete with these molecules for the adsorption on the transducers’ surface and the diffusion to the active sites of disconnection of the CNT conducting architecture. This time the competition depends on the specific interactions between the vapors and the transducers’ macromolecules, that can be either van der Waals or hydrogen bondings. Hydrophilic transducers will absorb more likely water whereas hydrophobic ones will favour the absorption of non-polar vapors. In both situations, it seems that the sensors can absorb a larger number of molecules compared to pure non-polar VOC, as the chemo-resistive responses are always larger for the mixes. This behavior suggests that water and non-polar VOC molecules don’t compete for exactly the same sites, thus leading to the disconnection of a larger possible number of nano-junctions as schematized in Figure 11. Semi-polar VOC like butanone have a more subtle behavior in between the two former cases evoked. It can behave like a polar VOC at 100 ppm in 100 ppm of water or like a non-polar vapor at 12.5 ppm in 100 ppm of water.
Right now, this phenomenon is not completely understood are requires additional experiments to make realistic assumptions. But it could be argued that the assembly of butanone with water molecules could change its polarity depending on the number of the later, i.e., a large amount of H2O could make butanone polar by completely covering it, whereas a too low quantity of H2O would not prevent the non-polar character of butanone to be expressed.

4. Conclusions

In the context of the emerging research field of volatolomics, intending to diagnose various serious diseases such as cancers by the imprint analysis of the VOC biomarkers emitted by the body with e-noses, it makes sense to study the impact of water vapor on the sensing behavior of a vQRS matrix.
Water molecules generally present in significant amounts in the volatolome (breath, urine, sweat, tears) were found to significantly affect the chemo-resistive responses to VOC biomarkers in several ways:
By combining with them before the adsorption on the transducer or competing with them for the adsorption on the nano-junctions. Humidity will also affect the adsorption of VOC on the polymer matrix of the transducers depending on their polarity. It is observed that the response of vQRS to polar VOC (tested with acetone and ethanol) is generally decreased by moisture whereas the opposite trend is obtained for non-polar VOC (tested with cyclohexane and toluene). For semi-polar vapors like butanone, the chemo-resistive behavior of mixes with water depends on the proportion of both vapors. These findings are suggesting that H2O by combining with analytes before their adsorption can compete or collaborate to respectively improve or degrade the detection by the vQRS.
The different experimental sequences of test shed light on the notion of “number of available active sites towards junctions’ disconnection”, for both polar and non-polar VOC, at the origin of the chemo-resistive signal. This brought elements of understanding and interpretations of non-trivial experiments of vapor sensing with VOC/H2O blends. For example, when submitting the vQRS to a VOC/H2O sequence both at saturation results in a negative contribution of H2O, whereas when the successive flows only contain 100 ppm of vapor, this contribution is positive. The order of the vapors also matters, and the comparison shows which amount of sites can be occupied by H2O or not, depending on the nature the VOC.
A better understanding of vQRS capability and robustness in the presence of moisture is also provided by experiments showing that VOC only present at 100 ppm and 12.5 ppm can be detected among 100 pmm of H2O, especially if a PCA projection is used. Although the evidence of the preservation of vQRS discrimination ability at low VOC concentrations was provided, it was of course strongly decreased with the number of analyte molecules and the ratio of H2O molecules. Thus, any device able to minimize the amount of water in the blend of vapor composing the volatolome will improve the pattern recognition and in fine the diagnostic score.
From a fundamental point of view, these findings show the necessity to take into account, during vapor sensing experiments on blends, the association of water molecules with other analytes that can result in either positive or negative effects on the chemo-resistive response Ar. By extension it can be considered that any volatile molecule can possibly interact with another analyte thus modifying their expected fingerprint when analyzed by the e-nose.
From a practical point of view, this means that after identification of the most abundant volatile species in a breath sample, several combinations of molecules in simples blends comprising only two or three analytes should be implemented in the training protocol of the e-nose. Moreover, the ability of vQRS to still permit measurements even in difficult experimental conditions, such as high moisture levels, would allow to use them without extensive extraction of water prior to analysis. Although their precision would be impacted by water, they could be able to detect molecules of interest otherwise extracted with water.
Finally, as all VOC studied were part of cancer biomarkers it is expected that the vQRS developed in this study would be worth to be implemented in e-noses used for extended studies on anticipated diagnosis of such disease.

Author Contributions

Data Curation, A.S.; Writing-Original Draft Preparation, A.S.; Writing-Review & Editing, J.F.F., M.C., V.C.; Supervision, J.F.F., M.C., V.C.

Funding

This research was funded by for the University of South Brittany (UBS).

Acknowledgements

We are grateful to M. Hervé BELLEGOU and Isabelle PILLIN for their contribution to this work and for funding this work.

Conflicts of Interest

The authors declare no conflict of interest.

References

  1. Gardner, J.W.; Shin, H.W.; Hines, E.L. An electronic nose system to diagnose illness. Sens. Actuators B Chem. 2000, 70, 19–24. [Google Scholar] [CrossRef]
  2. di Natale, C.; Macagnano, A.; Martinelli, E.; Paolesse, R.; D’Arcangelo, G.; Roscioni, C.; Finazzi-Agrò, A.; D’Amico, A. Lung cancer identification by the analysis of breath by means of an array of non-selective gas sensors. Biosens. Bioelectron. 2003, 18, 1209–1218. [Google Scholar] [CrossRef]
  3. Machado, R.F.; Laskowski, D.; Deffenderfer, O.; Burch, T.; Zheng, S.; Mazzone, P.J.; Mekhail, T.; Jennings, C.; Stoller, J.K.; Pyle, J.; et al. Detection of lung cancer by sensor array analyses of exhaled breath. Am. J. Respir. Crit. Care Med. 2005, 171, 1286–1291. [Google Scholar] [CrossRef] [PubMed]
  4. Hockstein, N.G.; Thaler, E.R.; Torigian, D.; Miller, W.T.; Deffenderfer, O.; Hanson, C.W. Diagnosis of pneumonia with an electronic nose: Correlation of vapor signature with chest computed tomography scan findings. Laryngoscope 2004, 114, 1701–1705. [Google Scholar] [CrossRef] [PubMed]
  5. Mazzone, P. Sniffing out lung cancer. Nat. Nanotechnol. 2009, 4, 621–622. [Google Scholar] [CrossRef] [PubMed]
  6. Dragonieri, S.; van der Schee, M.P.; Massaro, T.; Schiavulli, N.; Brinkman, P.; Pinca, A.; Carratú, P.; Spanevello, A.; Resta, O.; Musti, M.; et al. An electronic nose distinguishes exhaled breath of patients with Malignant Pleural Mesothelioma from controls. Lung Cancer. 2012, 75, 326–331. [Google Scholar] [CrossRef] [PubMed]
  7. Broza, Y.Y.; Zuri, L.; Haick, H. Combined volatolomics for monitoring of human body chemistry. Sci. Rep. 2014, 4, 1–6. [Google Scholar] [CrossRef] [PubMed]
  8. Costello, B.d.; Amann, A.; Al-Kateb, H.; Flynn, C.; Filipiak, W.; Khalid, T.; Osborne, D.; Ratcliffe, N.M. A review of the volatiles from the healthy human body. J. Breath Res. 2014, 8, 014001. [Google Scholar] [CrossRef]
  9. Konvalina, G.; Haick, H. Sensors for breath testing: From nanomaterials to comprehensive disease detection. Acc. Chem. Res. 2014, 47, 66–76. [Google Scholar] [CrossRef] [PubMed]
  10. Stone, B.G.; Besse, T.J.; Duane, W.C.; Evans, C.D.; DeMaster, E.G. Effect of regulating cholesterol biosynthesis on breath isoprene excretion in men. Lipids 1993, 28, 705–708. [Google Scholar] [CrossRef] [PubMed]
  11. Lebovitz, H.E. Diabetic ketoacidosis. Lancet 1995, 345, 767–772. [Google Scholar] [CrossRef]
  12. Cope, K.; Risby, T.; Diehl, A.M. Increased gastrointestinal ethanol production in obese mice: Implications for fatty liver disease pathogenesis. Gastroenterology 2000, 119, 1340–1347. [Google Scholar] [CrossRef] [PubMed]
  13. Davis, P.L.; Cortivo, L.A.D.; Maturo, J. Endogenous isopropanol: Forensic and biochemical implications. J. Anal. Toxicol. 1984, 8, 209–212. [Google Scholar] [CrossRef] [PubMed]
  14. Davies, S.; Spanel, P.; Smith, D. Quantitative analysis of ammonia on the breath of patients in end-stage renal failure. Kidney Int. 1997, 52, 223–228. [Google Scholar] [CrossRef] [PubMed]
  15. Baldwin, S.R.; Grum, C.M.; Boxer, L.A.; Simon, R.H.; Ketai, L.H.; Devall, L.J. Oxidant activity in expired breath of patients with adult respiratory distress syndrome. Lancet 1986, 327, 11–14. [Google Scholar] [CrossRef]
  16. Chan, H.P.; Lewis, C.; Thomas, P.S. Exhaled breath analysis: Novel approach for early detection of lung cancer. Lung Cancer 2009, 63, 164–168. [Google Scholar] [CrossRef] [PubMed]
  17. Davis, C.S.; Gagermeier, J.; Dilling, D.; Alex, C.; Lowery, E.; Kovacs, E.J.; Love, R.B.; Fisichella, P.M. A review of the potential applications and controversies of non-invasive testing for biomarkers of aspiration in the lung transplant population. Clin. Transplant. 2010, 24, E54–E61. [Google Scholar] [CrossRef]
  18. Taylor, R.; Agius, L. The biochemistry of diabetes. Biochem. J. 1988, 250, 625–640. [Google Scholar] [CrossRef] [Green Version]
  19. Phillips, M.; Cataneo, R.N.; Cheema, T.; Greenberg, J. Increased breath biomarkers of oxidative stress in diabetes mellitus. Clin. Chim. Acta 2004, 344, 189–194. [Google Scholar] [CrossRef]
  20. Davidson, G.P. The breath hydrogen test: An evaluation. J. Paediatr. Child Heal. 1988, 24, 1–2. [Google Scholar] [CrossRef]
  21. Miekisch, W.; Schubert, J.K.; Noeldge-Schomburg, G.F.E. Diagnostic potential of breath analysis—Focus on volatile organic compounds. Clin. Chim. Acta 2004, 347, 25–39. [Google Scholar] [CrossRef] [PubMed]
  22. di Natale, C.; Paolesse, R.; Martinelli, E.; Capuano, R. Solid-state gas sensors for breath analysis: A review. Anal. Chim. Acta 2014, 824, 1–17. [Google Scholar] [CrossRef] [PubMed]
  23. Tisch, U.; Haick, H. Chemical sensors for breath gas analysis: The latest developments at the Breath Analysis Summit 2013. J. Breath Res. 2014, 8, 27103. [Google Scholar] [CrossRef] [PubMed]
  24. Zee, F.; Judy, J.W. Micromachined polymer-based chemical gas sensor array. Sens. Actuators B Chem. 2001, 72, 120–128. [Google Scholar] [CrossRef]
  25. Lonergan, M.C.; Severin, E.J.; Doleman, B.J.; Beaber, S.A.; Grubbs, R.H.; Lewis, N.S. Array-based vapor sensing using chemically sensitive, carbon black−polymer resistors. Chem. Mater. 1996, 8, 2298–2312. [Google Scholar] [CrossRef]
  26. Zilberman, Y.; Tisch, U.; Shuster, G.; Pisula, W.; Feng, X.; Müllen, K.; Haick, H. Carbon nanotube/hexa-peri-hexabenzocoronene bilayers for discrimination between nonpolar volatile organic compounds of cancer and humid atmospheres. Adv. Mater. 2010, 22, 4317–4320. [Google Scholar] [CrossRef] [PubMed]
  27. Peng, G.; Tisch, U.; Haick, H. Detection of nonpolar molecules by means of carrier scattering in random networks of carbon nanotubes: Toward diagnosis of diseases via breath samples. Nano Lett. 2009, 9, 1362–1368. [Google Scholar] [CrossRef] [PubMed]
  28. Kumar, B.; Park, Y.T.; Castro, M.; Grunlan, J.C.; Feller, J.F. Fine control of carbon nanotubes-polyelectrolyte sensors sensitivity by electrostatic layer by layer assembly (eLbL) for the detection of volatile organic compounds (VOC). Talanta 2012, 88, 396–402. [Google Scholar] [CrossRef] [PubMed]
  29. Mills, A.; Lepre, A.; Wild, L. Breath-by-breath measurement of carbon dioxide using a plastic film optical sensor. Sens. Actuators B Chem. 1997, 39, 419–425. [Google Scholar] [CrossRef]
  30. Cui, D.; Cai, X.; Han, J.; He, Z.; Zhu, H.; Feng, G. Lipid LB films for room temperature ethanol gas assay. Sens. Actuators B Chem. 1997, 45, 229–232. [Google Scholar] [CrossRef]
  31. Boot, J.D.; de Ridder, L.; de Kam, M.L.; Calderon, C.; Mascelli, M.A.; Diamant, Z. Comparison of exhaled nitric oxide measurements between NIOX MINO® electrochemical and Ecomedics chemiluminescence analyzer. Respir. Med. 2008, 102, 1667–1671. [Google Scholar] [CrossRef] [PubMed]
  32. Kuban, P.; Berg, J.M.; Dasgupta, P.K. Durable microfabricated high-speed humidity sensors. Anal. Chem. 2004, 76, 2561–2567. [Google Scholar] [CrossRef] [PubMed]
  33. Eranna, G.; Joshi, B.C.; Runthala, D.P.; Gupta, R.P. Oxide materials for development of integrated gas sensors? A comprehensive review. Crit. Rev. Solid State Mater. Sci. 2004, 29, 111–188. [Google Scholar] [CrossRef]
  34. Cho, S.Y.; Yoo, H.W.; Kim, J.Y.; Jung, W.B.; Jin, M.L.; Kim, J.S.; Jeon, H.J.; Jung, H.T. High-resolution p-type metal oxide semiconductor nanowire array as an ultrasensitive sensor for volatile organic compounds. Nano Lett. 2016, 16, 4508–4515. [Google Scholar] [CrossRef] [PubMed]
  35. Shehada, N.; Brönstrup, G.; Funka, K.; Christiansen, S.; Leja, M.; Haick, H. Ultrasensitive silicon nanowire for real-world gas sensing: Noninvasive diagnosis of cancer from breath volatolome. Nano Lett. 2015, 15, 1288–1295. [Google Scholar] [CrossRef] [PubMed]
  36. Breer, H. Olfactory receptors: Molecular basis for recognition and discrimination of odors. Anal. Bioanal. Chem. 2003, 377, 427–433. [Google Scholar] [CrossRef] [PubMed]
  37. Missbach, C.; Dweck, H.K.M.; Vogel, H.; Vilcinskas, A.; Stensmyr, M.C.; Hansson, B.S.; Grosse-Wilde, E. Evolution of insect olfactory receptors. Elife 2014, 3. [Google Scholar] [CrossRef] [PubMed] [Green Version]
  38. Wasilewski, T.; Gębicki, J.; Kamysz, W. Advances in olfaction-inspired biomaterials applied to bioelectronic noses. Sens. Actuators B Chem. 2018, 257, 511–537. [Google Scholar] [CrossRef]
  39. Amann, A.; Poupart, G.; Telser, S.; Ledochowski, M.; Schmid, A.; Mechtcheriakov, S. Applications of breath gas analysis in medicine. Int. J. Mass Spectrom. 2004, 239, 227–233. [Google Scholar] [CrossRef]
  40. Majchrzak, T.; Wojnowski, W.; Piotrowicz, G.; Gębicki, J.; Namieśnik, J. Sample preparation and recent trends in volatolomics for diagnosing gastrointestinal diseases. TrAC Trends Anal. Chem. 2018, 108, 38–49. [Google Scholar] [CrossRef]
  41. Smith, D.; Wang, T.; Sulé-Suso, J.; Spanel, P.; el Haj, A. Quantification of acetaldehyde released by lung cancer cells in vitro using selected ion flow tube mass spectrometry. Rapid Commun. Mass Spectrom. 2003, 17, 845–850. [Google Scholar] [CrossRef] [PubMed]
  42. Miekisch, W.; Kischkel, S.; Sawacki, A.; Liebau, T.; Mieth, M.; Schubert, J.K. Impact of sampling procedures on the results of breath analysis. J. Breath Res. 2008, 2, 026007. [Google Scholar] [CrossRef] [PubMed]
  43. Pleil, J.D.; Lindstrom, A.B. Measurement of volatile organic compounds in exhaled breath as collected in evacuated electropolished canisters. J. Chromatogr. B Biomed. Sci. Appl. 1995, 665, 271–279. [Google Scholar] [CrossRef]
  44. Mleth, M.; Schubert, J.K.; Gröger, T.; Sabei, B.; Kischkel, S.; Fuchs, P.; Hein, D.; Zimmermann, R.; Miekisch, W. Automated needle trap heart-cut GC/MS and needle trap comprehensive two-dimensional GC/TOF-MS for breath gas analysis in the clinical environment. Anal. Chem. 2010, 82, 2541–2551. [Google Scholar] [CrossRef]
  45. Knutson, M.D.; Viteri, F.E. Concentrating breath samples using liquid nitrogen: A reliable method for the simultaneous determination of ethane and pentane. Anal. Biochem. 1996, 242, 129–135. [Google Scholar] [CrossRef] [PubMed]
  46. Grote, C.; Pawliszyn, J. Solid-phase microextraction for the analysis of human breath. Anal. Chem. 1997, 69, 587–596. [Google Scholar] [CrossRef]
  47. Nag, S.; Sachan, A.; Castro, M.; Choudhary, V.; Feller, J.F. Spray layer-by-layer assembly of POSS functionalized CNT quantum chemo-resistive sensors with tuneable selectivity and ppm resolution to VOC biomarkers. Sens. Actuators B Chem. 2016, 222, 362–373. [Google Scholar] [CrossRef]
  48. Linders, M.J.G.; van den Broeke, L.J.P.; Kapteijn, F.; Moulijn, J.A.; van Bokhoven, J.J.G.M. Binary adsorption equilibrium of organics and water on activated carbon. AIChE J. 2001, 47, 1885–1892. [Google Scholar] [CrossRef]
  49. Cal, M.P.; Rood, M.J.; Larson, S.M. Removal of VOCs from humidified gas streams using activated carbon cloth. Gas Sep. Purif. 1996, 10, 117–121. [Google Scholar] [CrossRef]
  50. Sullivan, P.D.; Rood, M.J.; Hay, K.J.; Qi, S. Adsorption and electrothermal desorption of hazardous organic vapors. J. Environ. Eng. 2001, 127, 217–223. [Google Scholar] [CrossRef]
  51. Dreisbach, B.F.; Lösch, H.W. Adsorption measurement of water/ethanol mixtures on activated carbon fiber. Chem. Eng. Technol. 2001, 24, 1001–1005. [Google Scholar] [CrossRef]
  52. Heinen, A.W.; Peters, J.A.; van Bekkum, H. Competitive adsorption of water and toluene on modified activated carbon supports. Appl. Catal. A Gen. 2000, 194, 193–202. [Google Scholar] [CrossRef]
  53. Salame, I.I.; Bandosz, T.J. Adsorption of water and methanol on micro- and mesoporous wood-based activated carbons. Langmuir 2000, 16, 5435–5440. [Google Scholar] [CrossRef]
  54. Bandosz, T.J.; Jagiełło, J.; Schwarz, J.A.; Krzyzanowski, A. Effect of surface chemistry on sorption of water and methanol on activated carbons. Langmuir 1996, 12, 6480–6486. [Google Scholar] [CrossRef]
  55. Taqvi, S.M.; Appel, W.S.; LeVan, M.D. Coadsorption of organic compounds and water vapor on BPL activated carbon. 4. Methanol, ethanol, propanol, butanol, and modeling. Ind. Eng. Chem. Res. 1999, 38, 240–250. [Google Scholar] [CrossRef]
  56. Rodríguez-Mirasol, J.; Bedia, J.; Cordero, T.; Rodríguez, J.J. Influence of water vapor on the adsorption of VOC on lignin-based activated carbons. Sep. Sci. Technol. 2005, 40, 3113–3135. [Google Scholar] [CrossRef]
  57. Moon, H.G.; Jung, Y.; Han, S.D.; Shim, Y.S.; Shin, B.; Lee, T.; Kim, J.S.; Lee, S.; Jun, S.C.; Park, H.H.; et al. Chemiresistive electronic nose toward detection of biomarkers in exhaled breath. ACS Appl. Mater. Interfaces. 2016, 8, 20969–20976. [Google Scholar] [CrossRef] [PubMed]
  58. Belmares, M.; Blanco, M.; Goddard, W.A.; Ross, R.B.; Caldwell, G.; Chou, S.H.; Pham, J.; Olofson, P.M.; Thomas, C. Hildebrand and hansen solubility parameters from molecular dynamics with applications to electronic nose polymer sensors. J. Comput. Chem. 2004, 25, 1814–1826. [Google Scholar] [CrossRef] [PubMed]
  59. Thomson, G.W. The Antoine equation for vapor-pressure data. Chem. Rev. 1946, 38, 1–39. [Google Scholar] [CrossRef] [PubMed]
  60. Haaf, F.; Sanner, A.; Straub, F. Polymers of N-vinylpyrrolidone: Synthesis, characterization and uses. Polym. J. 1985, 17, 143–152. [Google Scholar] [CrossRef]
  61. Kitak, T.; Dumičić, A.; Planinšek, O.; Šibanc, R.; Srčič, S. Determination of solubility parameters of ibuprofen and ibuprofen lysinate. Molecules 2015, 20, 21549–21568. [Google Scholar] [CrossRef] [PubMed]
  62. Fedors, R.F. A method for estimating both the solubility parameters and molar volumes of liquids. Polym. Eng. Sci. 1974, 14, 147–154. [Google Scholar] [CrossRef]
  63. Lu, J.; Park, B.J.; Kumar, B.; Castro, M.; Choi, H.J.; Feller, J.F. Polyaniline nanoparticle-carbon nanotube hybrid network vapour sensors with switchable chemo-electrical polarity. Nanotechnology 2010, 21, 1–10. [Google Scholar] [CrossRef] [PubMed]
  64. Kumar, B.; Feller, J.F.; Castro, M.; Lu, J. Conductive bio-Polymer nano-Composites (CPC): Chitosan-carbon nanotube transducers assembled via spray layer-by-layer for volatile organic compound sensing. Talanta 2010, 81, 908–915. [Google Scholar] [CrossRef] [PubMed]
  65. Kumar, B.; Castro, M.; Feller, J.F. Controlled conductive junction gap for chitosan-carbon nanotube quantum resistive vapour sensors. J. Mater. Chem. 2012, 22, 10656–10664. [Google Scholar] [CrossRef]
  66. Nag, S.; Duarte, L.; Bertrand, E.; Celton, V.; Castro, M.; Choudhary, V.; Guégan, P.; Feller, J.F. Ultrasensitive QRS made by supramolecular assembly of functionalized cyclodextrins and graphene for the detection of lung cancer VOC biomarkers. J. Mater. Chem. B Biol. Med. 2014, 2, 6571–6579. [Google Scholar] [CrossRef]
  67. Chatterjee, S.; Castro, M.; Feller, J.F. An e-nose made of carbon nanotube based quantum resistive sensors for the detection of eighteen polar/nonpolar VOC biomarkers of lung cancer. J. Mater. Chem. B 2013, 1, 4563. [Google Scholar] [CrossRef]
  68. Bouvrée, A.; Feller, J.F.; Castro, M.; Grohens, Y.; Rinaudo, M. Conductive Polymer nano-bioComposites (CPC): Chitosan-carbon nanoparticle a good candidate to design polar vapour sensors. Sens. Actuators B Chem. 2009, 138, 138–147. [Google Scholar] [CrossRef]
  69. Toryanik, A.I.; Taranenko, V.N. Molecular mobility and structure in water-acetone mixtures. J. Struct. Chem. 1988, 28, 714–719. [Google Scholar] [CrossRef]
Figure 1. Experimental setup for the evaluation of the effects of water on vapor sensing properties: (A) Test of single flows of saturated solvents, (B) Test of flows of water and solvents in saturated conditions mixed in parallel, (C) Test of flows of water and solvents at 100 ppm (part per million) mixed successively, (D) Test of flows of water and solvents at 100 ppm mixed in parallel.
Chemosensors 06 00064 g001
Figure 2. (a) Comparison of the AR (maximum amplitude) obtained with PVP-CNT vQRS exposed to six VOC depending on the fabrication method. M1: Drop casting of the polymer solution on a sprayed multi-walled carbon nanotubes (CNT) random network, M2: Spraying of a polymer solution on a sprayed CNT random network, and M3: Spraying of a CPC (PVP-CNT) solutions onto interdigitated electrode; (b) Responses of PVP-CNT to cyclohexane for vQRS prepared by the three methods.
Chemosensors 06 00064 g002
Figure 3. (a) Principal component analysis (PCA) for pure VOC responses (solid circles) and water-VOC mixtures (hollow circles) in saturated vapor conditions, and Maximum relative amplitudes Ar of (b) PVP-CNT sensor, (c) PS-CNT sensor and (d) PP-CNT sensor exposed to pure solvent and their mixture with water.
Chemosensors 06 00064 g003aChemosensors 06 00064 g003b
Figure 4. General evolution of relative amplitude (AR) when submitted to N2-VOC-H2O saturated vapors sequences.
Chemosensors 06 00064 g004
Figure 5. (a) Scheme of sequences in experiment 1, (b) Scheme of sequences in experiment 2, (c) General response of the three sensors exposed successively to 100 ppm of VOC and water vapors, (d) General response of the three sensors exposed successively to 100 ppm of water and VOC vapors.
Chemosensors 06 00064 g005aChemosensors 06 00064 g005b
Figure 6. Comparison of percentage of active sites occupied by VOC molecules before and after the adsorption of water molecules: (a) for PVP-CNT sensor, (b) PS-CNT sensor, and (c) PP-CNT sensor.
Chemosensors 06 00064 g006
Figure 7. (a) Comparison of the saturation times tS in the third cycle (when sensors are exposed to water in experiment 1 and to the solvent in experiment 2) for all sensors, (b) Comparison of the water diffusion rate in the third cycle (Slope M 2 W ) of experiment 1 for all vQRS.
Chemosensors 06 00064 g007
Figure 8. Maximum amplitudes of the chemo-resistive responses Ar of vQRS exposed to five different VOC mixed with 100 ppm water, (a) PVP-CNT @100 ppm, (b) PVP-CNT @12.5 ppm, (c) aPS-CNT @100 ppm, (d) aPS-CNT @12.5 ppm, (e) aPP-CNT @100 ppm, and (f) aPP-CNT @12.5 ppm.
Chemosensors 06 00064 g008
Figure 9. PCA mapping for 100 ppm of VOC (solid circles in front of solvent name) and mixes of 100 ppm VOC with 100 ppm H2O (semi-solid circles of the same colour with W in front of the name of the solvent).
Chemosensors 06 00064 g009
Figure 10. Assumed structure of water molecules around polar VOC molecules.
Chemosensors 06 00064 g010
Figure 11. Assumed organisation of non-polar VOC with water molecules.
Chemosensors 06 00064 g011
Table 1. Some characteristics of quantum resistive vapor sensors (vQRS) polymer matrices. PVP: poly(vinylpyrrolidone); aPS: amorphous poly(styrene); aPP: amorphous poly(propylene).
NamePVPaPSaPP
Formula Chemosensors 06 00064 i001 Chemosensors 06 00064 i002 Chemosensors 06 00064 i003
Tg (°C)110 to 180100−10
Mn (g·mol−1)1.3 × 1062.5 × 1052.5 × 105
δT (MPa1/2)26.2822.6916.77
Table 2. Properties of volatile organic compounds (VOC) and concentration (ppm) of solvents at saturation in a vapor stream at room temperature according to Antoine’s equation.
SolventFormulaSolubility Parameter δT (MPa1/2) [58]% of Solubility in WaterConcentration at Saturation (ppm) [59]
WaterH2O47.81002763
EthanolC2H5OH26.51007005
AcetoneCH3COCH319.910027,751
ButanoneC2H5COCH319.12811,366
TolueneC6H5CH318.20.053371
CyclohexaneC6H1216.80.0111,729

