Article

Development of a Cost-Effective Sensing Platform for Monitoring Phosphate in Natural Waters

Insight Centre for Data Analytics, National Centre for Sensor Research, Dublin City University Glasnevin, Dublin 9, Ireland
*
Author to whom correspondence should be addressed.
Chemosensors 2018, 6(4), 57; https://doi.org/10.3390/chemosensors6040057
Submission received: 24 October 2018 / Revised: 19 November 2018 / Accepted: 21 November 2018 / Published: 27 November 2018

Abstract

:
A sensing platform for the in situ, real-time analysis of phosphate in natural waters has been realised using a combination of microfluidics, colorimetric reagent chemistries, low-cost LED-based optical detection and wireless communications. Prior to field deployment, the platform was tested over a period of 55 days in the laboratory during which a total of 2682 autonomous measurements were performed (854 each of sample, high standard and baseline, and 40 × 3 spiked solution measurements). The platform was subsequently field-deployed in a freshwater stream at Lough Rea, Co., Galway, Ireland, to track changes in phosphate over a five day period. During this deployment, 165 autonomous measurements (55 each of sample, high standard, and baseline) were performed and transmitted via general packet radio service (GPRS) to a web interface for remote access. Increases in phosphate levels at the sampling location coincident with rainfall events (min 1.45 µM to max 10.24 µM) were detected during the deployment. The response was found to be linear up to 50 µM PO43−, with a lower limit of detection (LOD) of 0.09 µM. Laboratory and field data suggest that despite the complexity of reagent-based analysers, they are reasonably reliable in remote operation, and offer the best opportunity to provide enhanced in situ chemical sensing capabilities. Modifications that could further improve the reliability and scalability of these platforms while simultaneously reducing the unit cost are discussed.

1. Introduction

Excessive nutrient loading in both fresh and marine ecosystems can have adverse effects on aquatic ecosystems [1]. Eutrophication as a result of elevated nutrients levels can result in the formation of harmful algal blooms leading to oxygen depletion, the release of algal toxins, formation of dead zones and contamination of drinking water supplies [2]. Impacts to drinking water supplies and aquatic ecosystems caused by excessive nutrient concentrations are estimated to cost US $210 billion annually in the US alone [3]. Traditionally, phosphate levels in natural water are taken by manual collection and subsequent laboratory analysis [4]. This process is not only labour intensive and costly, but provides limited regarding the spatial and temporal variation of the nutrient within the waterbody. Real-time monitoring provides reliable in situ measurements, which can provide spatial data that can enhance our understanding of the processes that drive increases in nutrient levels [5]. These data can be used to strengthen the development of projection models for mitigation measures to reduce economic and environmental impacts caused by nutrient stresses [6]. In recent years, advances in rapid prototyping related to 3D printing and fabrication technologies have dramatically improved the efficiency of producing in situ reagent-based analysers for monitoring key environmental parameters, such as phosphate levels in natural waters [7,8]. This improved prototyping efficiency is opening the way to more effective analytical platforms, combined with lower unit costs, higher frequency sampling, and longer service intervals for sensing platforms for nutrients (PO43−, NO2 and NO3) and other analytical targets in natural waters. Despite these advances, measurement uncertainty, reliability, robustness and cost of in situ analysers for long term deployments still significantly inhibit wide scale deployments necessary to generate data with enhanced spatial and temporal frequency to meet user and regulatory requirements. For example, the Marine Strategy Framework Directive (MSFD) and Water Framework Directive states that all member states must implement cost effective measures to obtain good environmental status (GES) by 2020 [9,10], thus driving the need for devices capable of providing in situ data at an acceptable unit cost. In this paper, we describe the development of an autonomous sensing platform for the detection of phosphate in natural waters with significantly improved operational performance and potentially much reduced cost of ownership. In comparison to earlier work [11,12], key components have been further optimised in terms of design and performance using rapid prototyping techniques such as 3D printing, laser ablation and microfabrication. The sensing platform is completely autonomous, incorporating sampling, automatic calibration, waste containment, and wireless communication. Automation is achieved via Arduino microcontrollers, while low cost pumps and solenoid valves allow precise fluidic handling. Microfluidic technologies have been employed for sample–reagent (1:1) mixing using shear forces in a serpentine channel, followed by colorimetric detection via an integrated 2 cm path length flow cell using a pulse width modulated LED, coupled with an in-line photodiode detector. The sensing platform has a linear detectable range up to 50 µM PO43− and a limit of detection (LOD) of 0.09 µM PO43−.

2. Materials and Methods

The sensing platform presented in Figure 1 is designed to fully automate the molybdovanadophosphoric ‘yellow’ colorimetric method for detection of soluble orthophosphate. Orthophosphate rapidly reacts with the reagent under acidic conditions to form a yellow vanamolybdphosphoric acid product with a strong absorbance below 400 nm (λmax = 375 nm). The reagents are stable in storage for at least 12 months, which is a major consideration for autonomous analyser platforms [13].

2.1. Reagents and Standard Preparation

All reagents and standards were prepared using ultra high purity (UHP) water (MilliQ, Millipore, Burlington, MA, USA) and analytical grade chemicals (Sigma Aldrich, St. Louis, MO, USA). The yellow reagent was prepared by dissolving 0.351 g of ammonium metavanadate (Sigma Aldrich) in ~200 mL UHP water with an addition of 95 mL concentrated hydrochloric acid (Sigma Aldrich). Following this, 7.14 g of ammonium molybdate tetrahydrate was added and the resulting solution was made up to 1 L using UHP water. The phosphate standards were prepared by dissolving 0.408 g potassium dihydrogen phosphate (Sigma Aldrich) in UHP water in a 1 L volumetric flask to make a 3 mM stock phosphate solution. This stock solution was further diluted to make up solutions of the known concentration (range 0.05–50 µM). Equal volumes (1:1 ratio) of yellow reagent and standards/samples were mixed and left for 20 min to develop at room temperature. The blank contained equal volumes of yellow reagent and UHP water with no phosphate added. All reagent and standard solutions were tested and validated against reference measurements generated from spectra obtained with a PerkinElmer L900 UV-VIS-NIR Spectrometer (PerkinElmer, Waltham, MA, USA) using a wavelength of 375 nm.

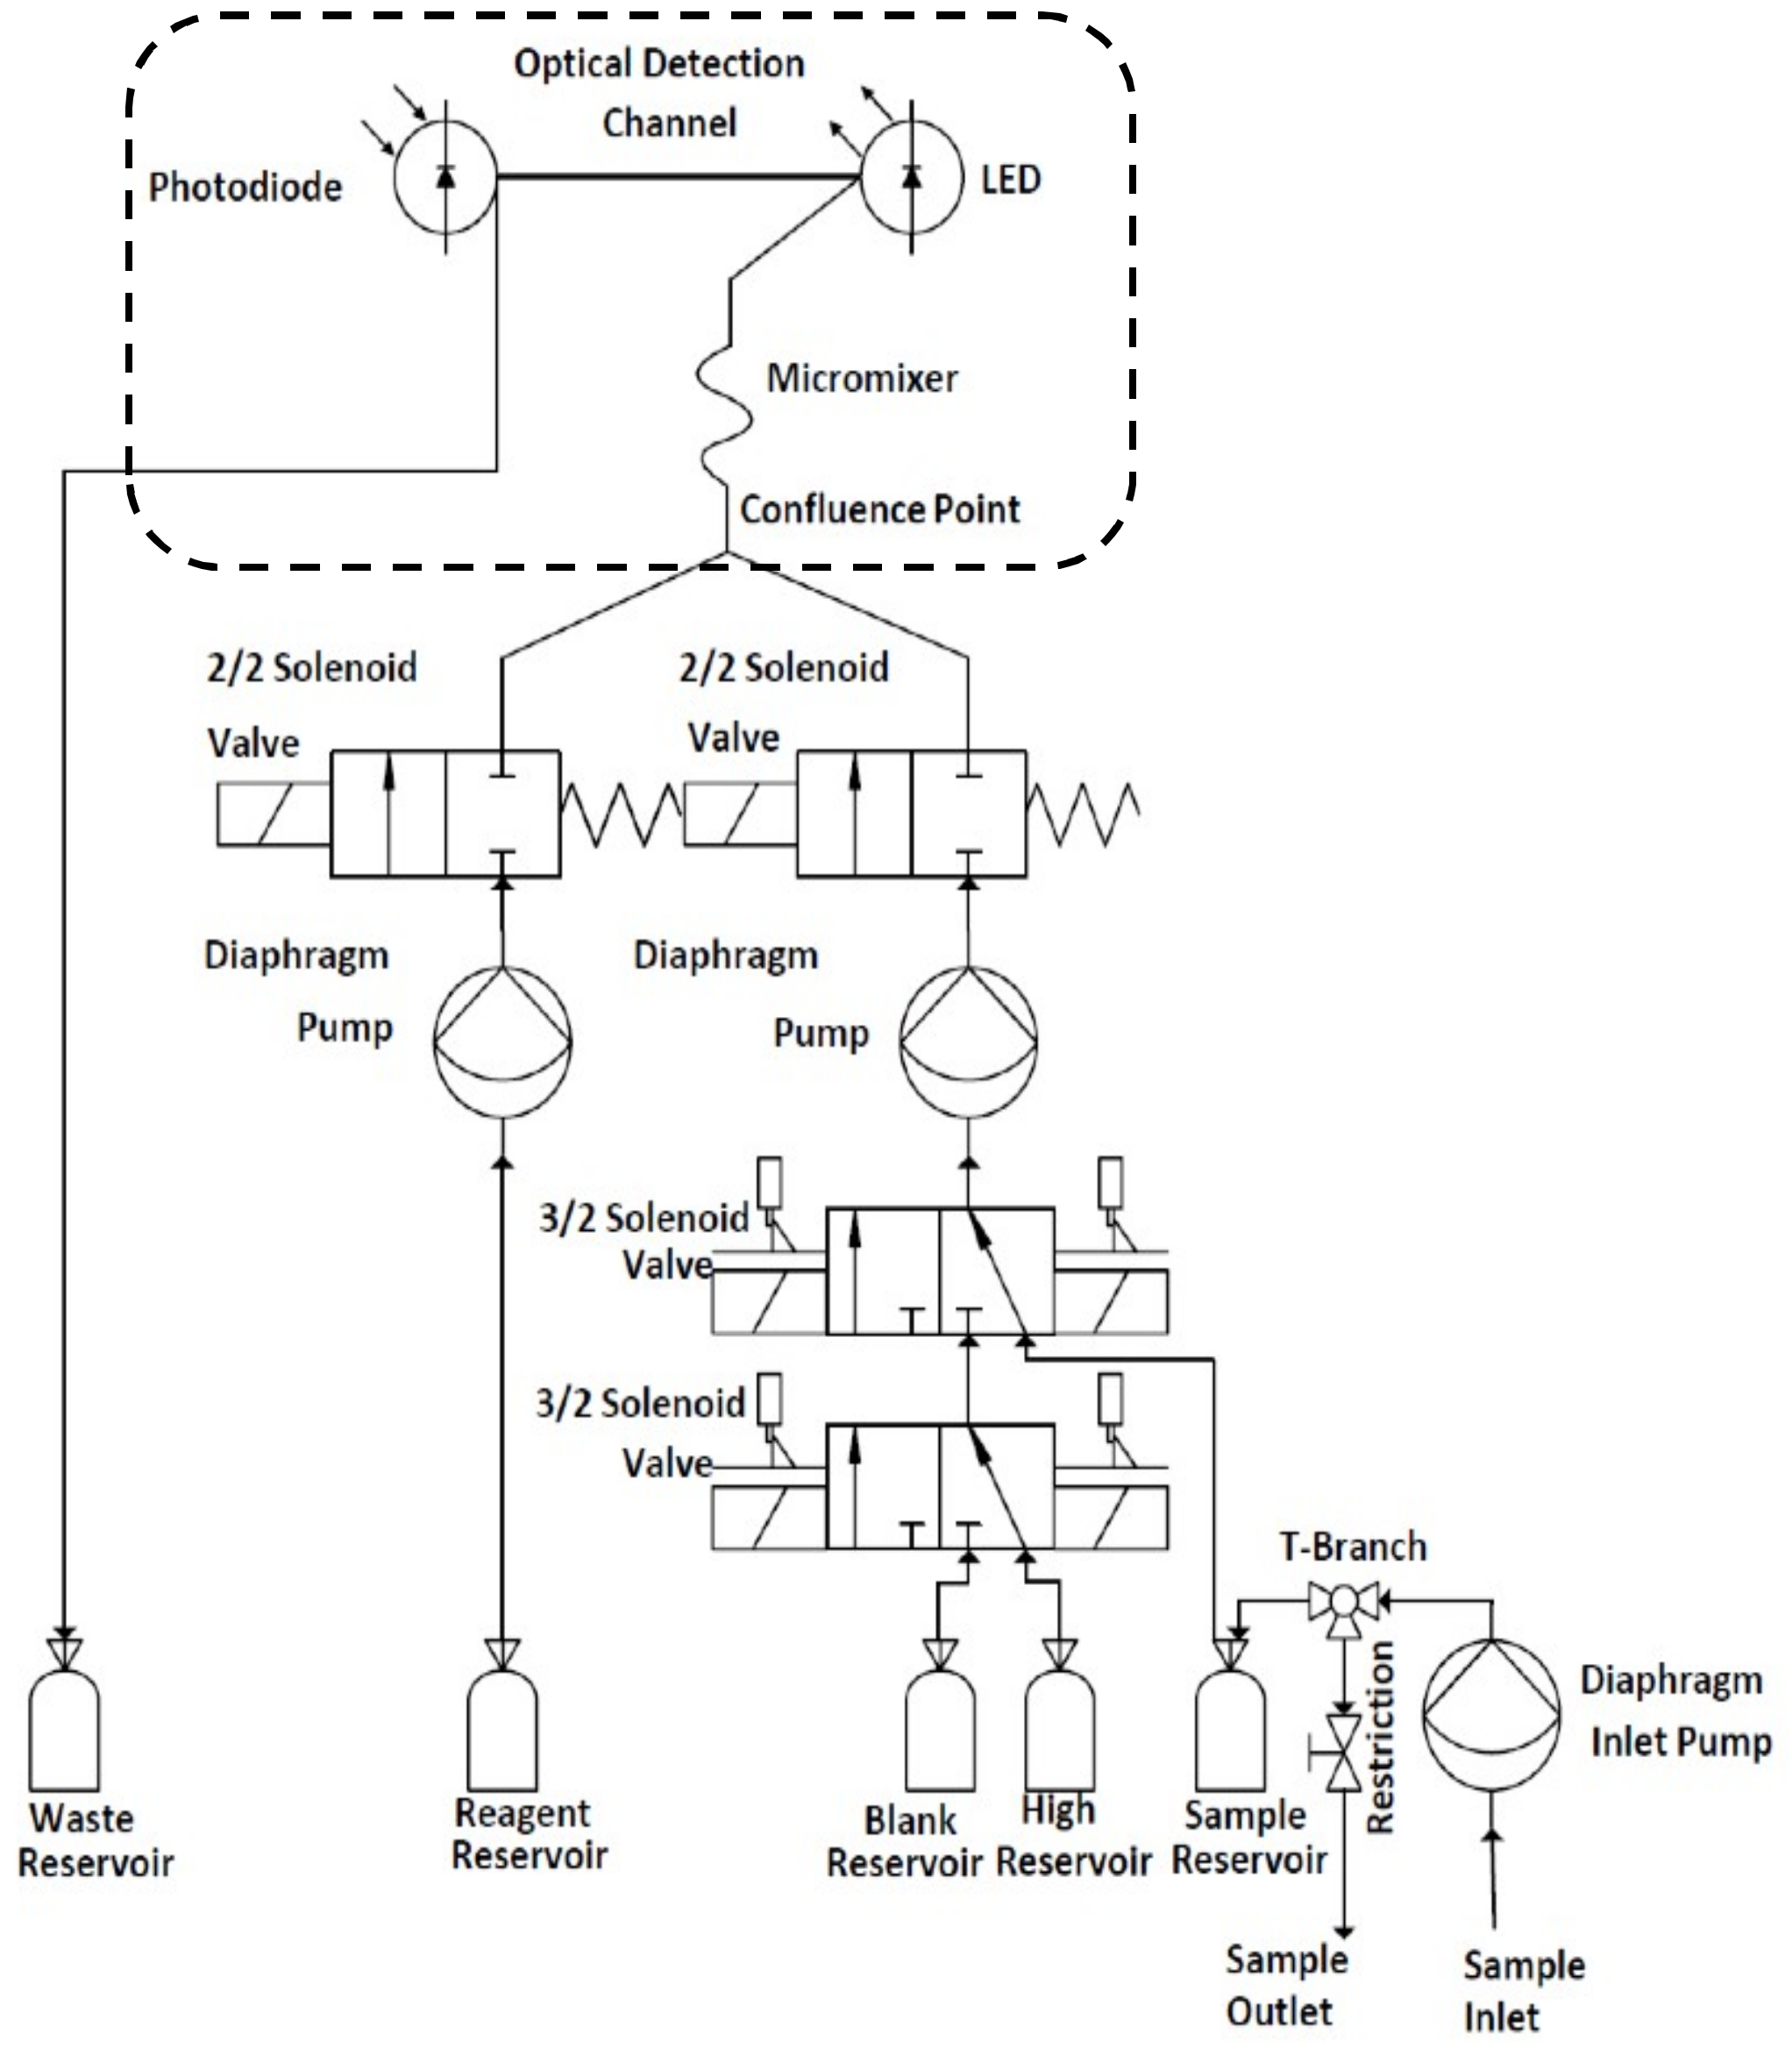
2.2. Fluidic Handling

Fluidic control (see Figure 2) was managed through two 2/2 (hit and hold) and two 3/2 (latching) solenoid valves while pumping was achieved through the use of two diaphragm pumps (Figure 1D). The pumps were tested and optimised to deliver a precise and stable 1:1 ratio to the fluidic chip (Figure 1C) via the sample/standards and reagent input lines (Figure 2). Between measurements, the system was cleaned with UHP water followed by flushing with the standard/sample to minimise any carry over between measurements. The inlet pump (Gardner Denver Thomas GmbH, Fürstenfeldbruck, Germany) was used to draw samples from the external environment through a 0.45 µM, 47 mm Durapore poly(vinylidene difluoride) PVDF filter membrane (Millipore, Burlington, MA, USA) held within a filter holder (Millipore, Burlington, MA, USA) placed on the inlet. During sampling, approximately 300 mL of sample was introduced into a sample reservoir (Figure 1B), from which it was passively drained (Figure 1A). All components were mounted on a laser cut poly(methyl methacrylate) (PMMA) fluidic board (Figure 1D) using bespoke 3D printed holders.

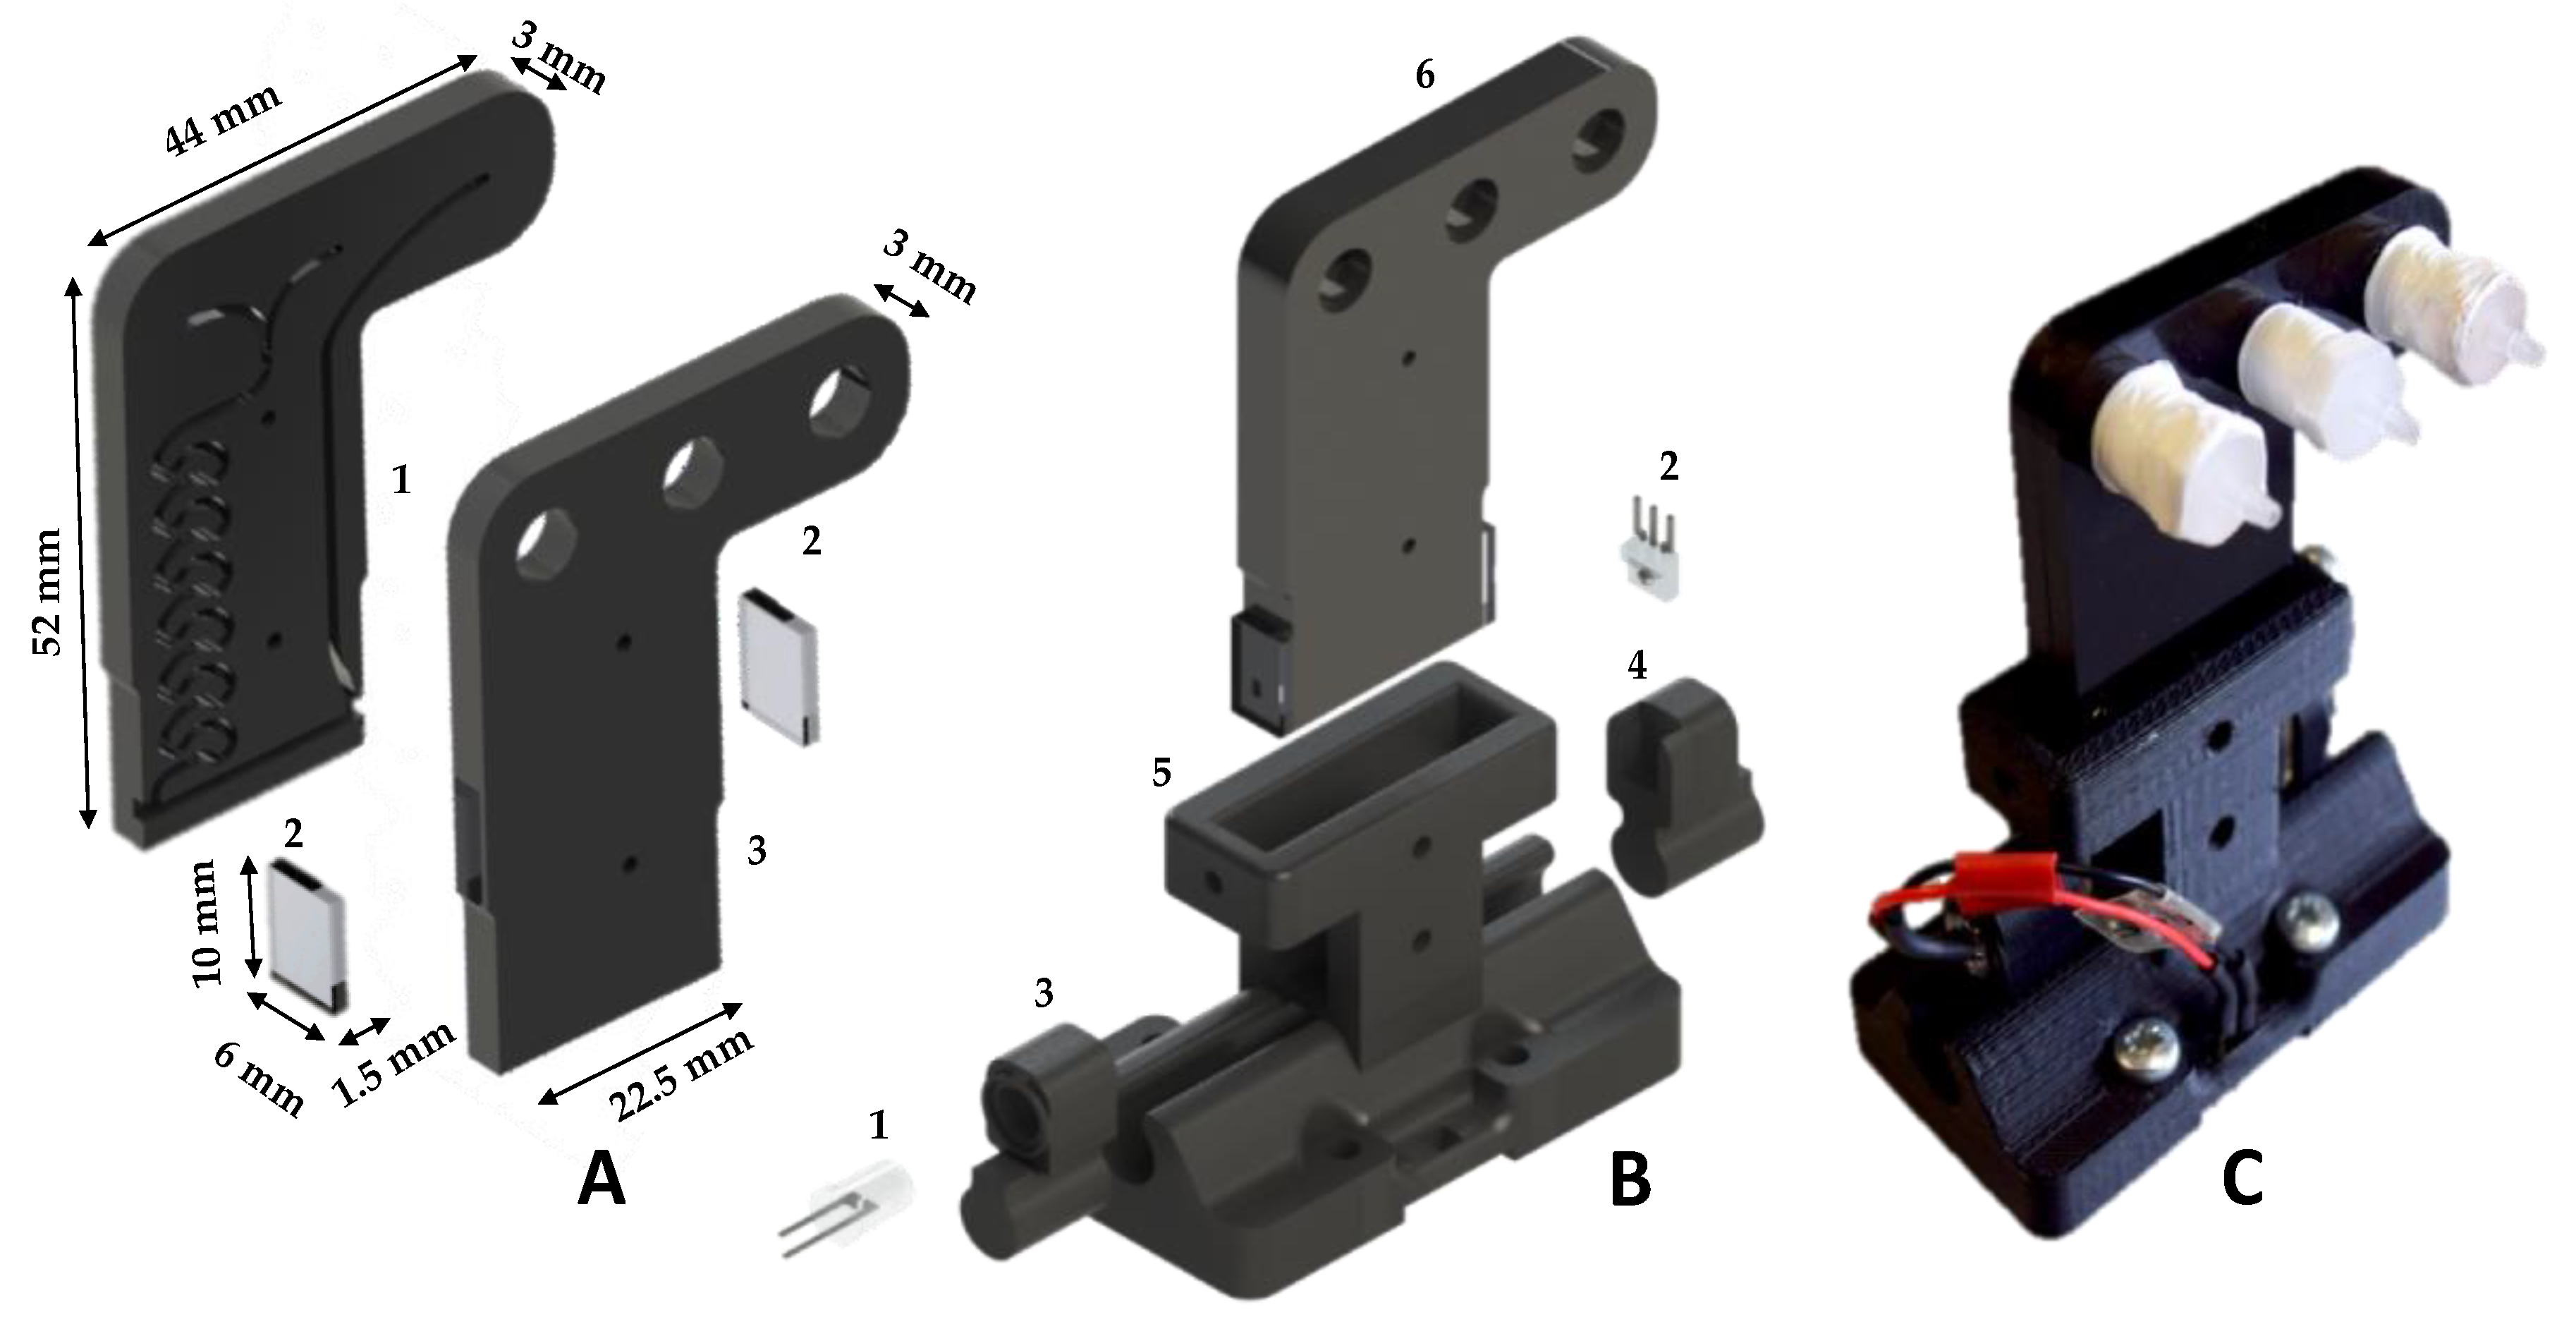
2.3. Fluidic Chip and Optical Detection

The sensing platform incorporated a detection chamber (Figure 1C) housing the two-layer microfluidic chip (Figure 3) fabricated from opaque PMMA. All channels were micro-machined on the bottom layer using a Datron CAT3D-M6 (Micro Machining Centre). The mixing channel and outlet channel (Figure 3A) were 1000 µm wide × 500 µm deep, and the detection channel was 20 mm in length, 1000 µm wide × 1000 µm deep. The top layer sealed the channels and was milled to provide two inlets (sample and reagent) and one outlet (waste). The two opaque PMMA layers were thermally bonded and the optical windows of the flow cell formed using laser cut 2 mm thick clear PMMA, which were thermally bonded at both ends of the detection channel. The completed chip has a size 52 mm × 22.5 mm × 6 mm (H:W:D) and an internal volume of 212 µL. A 375 nm LED (XSL-375-TF-R2 UV LED, Roithner, Wien, Austria) and photodiode (TSL257-LF, AMS) were used for absorbance detection. Alignment of the LED, chip and photodiode was achieved through a 3D printed (Stratasys Objet260 Connex1) custom designed alignment rail (Figure 3B). A significant design improvement is the incorporation of a rail in the microfluidic chip mount, through which the LED photodiode can be easily removed and replaced while maintaining alignment. This improves the detector’s kinematic stability, reduces unit costs and simplifies servicing of the detection unit.

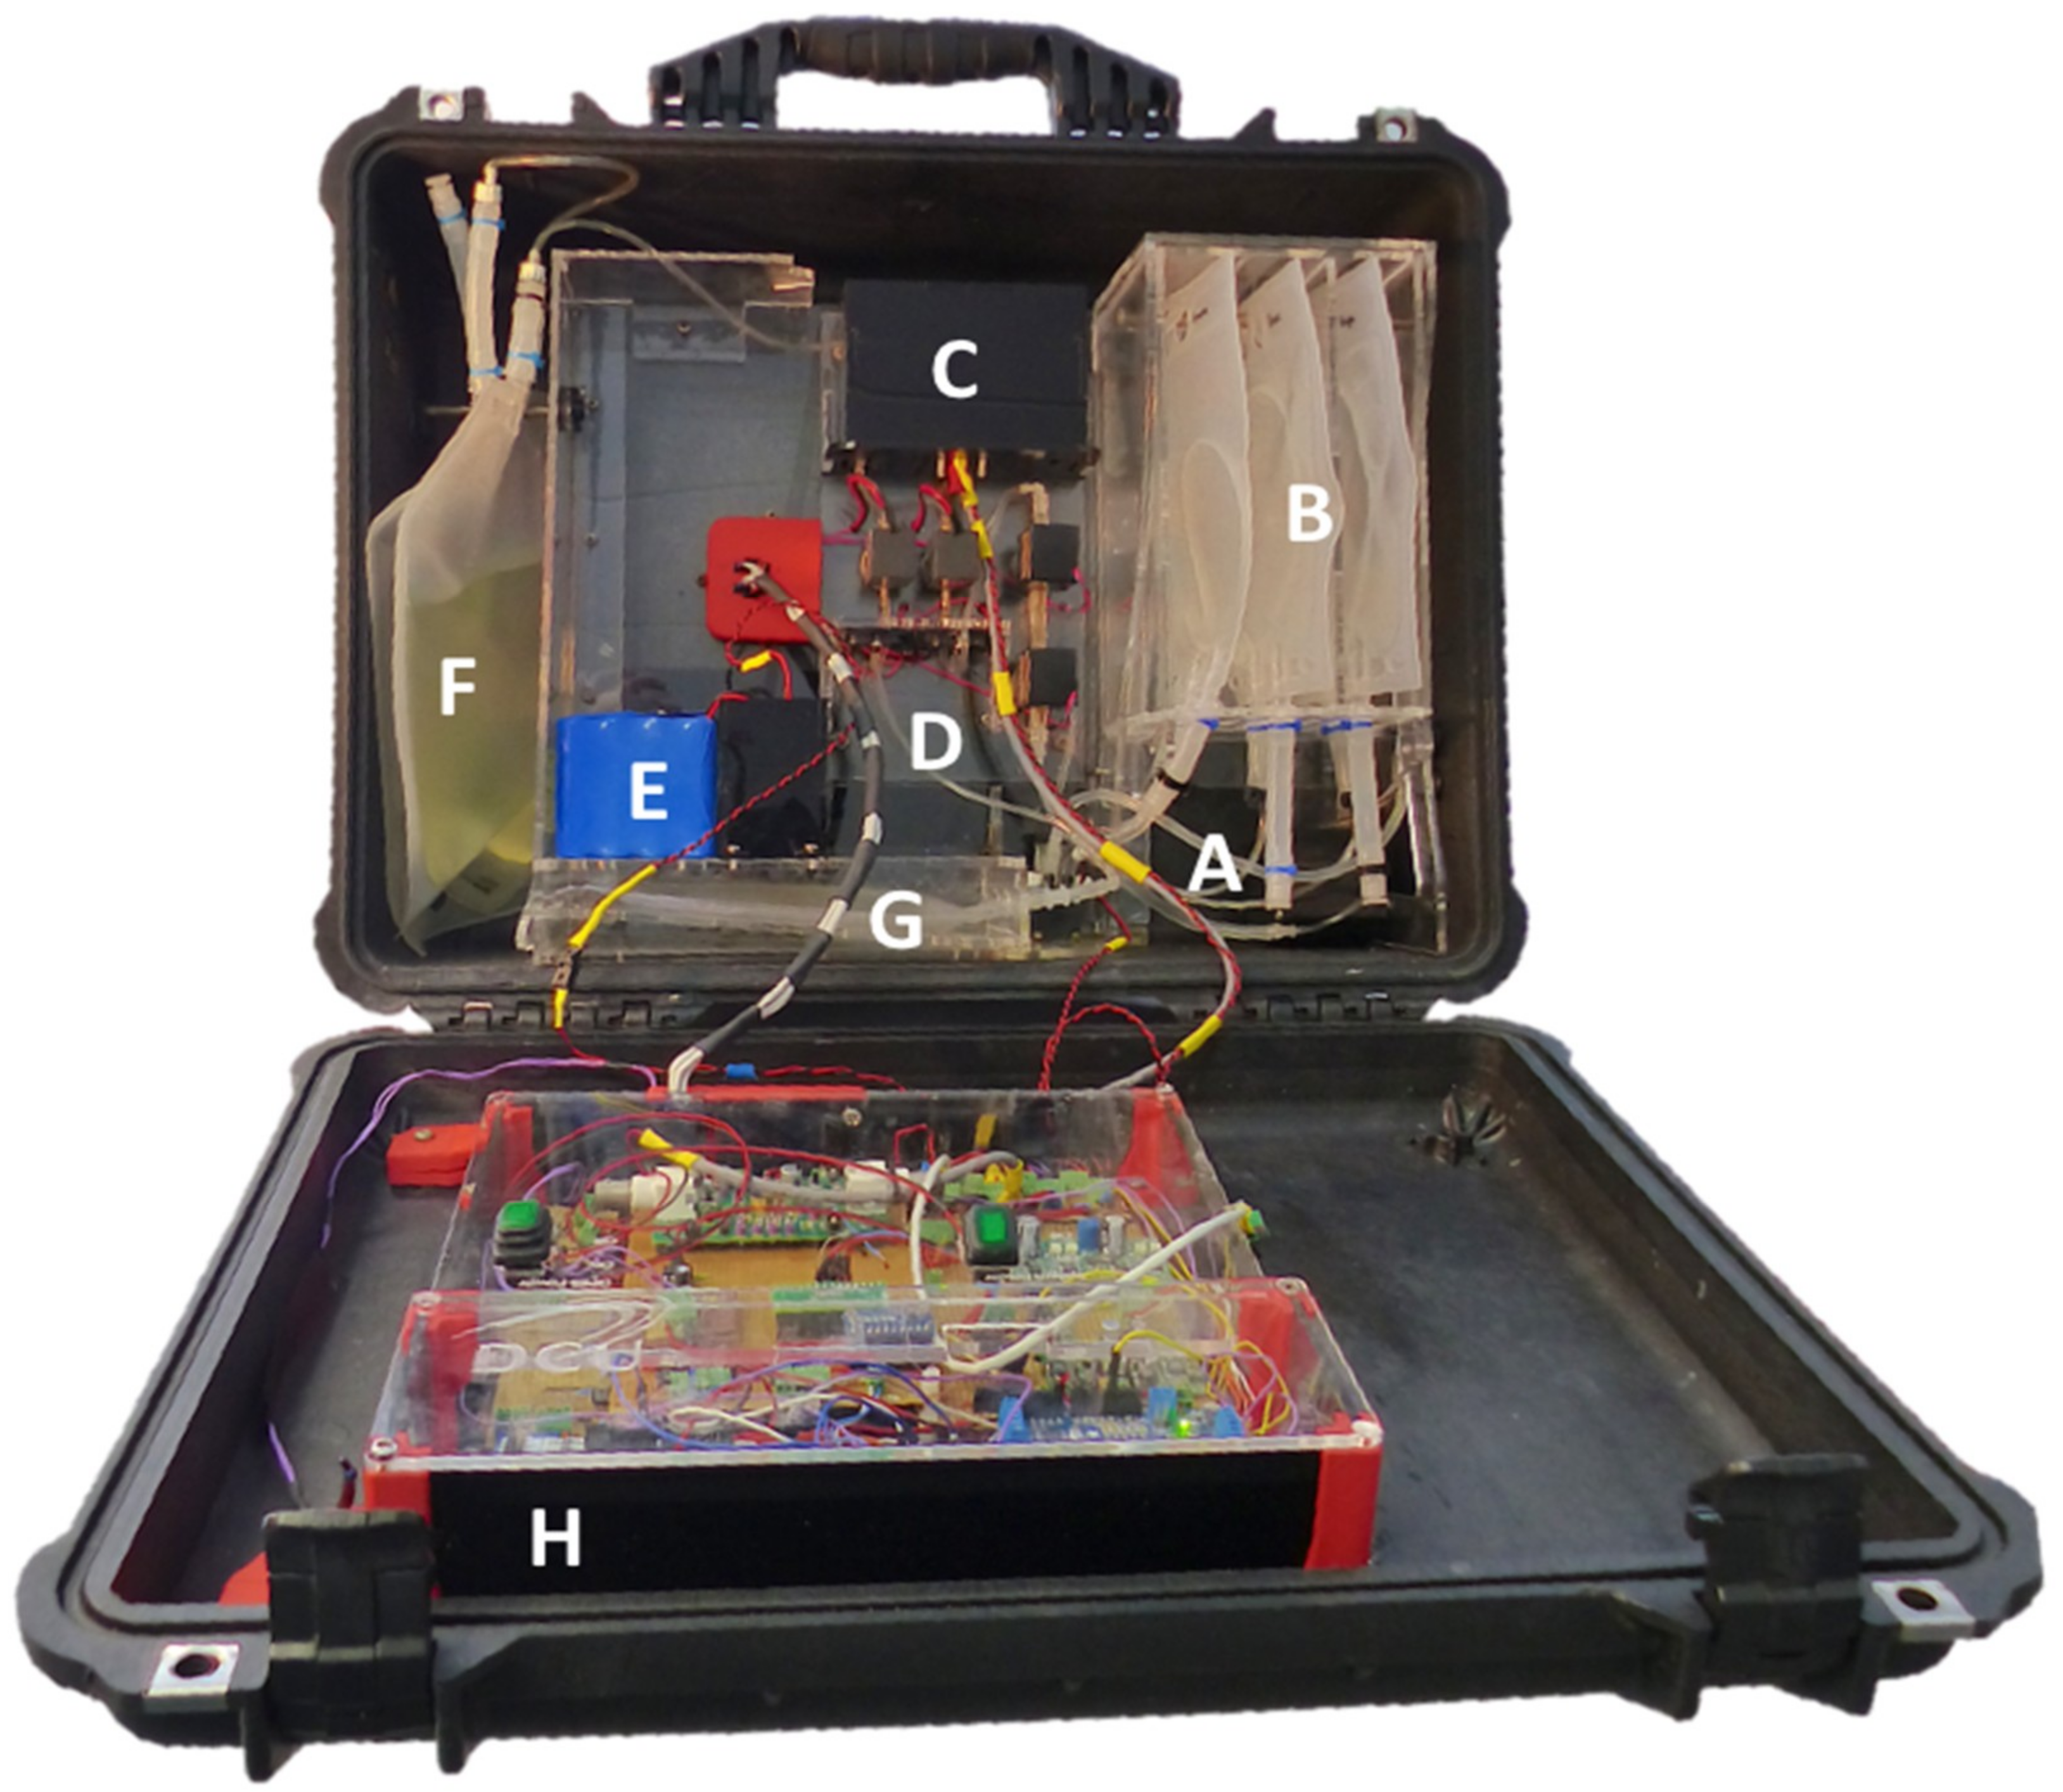
2.4. Chassis, Housing and Tubing

The sensor platform chassis was fabricated from 4 mm thick clear PMMA panels which were laser cut (Epilog Zing Laser) and solvent bonded together (1,2-Dichloroethane, Sigma Aldrich). The chassis was mounted onto a marine grade stainless steel back plate and housed within a ruggedized casing (Pelican Case 1560) to protect the sensor from liquid ingress and weather. A 1/16″ TygonTM tubing was used for transport of the analytical fluids to and from the microfluidic chip. Finally, 1/8″ polyethylene tubing was used to convey samples from the external environment into the sensor platform.

2.5. Electrical Control and Transmittance

System control (Figure 1H) was achieved via an Arduino Mega 2560 microcontroller board. The 2/2 solenoid valves and inlet pump were activated through a MOSFET triggering circuit and power regulators, and the 3/2 solenoid valves were controlled through an Arduino Motor Shield. Raw data were transmitted to an online interface via a general packet radio service (GPRS) module (SIM900 GPRS/GSM Shield, Maplin, Rotherham, UK), controlled through a secondary slave Arduino circuit. The data string transmitted the platform’s internal temperature, humidity, pressure via integrated sensors, and bit values for sample and standard measurements. Short range wireless communication was achieved via an integrated Bluetooth module, while an 8 GB SD card connected via a Data Logger Arduino Shield was used for local data storage and data backup.

2.6. Analytical Performance

The analytical performance of the system was evaluated via laboratory tests using two methods:
Method 1.Off-Chip Solution Mixing: Test solutions of known concentrations (0.05–45 µM PO43−) were pre-mixed off-chip with yellow reagent (1:1 v/v ratio). The premixed solution was directly infused into the fluidic chip, using a microprocessor-controlled syringe pump (KD Scientific Model 210), at a constant flow rate of 1 mL/min. The flow was then stopped for 20 min to ensure the reaction reached a steady-state condition in the detection channel [14]. For each test solution measurement, an associated blank measurement was obtained (no phosphate present), and the resulting data pairs converted to absorbance using the Beer-Lambert equation [15]:
A = log(Io/I)
where A is absorbance, Io the blank intensity, and I is the standard intensity. For method validation, the absorbance of the same test solutions were measured using a PerkinElmer L900 UV-VIS-NIR Spectrometer at a wavelength of 375 nm, and the results compared with the absorbance obtained using the fluidic chip (Figure 4).
Method 2.Chip-based Solution Mixing: Test solutions of known concentrations (0 µM, 25 µM, and 50 µM PO43−) were held in 25 L tanks and automatically introduced into the platform through the inlet pump. Test solutions and yellow reagent mixing (1:1 v/v ratio) and detection occurred on the fluidic chip. The same stopped-flow approach used in Method 1, described above, was applied to allow formation of the yellow phosphate-reagent reaction product (1200 s) and the absorption was calculated as for Method 1.

2.7. Long-Term Laboratory Assessment of the Sensing Platform in Fully Autonomous Mode

The sensor was allowed to run autonomously within the laboratory with service intervals every 112 readings to evaluate the effect of continuous operation on system components, optimise the platform operational settings, and check reagent/waste volumes (half a day per service). During the testing period (total period 55 days), the nutrient sensor sampled every 70 min, with a complete measurement cycle involving measurement of a blank solution (0 µM PO43−), followed by a high concentration calibration solution (50 µM PO43−), followed by the filtered samples drawn from tanks filled with test solutions of known phosphate concentrations (5.5 µM, 8 µM, 12.5 µM, 25 µM PO43−). To prevent any carry over between measurements, the blank/standard lines were flushed with sample or standard to be measured for 1 min prior to each measurement at a flow rate of 1.0 mL/min (fluidic chip dead volume ca. 210 µL). To ensure homogeneity within the tanks, water was continually circulated using aquarium pumps. Aliquots from each tank (test sample), along with aliquots from the internal calibration standard (50 µM PO43−) and internal low calibration standard (0 µM PO43−) were taken at regular intervals and analysed in parallel with the L900 PerkinElmer UV-VIS-NIR Spectrometer using a wavelength of 375 nm.

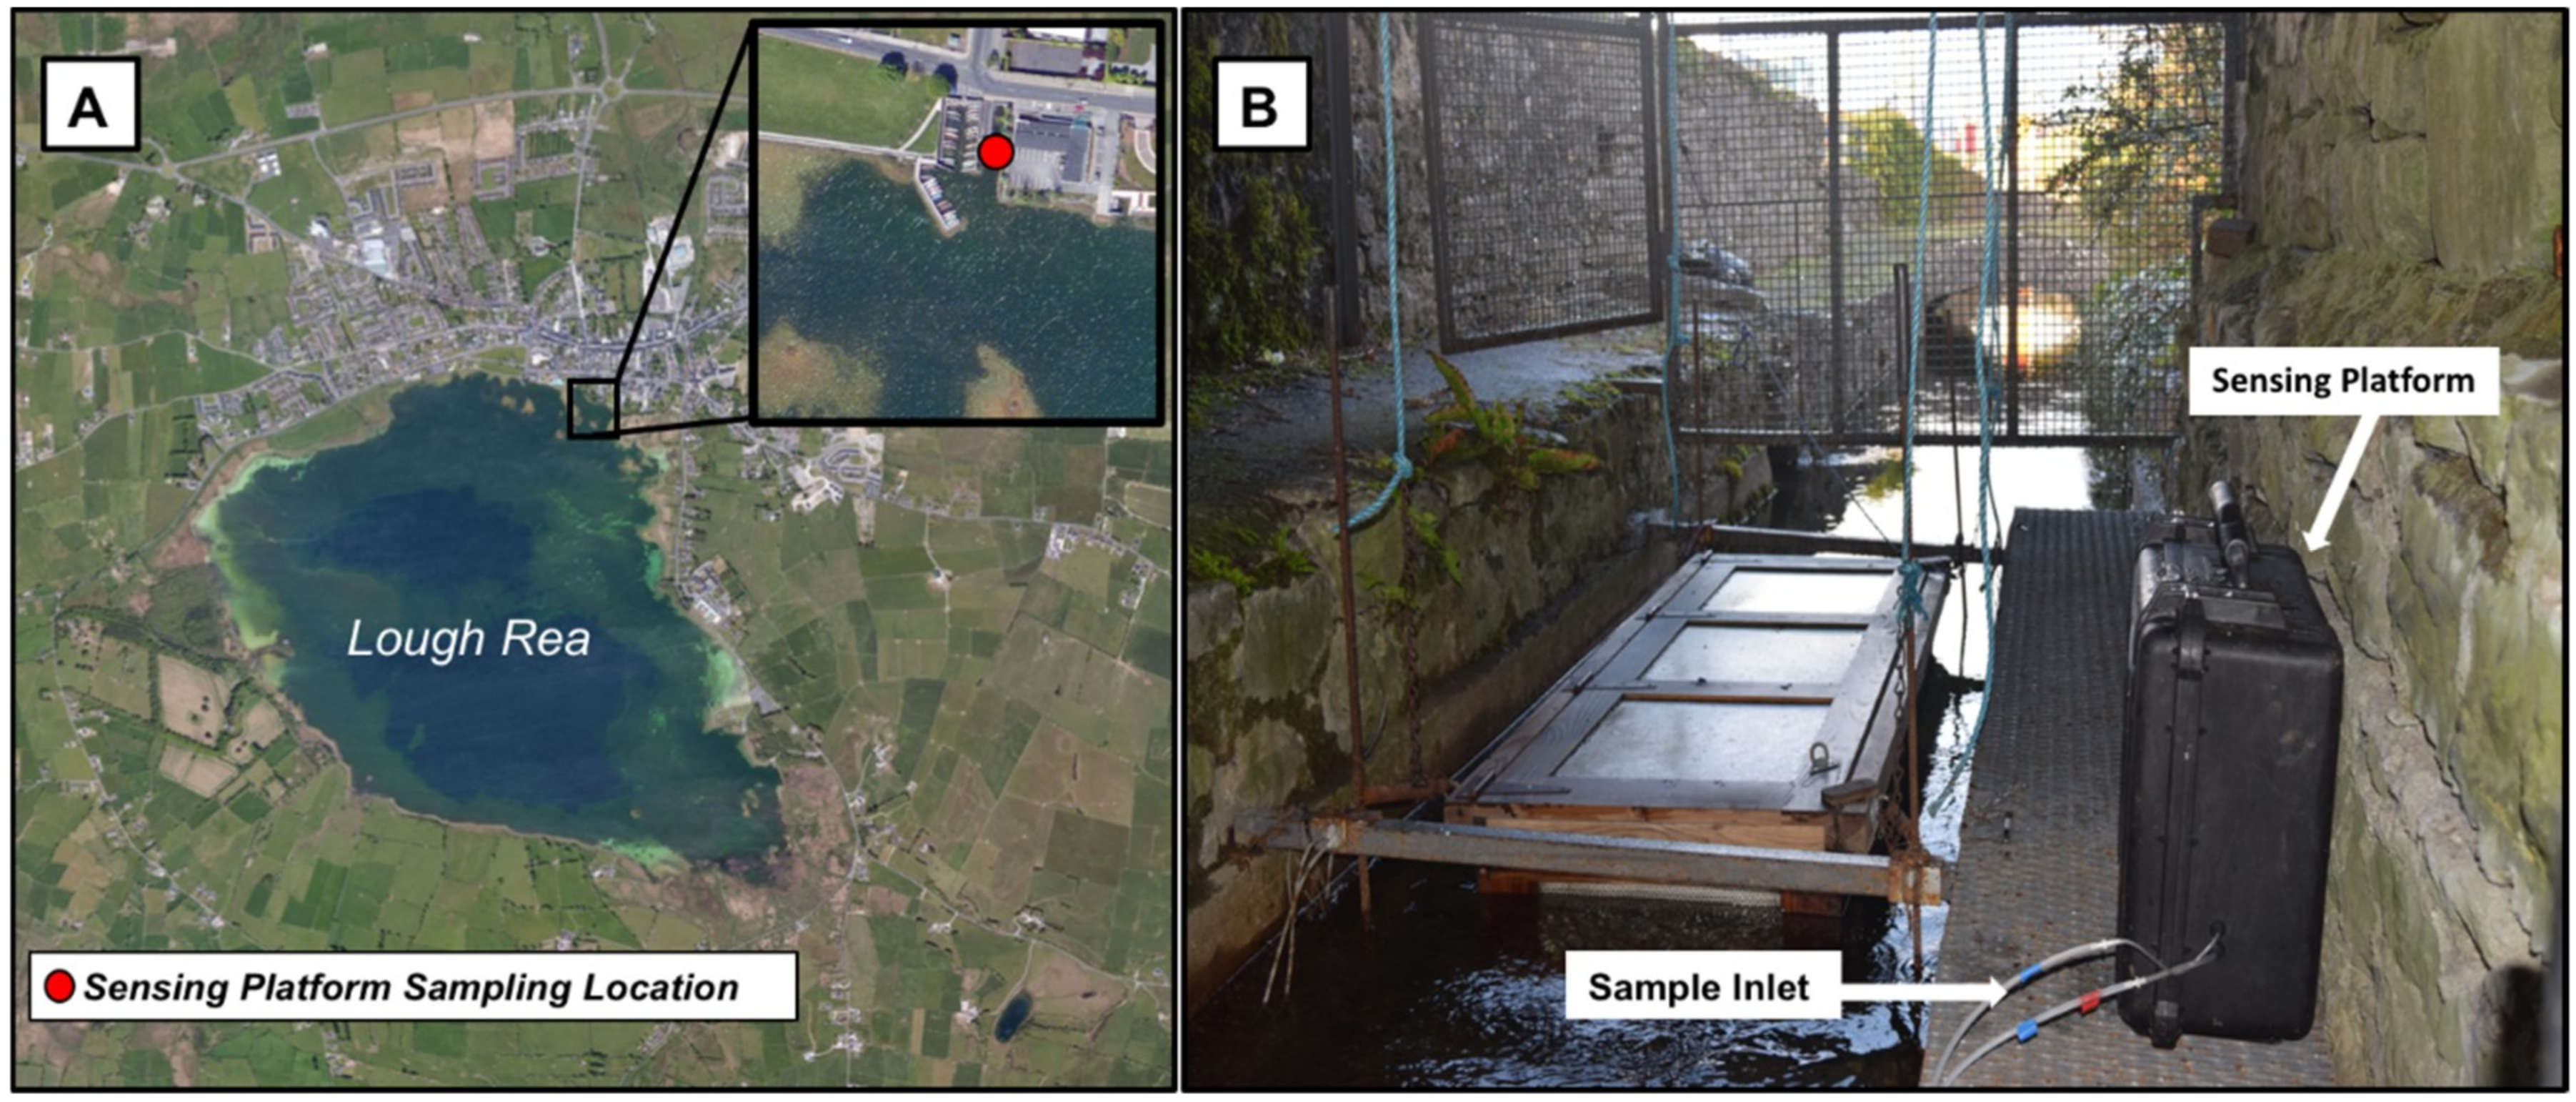
2.8. Field Deployment

The prototype platform was deployed at Lough Rea, County Galway, Ireland (Figure 4), from 5–9 December 2017. Lough Rea is a circular lake with a radius of approximately 1 km (2.5 km at its longest axis) and a surface area of approximately 3.2 km2. The underlying geology of the lake is carboniferous limestone. It is fed by springs and a stream, with the main input stream flowing into the southern end of the lake and exiting from the northern end of the lake [16]. Lough Rea Lake is designated as a Natural Heritage Area with international importance for waterfowl, and blue flag accreditation for the period 2001–2018 [17]. The prototype nutrient sensor was deployed on a raised platform 50 cm above the water surface located at Lough Rea angler’s fish hatchery, which is located at the northern end of the lake approximately 100 m from the lake boundary. The sampling inlet was positioned 1 m below the surface of the water. During deployment, samples were automatically taken and analysed by the platform every 95 min. Contemporaneous rainfall data were obtained from the nearby Athenry Met Eireann weather monitoring station [18].

3. Results and Discussion

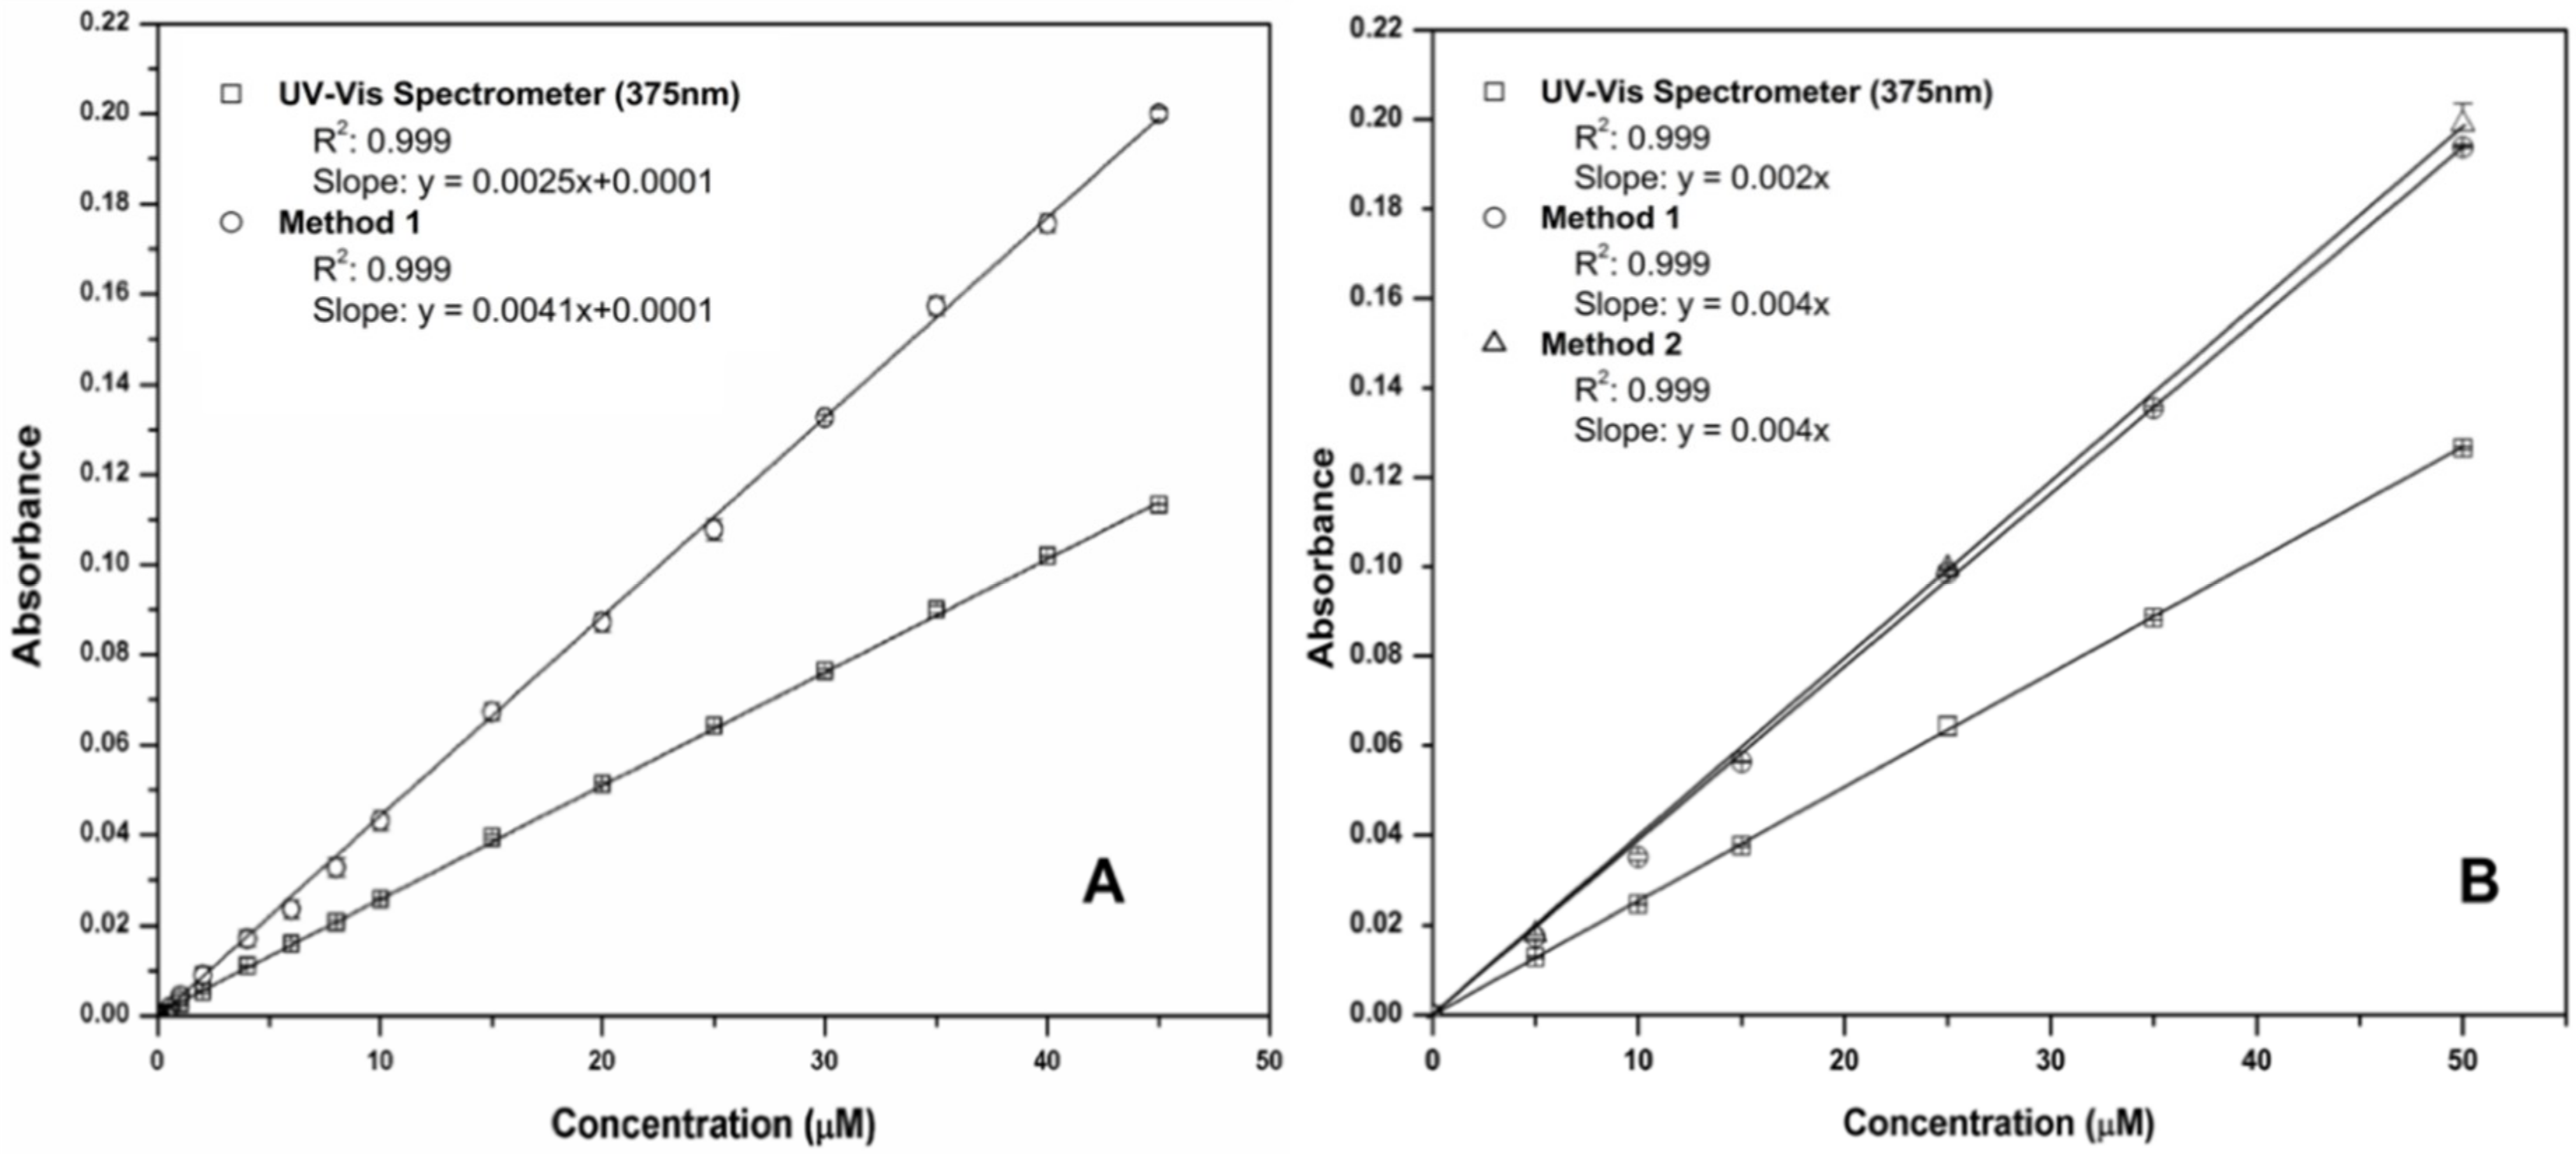
3.1. Validation of Sampling and Optical Detection (Methods 1 and 2)

Figure 5 presents the linear calibrations generated from the validation of the colorimetric chemistries and their integration into the fluidic chip. Figure 5A shows results obtained using off-chip pre-mixed solutions (Method 1). These demonstrate that both the benchtop microfluidic detection and the UV-Vis spectrometer measurements have excellent linearity, with the microfluidic chip exhibiting enhanced sensitivity compared to the UV-Vis, due to the longer 2.0 cm fluidic chip detector path length compared to the standard 1 cm cuvette used with the spectrometer. Figure 5B presents calibration plots obtained using the prototype platform with on-chip autonomous mixing of the sample solutions and reagents (Method 2). Method 1 (off-chip sample/reagent mixing) was repeated using the same samples as Method 2 for comparison. A high correlation and excellent linear range is evident with automated sampling and reagent mixing on-chip (0.09 to 50 µM PO43−, R2 = 0.999, n = 10 at each concentration) in all cases. In Figure 5, the tightness of the error bars (n = 10 replicates) for all graphs indicates the excellent precision of the methods (see also summary analytical data presented in Table 1). The limit of detection (LOD) of the sensing platform was estimated using three times the standard deviation (n = 10) of the lowest concentration test solution, corrected with the blank measurement, and was found to be 0.09 µM.
The analytical performance of each approach is summarised in Table 1. The results confirm excellent correlations for all linear calibrations (R2 = 0.999) in all cases (see Figure 5). The reproducibly and accuracy of measurements obtained using both off-chip solution mixing (Method 1) and chip-based solution mixing (Method 2) is impressive, with mean relative standard deviation (RSD) of 0.93% and 1.23%, respectively, and an average relative error (RE) of 4.53% and 0.23%, respectively.

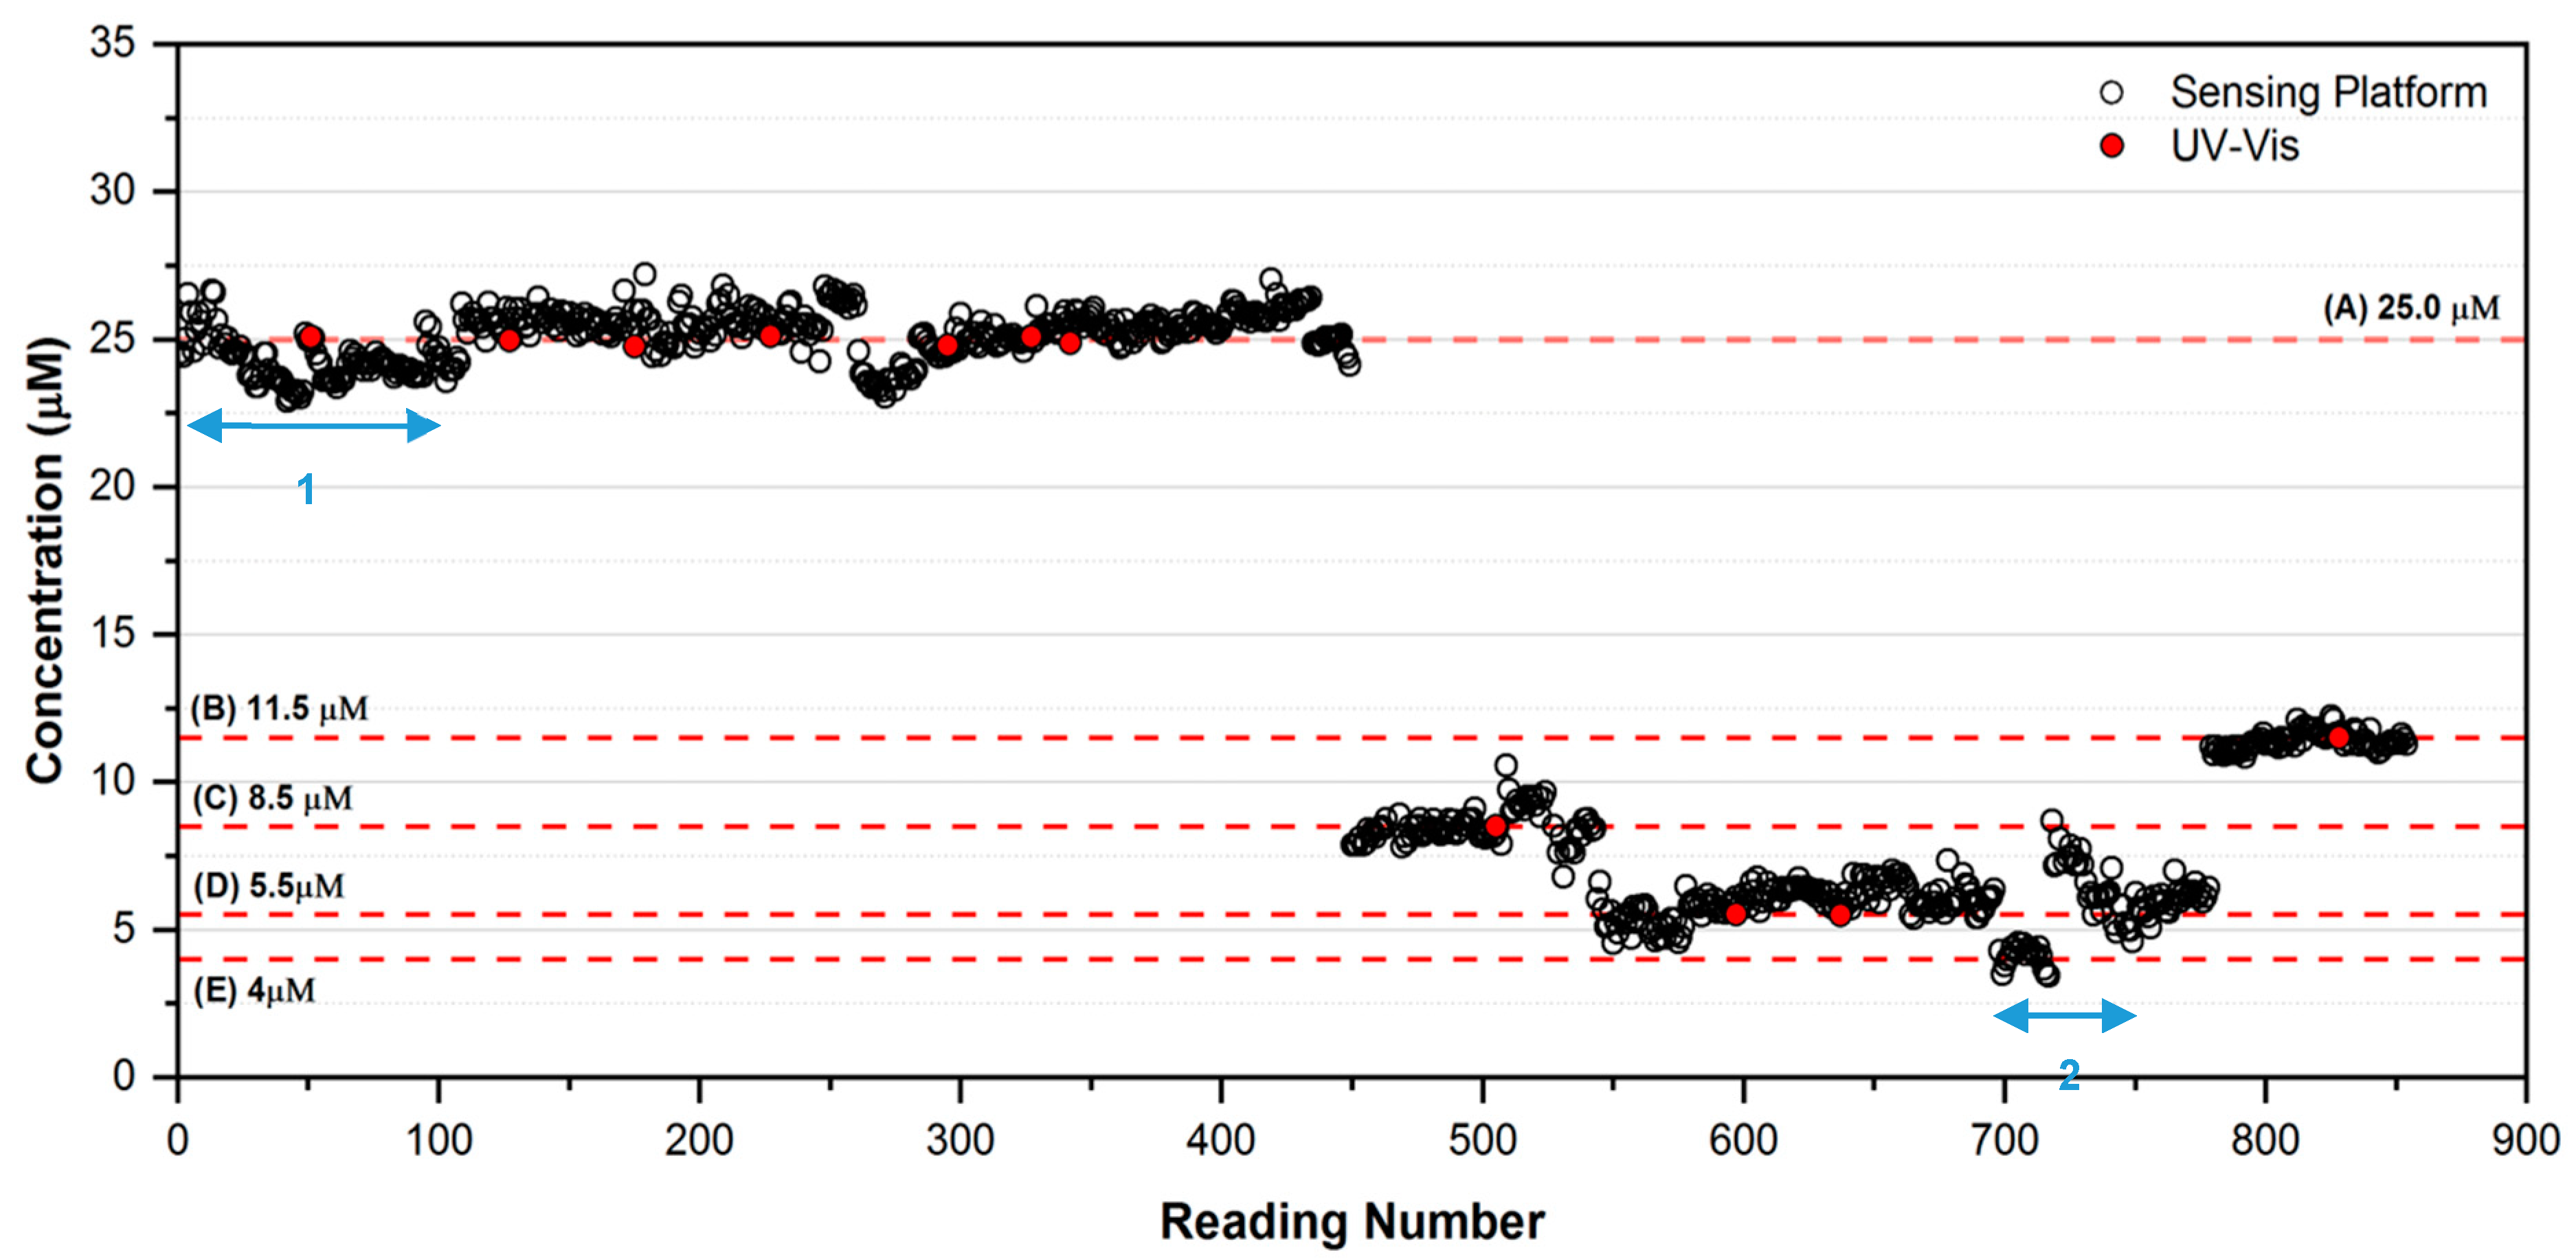
3.2. Long-Term Laboratory Assessment of the Sensing Platform in Fully Autonomous Mode

The purpose of this study was to stress-test and optimise the platform in fully autonomous operational mode prior to initiating field deployments. The measurement cycle (ca. 90 min) consisted of (i) a blank solution measurement (0 µM PO43−), (ii) a high standard measurement (50 µM PO43−), and (iii) a sample measurement. During the study, the platform automatically generated 854 measurements of each test solution, blank and high standard, totalling 2562 measurements, along with a further 40 spiked solution measurements of varying concentration ranges (with associated blank and standard high calibrations, i.e., 120 measurements) at regular intervals to test the system response (not shown for clarity), totalling 2682 measurements in all. The concentration of PO43− in the 25 L sampling tanks was varied in the sequence between 25.0 µM, 8.5 µM, 5.5 µM and 11.5 µM PO43− to validate the response of the platform. Figure 6 shows the platform response obtained over the entire test period. The red dots, representing the PO43− concentrations determined using the UV-Vis Spectrophotometer reference method, are clearly in excellent agreement with the concentrations determined by the sensing platform (see also Table 2). Overall, the response of the platform was encouraging, with the response remaining reasonably consistent with the reference measurements throughout. However, several issues were identified that had to be addressed through fault finding, software debugging and component changes during the study (see below).
Weekly routine maintenance and system checking (downtime typically ca. 0.5 days) were carried out every 112 readings and involved checking for leaks, refilling reagent bags, and removal of waste. On occasion, a more substantial service was required to improve the system software and hardware, and address performance issues. For example, a rapid decrease in the signal from the photodetector observed during the initial phase of the experiment (ca. 0–100 readings; see Figure 6, Section 1) was rectified by replacement of the photodiode and photo detector and modifying the system software. Interestingly, the effect of this decrease in signal arising from the photo-detector components was almost entirely cancelled out by the use of ratiometric measurements of the calibration (blank and high) and sample solutions. However, as the cycle for the three measurements was 70 min, the detector artefact was not entirely removed, and manifested as a slight negative error over this period (mean phosphate concentration = 24.31 µM, mean %RE = −2.77, %RSD = 3.24, n = 100, range 1–100). After the repair, the equivalent results were recorded (mean phosphate concentration = 25.33 µM, mean %RE = +1.32, %RSD = 1.29, n = 100, range 301–400). Instability in the data from ca. 700–750 readings (Figure 6, Section 2) was traced to a connection that had become faulty on the electronics board (mean phosphate concentration = 6.83 µM, mean %RE = 5.32, %RSD = 12.66, n = 25, range 718–742). The system performance was again restored following repair of the faulty connection (mean phosphate concentration = 11.19 µM, mean %RE = −1.23, %RSD = 1.80, n = 25, range 780–804).

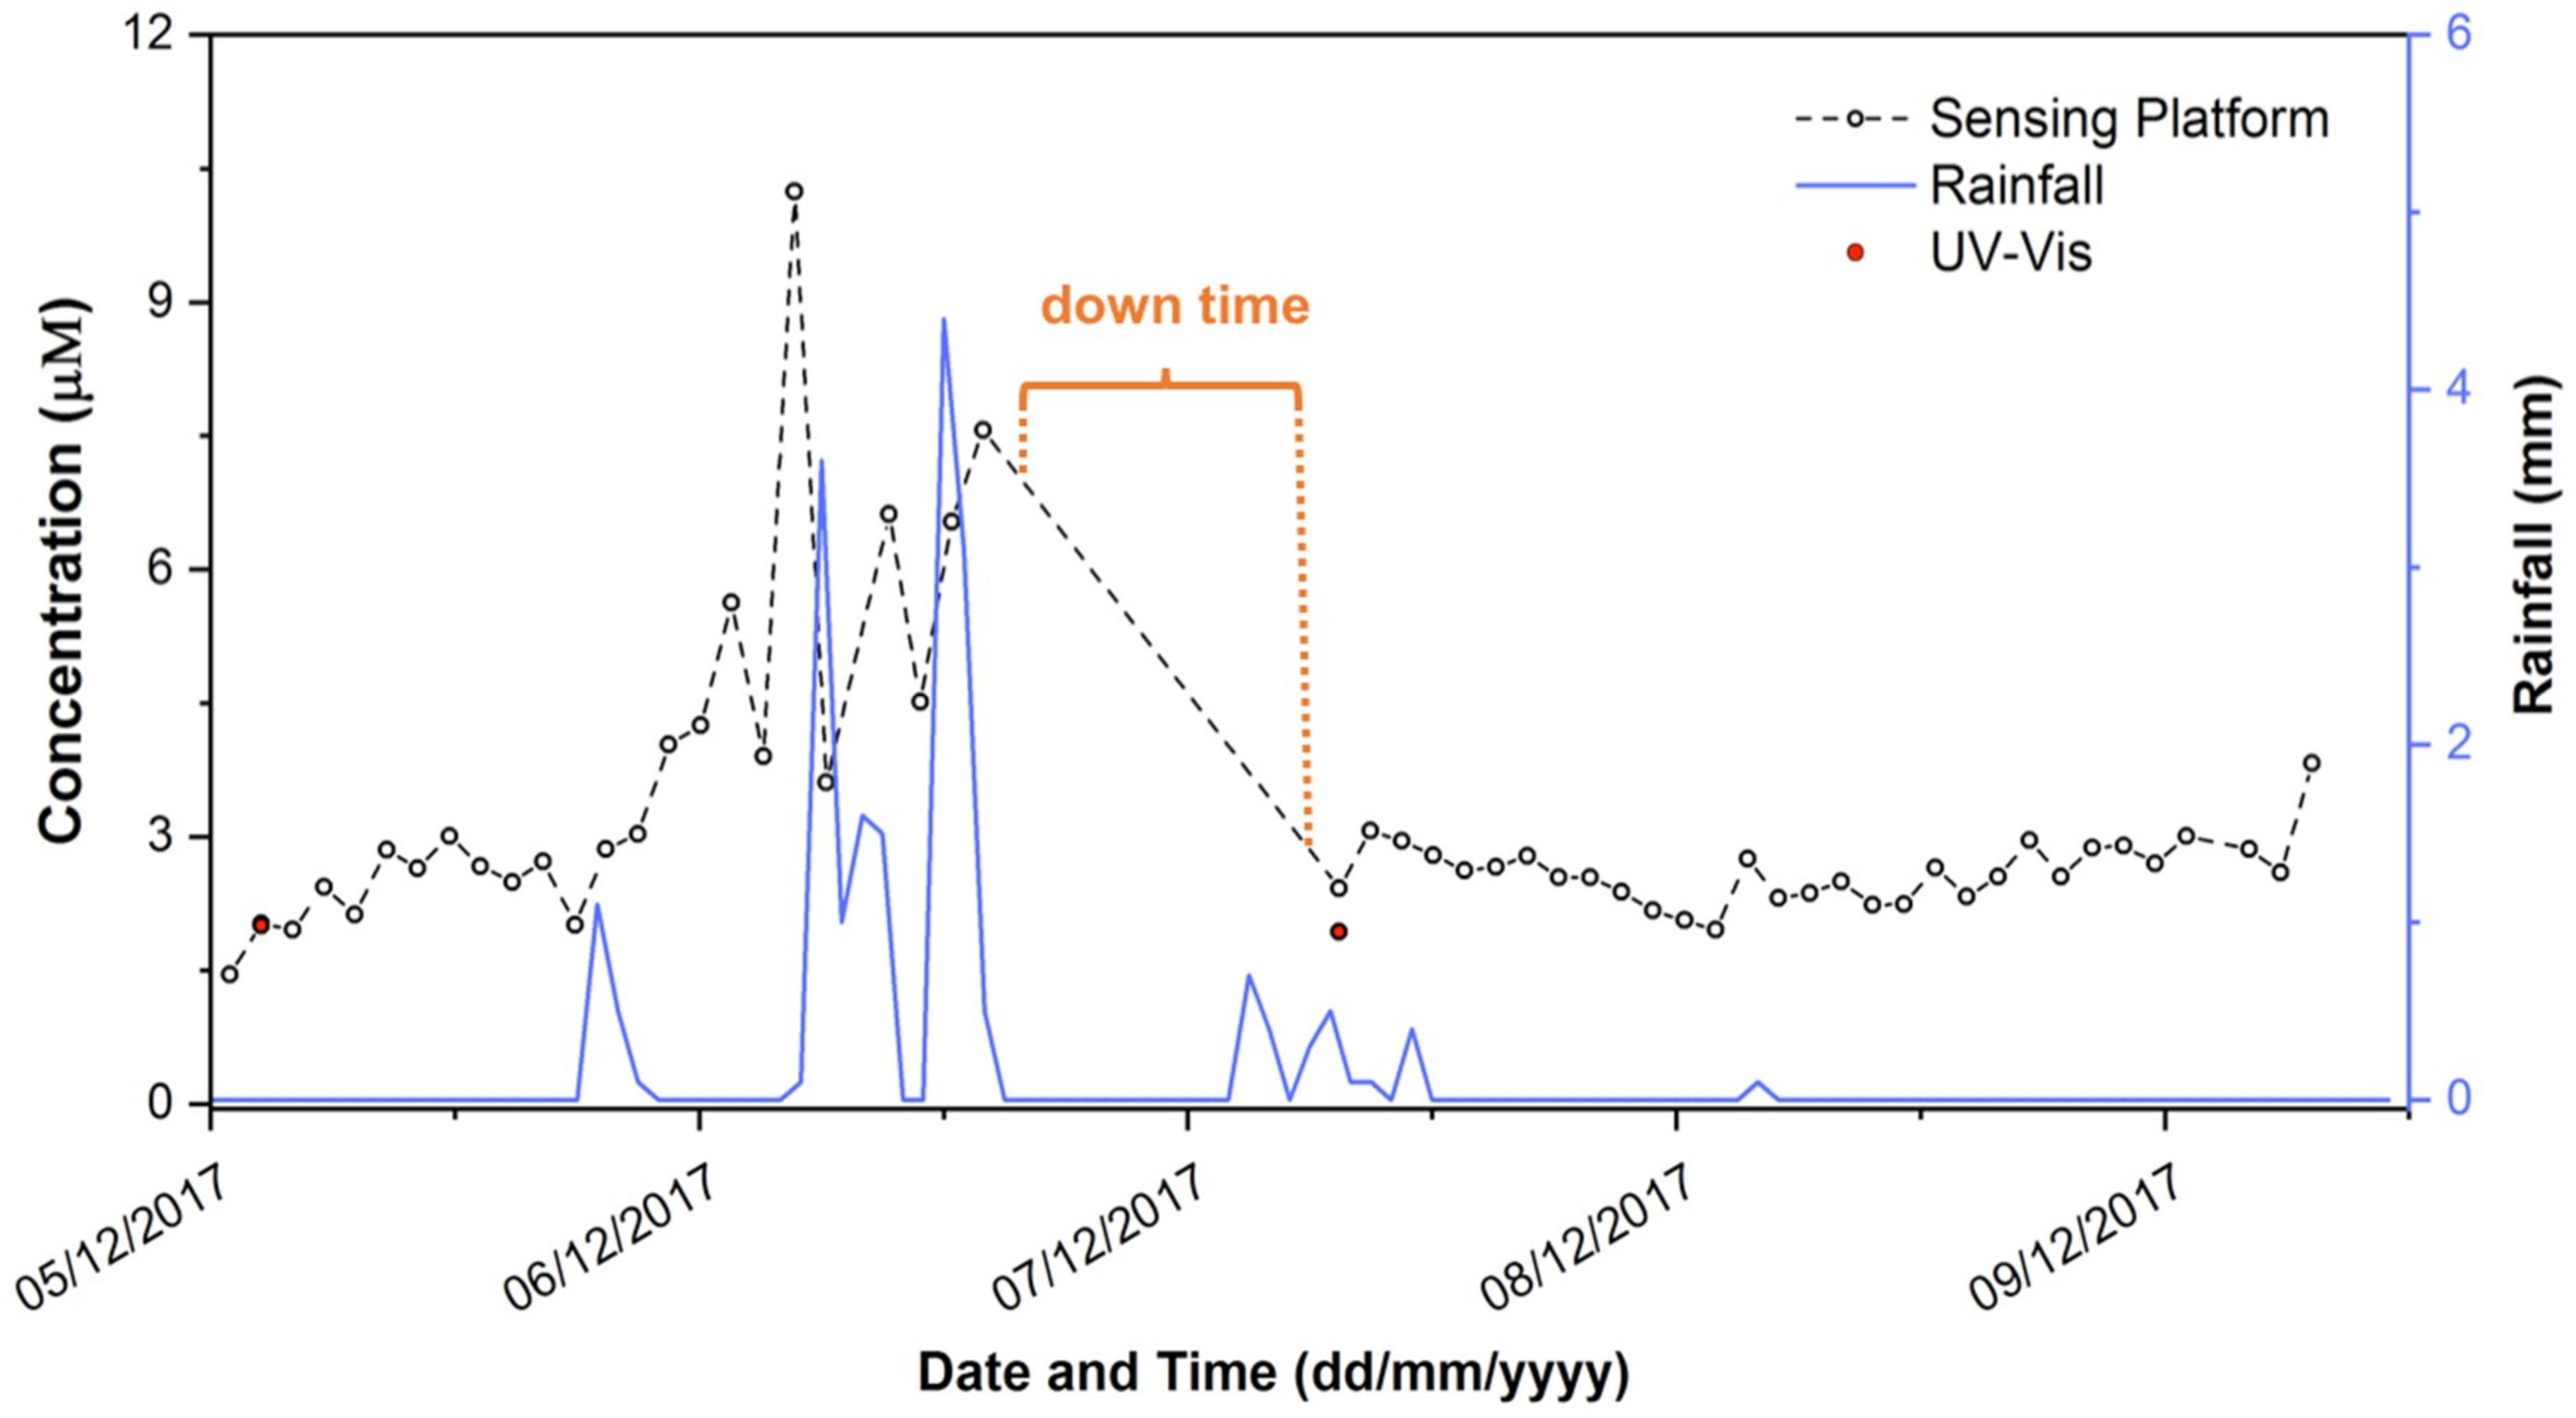
3.3. Preliminary Field Assessment of the Sensing Platform

Following extensive lab trials, the system field performance was assessed through a deployment during which it operated in completely autonomous mode at a location around 150 miles from the laboratory. Figure 7 shows the phosphate concentration data generated during the deployment at Loughrea Lake, Co., Galway, Ireland. During the five day deployment, a total of 165 in situ measurements (i.e., 55 sample, 55 blank (0 µM) and 55 high standard (50 µM)) were obtained. Data were transmitted wirelessly to an online interface via a GPRS module, and also stored on an 8 GB SD card connected via a Data Logger Arduino Shield as backup. The sample was filtered through a 0.45 µM filter membrane at the inlet which remained un-changed throughout the deployment. During the deployment, the phosphate concentrations measured by the platform ranged from 1.45 to 10.24 µM, with an average concentration during this time of 3.13 µM. Of particular interest is the observation that the highest phosphate concentrations between 6–7 December 2017 coincided with rainfall events (Figure 7).
During the deployment, a down time of 16 h occurred due to failure of a power regulator in the sensor (highlighted in Figure 7). This was replaced on-site, and the sensor platform thereafter continued to operate for the duration of the deployment. Grab samples (n = 5) were taken at the sampling point on two occasions during the deployment (day 1 and day 4), and the concentration of phosphate in these was determined using the UV-Vis spectrometer reference method. The first sample taken at the initial deployment of the nutrient platform gave a result of 2.00 ± 0.05 µM PO43− via the spectrometer reference method, compared to the in situ prototype sensor reading of 2.03 µM PO43−. The second grab sample, taken on Day 3 after the servicing visit, returned a concentration of 1.93 ± 0.03 µM PO43− via the spectrometer reference method, compared to 2.42 µM PO43− obtained from the prototype sensor platform.

4. Discussion

Even though the duration of this deployment was relatively short, the increasing trend in PO43− concentration on the 6 December from ca. 3.0 to ca. 7.5 µM was an interesting outcome, as it coincided with a major rainfall event. Unfortunately, the component failure mentioned previously occurred just after this feature, and following repair, measurements returned to the more usual value of ca. 3.0 µM. While the second grab sample suggests that the system was still functioning properly, more extensive field measurements are required to determine whether the apparent rise in PO43− concentration is a real event, and if so, whether there is a causal relationship between this event and local rainfall.
Overall, the analytical performance of the sensing platform is very encouraging, capable of achieving mean relative errors and standard deviations of 1–2% during completely autonomous operation. However, building these reagent-based chemical sensing platforms for long-term autonomous operation is a challenging task. The need to provide a means for in situ calibration means that these devices must incorporate components that provide fluidic handling (pumps, valves, reservoirs, fluidic interconnects), along with electronics for data harvesting, processing, storage, power management, and communications, all housed within a rugged enclosure and located securely in position. The platform design presented comprises 488 components and interconnectors, mostly electronics (138, including 20 major components such as LED, photodiode, temperature sensor, GPRS module, Arduino units, power regulators, and driver boards, along with 118 minor components—resistors, capacitors, etc.), but also encompassing 34 fluidics components (16 interconnecting tubing, fluidic chip, pumps, valves, filter etc.) and 29 mechanical components (case, internal chassis, 27 customised 3D printed unit locators). Reliable in situ operation depends on effective continuous functioning of all of these components, and the stability of reagents/standards used to generate the analytical response. Producing these platforms, even at a modest scale-up level (10–20 units), and validating their performance, is a formidable challenge for research teams due to the complex inter-disciplinary nature of the work, costs involved, and time required. The total component cost of this design is slightly under €2000, not including labour, which mainly involved assembly and fabrication of the fluidic chip via micro-milling. There is no doubt that adoption of industry production approaches will drive down the overall cost and improve reliability through automation of assembly, and more complete integration of electronics and fluidics. A particularly important improvement would be the use of automated methods for production of the fluidic chip (e.g., injection moulding or 3D printing). This is the subject of a recently launched project called ‘Holifab’, funded under the H2020-NMBP-PILOTS-2017 call (see https://cordis.europa.eu/project/rcn/212839_en.html). When faults arise, as occurred in these trials, locating of the fault source can be difficult and time consuming, and can result in significant downtime and maintenance costs. This makes the translation from platforms designed and built in universities to commercial devices that present disruptive improvements in the ‘performance/cost of ownership’ ratio very challenging, as it requires long-term commitment and investment of significant resources. However, the migration of emerging rapid prototyping technologies into universities and industry is creating an interesting opportunity to bridge this gap, by dramatically reducing the design/fabricate/evaluate iteration cycle. These developments will in turn encourage stronger university–industry cooperation, and significantly de-risk involvement from industry’s perspective. We are continuing to improve the platform design to improve reliability and incorporate emerging fabrication technologies to enhance the analytical performance and reduce costs. Further laboratory validation studies and in situ deployments of these platforms are currently in progress.

5. Conclusions

Reagent-based analyser platforms offer a route to delivering reliable long-term measurements of important chemical markers of water quality. A portable reagent-based analyser platform capable of continuous operation has been developed and extensively tested in laboratory trials, and in a preliminary in situ trial. The component cost is under €2000 and the analytical performance overall is very promising. Data generated can be remotely accessed and shared, offering a route to future integration with other sources of important environmental data. However, despite several significant design improvements over previous platforms, these systems remain relatively complex, and difficulties related to reliability can therefore arise. Despite this, we are confident that improvements arising from increasingly automated fabrication, more fully integrated electronics and fluidics, and closer cooperation between industry and university research teams will produce dramatic improvements in the performance/cost ratio, opening the way to the emergence of large scale environmental in situ (chemical) sensor networks.

Author Contributions

M.M.: Project management, platform development, preparation of the manuscript, corresponding author. G.L.: Sensor fabrication, component testing and integration, data analysis, fieldwork. A.D.: Sensor testing, validation, data analysis, fieldwork. P.M.: Electronics, wireless communications. D.D.: Overall concept, project scientific coordinator, preparation of the manuscript.

Funding

This research was funded by Enterprise Ireland project number IP/2016/0502, the COMMONSENSE Project funded from the European Union’s Seventh Framework Programme for research, technological development and demonstration under Grant Agreement No. 614155, and from Science Foundation Ireland under Grant SFI/12/RC/2289 (Insight Centre for Data Analytics). 3D printing was carried out at the Nano Research Facility in Dublin City University, which was funded under the Programme for Research in Third Level Institutions (PRTLI) Cycle 5. The PRTLI is co-funded through the European Regional Development Fund (ERDF), part of the European Union Structural Funds Programme 2011–2015.

Conflicts of Interest

The authors declare no conflict of interest.

References

  1. Zamparas, M.; Zacharias, I. Restoration of eutrophic freshwater by managing internal nutrient loads. A review. Sci. Total Environ. 2014, 496, 551–562. [Google Scholar] [CrossRef] [PubMed]
  2. Johnson, A.G.; Glenn, C.R.; Burnett, W.C.; Peterson, R.N.; Lucey, P.G. Aerial infrared imaging reveals large nutrient-rich groundwater inputs to the ocean. Geophys. Res. Lett. 2008, 35. [Google Scholar] [CrossRef] [Green Version]
  3. Schierenbeck, T.M.; Smith, M.C. Path to Impact for Autonomous Field Deployable Chemical Sensors: A Case Study of in Situ Nitrite Sensors. Environ. Sci. Technol. 2017, 51, 4755–4771. [Google Scholar] [CrossRef] [PubMed]
  4. Warwick, C.; Guerreiro, A.; Soares, A. Sensing and analysis of soluble phosphates in environmental samples: A review. Biosens. Bioelectron. 2013, 41, 1–11. [Google Scholar] [CrossRef] [PubMed]
  5. Blaen, P.J.; Khamis, K.; Lloyd, C.E.M.; Bradley, C.; Hannah, D.; Krause, S. Real-time monitoring of nutrients and dissolved organic matter in rivers: Capturing event dynamics, technological opportunities and future directions. Sci. Total Environ. 2016, 569–570, 647–660. [Google Scholar] [CrossRef] [PubMed]
  6. Sanseverino, I.; Conduto, D.; Pozzoli, L.; Dobricic, S.; Lettieri, T.; European Commission. Joint Research Centre: Algal Bloom and Its Economic Impact; Publications Office: Luxembourg, 2016. [Google Scholar]
  7. Beaton, A.D.; Cardwell, C.L.; Thomas, R.S.; Sieben, V.J.; Legiret, F.-E.; Waugh, E.M.; Statham, P.J.; Mowlem, M.C.; Morgan, H. Lab-on-Chip Measurement of Nitrate and Nitrite for In Situ Analysis of Natural Waters. Environ. Sci. Technol. 2012, 46, 9548–9556. [Google Scholar] [CrossRef] [PubMed]
  8. Nightingale, A.M.; Beaton, A.D.; Mowlem, M.C. Trends in microfluidic systems for in situ chemical analysis of natural waters. Sens. Actuators B Chem. 2015, 221, 1398–1405. [Google Scholar] [CrossRef] [Green Version]
  9. Voulvoulis, N.; Arpon, K.D.; Giakoumis, T. The EU Water Framework Directive: From great expectations to problems with implementation. Sci. Total Environ. 2017, 575, 358–366. [Google Scholar] [CrossRef] [PubMed]
  10. Ribotti, A.; Magni, P.; Mireno, B.; Schroeder, K.; Barton, J.; McCaul, M.; Diamond, D. New cost-effective, interoperable sensors tested on existing ocean observing platforms in application of European directives: The COMMON SENSE European project. In Proceedings of the OCEANS 2015, Genova, Italy, 18–21 May 2015; pp. 1–9. [Google Scholar]
  11. Cleary, J.; Slater, C.; McGraw, C.; Diamond, D. An autonomous microfluidic sensor for phosphate: On-site analysis of treated wastewater. IEEE Sens. J. 2008, 8, 508–515. [Google Scholar] [CrossRef]
  12. Slater, C.; Cleary, J.; Lau, K.-T.; Snakenborg, D.; Corcoran, B.; Kutter, J.P.; Diamond, D. Validation of a fully autonomous phosphate analyser based on a microfluidic lab-on-a-chip. Water Sci. Technol. 2010, 61, 1811–1818. [Google Scholar] [CrossRef] [PubMed] [Green Version]
  13. Bowden, M.; Diamond, D. The determination of phosphorus in a microfluidic manifold demonstrating long-term reagent lifetime and chemical stability utilising a colorimetric method. Sens. Actuators B Chem. 2003, 90, 170–174. [Google Scholar] [CrossRef]
  14. O’Toole, M.; Lau, K.T.; Shepherd, R.; Slater, C.; Diamond, D. Determination of phosphate using a highly sensitive paired emitter–detector diode photometric flow detector. Anal. Chim. Acta 2007, 597, 290–294. [Google Scholar] [CrossRef] [PubMed] [Green Version]
  15. Cleary, J.; Slater, C.; McGraw, C.; Diamond, D. An autonomous microfluidic sensor for phosphate: On-site analysis of treated wastewater. IEEE Sens. J. 2008, 8, 508–515. [Google Scholar] [CrossRef]
  16. McCarthy, V.; Irvine, K. A test of stoichiometry across six Irish lakes of low-moderate nutrient status and contrasting hardness. J. Plankton Res. 2010, 32, 15–29. [Google Scholar] [CrossRef]
  17. Galway County Council. Available online: http://www.galway.ie/en/services/environment/environmentalprotectionbeachesburialgrounds/beaches/blueflagandgreencoastawards/ (accessed on 26 June 2018).
  18. Historical Data—Met Éireann—The Irish Meteorological Service. Available online: https://www.met.ie/climate/available-data/historical-data (accessed on 14 August 2018).
  19. Interactive, N. Zoom Earth—Explore Satellite and Aerial Images of the Earth. Available online: https://zoom.earth/ (accessed on 5 November 2018).
Figure 1. Picture of the autonomous sensing platform. (A) Inlet system, (B) bags holding sample, high calibration standard, and low calibration standard, (C) detection chamber housing the microfluidic chip, LED (375 nm), and photodiode, (D) poly(methyl methacrylate) (PMMA) fluidic board, (E) battery, (F) reagent Bag, (G) waste bag and (H) electronics.
Chemosensors 06 00057 g001
Figure 2. Schematic diagram illustrating the sensing platform fluidic system. The portion including the fluidic chip is within the area bounded by the dashed line.
Chemosensors 06 00057 g002
Figure 3. (A) Exploded render of the microfluidic chip showing (1) the clear PMMA optical windows at each side of the optical channel; and (2) the top PMMA layer with the milled reagent/sample inlet and waste outlet. (B) Render of the microfluidic chip custom 3D printed alignment rail and sliders with detector components: (1) 375 nm UV LED; (2) photodiode; (3) LED slider; (4) photodiode slider; (5) microfluidic chip mount and alignment rail; and (6) microfluidic chip. (C) Image of the fluidic chip integrated into the alignment rail.
Chemosensors 06 00057 g003
Figure 4. (A) Satellite image of the sampling location at Loughrea Co., Galway, Ireland. (53°11′47.5″ N: 8°34′6.8″ W) [19]. (B) Picture of the prototype sensing platform deployment at Lough Rea angler’s fish hatchery, Loughrea Co., Galway, Ireland.
Chemosensors 06 00057 g004
Figure 5. (A) Comparison of phosphate linear calibrations (0–50 µM) obtained using the UV-Vis spectrophotometer and the fluidic chip detector with off-chip pre-mixed solutions (Method 1); (B) comparison of phosphate linear calibrations obtained using the UV-Vis spectrophotometer and the fluidic chip detector with automated sampling and on-chip mixing (Method 2). Method 1 (off-chip solution mixing) was also repeated with the same solutions for comparison. The excellent precision is evidenced by masking of error bars (standard deviations for n = 10 replicate measurements) by the point symbols.
Chemosensors 06 00057 g005
Figure 6. Laboratory analysis of phosphate standards (PO43−) with the autonomous sensing platform (clear dots) and the UV-Vis spectrophotometer reference method (red dots). Performance issues Section 1 and Section 2 (blue line).
Chemosensors 06 00057 g006
Figure 7. Variation in phosphate concentration (PO43−) measurements in Lough Rea over the 5-day deployment. The red dots represent concentrations of PO43− in grab samples collected at the site during the deployment and measured with the lab-based UV-Vis reference method.
Chemosensors 06 00057 g007
Table 1. Analytical performance of the sensing platform based on data from Figure 5B.
PO43− (µM)Reference PO43−Method 1 PO43−Method 2 PO43− **
Mean (µM) ± %RSD *%REMean (µM) ± %RSD *%REMean (µM) ± %RSD *%RE
55.07 ± 1.981.404.44 ± 2.23−11.165.03 ± 0.810.52
109.71 ± 0.46−2.908.98 ± 2.03−10.19--
1514.86 ± 0.95−0.9314.38 ± 0.38−4.12--
2525.35 ± 3.281.4025.17 ± 0.840.6925.04 ± 0.590.15
3534.91 ± 0.58−0.2634.56 ± 0.34−1.25--
5049.89 ± 0.28−0.2249.44 ± 0.12−1.1350.01 ± 2.300.01
* n = 10 at each concentration. ** Only three concentrations were analysed using Method 2 due to the large volume tanks used in preparation for the long-term laboratory validation study. RSD = relative standard deviation; RE = relative error.
Table 2. Summary of the analytical performance of the sensing platform during laboratory testing.
PO43− (µM)Reference PO43−Sensing Platform PO43−
Mean (µM) ± %RSD *%REMean (µM) ± %RSD%RE
5.55.81 ± 3.275.645.77 ± 13.45 (n = 223)4.91
8.58.48 ± 2.82−0.248.49 ± 6.12 (n = 90)−0.12
11.511.49 ± 0.78−0.0911.40 ± 2.42 (n = 69)−0.87
25.024.97 ± 0.48−0.1225.12 ± 3.36 (n = 462)0.48
* n = 10 at each concentration.

