Article

Formulation-Aware SW-NIR Spectroscopic Sensing of Bread Staling Using Stratified Chemometric Modeling and Wavelength Selection


1
School of Electrical and Information Engineering, Jiangsu University, Zhenjiang 212013, China
2
School of Computer Science and Communication Engineering, Jiangsu University, Zhenjiang 212013, China
*
Author to whom correspondence should be addressed.
Chemosensors 2026, 14(7), 151; https://doi.org/10.3390/chemosensors14070151
Submission received: 1 May 2026 / Revised: 14 June 2026 / Accepted: 29 June 2026 / Published: 1 July 2026

Abstract

Short-wave near-infrared (SW-NIR) spectroscopy provides a rapid and nondestructive sensing route for monitoring bread staling, but formulation-dependent moisture redistribution and starch retrogradation can make pooled spectral regression unstable. This study investigated a stratified SW-NIR modeling strategy for bread staling prediction using 324 spectra from control bread (CR) and two maltogenic α -amylase treatments (EZ1 and EZ2). A global full-spectrum partial least squares (PLS) model was compared with bread-type-specific PLS models; competitive adaptive reweighted sampling (CARS), support vector machine recursive feature elimination (SVM-RFE), and multiple feature-spaces ensemble LASSO (MFE-LASSO) were then each coupled with PLS and evaluated within each bread type. The pooled benchmark achieved a root mean square error of prediction (RMSEP) of 2.28 days, whereas stratified full-spectrum PLS reduced this to 1.86, 2.14, and 2.15 days for CR, EZ1, and EZ2, respectively. In repeated wavelength-selection runs, MFE-LASSO was the most consistently competitive method across bread types. In the representative best-model comparison, MFE-LASSO-PLS yielded the strongest performance for CR (RMSEP = 1.71 days) and EZ1 (RMSEP = 1.43 days), while CARS-PLS gave the lowest RMSEP for EZ2 (2.00 days). An exploratory position-specific analysis within the CR subset further suggested that the middle crumb region carried stronger staling-related spectral information than the top and bottom regions. These results indicate that formulation-aware SW-NIR spectroscopic sensing is a practical strategy for nondestructive bread-staling assessment and that the optimal wavelength-selection method is bread-type-dependent.

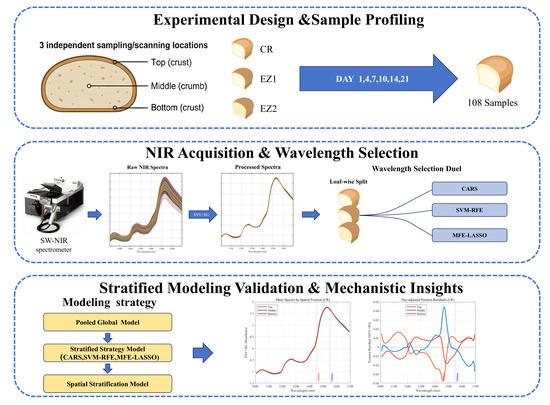
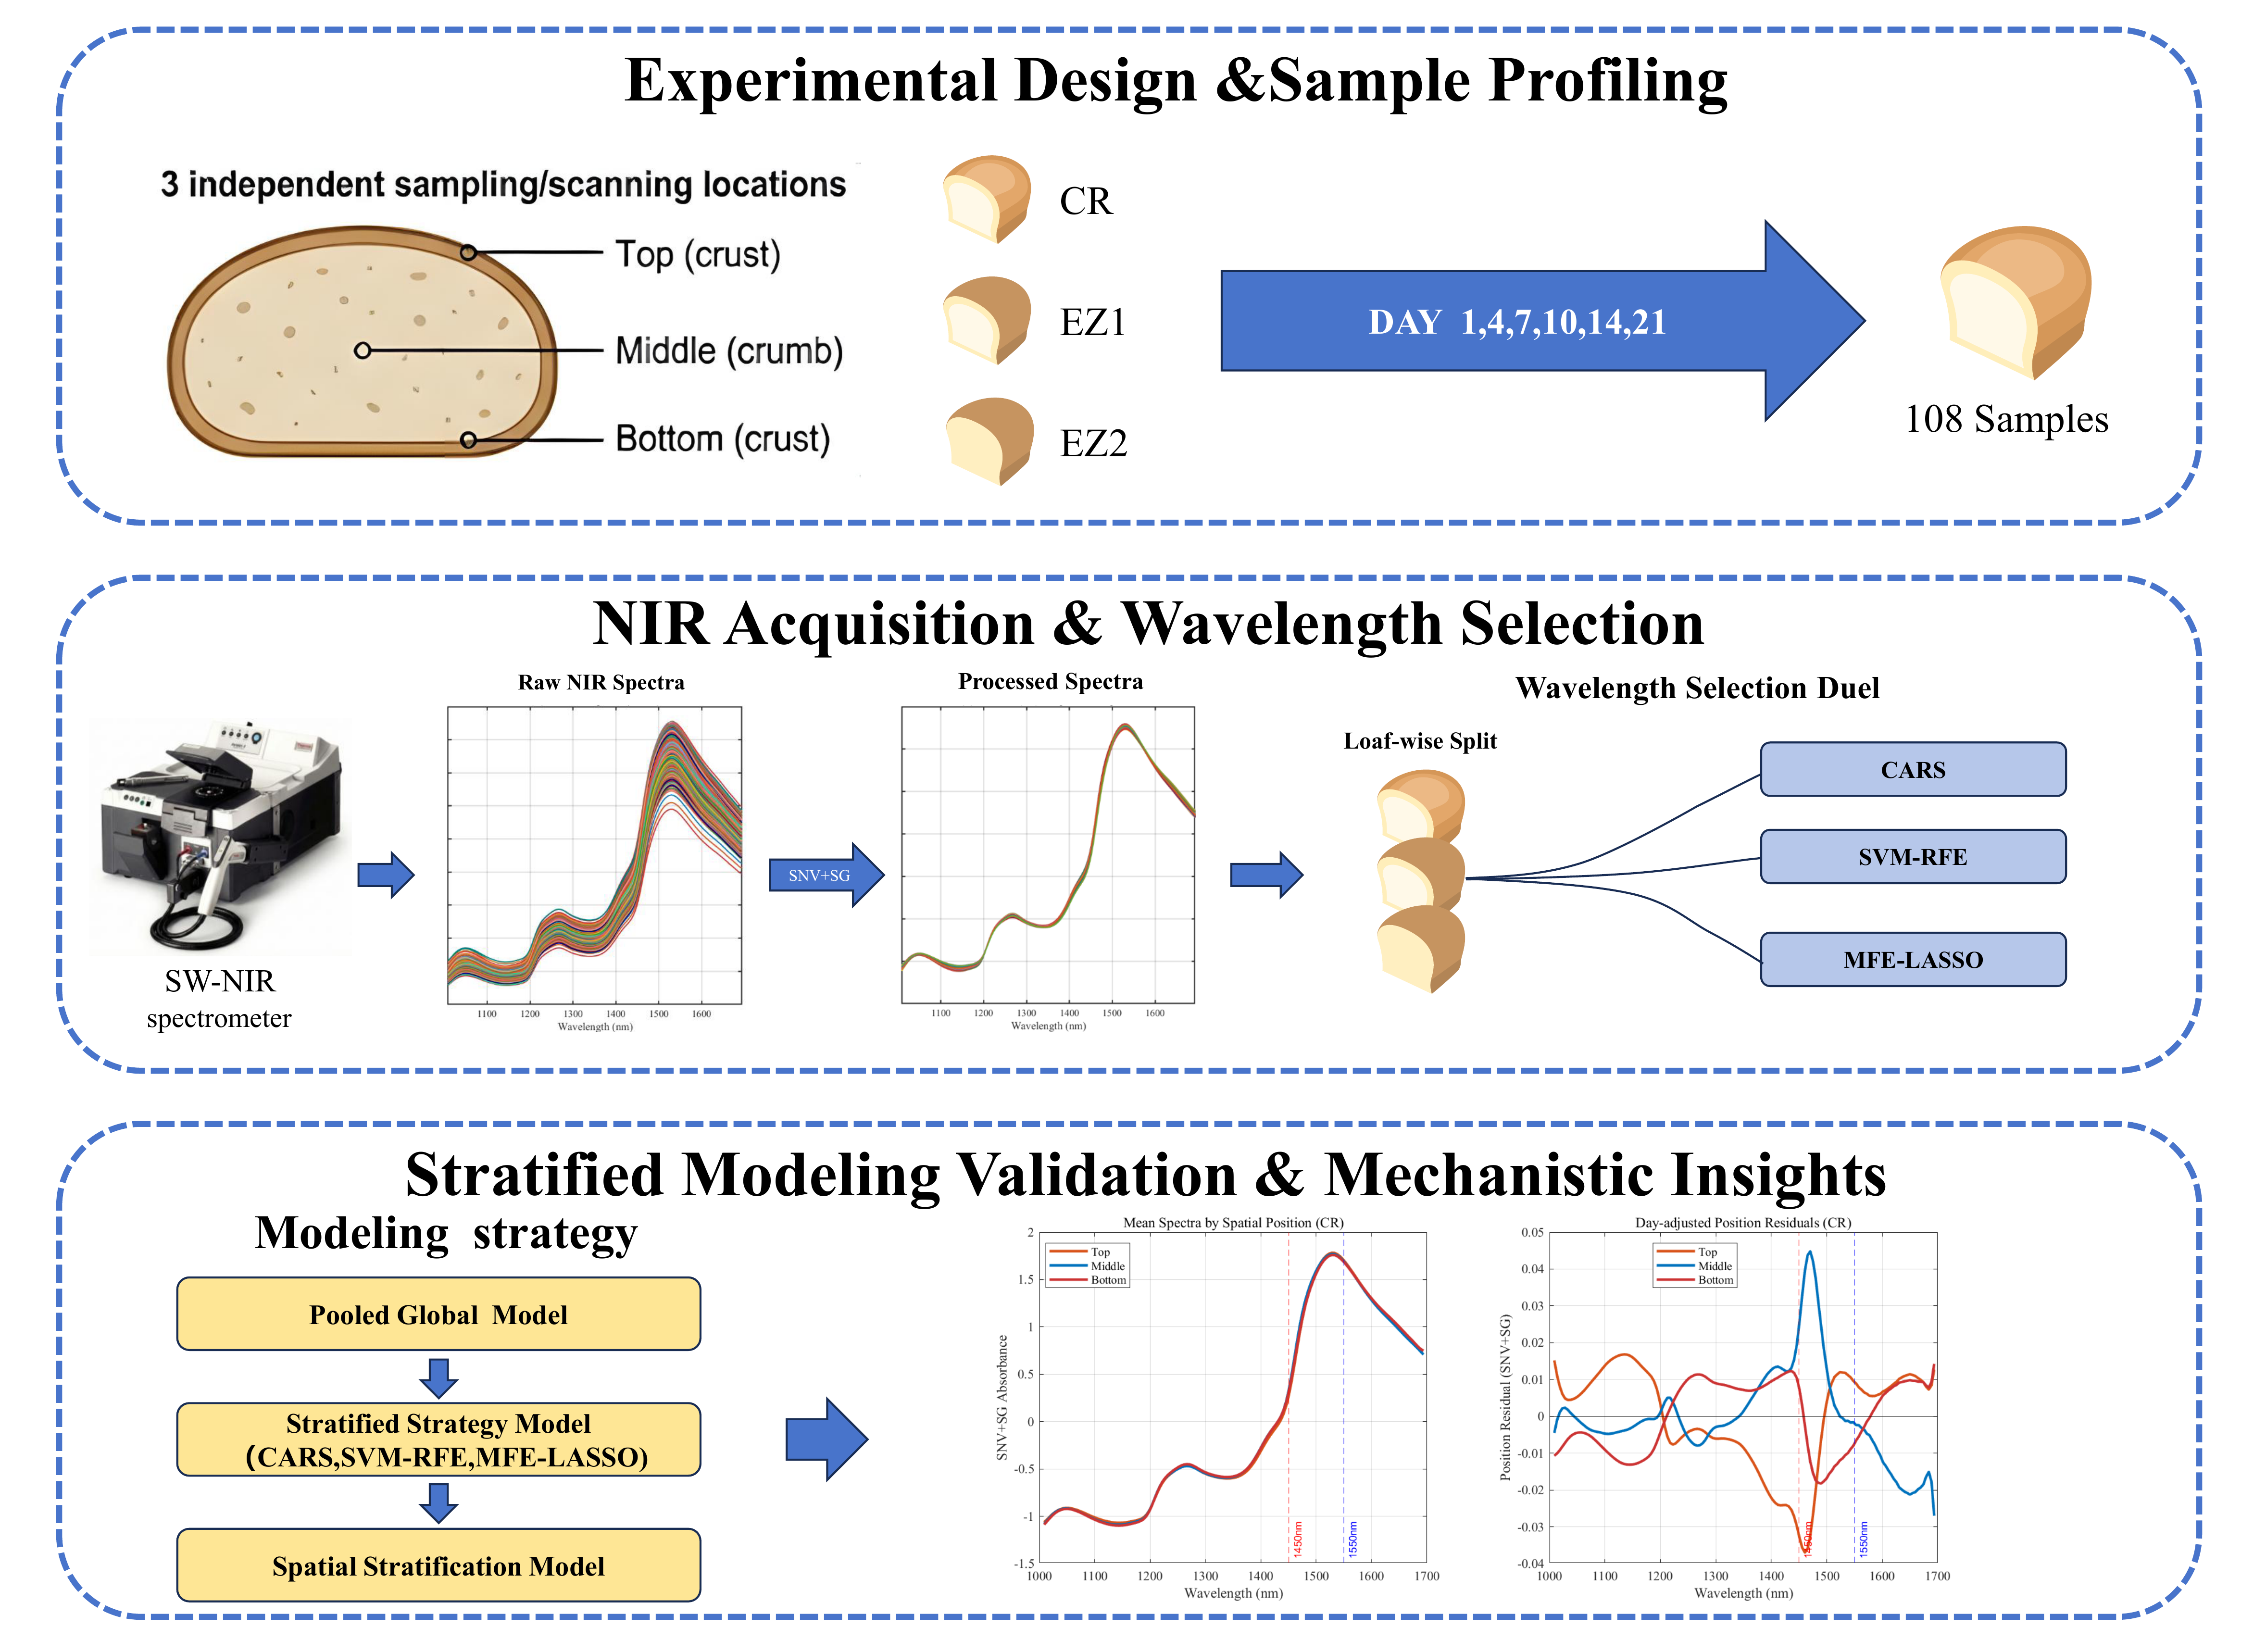
Graphical Abstract

1. Introduction

Bread staling is a major quality-deterioration process in baked products, typically expressed through crumb firming, loss of resilience, and declining consumer acceptability [1,2,3]. Both classical and modern bread studies have consistently shown that staling arises from a coupled evolution of starch retrogradation, moisture redistribution, and matrix reorganization rather than from a single isolated event [1,4,5,6,7,8]. Enzyme addition can substantially alter the kinetic trajectory of these changes [9,10]. In enzyme-treated systems, the same storage day does not necessarily correspond to the same physicochemical state across formulations, which renders pooled spectral regression potentially unstable and poses a direct modeling challenge for spectroscopy-based prediction.
Short-wave near-infrared spectroscopy offers a rapid and non-destructive sensing route for probing water- and carbohydrate-related absorptions in bread matrices. Spectroscopic sensor systems have shown value in bread- and cereal-related quality studies, including multivariate prediction of instrumental texture parameters, monitoring of bread storage changes, and quantitative analysis of chemically complex grain attributes [11,12,13,14,15,16,17,18]. Recent reviews have further reinforced the value of near-infrared spectroscopy and chemometrics for food-quality screening and nondestructive assessment of cereal-based products [19,20,21,22,23,24,25]. The broader field of intelligent food sensing is also moving toward multi-sensor and machine-learning-enabled platforms, including electronic-nose systems for beverage discrimination and volatile-pattern analysis [26]. This wider context emphasizes that spectroscopic prediction should be evaluated not only by numerical accuracy but also by deployment assumptions, model transferability, and the interpretability of selected sensing variables. However, broad and overlapping absorption bands in the 1000–1700 nm region create strong collinearity, making full-spectrum models difficult to interpret and potentially unstable, particularly in bread systems where starch- and water-related information remain strongly coupled [27]. Feature-wavelength selection is therefore attractive not only for dimensionality reduction, but also for identifying reproducible spectral regions linked to bread staling behavior. Competitive adaptive reweighted sampling (CARS), support vector machine-recursive feature elimination (SVM-RFE), and multiple feature-spaces ensemble-least absolute shrinkage and selection operator (MFE-LASSO) represent three complementary strategies for this purpose [17,28,29,30].
Although the physicochemical basis of bread staling has been studied extensively, the spectroscopy literature remains fragmented across texture-correlation studies, general bread-quality monitoring, and spatial imaging analyses. Within the broader experimental system used here, published work has described the texture kinetics of staling as well as NIR- and hyperspectral-imaging-based monitoring of firmness-related evolution [9,31,32]. The present work is not intended to introduce a new chemometric algorithm. Its novelty lies instead in reframing the publicly available bread-staling spectra as a formulation-aware sensing problem and in testing, under loaf-wise held-out validation, whether explicit formulation stratification and within-formulation wavelength selection provide a more interpretable prediction workflow than a single pooled calibration. However, those studies did not address the specific question examined here: loaf-wise held-out prediction of storage day under explicit bread-type stratification, together with a direct comparison of wavelength-selection strategies within each bread type. In the present dataset, the three bread types were generated within the same experimental system yet exhibited clearly different staling trajectories, which means that identical storage days may represent different stages of structural change across formulations. A pooled model may therefore combine spectra from chemically non-equivalent states and obscure the relationship between spectral variation and storage time.
In light of the above, the present study was designed to pursue three objectives: (1) to compare a pooled global full-spectrum PLS model with bread-type-specific models and assess whether stratification improves storage-day prediction; (2) to evaluate CARS, SVM-RFE, and MFE-LASSO as wavelength-selection strategies within each bread type and identify the most consistent approach; and (3) to conduct an exploratory position-specific analysis of the CR subset to determine whether the top, middle, and bottom crumb regions exhibit distinct staling-related spectral behavior. The findings are expected to provide a practical basis for formulation-aware SW-NIR sensing of bread quality and to offer a transferable chemometric framework for the nondestructive assessment of enzyme-modified cereal products. At the same time, the proposed strategy should be understood as a practical chemometric workflow whose applicability depends on the availability or reliable prediction of formulation labels, rather than as a universal replacement for nonlinear modeling.

2. Materials and Methods

2.1. Dataset, Experimental Design, and Data Partitioning

The dataset used in this study was originally reported by the research group of Søren Balling Engelsen at the University of Copenhagen [9,31,32] and comprises two components: a design-oriented metadata object and an NIR spectral object. The NIR component contains 324 spectra with 142 wavelength variables covering 1008.8–1693.6 nm, while the design metadata encode bread type, storage day, loaf identifier, spatial position, and replicate information. Three spatial positions were used: top, middle, and bottom. The three bread formulations are a control bread (CR), a bread containing the commercial maltogenic α -amylase Novamyl (EZ1), and a bread containing an experimental maltogenic α -amylase (EZ2). Samples were observed at six storage times (1, 4, 7, 10, 14, and 21 days), with two loaves per bread type at each time point and three repeated measurements per position. This design yields 108 spectra per bread type and 36 spectra per storage day across the full dataset.
To prevent within-loaf information leakage, the physical loaf was treated as the minimum indivisible unit during model construction. Calibration and prediction sets were therefore separated at the loaf level so that all positions and repeated measurements from a held-out loaf remained unseen during training. Each bread type contributed 81 spectra from 9 loaves to the calibration set and 27 spectra from 3 loaves to the prediction set. The split was applied independently to CR, EZ1, and EZ2 and combined when the global model was evaluated. The same loaf-wise independence was maintained during internal cross-validation, where latent-variable selection and variable screening used loaf-wise folds rather than spectrum-wise random folds. Table 1 summarizes the split structure and subset-wise storage-day distributions.

2.2. Spectral Preprocessing

All spectra were preprocessed by standard normal variate correction followed by Savitzky–Golay smoothing with a window length of 7 and a polynomial order of 3. This combination follows established near-infrared practice for reducing scatter-related variance and high-frequency noise while preserving the broad band shapes required for subsequent chemometric modeling [33,34].

2.3. Feature-Wavelength Selection Settings

Three wavelength-selection strategies were evaluated within each bread type. CARS was applied as a competitive Monte Carlo shrinking procedure [28]. SVM-RFE was applied as a recursive ranking-and-elimination method based on support vector machine weights [29]. MFE-LASSO was applied as a Monte Carlo and weighted-bootstrap ensemble selection strategy designed to improve selection consistency in highly collinear spectral spaces [30]. Each method was repeated 50 times and interpreted from two complementary perspectives: the distribution of repeated-run performance and a single representative best-model instance.
CARS was run with 50 Monte Carlo samplings. SVM-RFE was implemented as a linear-kernel support vector regression ranking procedure with a BoxConstraint of 1, followed by repeated subsampling-based weight aggregation to stabilize the elimination order. MFE-LASSO used 80 Monte Carlo resamplings in the first phase and 30 weighted-bootstrap iterations in the second phase to generate and refine candidate variable subsets. These values represent the fixed working settings used throughout the present comparison.

2.4. Modeling Strategy

The modeling workflow was organized into three levels. First, a pooled global full-spectrum PLS model was constructed as a direct baseline to test whether bread-type stratification is more appropriate than pooled regression for this dataset. Second, within each bread type, CARS, SVM-RFE, and MFE-LASSO were each combined with PLS and compared against the corresponding full-spectrum PLS model. Third, an exploratory CR-only position-specific analysis was performed to examine whether the top, middle, and bottom regions exhibit distinct wavelength-selection patterns and predictive behavior. The comparison was deliberately restricted to established linear chemometric models and wavelength-selection procedures. This design isolates the effects of formulation stratification and wavelength selection without introducing a second source of variation from model-family changes. Neural network-based regression approaches were not included in the present comparison, as deep learning models generally require substantially larger training sets to avoid overfitting in high-dimensional spectral data; with 81 calibration spectra per bread type, the available sample size is insufficient for this model family [25,35]. A universal nonlinear model remains an important future direction when larger multi-batch datasets become available, but it would not provide a statistically well-supported benchmark for the present small-sample dataset.
For the repeated variable-selection experiment, each method was run 50 times to assess both the variability in prediction performance and the reproducibility of selected wavelength regions. The repeated-run statistics were used to evaluate method stability, while a separate representative best-model table presents one selected model instance for direct model-to-model comparison and wavelength interpretation. Representative best models were selected within each bread-type and method combination using the lowest RMSECV as the primary criterion; external prediction performance and model compactness were considered as secondary criteria. The full run-to-run summary is reported in Supplementary Table S1.
For all full-spectrum and feature-selected bread-type models, PLS served as the common regression backbone so that the comparison isolates the effects of stratification and wavelength selection without simultaneously varying the model family [36]. In a deployment setting, the stratified workflow assumes that bread type is known from production records or can be assigned by a preliminary classification step before storage-day prediction. The present study evaluates the regression component under known formulation labels and does not claim to solve the separate problem of automatic formulation recognition. The same modeling logic was retained for the CR position-specific analysis, except that validation was performed in a leave-one-loaf-out manner within each spatial subset, ensuring that each validation fold represented a previously unseen loaf.

2.5. Evaluation Metrics

Model quality was evaluated using the coefficient of determination for calibration and prediction ( R C 2 and R P 2 ), the root mean square errors for calibration and prediction (RMSEC and RMSEP), and the residual predictive deviation (RPD) [17,37]. For the repeated variable-selection experiment, the number of retained wavelengths and the run-to-run distribution of performance metrics were also recorded. The same prediction metrics were retained in the exploratory position-specific analysis to preserve comparability with the bread-type models. For the CR position-specific analysis, the reported metrics summarize aggregated predictions from a leave-one-loaf-out validation scheme applied separately to the top, middle, and bottom subsets.
The calculation formulas for these metrics are as follows:
RMSEC = i = 1 n c ( y i y ^ i ) 2 n c
R C 2 = 1 i = 1 n c ( y i y ^ i ) 2 i = 1 n c ( y i y ¯ ) 2
RPD = SD P RMSEP
where y i is the reference value, y ^ i is the predicted value, y ¯ is the mean of the calibration set reference values, and n c is the number of calibration samples. SD P is the standard deviation of the prediction set reference values. The formulas for RMSEP and R P 2 follow the same structure as RMSEC and R C 2 , applied to the prediction set.
RPD is used in this study as a comparative performance descriptor alongside R P 2 and RMSEP.

3. Results and Discussion

3.1. Exploratory Spectral Structure

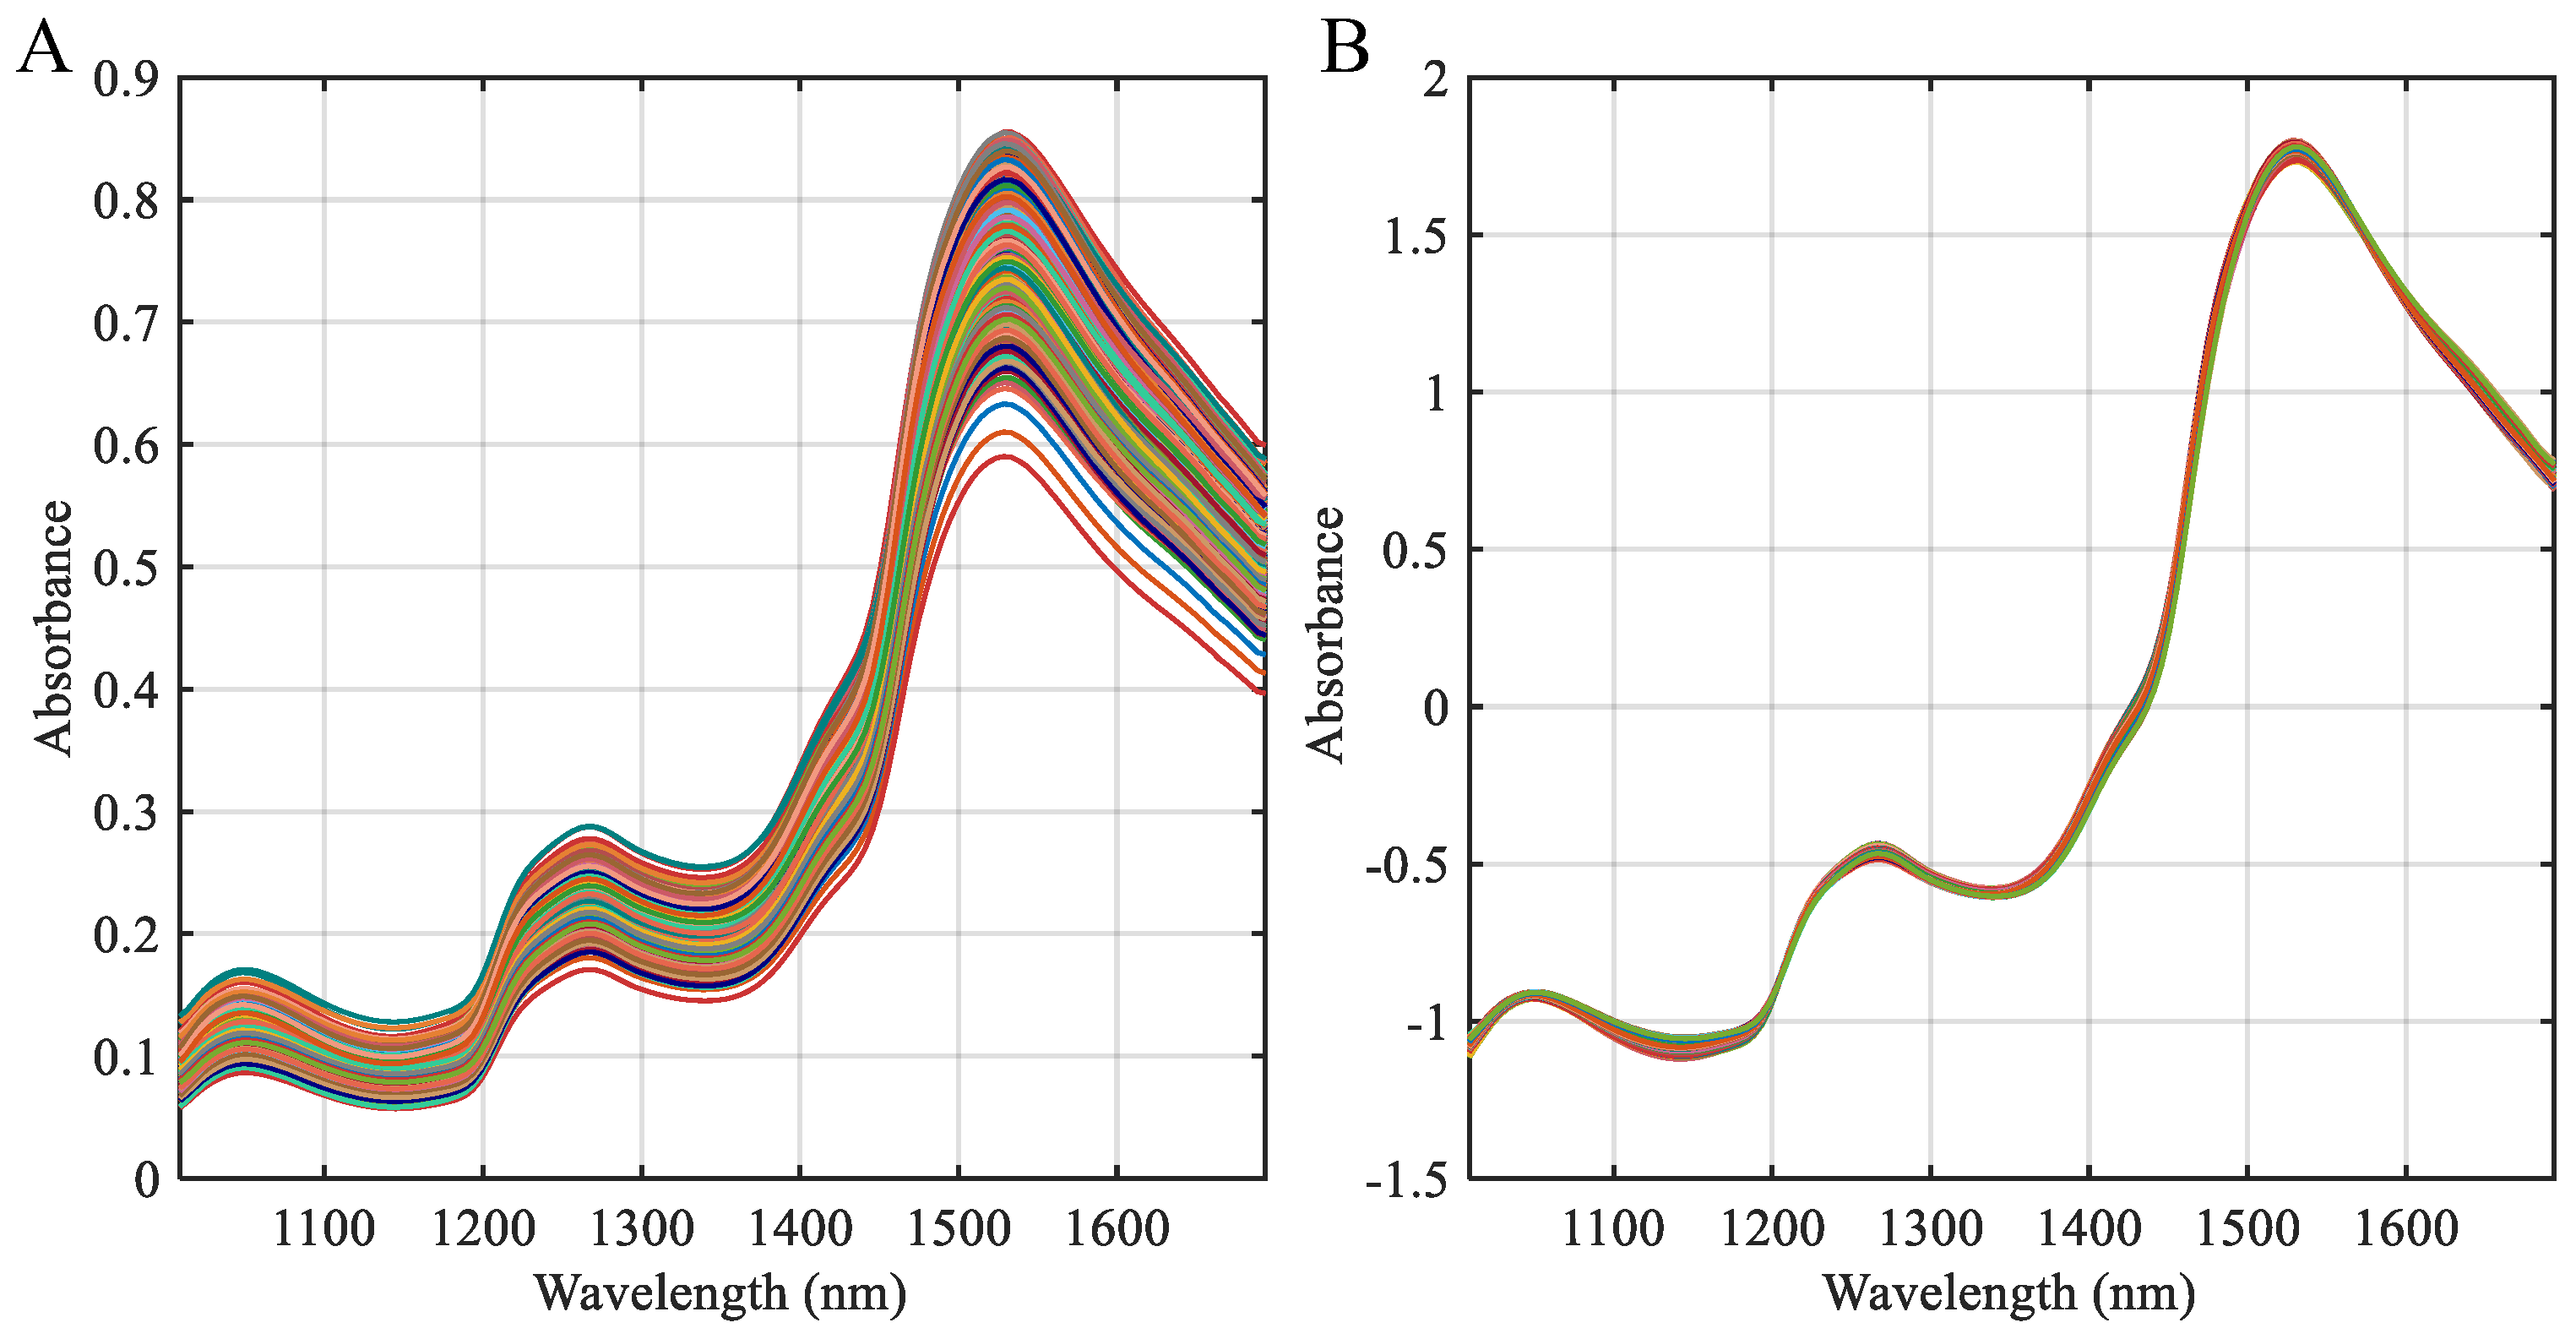
The raw spectra showed broadly similar band shapes across the 324 samples but differed in intensity scale and baseline level. After SNV followed by Savitzky–Golay smoothing, the curves overlapped more tightly while retaining the major absorption structure, confirming the suitability of the preprocessed matrix for subsequent chemometric analysis (Figure 1). The dominant absorption regions were located near 1150 nm, 1200 nm, 1450 nm, and 1550 nm, consistent with water- and carbohydrate-related overtone and combination bands in bread-like matrices.
When average spectra were grouped by bread type and storage day, the three bread types remained highly similar at the level of static mean spectra, suggesting that the formulation effect was not expressed primarily as a global shape difference. In contrast, the Day 21 minus Day 1 difference spectra showed visible divergence among CR, EZ1, and EZ2, particularly in the 1050–1200 nm, 1400–1500 nm, and 1600–1700 nm regions. These patterns indicate that enzyme treatment likely altered the trajectory of spectral evolution during staling rather than producing a large type-dependent offset in the raw spectra. The corresponding mean-spectrum and difference-spectrum visualizations are provided in Supplementary Figure S1.
Principal component analysis reinforced this interpretation. The first two principal components accounted for most of the spectral variance, yet the score distributions for bread type still overlapped substantially, indicating that type-dependent differences were weaker than the dominant storage-related structure. The wavelength-wise ANOVA profile further suggested that the strongest type-dependent differences were concentrated near 1230 nm and in the 1580–1600 nm region, whereas the classical 1450 nm water band was not the primary type-discriminative region. One plausible explanation is that enzyme treatment altered carbohydrate accessibility and water–matrix coupling more strongly than bulk water content alone, making formulation differences more visible in carbohydrate-sensitive and water-structure-coupled regions than in the broad 1450 nm band [1,9]. This distinction matters because wavelengths that are useful for separating bread types are not necessarily the most informative for predicting storage day within a single bread type. Additional PCA, ANOVA, and position-residual visualizations are provided in Supplementary Figures S2–S4. Taken together, these observations indicate that the three bread types follow distinct spectral evolution pathways during storage, supporting the use of formulation-specific models rather than a single pooled regression for this dataset.

3.2. Global vs. Stratified Modeling

The comparison between the pooled full-spectrum PLS model and the bread-type-specific full-spectrum PLS models provides a direct test of the stratified modeling hypothesis. As summarized in Table 2, the global model achieved an overall prediction performance of R P 2 = 0.8152 and RMSEP = 2.28 days. Applied within each bread-type subset, the same global model yielded RMSEP values of 2.18, 2.23, and 2.43 days for CR, EZ1, and EZ2, respectively. The stratified full-spectrum models reduced these errors to 1.86 days for CR, 2.14 days for EZ1, and 2.15 days for EZ2.
These results indicate that bread-type stratification provides a numerically consistent and practically meaningful improvement within the present split design. The gain was most pronounced for CR and EZ2, where RMSEP reductions of approximately 14.9% and 11.7% were observed, respectively, while EZ1 showed a more modest improvement. Because the external prediction set contains only three held-out loaves per bread type, these RMSEP differences should be interpreted as descriptive evidence from a loaf-wise validation design rather than as formal proof of statistical superiority. The repeated variable-selection runs reported below provide additional information on run-to-run stability, but they do not replace validation on independent production batches. The asymmetric benefit across bread types is informative in itself, as it suggests that pooled modeling does not affect every formulation equally. Stratified models therefore provide a more appropriate modeling baseline than the global mixed model for this bread staling problem.
From a mechanistic standpoint, this result is plausible. The bread-staling literature has repeatedly shown that enzyme-treated breads can differ not only in absolute firmness but also in the rate and shape of their texture-development trajectories [9,10]. When spectra from such trajectories are pooled into a single regression, the model is forced to map chemically and structurally non-equivalent states onto the same numerical storage-day axis. Stratification does not eliminate all modeling difficulty, but it reduces this source of heterogeneity and thereby provides a more homogeneous chemometric target within each bread type. This advantage is expected to be most relevant when formulations differ discretely and their staling trajectories are sufficiently distinct. If formulation differences are weak, continuous, or strongly convergent during storage, a hard stratification boundary may offer limited benefit and a pooled nonlinear or hierarchical model may be preferable.

3.3. Stability of Feature-Wavelength Selection

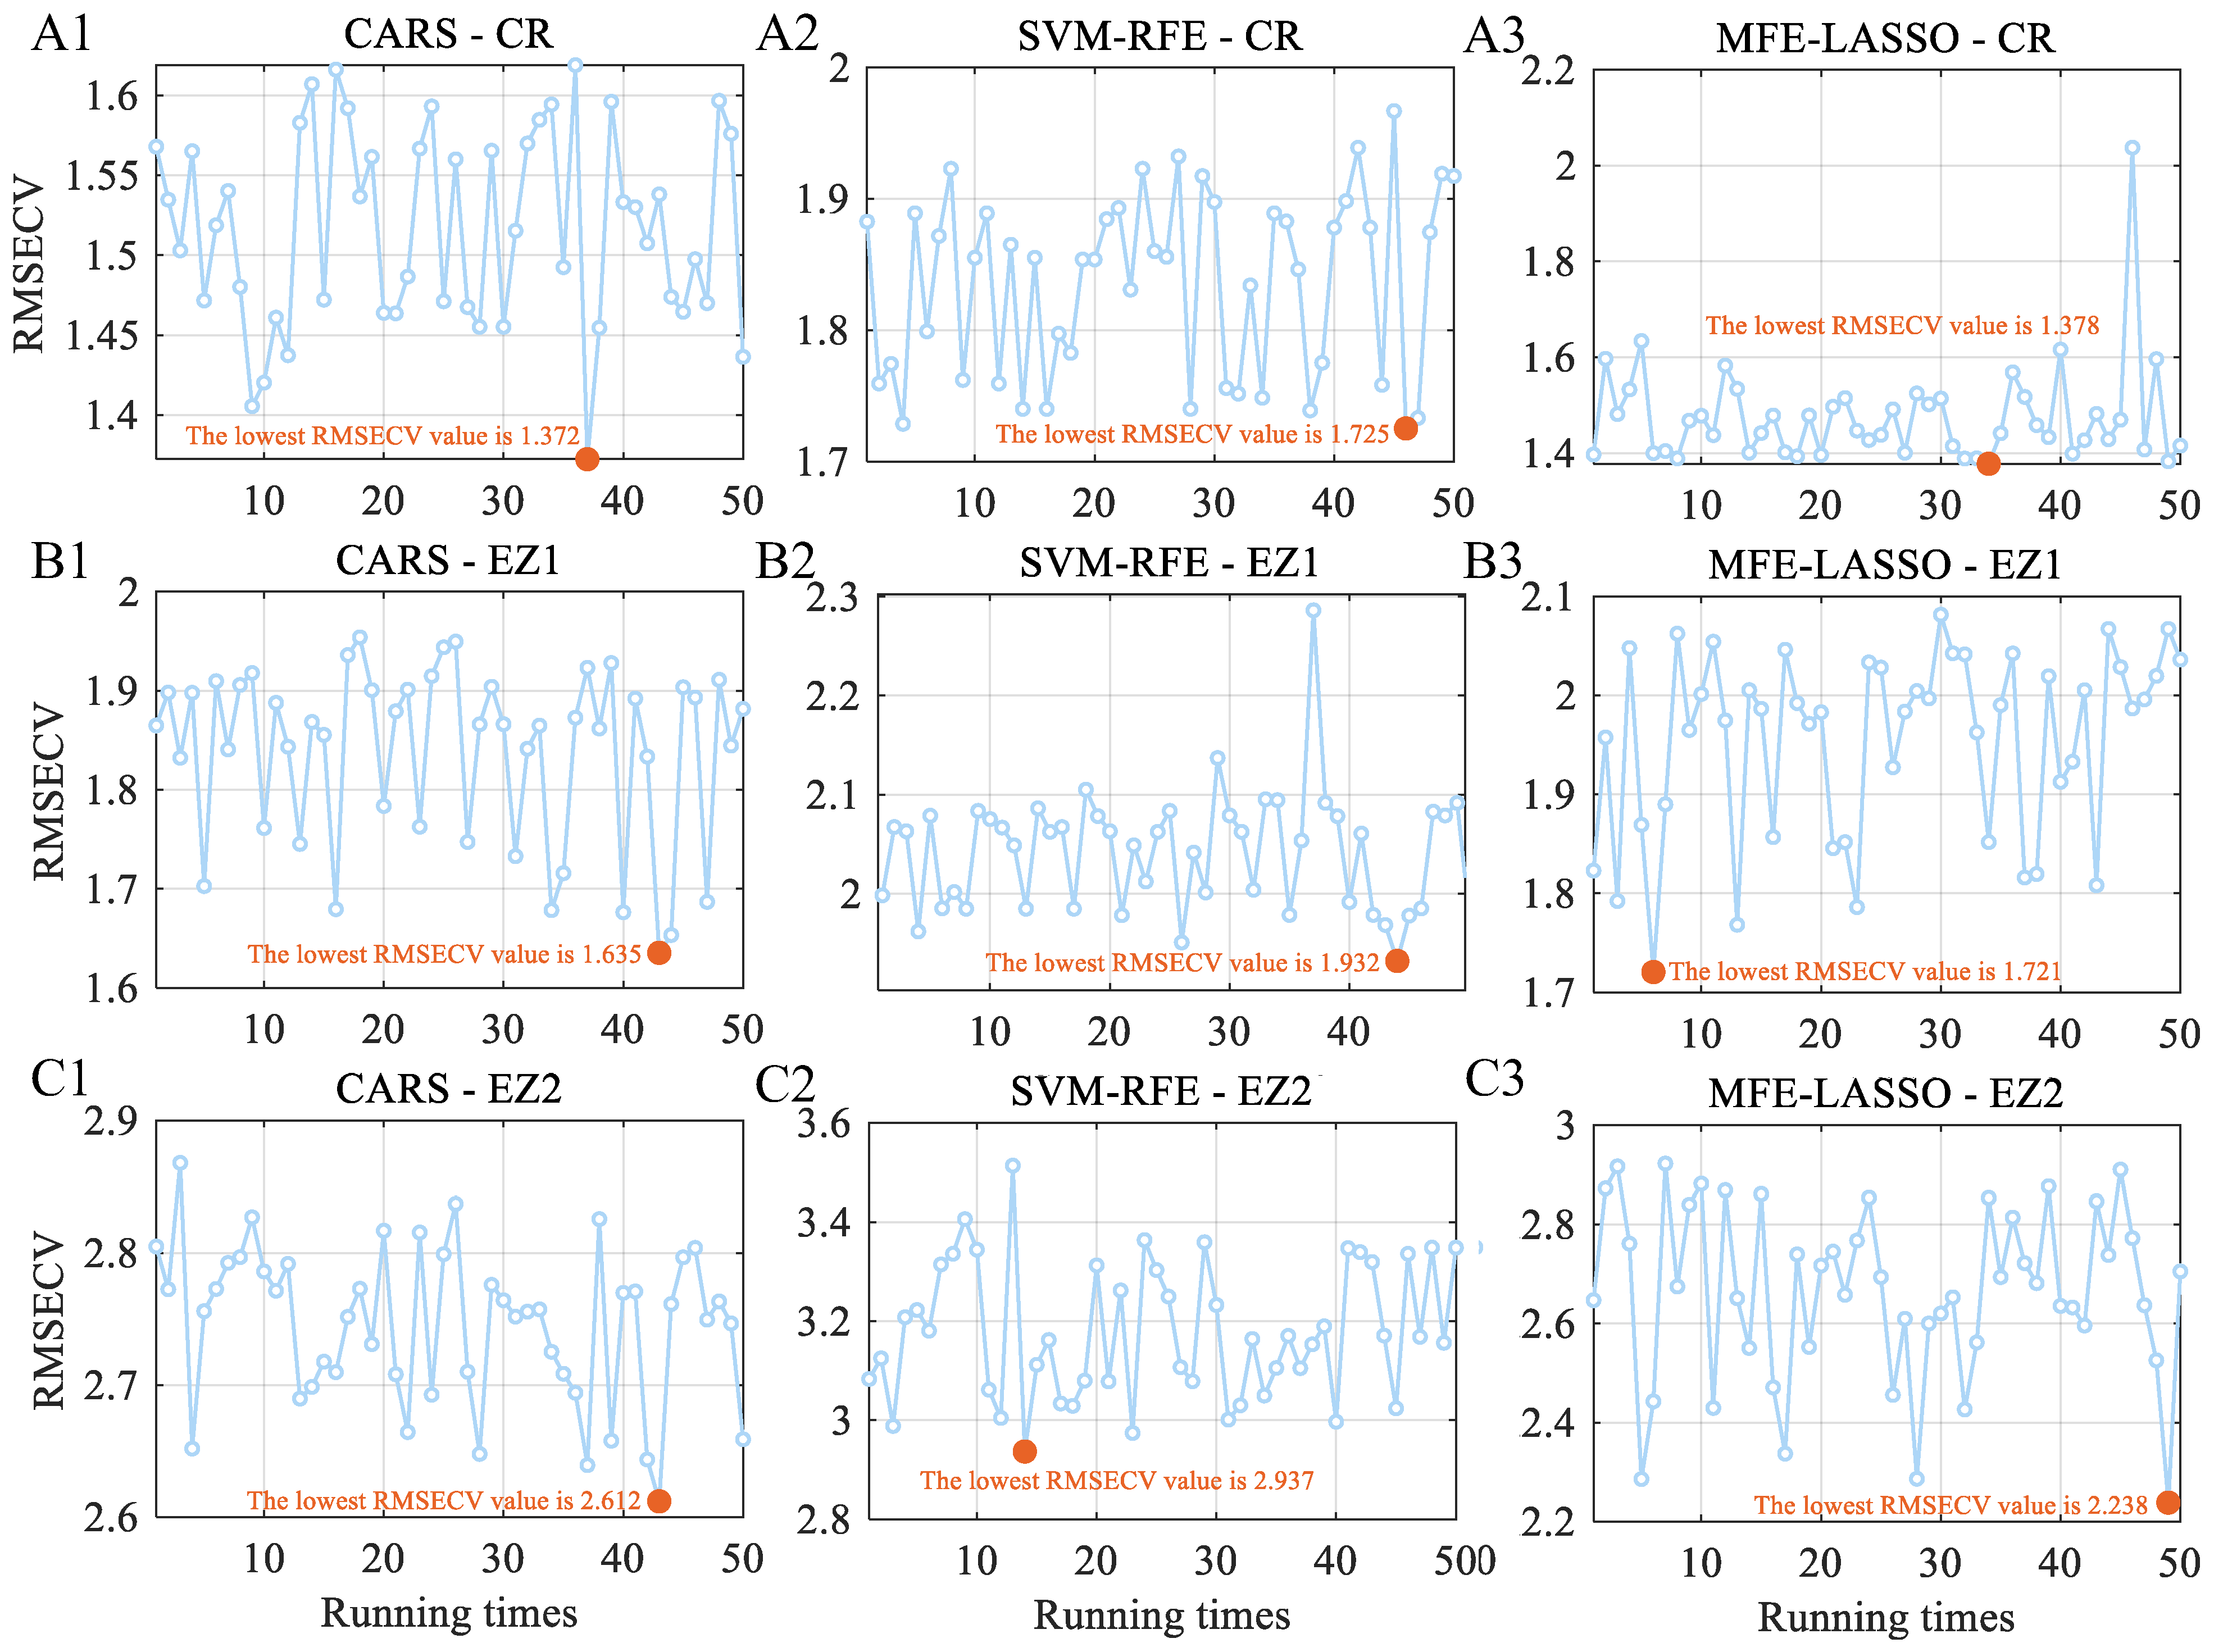
The 50-run statistics showed that the relative performance of the three wavelength-selection methods depended on bread type. For CR, MFE-LASSO produced the lowest average RMSEP (1.62 days), well below the averages for full-spectrum PLS, CARS, and SVM-RFE, while also retaining the smallest average number of variables. For EZ1, SVM-RFE gave the lowest average RMSEP (1.85 days), followed by MFE-LASSO (1.96 days) and CARS (2.08 days). For EZ2, MFE-LASSO again gave the lowest average RMSEP (1.91 days), whereas SVM-RFE was markedly weaker at 2.81 days. The corresponding RMSECV trajectories are shown in Figure 2; the full repeated-run summary is provided in Supplementary Table S1. Thus, model confidence was not inferred from a single selected run alone, but from the empirical distribution obtained across independent resampling runs. The relatively compact MFE-LASSO error distributions and their separation from the full-spectrum PLS baseline and competing selection methods indicate that its improvement is robust to sampling variability rather than a random artifact of one favorable split.
These repeated-run results show that no single feature-selection method dominated every bread type in the same way. Across the three bread types, MFE-LASSO was the most consistently competitive method, combining a low average prediction error with a compact variable set. In contrast, SVM-RFE exhibited a more pronounced bread-type dependence and became unstable for EZ2, whereas CARS remained competitive but tended to retain more variables than MFE-LASSO in this comparison.
The distinction between stability and single-run optimality matters in practice. A method that occasionally produces the lowest prediction error may not be the most reliable choice if its run-to-run variability is large, whereas a method with a compact and reproducible wavelength set offers practical advantages even when its single-run best does not rank first. Therefore, the repeated-run results are used here to assess robustness of the variable-selection procedure, while the representative models are used mainly for transparent reporting of selected wavelength sets.

3.4. Representative Within-Type Model Comparison

As reported in Table 3, MFE-LASSO-PLS gave the best overall balance for CR, reaching R P 2 = 0.9085 , RMSEP = 1.71 days, and RPD = 3.35 with only 19 variables. CARS-PLS and SVM-RFE-PLS also improved over the full-spectrum baseline in certain respects, but neither achieved the combination of model compactness and prediction performance obtained by MFE-LASSO-PLS for CR.
For EZ1, MFE-LASSO-PLS again produced the strongest representative prediction result, with R P 2 = 0.9383 , RMSEP = 1.43 days, and RPD = 4.08 using only 11 variables. SVM-RFE-PLS was the second-best representative model for EZ1 and clearly outperformed CARS-PLS, which showed weaker predictive accuracy despite a good calibration fit. This pattern supports the view that calibration performance alone is not sufficient for selecting the most transferable model.
For EZ2, the representative comparison departed from the repeated-run average pattern. In the representative best-model table, CARS-PLS yielded the lowest RMSEP (2.00 days), slightly outperforming MFE-LASSO-PLS (2.07 days), while SVM-RFE-PLS remained substantially weaker. This divergence between repeated-run averages and single selected models further justifies reporting both stability statistics and representative best-model results. Taken together, the two analyses show that MFE-LASSO is the most broadly competitive method in the current study, but the bread-type dependence of model selection remains real and cannot be reduced to a single universal ranking.
The practical implication is that the choice of wavelength-selection strategy should be treated as formulation-sensitive rather than universally transferable. In this study, MFE-LASSO provides the most convincing overall balance because it performs well in both the repeated-run and representative-model analyses while retaining fewer variables. The EZ2 results nonetheless demonstrate that a CARS-selected model can still yield the strongest representative solution for a specific bread type. For industrial deployment, this result suggests a two-stage decision process: known formulations can be routed directly to the corresponding calibration model using recipe, batch, or product-line metadata, whereas unknown samples would require a preliminary formulation-classification step before regression. If future applications involve continuously varying formulations, ambiguous formulation boundaries, or transfer across production campaigns, the present hard-stratified design should be replaced or augmented by models that encode formulation descriptors as continuous covariates, hierarchical models, transfer-learning procedures, or universal nonlinear models validated on larger multi-batch datasets.

3.5. Key Wavelength Distribution and Interpretation

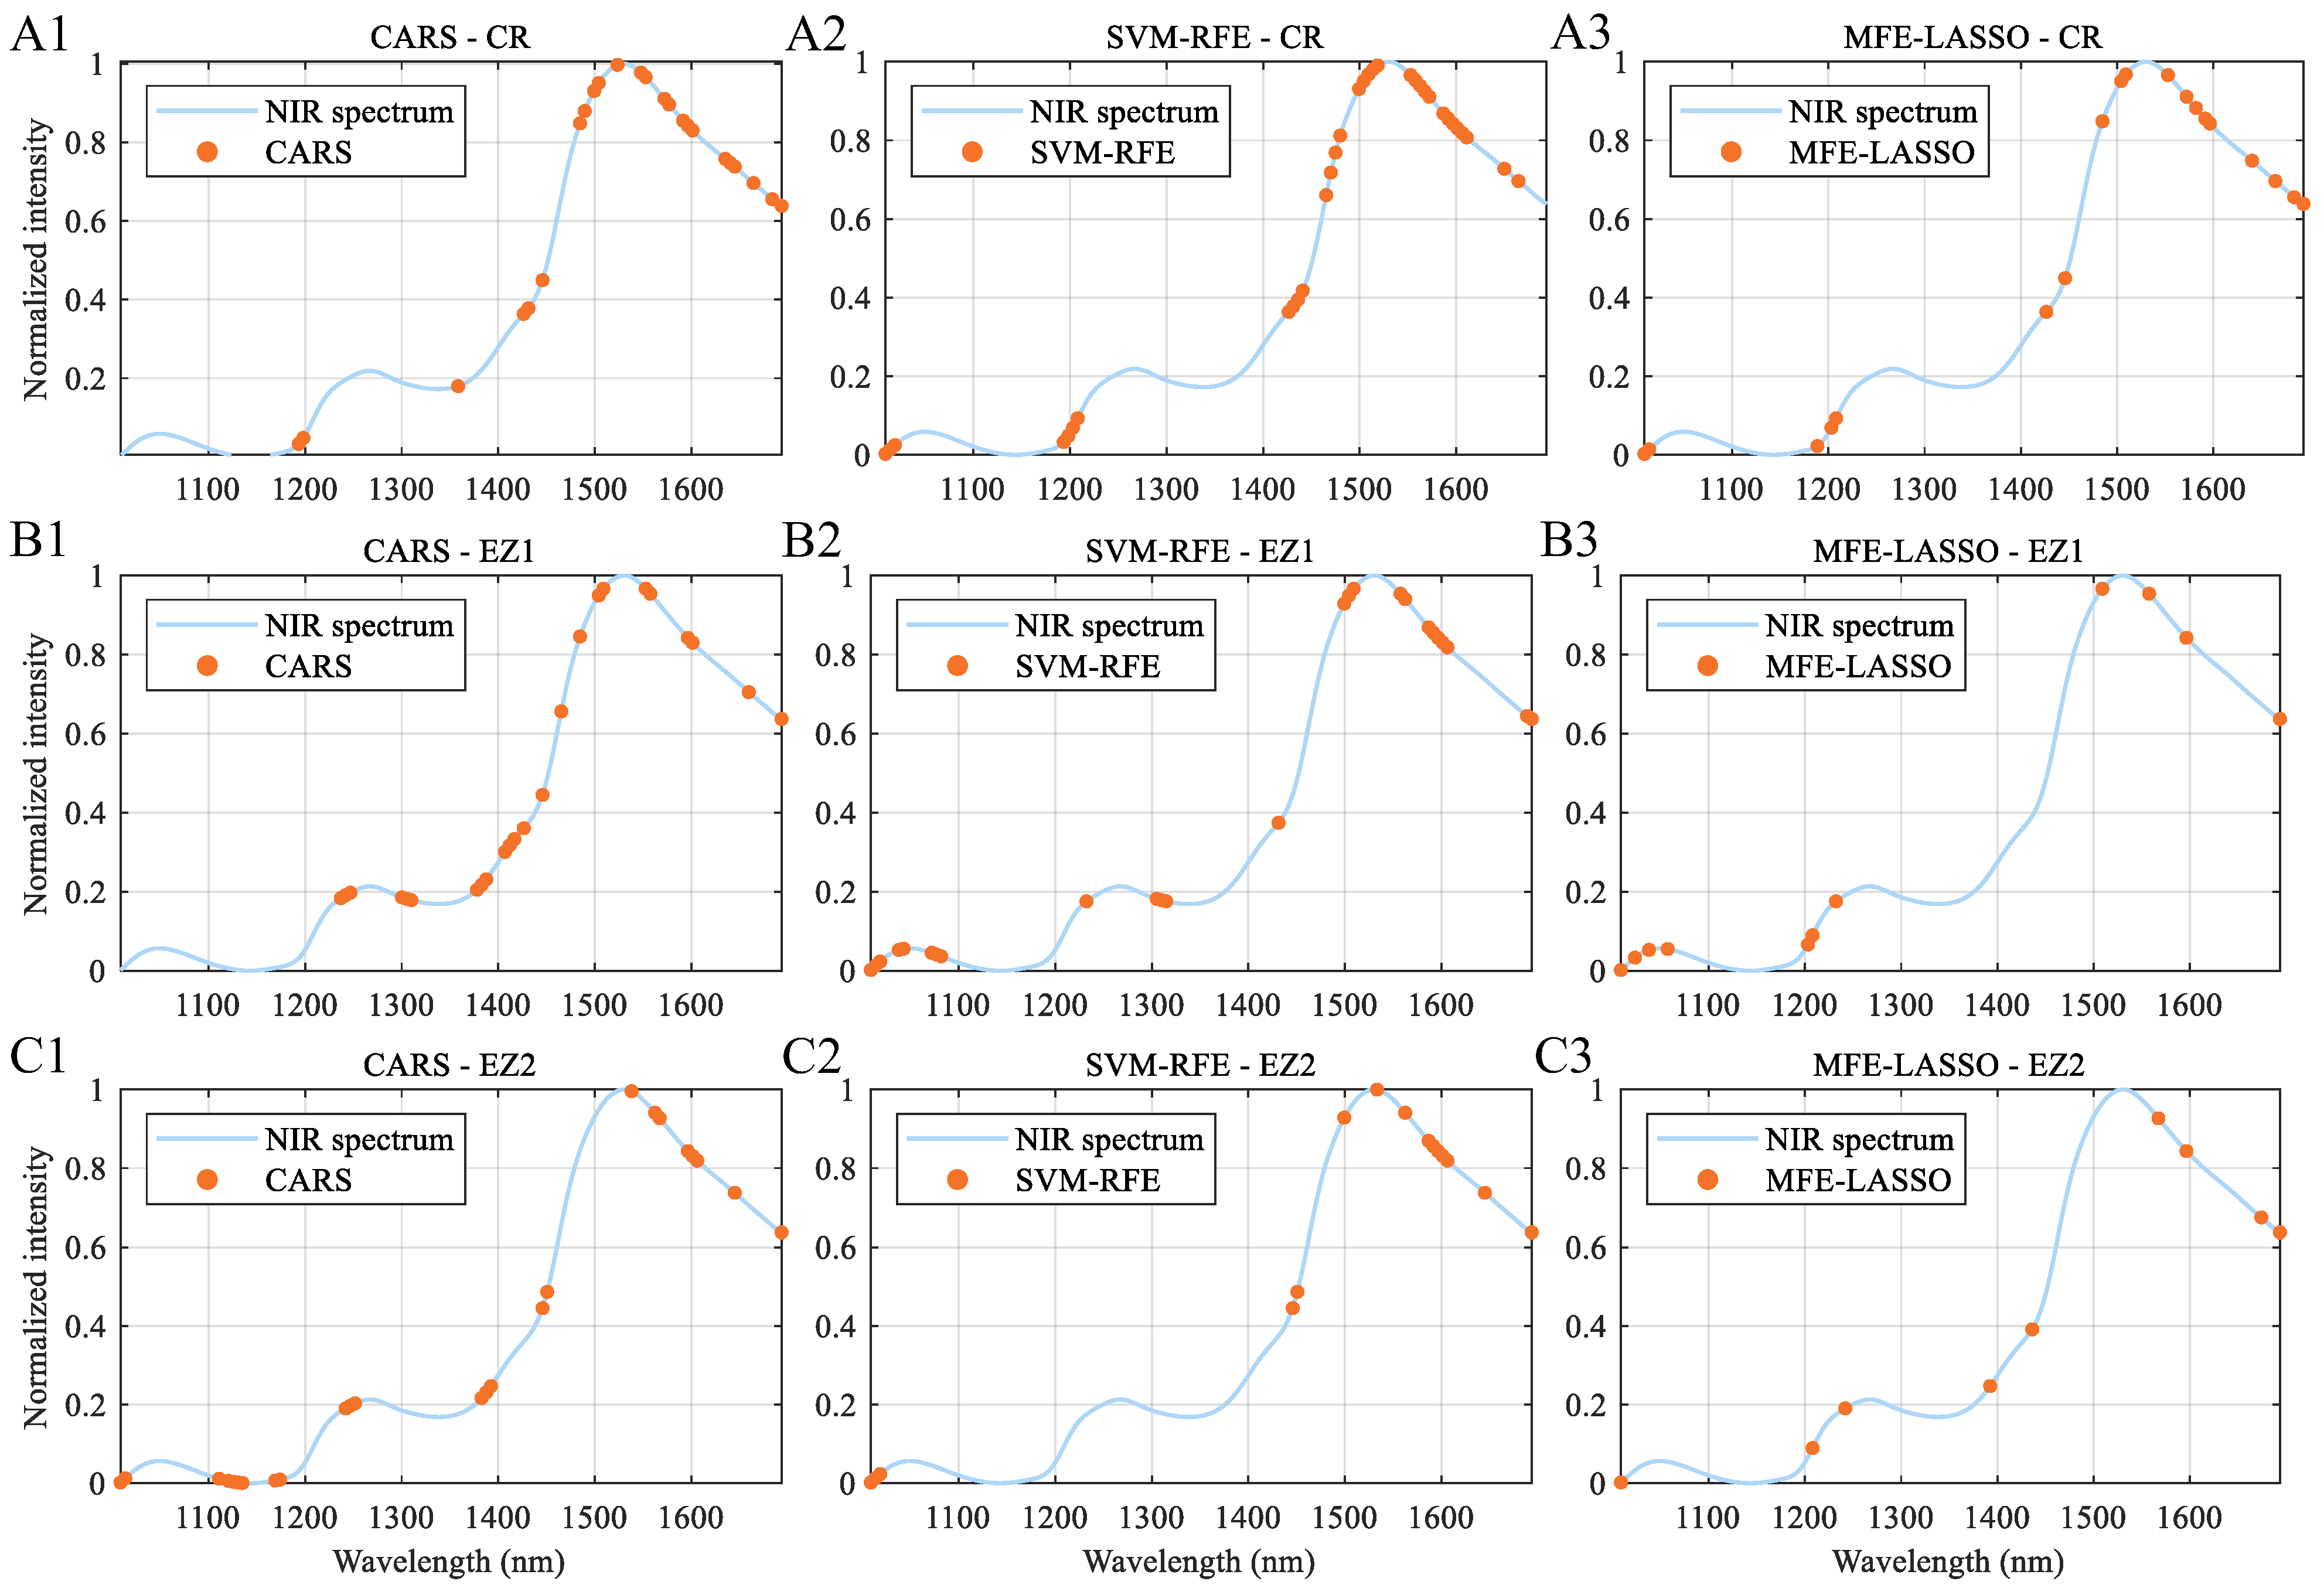
The feature-distribution plots show that the selected wavelengths are concentrated mainly near 1200 nm and within the broad 1450–1600 nm interval (Figure 3). This pattern is consistent with the exploratory spectral analysis, which indicated that bread-type differences were concentrated near 1230 nm and in the 1580–1600 nm region, while the classical 1450 nm water band was more relevant to within-type temporal evolution than to type discrimination. The convergence of the difference spectra, the ANOVA profile, and the selected wavelength regions therefore indicates that the retained variables capture a combination of water-state variation and carbohydrate-related structural change.
The present results indicate that certain spectral intervals are repeatedly informative for bread staling prediction, although a direct one-to-one mechanistic assignment of each selected wavelength to a specific physical process is not yet warranted. The region near 1200 nm is commonly associated with C–H overtone and combination information from carbohydrate-rich matrices, whereas the broad 1400–1500 nm interval is strongly influenced by O–H overtone absorption from water. The 1580–1600 nm region can reflect overlapping carbohydrate and water-structure-related contributions in starch-based foods. A reasonable interpretation is that the selected intervals reflect the coupled evolution of water redistribution and matrix restructuring during storage, with formulation-dependent differences in their relative contributions. This reading is consistent with the broader bread-staling literature, which links bread firming to both starch reorganization and moisture-dependent structural effects rather than to a single isolated marker band [1,6,7,27,38,39,40]. More specific band assignments would require orthogonal measurements on the same samples, such as calorimetric starch-retrogradation assays or water-mobility-sensitive NMR observations.
One plausible explanation for the bread-type dependence of wavelength-selection performance is that enzyme treatment alters the covariance structure of temporally informative spectral regions rather than merely shifting a few peak intensities. When water- and carbohydrate-related intervals remain broadly informative across many resampled subsets, an ensemble-consistency approach such as MFE-LASSO can retain compact variable sets without sacrificing predictive stability. When useful information is concentrated in a narrower or differently ordered subset of wavelengths, CARS or SVM-RFE may become more competitive for a specific bread type, as observed in the EZ1 and EZ2 comparisons.

3.6. Exploratory Spatial Analysis

The position-specific analysis was restricted to CR in order to exclude the influence of enzyme-dependent formulation differences. Consequently, the following spatial observations should not be generalized to EZ1, EZ2, or other enzyme-treated breads without additional validation. Table 4 shows that the middle region achieved the strongest predictive performance, with R P 2 = 0.9904 , RMSEP = 0.68 days, and RPD = 10.27, whereas the top and bottom regions showed RMSEP values of 1.75 and 1.81 days, respectively. These values summarize the leave-one-loaf-out validation results within the CR subset and suggest that the spectral evolution of the crumb center may be more closely coupled to storage day than that of the outer regions under the present CR-only conditions.
Each position-specific subset contained only 36 spectra from 12 loaves. The middle-region model retained 18.0 wavelengths on average, close to the bottom-region count (18.3) and only moderately above the top-region count (12.0); the performance gap therefore cannot be attributed simply to a larger model. The notably high RPD of the middle region (10.27) reflects a subset of only 36 spectra; broader validation across additional loaves and storage conditions would be needed to confirm whether this spatial advantage generalizes.
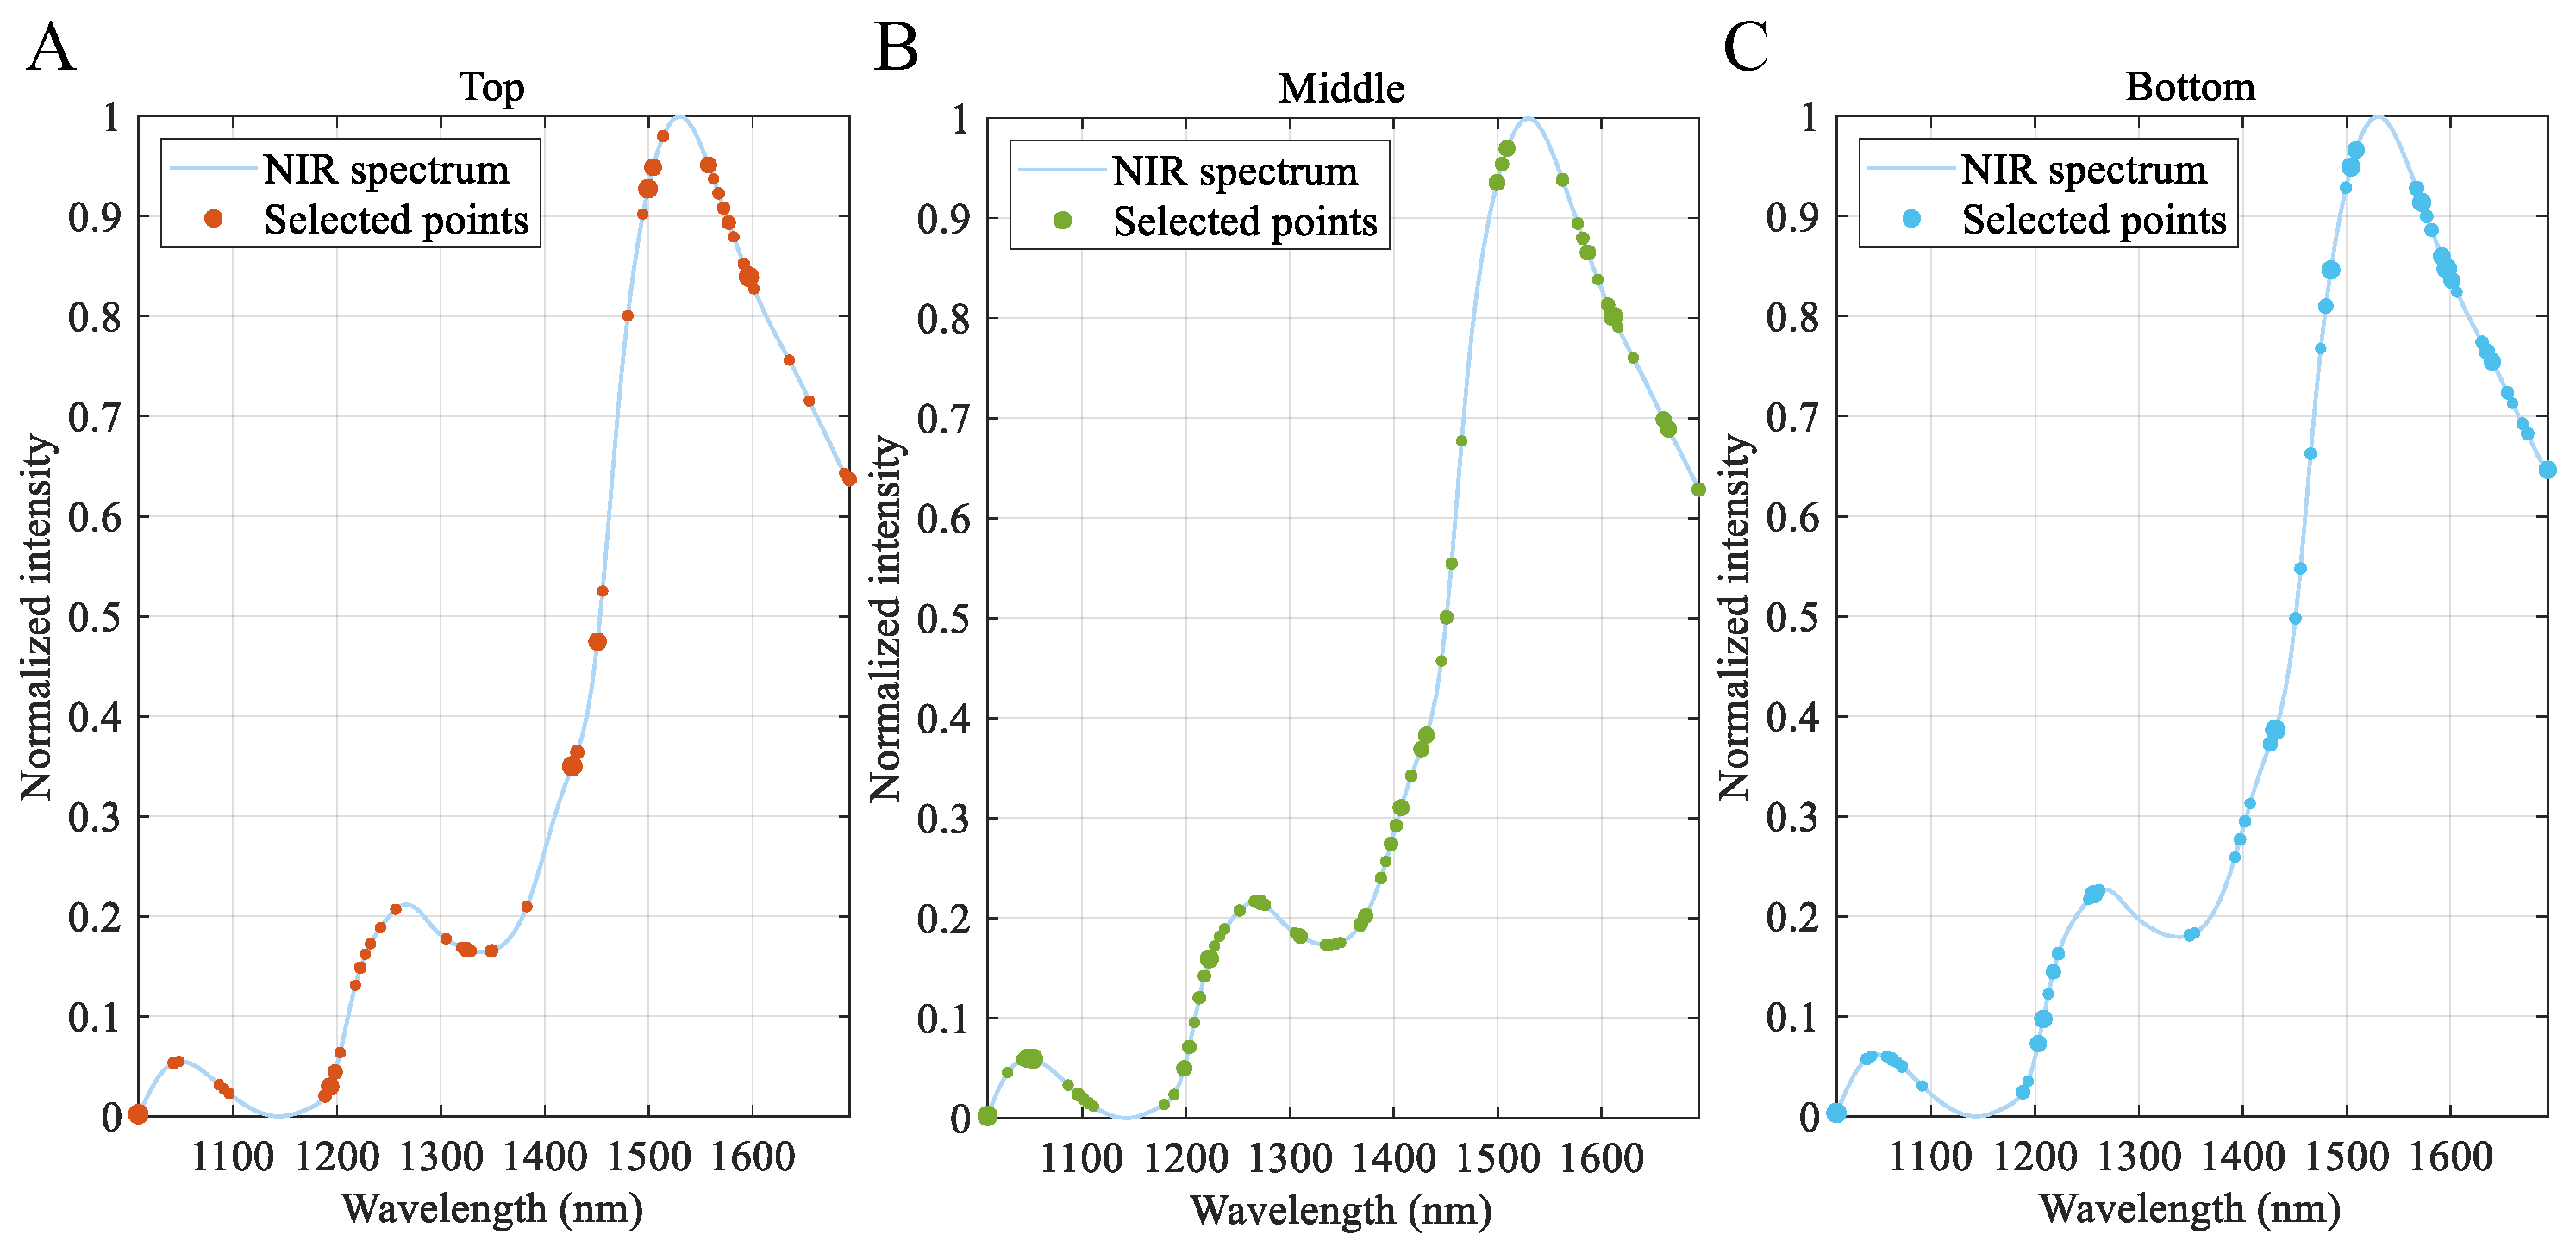
The position–frequency plots indicate that the selected wavelengths for all three positions remain concentrated mainly around the same broad spectral regions identified in the bread-type models, particularly near 1200 nm and within the 1450–1600 nm interval (Figure 4). The middle region shows denser selection within these informative bands, consistent with its lower prediction error. One plausible explanation is that the crumb center undergoes a more spatially coherent water–starch evolution than the outer regions, which are exposed to stronger local moisture gradients. The results indicate that position-dependent spectral differences exist within the CR subset, consistent with prior work in which spatial staling differences are detectable by both mechanical and optical methods yet remain intertwined with moisture gradients, thermal history, and texture-development kinetics [9,10,15,32]. The stronger predictive performance of the middle-region model suggests that crumb-center spectra carry more consistent staling-related information, which may inform the design of spatially targeted SW-NIR sampling strategies in future bread quality assessment. However, because enzyme-treated breads may show different spatial moisture redistribution and matrix-softening behavior, the CR-only position result should be treated as an exploratory sampling-design observation rather than a general conclusion for all formulations.

3.7. Limitations

Several limitations should be acknowledged. First, the present work is based on a single experimental system with 12 loaves per bread type and therefore does not address broader variation in formulation, processing, packaging, or storage environment; extension to other bread recipes or production settings warrants further investigation. Although the loaf-wise split reduces information leakage between calibration and prediction sets, it cannot substitute for validation on independently produced batches, different production campaigns, or industrial storage conditions. Second, the reported RMSEP improvements should be interpreted as descriptive and practically informative within this dataset, rather than as statistically definitive evidence of superiority across all possible bread-staling datasets. Third, the stratified strategy assumes discrete and identifiable bread formulations. In practical deployment, this requirement may be satisfied by production-line metadata or by a preliminary classification model, but it also increases engineering complexity when many formulations must be maintained. Unknown or hybrid formulations would require explicit formulation recognition, model-transfer assessment, or a regression model that incorporates formulation descriptors before routine use. If formulation differences are continuous, ambiguous, or strongly overlapping, a single nonlinear model or a model that includes formulation descriptors as covariates may be more appropriate. Fourth, the position-specific analysis is limited to the CR subset and should be regarded as a hypothesis-generating observation for future validation rather than a comprehensive account of spatial heterogeneity across all bread formulations. Future work should pursue cross-system validation with independently produced batches, evaluate formulation-recognition or model-transfer procedures for unknown samples, and incorporate orthogonal physicochemical measurements to support more specific wavelength interpretation.

4. Conclusions

This study indicates that bread-type-specific SW-NIR spectroscopic sensing can serve as a practical strategy for bread staling prediction within the present experimental setting. A direct comparison between a pooled full-spectrum PLS baseline and bread-type-specific full-spectrum PLS models showed that stratified modeling consistently improved prediction performance, with the largest gains observed for CR and EZ2. This result indicates that formulation-dependent staling kinetics are strong enough to justify separate modeling rather than a single pooled regression under the current dataset conditions. The conclusion is therefore dataset- and deployment-condition dependent: the strategy is most suitable when formulations are known or reliably classifiable and when formulation-dependent staling trajectories are sufficiently distinct.
Within the stratified framework, the comparison among CARS, SVM-RFE, and MFE-LASSO showed that method performance depended on bread type and on whether stability or representative best-model performance was the primary criterion. MFE-LASSO emerged as the most broadly competitive method, combining compact wavelength sets with strong predictive performance for CR and EZ1 while remaining highly competitive for EZ2; CARS, however, produced the strongest representative best-model result for EZ2. The exploratory CR-only position analysis further suggested that the middle region carried stronger staling-related spectral information than the top and bottom regions.
Taken together, these results indicate that SW-NIR-based bread-staling sensing benefits from a hierarchical strategy in which formulation stratification is established first, variable selection is then optimized within each bread type, and spatial heterogeneity is treated as a secondary exploratory component. These findings suggest that formulation-aware SW-NIR modeling can serve as a practical basis for nondestructive quality monitoring of enzyme-modified breads, and the stratified modeling framework demonstrated here provides a transferable approach for spectroscopic quality assessment across formulation-diverse cereal-based products. Future studies should test this framework on independent batches and larger multi-formulation datasets, where nonlinear universal models and formulation-aware linear models can be compared under the same external-validation conditions.

Supplementary Materials

The following supporting information can be downloaded at https://www.mdpi.com/article/10.3390/chemosensors14070151/s1, Table S1: Fifty-run statistics for CARS, SVM-RFE, and MFE-LASSO across CR, EZ1, and EZ2; Figure S1: Supplementary spectral views supporting the main-text description of bread-type similarity in static spectra and divergence in temporal spectral evolution; Figure S2: Supplementary PCA visualizations of the global spectral structure; Figure S3: Wavelength-wise ANOVA profile for type-dependent spectral differences; Figure S4: Supplementary CR position-specific mean-spectrum and residual-spectrum comparisons.

Author Contributions

Conceptualization, S.L.; methodology, S.L., J.S., Y.X. and F.Z.; software, S.L., Y.X. and F.Z.; formal analysis, S.L.; investigation, S.L. and X.S.; data curation, X.S.; writing—original draft preparation, S.L.; writing—review and editing, S.L., J.S., Y.X., F.Z. and X.S.; visualization, S.L. All authors have read and agreed to the published version of the manuscript.

Funding

This research received no external funding.

Institutional Review Board Statement

Not applicable.

Informed Consent Statement

Not applicable.

Data Availability Statement

The bread-staling NIR dataset analyzed in this study is derived from the source data associated with the cited Amigo bread-staling series. The analysis code, processed data tables, and figure source files are available from the corresponding author upon reasonable request.

Acknowledgments

The authors thank the research group of Søren Balling Engelsen at the University of Copenhagen for making the original bread-staling NIR dataset available.

Conflicts of Interest

The authors declare no conflicts of interest.

References

  1. Gray, J.; Bemiller, J. Bread Staling: Molecular Basis and Control. Compr. Rev. Food Sci. Food Saf. 2003, 2, 1–21. [Google Scholar] [CrossRef] [PubMed]
  2. Fadda, C.; Sanguinetti, A.M.; Del Caro, A.; Collar, C.; Piga, A. Bread Staling: Updating the View. Compr. Rev. Food Sci. Food Saf. 2014, 13, 473–492. [Google Scholar] [CrossRef] [PubMed]
  3. Taglieri, I.; Macaluso, M.; Bianchi, A.; Sanmartin, C.; Quartacci, M.F.; Zinnai, A.; Venturi, F. Overcoming bread quality decay concerns: Main issues for bread shelf life as a function of biological leavening agents and different extra ingredients used in formulation. A review. J. Sci. Food Agric. 2021, 101, 1732–1743. [Google Scholar] [CrossRef] [PubMed]
  4. Kulp, K.; Ponte, J.G. Staling of white pan bread: Fundamental causes. CRC Crit. Rev. Food Sci. Nutr. 1981, 15, 1–48. [Google Scholar] [CrossRef]
  5. Russell, P.L. A kinetic study of bread staling by differential scanning calorimetry and compressibility measurements. The effect of different grists. J. Cereal Sci. 1983, 1, 285–296. [Google Scholar] [CrossRef]
  6. Rogers, D.E.; Zeleznak, K.J.; Lai, C.S.; Hoseney, R.C. Effect of native lipids, shortening, and bread moisture on bread firming. Cereal Chem. 1988, 65, 398–401. [Google Scholar]
  7. Aguirre, J.F.; Osella, C.A.; Carrara, C.R.; Sánchez, H.D.; Buera, M.d.P. Effect of storage temperature on starch retrogradation of bread staling. Starch 2011, 63, 587–593. [Google Scholar] [CrossRef]
  8. van Rooyen, J.; Simsek, S.; Oyeyinka, S.A.; Manley, M. Wheat starch structure–function relationship in breadmaking: A review. Compr. Rev. Food Sci. Food Saf. 2023, 22, 2292–2309. [Google Scholar] [CrossRef] [PubMed]
  9. Amigo, J.M.; del Olmo Alvarez, A.; Engelsen, M.M.; Lundkvist, H.; Engelsen, S.B. Staling of white wheat bread crumb and effect of maltogenic α-amylases. Part 1: Spatial distribution and kinetic modeling of hardness and resilience. Food Chem. 2016, 208, 318–325. [Google Scholar] [CrossRef] [PubMed]
  10. Armero, E.; Collar, C. Crumb Firming Kinetics of Wheat Breads with Anti-staling Additives. J. Cereal Sci. 1998, 28, 165–174. [Google Scholar] [CrossRef]
  11. Engelsen, S.; Jensen, M.; Pedersen, H.; Nørgaard, L.; Munck, L. NMR-baking and Multivariate Prediction of Instrumental Texture Parameters in Bread. J. Cereal Sci. 2001, 33, 59–69. [Google Scholar] [CrossRef]
  12. Xie, F.; Dowell, F.E.; Sun, X.S. Comparison of Near-Infrared Reflectance Spectroscopy and Texture Analyzer for Measuring Wheat Bread Changes in Storage. Cereal Chem. 2003, 80, 25–29. [Google Scholar] [CrossRef]
  13. Xie, F.; Dowell, F.E.; Sun, X.S. Using Visible and Near-Infrared Reflectance Spectroscopy and Differential Scanning Calorimetry to Study Starch, Protein, and Temperature Effects on Bread Staling. Cereal Chem. 2004, 81, 249–254. [Google Scholar] [CrossRef]
  14. Sørensen, L. Application of reflectance near infrared spectroscopy for bread analyses. Food Chem. 2009, 113, 1318–1322. [Google Scholar] [CrossRef]
  15. Ringsted, T.; Siesler, H.W.; Engelsen, S.B. Monitoring the staling of wheat bread using 2D MIR-NIR correlation spectroscopy. J. Cereal Sci. 2017, 75, 92–99. [Google Scholar] [CrossRef]
  16. De Géa Neves, M.; Noda, I.; Siesler, H.W. Investigation of bread staling by handheld NIR spectroscopy in tandem with 2D-COS and MCR-ALS analysis. Microchem. J. 2023, 190, 108578. [Google Scholar] [CrossRef]
  17. Zhu, J.; Chen, Y.; Deng, J.; Jiang, H. Improve the accuracy of FT-NIR for determination of zearalenone content in wheat by using the characteristic wavelength optimization algorithm. Spectrochim. Acta Part Mol. Biomol. Spectrosc. 2024, 313, 124169. [Google Scholar] [CrossRef] [PubMed]
  18. Li, L.; Tian, W.; Zhao, Z.; Xiao, Y.; Zhang, Y.; Liu, J.; Govindan, V.; He, Z.; Ibba, M.I. T10SLRE: A novel ensemble learning approach for rapid and non-destructive prediction of bread loaf volume in wheat using NIR spectroscopy. Food Chem. 2025, 496, 146818. [Google Scholar] [CrossRef] [PubMed]
  19. Du, Z.; Tian, W.; Tilley, M.; Wang, D.; Zhang, G.; Li, Y. Quantitative assessment of wheat quality using near-infrared spectroscopy: A comprehensive review. Compr. Rev. Food Sci. Food Saf. 2022, 21, 2956–3009. [Google Scholar] [CrossRef] [PubMed]
  20. Fodor, M.; Matkovits, A.; Benes, E.L.; Jókai, Z. The Role of Near-Infrared Spectroscopy in Food Quality Assurance: A Review of the Past Two Decades. Foods 2024, 13, 3501. [Google Scholar] [CrossRef] [PubMed]
  21. Olakanmi, S.J.; Bharathi, V.S.K.; Jayas, D.S.; Paliwal, J. Innovations in nondestructive assessment of baked products: Current trends and future prospects. Compr. Rev. Food Sci. Food Saf. 2024, 23, e13385. [Google Scholar] [CrossRef] [PubMed]
  22. Li, Q.; Wang, Z.; Wang, M.; Zhao, J.; Tu, K.; Lan, W.; Liu, J.; Pan, L. Next-Generation Optical Imaging and Spectroscopy: AI and Chemometrics in Assessing Authenticity, Nutrition, and Hazard Factors in Cereals. Compr. Rev. Food Sci. Food Saf. 2025, 24, e70248. [Google Scholar] [CrossRef] [PubMed]
  23. Tomar, M.; Bhardwaj, R.; Singh, P.; Kaur, S.; Singh, S.P.; Dahuja, A.; Krishnan, V.; Kansal, R.; Yadav, V.K.; John, R.; et al. From grain to Gain: Bridging conventional methods with chemometric innovations in cereal quality analysis through near-infrared spectroscopy (NIRS). Food Control 2025, 178, 111482. [Google Scholar] [CrossRef]
  24. Feng, Y.; Zhang, X.; Liu, J.; Yuan, Z.; Gao, S.; Shi, J. Advancing food safety and quality assessment: A comprehensive review of non-destructive analytical technologies. Anal. Methods 2025, 17, 4697–4717. [Google Scholar] [CrossRef] [PubMed]
  25. Ban, Y.; Ren, Y.; Dong, W.; Sun, D.W.; Tiwari, B.K. Deep Neural Network Frameworks (DNNFs) for Enhanced Non-destructive Spectroscopic Quantification in Foods: From Hybrid Pipelines to End-to-End Modelling. Trends Food Sci. Technol. 2026, 175, 105834. [Google Scholar] [CrossRef]
  26. Freddi, S.; Bollani, M.; Sangaletti, L. Wine discrimination through an electronic nose based on SWCNTs functionalized with Zn phthalocyanine. Sens. Actuators Chem. 2026, 458, 139753. [Google Scholar] [CrossRef]
  27. Cozzolino, D.; Degner, S.; Eglinton, J. A Review on the Role of Vibrational Spectroscopy as An Analytical Method to Measure Starch Biochemical and Biophysical Properties in Cereals and Starchy Foods. Foods 2014, 3, 605–621. [Google Scholar] [CrossRef] [PubMed]
  28. Li, H.; Liang, Y.; Xu, Q.; Cao, D. Key wavelengths screening using competitive adaptive reweighted sampling method for multivariate calibration. Anal. Chim. Acta 2009, 648, 77–84. [Google Scholar] [CrossRef] [PubMed]
  29. Guyon, I.; Weston, J.; Barnhill, S.; Vapnik, V. Gene selection for cancer classification using support vector machines. Mach. Learn. 2002, 46, 389–422. [Google Scholar] [CrossRef]
  30. Li, H.; Wu, P.; Dai, J.; Zou, X. A Monte Carlo resampling based multiple feature-spaces ensemble (MFE) strategy for consistency-enhanced spectral variable selection. Anal. Chim. Acta 2023, 1279, 341782. [Google Scholar] [CrossRef] [PubMed]
  31. Amigo, J.M.; del Olmo, A.; Engelsen, M.M.; Lundkvist, H.; Engelsen, S.B. Staling of white wheat bread crumb and effect of maltogenic α-amylases. Part 2: Monitoring the staling process by using near infrared spectroscopy and chemometrics. Food Chem. 2019, 297, 124946. [Google Scholar] [CrossRef] [PubMed]
  32. Amigo, J.M.; del Olmo, A.; Engelsen, M.M.; Lundkvist, H.; Engelsen, S.B. Staling of white wheat bread crumb and effect of maltogenic α-amylases. Part 3: Spatial evolution of bread staling with time by near infrared hyperspectral imaging. Food Chem. 2021, 353, 129478. [Google Scholar] [CrossRef] [PubMed]
  33. Barnes, R.J.; Dhanoa, M.S.; Lister, S.J. Standard Normal Variate Transformation and De-Trending of Near-Infrared Diffuse Reflectance Spectra. Appl. Spectrosc. 1989, 43, 772–777. [Google Scholar] [CrossRef]
  34. Rinnan, Å.; van den Berg, F.; Engelsen, S.B. Review of the most common pre-processing techniques for near-infrared spectra. Trac Trends Anal. Chem. 2009, 28, 1201–1222. [Google Scholar] [CrossRef]
  35. Mei, C.; Lu, S.; Zhou, X.; Meng, F.; Jiang, H. Rapid and Accurate Quantification Detection of BHT in Edible Oils Using Raman Spectroscopy Combined with Chemometric Models. Foods 2026, 15, 730. [Google Scholar] [CrossRef] [PubMed]
  36. Wold, S.; Sjöström, M.; Eriksson, L. PLS-regression: A basic tool of chemometrics. Chemom. Intell. Lab. Syst. 2001, 58, 109–130. [Google Scholar] [CrossRef]
  37. Ezenarro, J.; Schorn-Garcia, D. How Are Chemometric Models Validated? A Systematic Review of Linear Regression Models for NIRS Data in Food Analysis. J. Chemom. 2025, 39, e70036. [Google Scholar] [CrossRef]
  38. Curti, E.; Bubici, S.; Carini, E.; Baroni, S.; Vittadini, E. Water molecular dynamics during bread staling by Nuclear Magnetic Resonance. LWT–Food Sci. Technol. 2011, 44, 854–859. [Google Scholar] [CrossRef]
  39. Curti, E.; Carini, E.; Cobo, M.; Bocher, T.; Vittadini, E. The use of two-dimensional NMR relaxometry in bread staling: A valuable tool? Food Chem. 2017, 237, 766–772. [Google Scholar] [CrossRef] [PubMed]
  40. Kim-Shin, M.S.; Mari, F.; Rao, P.A.; Stengle, T.R.; Chinachoti, P. Oxygen-17 nuclear magnetic resonance studies of water mobility during bread staling. J. Agric. Food Chem. 1991, 39, 1915–1920. [Google Scholar] [CrossRef]
Figure 1. SW -NIR spectra of the 324 bread samples before and after preprocessing. (A) Raw spectra; (B) SNV+SG preprocessed spectra. Preprocessing reduces scatter-related baseline differences while preserving the major absorption structure used for subsequent modeling.
Chemosensors 14 00151 g001
Figure 2. Run-to-run RMSECV variation across 50 repeated runs. Rows (AC) correspond to CR, EZ1, and EZ2, respectively; columns (13) correspond to CARS, SVM-RFE, and MFE-LASSO, respectively.
Chemosensors 14 00151 g002
Figure 3. Distribution of representative selected wavelength positions in the spectrum. Rows (AC) correspond to CR, EZ1, and EZ2, respectively; columns (13) correspond to CARS, SVM-RFE, and MFE-LASSO, respectively. Feature sets correspond to the representative best-model instance for each bread-type and method combination.
Chemosensors 14 00151 g003
Figure 4. Wavelength-selection frequency map for the CR position-specific models. (A) Top region; (B) middle region; (C) bottom region.
Chemosensors 14 00151 g004
Table 1. Loaf -wise calibration and prediction split structure, including subset-wise storage-day summaries.
Bread TypeSubsetNLoavesStorage Day (Mean ± SD)
CRCalibration819 10.22 ± 6.87
CRPrediction273 7.33 ± 5.41
EZ1Calibration819 10.22 ± 6.87
EZ1Prediction273 7.33 ± 5.41
EZ2Calibration819 10.22 ± 6.87
EZ2Prediction273 7.33 ± 5.41
Table 2. Comparison between the pooled global full-spectrum PLS model and the bread-type-specific full-spectrum PLS models.
ModelScope R C 2 RMSEC R P 2 RMSEPRPD
Global Full-PLSAll0.91961.940.81522.282.34
Global Full-PLSCR0.91961.940.83132.182.48
Global Full-PLSEZ10.91961.940.82402.232.43
Global Full-PLSEZ20.91961.940.79022.432.22
Stratified Full-PLSCR0.97161.150.87771.862.91
Stratified Full-PLSEZ10.97771.020.83762.142.53
Stratified Full-PLSEZ20.94551.590.83632.152.52
Table 3. Representative best-model comparison among full-spectrum PLS, CARS-PLS, SVM-RFE-PLS, and MFE-LASSO-PLS.
Bread TypeModelnVAR R C 2 RMSEC R P 2 RMSEPRPD
CRPLS1420.97161.150.87771.862.91
CRCARS-PLS240.97980.970.86591.952.78
CRSVM-RFE-PLS330.97031.180.87691.862.90
CRMFE-LASSO-PLS190.97801.010.90851.713.35
EZ1PLS1420.97771.020.83762.142.53
EZ1CARS-PLS240.97900.990.77992.492.17
EZ1SVM-RFE-PLS250.96601.260.88671.793.03
EZ1MFE-LASSO-PLS110.97980.970.93831.434.08
EZ2PLS1420.94551.590.83632.152.52
EZ2CARS-PLS250.95831.390.85892.002.71
EZ2SVM-RFE-PLS150.91521.990.61273.311.64
EZ2MFE-LASSO-PLS90.94071.660.87512.072.87
Table 4. Exploratory CR-only position-specific prediction performance.
PositionnVAR R P 2 RMSEPRPD
Top12.00.93621.753.98
Middle18.00.99040.6810.27
Bottom18.30.93201.813.85
Disclaimer/Publisher’s Note: The statements, opinions and data contained in all publications are solely those of the individual author(s) and contributor(s) and not of MDPI and/or the editor(s). MDPI and/or the editor(s) disclaim responsibility for any injury to people or property resulting from any ideas, methods, instructions or products referred to in the content.