Article

Electrochemical Sensor Based on a Fe3O4 and Graphene Composite for the Detection of Myristicin


1
Chemistry Science Doctoral Program, Department of Chemistry, Faculty of Mathematics and Natural Sciences, IPB University, Bogor 16680, Indonesia
2
Department of Chemistry, Faculty of Mathematics and Natural Sciences, IPB University, Bogor 16680, Indonesia
3
Tropical Biopharmaca Research Center, International Research Institute of Food, Nutrition, and Health, IPB University, Bogor 16680, Indonesia
4
Research Center for Nanotechnology System, National Research and Innovation Agency (BRIN), South Tangerang 15315, Indonesia
5
School of Data Science, Mathematics, and Informatics, IPB University, Bogor 16680, Indonesia
*
Authors to whom correspondence should be addressed.
Chemosensors 2026, 14(2), 36; https://doi.org/10.3390/chemosensors14020036
Submission received: 13 December 2025 / Revised: 24 January 2026 / Accepted: 27 January 2026 / Published: 2 February 2026

Abstract

This study aims to develop an electrochemical sensor based on a glassy carbon electrode (GCE) modified with Fe3O4 and graphene for the detection of myristicin as a characteristic compound in nutmeg plants. Electrode modification materials were prepared from a combination of graphene and magnetite, synthesized via a hydrothermal method, and further characterized using X-ray diffraction (XRD), scanning electron microscope–energy dispersive spectroscopy (SEM-EDS), and transmission electron microscopy (TEM). The two modifying materials were then optimized, and the optimum conditions were obtained at a w/w ratio of 1:2, which was applied to the GCE surface using the drop-casting technique. The electrochemical performance of the Fe3O4/graphene-modified electrode was evaluated under optimum experimental conditions using a Britton–Robinson buffer solution at pH 5. The scan-rate analysis of the electrode to evaluate its electrochemical performance showed an increase in surface area from 0.101 cm2 for the bare GCE to 0.534 cm2 for the GCE/Fe3O4–graphene. Electroanalytical performance was evaluated using differential pulse voltammetry (DPV), which showed a linear response over the concentration range of 1–100 µM, with a limit of detection of 0.19 µM and a limit of quantitation of 0.58 µM. The developed electrode was applied successfully to detect myristicin in nutmeg seed extract samples, and its calculated concentrations were not significantly different from those obtained with the GC-MS method. These results suggest that the developed sensor may have further potential as an alternative detection tool for characterizing electroactive compounds in nutmeg plants.

1. Introduction

Spices are an integral part of human nutrition, medicine, and industry; they not only function as flavor enhancers but also as sources of bioactive compounds with significant pharmacological properties. Among them, nutmeg (Myristica fragans Houtt.) has received widespread attention due to its rich phytochemical profile, especially myristicin, as well as various biological properties, such as antibacterial and anti-inflammatory [1], antiplaque [2], anticancer [3], antiangiogenic [4], insomnia alleviation [5], and antirheumatic [6] effects. Myristicin (1,3-Benzodioxole or 4-methoxy-6-(2-propenyl)) is a characteristic compound that imparts the nutmeg plant with its distinctive aroma, and the reliable quantification of myristicin is increasingly in demand for food authentication, nutraceutical development, and quality control.
Conventional methods for myristicin analysis, such as high-performance liquid chromatography (HPLC) [7,8], gas chromatography [9], mass spectrometry [8], and spectrophotometry [10], offer high sensitivity and selectivity but are often limited by instrument cost, time-consuming sample preparation, and the lack of portability. As an alternative, electrochemical sensors have emerged as powerful analytical tools due to their simplicity, high sensitivity [11,12], cost-effectiveness [13], and potential for miniaturization and field application [14]. Glassy carbon electrodes (GCEs), in particular, are one of the most popular sensing platforms for the development of electrochemical sensors due to their wide potential window, low background current, and ease of surface modification [15]. However, the sensitivity of unmodified electrodes (bare GCEs) is low, and their surface needs to be modified with conductive and catalytic materials to enhance their conductivity. Therefore, it is essential to develop a strategy to improve the analytical performance of GCEs as sensing platforms for the detection of naturally occurring compounds—particularly myristicin—in nutmeg samples.
Electrode modification strategies strongly influence the performance of electrochemical sensors. Recent studies have shown that the addition of nanomaterials such as graphene [16] and metal oxides [17] can drastically improve electrode properties by increasing the electron-transfer rates [18], surface area [19], and electrocatalytic sites [20]. Graphene, a two-dimensional carbon material, has a large surface area and offers exceptional electrical conductivity and mechanical stability, making it an ideal material for electrochemical applications [21]. Magnetite (Fe3O4), on the other hand, is a biocompatible transition metal oxide with unique redox activity and strong adsorption capacity [22]. The combination of magnetite and graphene has attracted considerable interest due to its synergistic effect, with graphene providing conductivity and structural support [23] and magnetite contributing to the electrocatalytic activity and analyte adsorption [24].
In this study, we report the fabrication of a novel Fe3O4–graphene-modified glassy carbon electrode (GCE/Fe3O4–graphene) for the electrochemical detection of myristicin in real samples, particularly nutmeg seed extract. Even though the Fe3O4–graphene composite has been widely utilized as a material platform for various electrochemical sensors, it has not been reported for myristicin detection. This work demonstrates the synergistic interaction between conductive carbon nanomaterials and metal oxides with electrocatalytic properties, whose composite could serve as a sensing platform for the detection of myristicin in real nutmeg samples. The hybrid nanocomposite was synthesized via a hydrothermal method and thoroughly characterized using different advanced instrumentation techniques to confirm its structural and morphological features. Subsequently, a GCE modified with the Fe3O4–graphene composite at the optimal composition ratio was employed to investigate the electrochemical behavior and electroanalytical performance in detecting myristicin in buffer solution and in nutmeg extract.

2. Materials and Methods

2.1. Materials

The reagents used in this study included FeCl3·6H2O (CAS 10025-77-1), sodium citrate (CAS 6132-04-3), urea (CAS 57-13-6), ethanol (≥99.8%, analytical grade), hexane (≥99%, analytical grade), KCl (CAS 7447-40-7), K3Fe(CN)6 (CAS 13746-66-2), myristicin (CAS 900561; 98%), safrole (CAS 94-59-7; ≥97%), dopamine (CAS 645-31-8; 98%), thiamine (CAS 67-03-8; ≥98%), ascorbic acid (CAS 50-81-7), o-phosphoric acid (CAS 7664-38-2; 85%), boric acid (CAS 10043-35-3; 99.5%), acetic acid (64-19-7; 100%), and NaOH (CAS 1310-73-2), which were obtained from Sigma Aldrich, St. Louis, MO, USA. All experiments were performed using distilled water as the solvent for electrochemical measurements. Myristicin was obtained from the extraction of nutmeg seeds by the maceration method using ethanol solvent (analytical grade) [25] from nutmeg seeds from Siau Island, Sitaro Regency, North Sulawesi, Indonesia.

2.2. Instruments

All electrochemical experiments were performed using a PalmSens Emstat3+ (PalmSens BV, Houten, The Netherlands) equipped with a three-electrode system. The instrument comprised a glassy carbon electrode (GCE, 3 mm diameter) from IJ Cambria Scientific, an Ag/AgCl reference electrode, and a platinum wire as the auxiliary electrode. All electrochemical experiments were performed using standard laboratory apparatus, including Pyrex glassware, an analytical balance, and micropipettes, for solution preparation at an ambient temperature. In addition, the crystal structure of Fe3O4 and the Fe3O4–graphene composite was characterized using XRD SmartLab Rigaku. Meanwhile, the morphology of Fe3O4 and the Fe3O4–graphene composite was characterized using SEM-EDS (Hitachi SU3500, Japan,Tokyo) and TEM (Tecnai G2 20S-Twin, Waltham, MA, USA). The elemental composition of the Fe3O4–graphene composite was characterized using XPS Kratos AXIS SUPRA PLUS/ESCA.

2.3. Synthesis of Fe3O4 (Magnetite)

A total of 2.703 g of FeCl3.6H2O (10 mmol/0.05 M), 5.882 g of sodium citrate (20 mmol/0.10 M), and 1.802 g of urea (30 mmol/0.15 M) were dissolved in 200 mL of ultrapure water and stirred until completely dissolved. The resulting homogeneous mixture was placed in a Teflon hydrothermal container and tightly sealed. The apparatus was placed in an oven at 200 °C for 12 h. The resulting black precipitate was separated with a magnet, washed with water and ethanol, and then dried in an oven at 60 °C for 12 h [25].

2.4. Evaluation of the Electrochemical Behavior of GCEs with Fe3O4, Graphene, and Fe3O4–Graphene Composite Modifiers

The electrochemical performance of GCEs with Fe3O4, graphene, and Fe3O4–graphene composite modifiers was systematically evaluated using the differential pulse voltammetry (DPV) technique. The effect of the Fe3O4 and graphene modifiers was investigated by preparing each modifier in concentrations of 0.5 mg/mL, 1 mg/mL, 2 mg/mL, and 3 mg/mL. The effect of the Fe3O4–graphene composite’s composition was further investigated by varying the w/w ratio of Fe3O4 to graphene (1:1; 1:2, and 1:3) for the electrochemical detection of 2.7 × 10⁻⁴ M myristicin in a 0.1 M Britton–Robinson buffer (BRB) solution (pH 7.0). DPV was conducted to quantitatively measure myristicin, with measurements in the potential range of 0.4 V to +1.2 V (vs. an Ag/AgCl reference electrode) under optimized conditions comprising a scan rate of 50 mV s−1, a potential step of 10 mV, a pulse amplitude of 50 mV, and a frequency of 50 Hz. All experiments were conducted in triplicate.

2.5. Investigation of the Effect of the Optimum pH on the Electrochemical Behavior of the Fe3O4–Graphene-Modified GCE

pH optimization was performed by preparing Britton–Robinson buffer solutions at pH 4, 5, 6, 7, and 8. Myristicin was dissolved in the BRB to obtain a concentration of 2.7 × 10⁻⁴ M at five different pH values. Measurements were carried out using the DPV technique with the same electrochemical parameters as those used for the optimization of the various modifiers. All experiments were performed in triplicate.

2.6. Evaluation of the Electroanalytical Performance of the Fe3O4–Graphene-Modified GCE

The analytical performance of the Fe3O4–graphene-modified GCE was investigated with respect to linearity, the limit of detection (LOD), the limit of quantification (LOQ), repeatability, sensitivity, stability, selectivity, and actual sample analysis. All DPV measurements were performed using the same electrochemical parameters as those reported for the optimized modifier. All experiments were performed in triplicate.

3. Results and Discussion

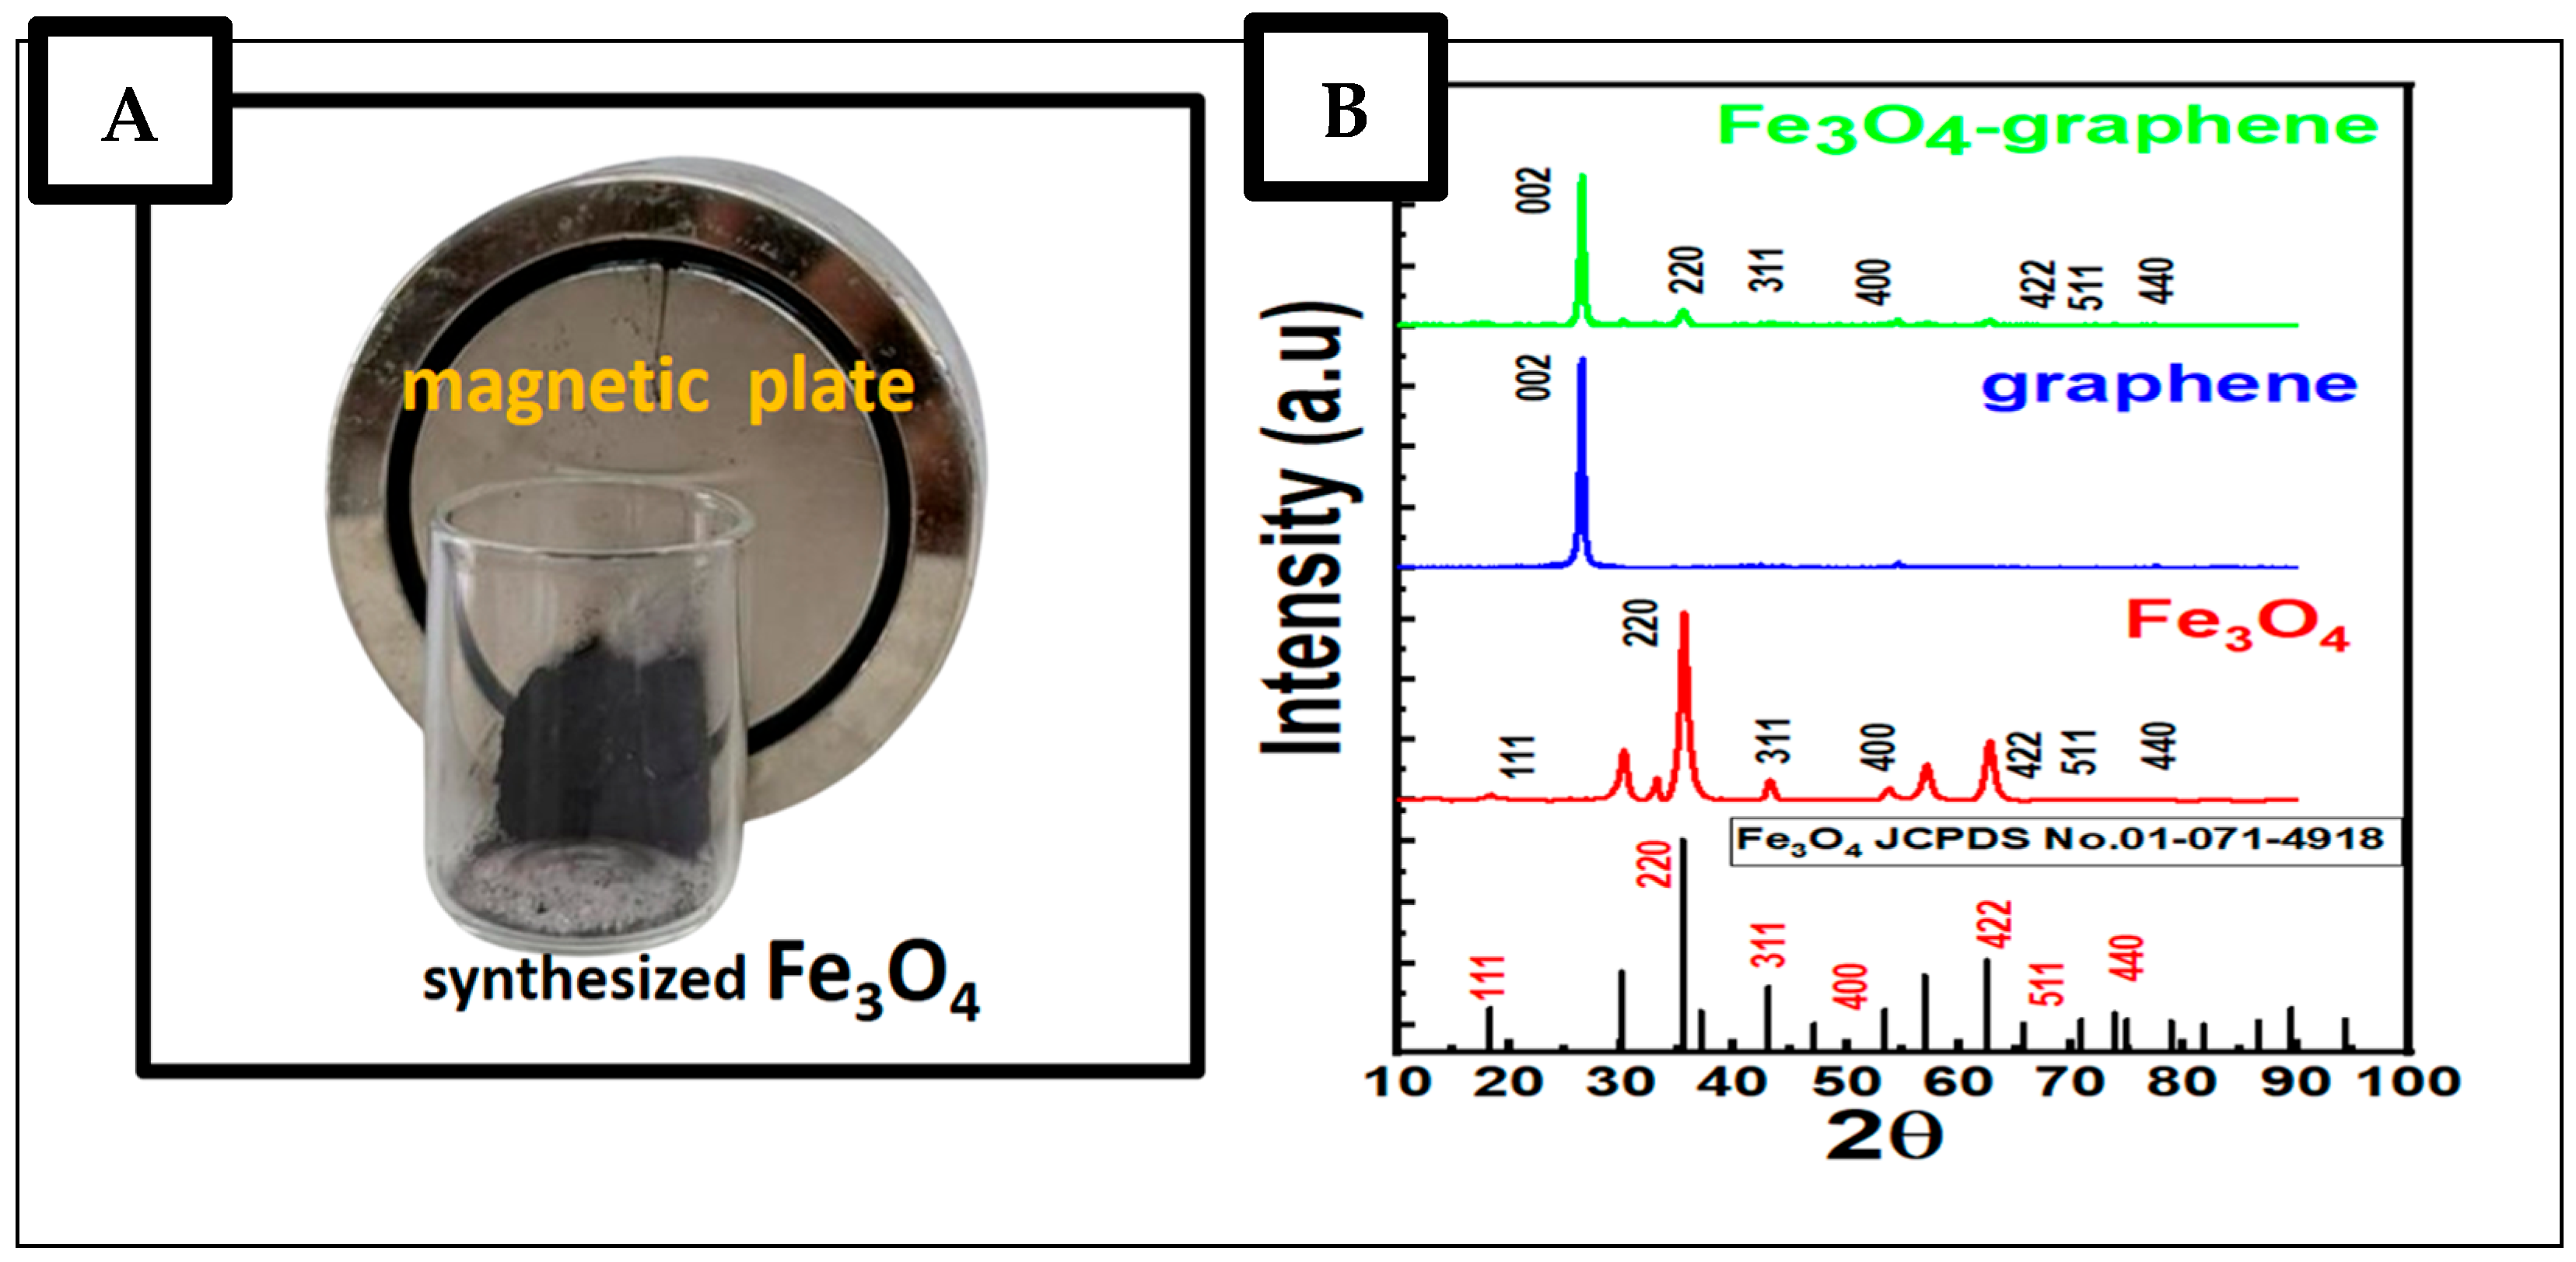
The synthesized Fe3O4 precipitate was black in color, as shown in Figure 1A, and was attracted to the magnetic plate. The synthesized Fe3O4 was further characterized using XRD, SEM, TEM, and XPS to investigate its morphological and structural properties.

3.1. X-Ray Diffraction Analysis

Figure 1 shows the XRD pattern of the synthesized Fe3O4, evidencing clear diffraction peaks located at 2θ ≈ 18.1°, 30.1°, 35.5°, 43.2°, 53.5°, 57.0°, and 62.6°, which can be indexed to the (111), (220), (311), (400), (422), (511), and (440) planes of the cubic spinel structure of magnetite (JCPDS card no. 01-071-4918), thus confirming its high crystallinity. Additionally, graphene (Figure 1) exhibits a characteristic peak on the (002) plane at around 26.5°. The peaks shown for the Fe3O4–graphene composite are (002), (220), (311), (400), (422), (511), and 440 [26], which can be located at 2θ ≈ 26.5°, 30.1°, 35.5°, 43.2°, 53.5°, 57.0°, and 62.6°, respectively. These peaks can be attributed to the amorphous nature of the graphene layer, which obscures the weaker Fe3O4 reflections [26]. Furthermore, the homogeneous dispersion of Fe3O4 on the graphene sheet leads to a reduction in the XRD peak intensity as a result of the smaller crystallite size and lattice strain [27], facilitating the successful formation of a composite structure. These structural features of the Fe3O4–graphene composite are expected to enhance electrical conductivity, surface area, and structural stability, thus providing a strong foundation for improving the electrochemical and analytical performance of the hybrid materials compared to individual Fe3O4 and graphene [28].

3.2. SEM-EDS Analysis

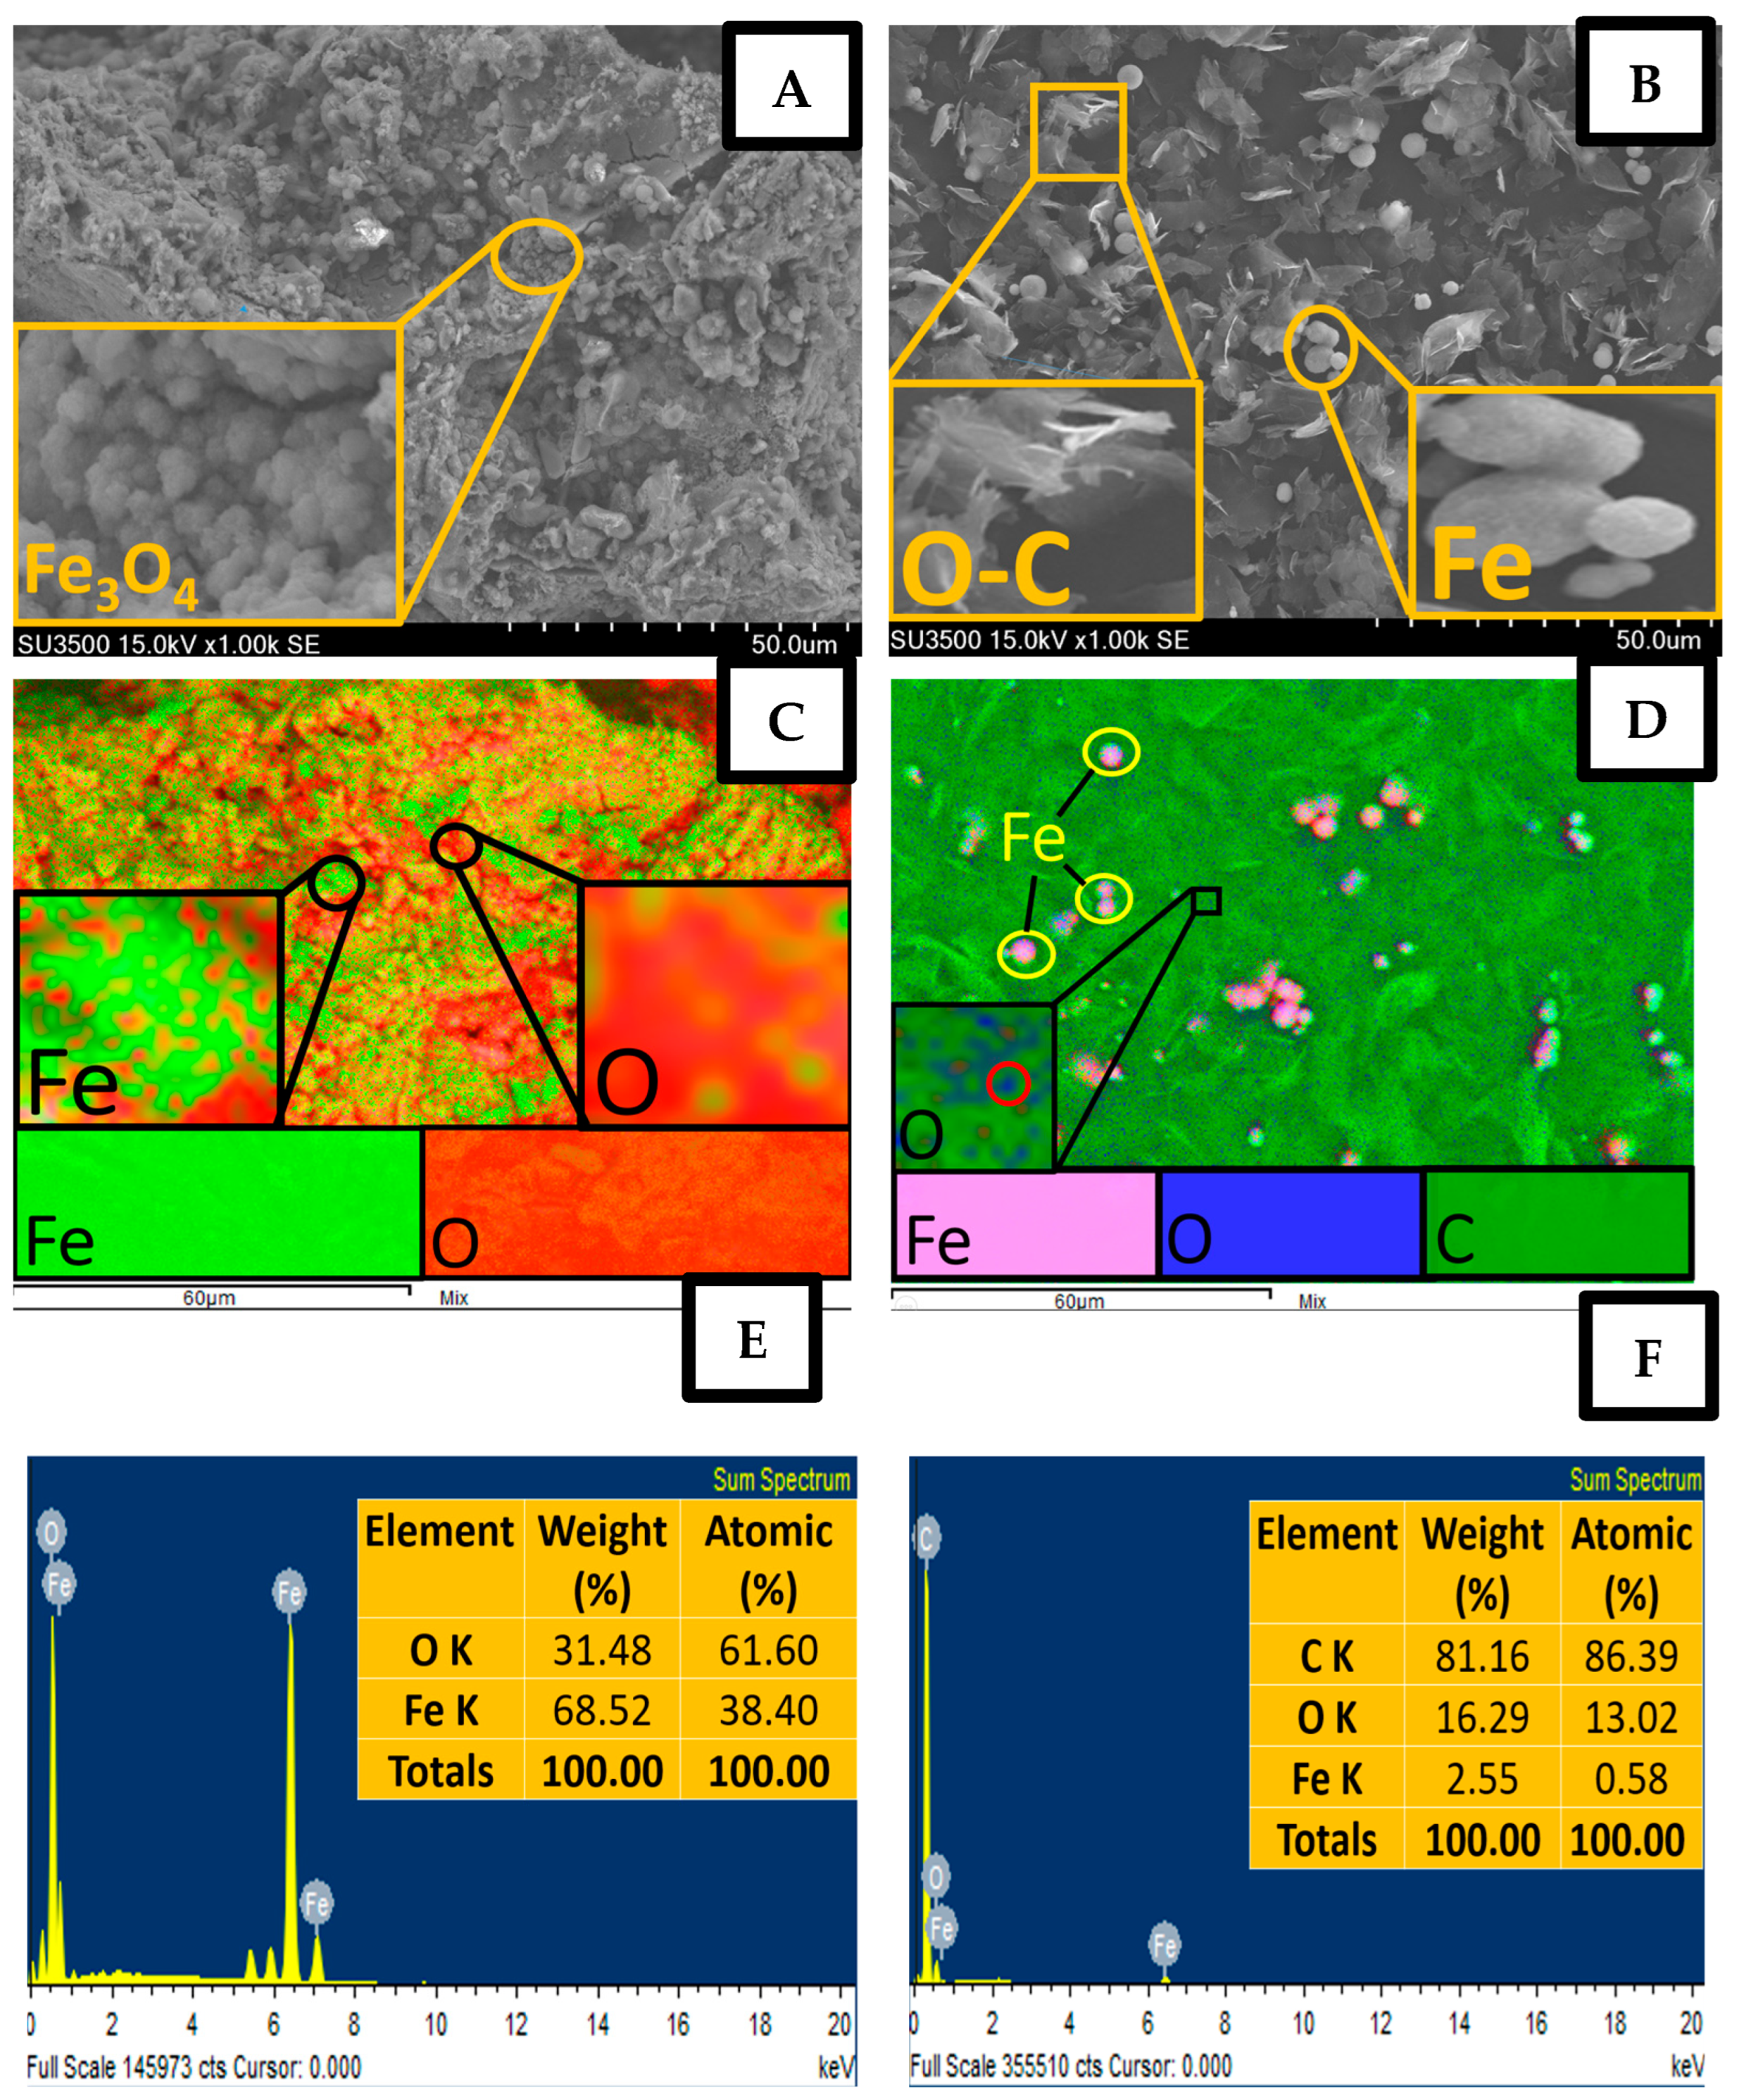
From the SEM images of surface morphology, the synthesized Fe3O4 nanoparticles exhibit minimal aggregation, a characteristic of magnetite nanoparticles synthesized via the hydrothermal method. The spherical Fe3O4 nanoparticles are uniformly distributed (Figure 2A).
The SEM micrographs of the Fe3O4–graphene composites show that the Fe3O4 nanoparticles are uniformly anchored on the surface of the wrinkled and layered graphene sheets (Figure 2B). The graphene network acts as a supporting matrix, effectively preventing particle agglomeration and increasing the surface contact area. The energy dispersive spectroscopy (EDS) elemental mapping distribution of pure Fe3O4 confirmed (Figure 2C) the presence of Fe and O elements with an atomic ratio close to the theoretical stoichiometry of Fe:O = 3:4. Elemental analysis of the Fe3O4 nanoparticles was also conducted by EDS and confirmed the presence of O and Fe at 61.6% and 38.40%, respectively, as shown in Figure 2E. No other elements were detected, indicating the high purity of the synthesized nanomagnetite. In the Fe3O4–graphene composites, EDS analysis also revealed a strong carbon peak consistent with the graphene structure, along with Fe and O signals from magnetite (Figure 2D). EDS mapping further verified the homogeneous distribution of Fe, O, and C elements, confirming the successful integration of Fe3O4 nanoparticles into the graphene sheets. The EDS spectrum shows strong evidence that the Fe3O4–graphene composite was successfully synthesized (Figure 2F), confirmed by the presence of C, O, and Fe at 86.39%, 13.02%, and 0.58%, respectively. These percentages indicate that the combination between Fe3O4 and graphene increases the surface area and high conductivity of the nanocomposite, making it useful for electrochemical applications [29].

3.3. TEM Analysis

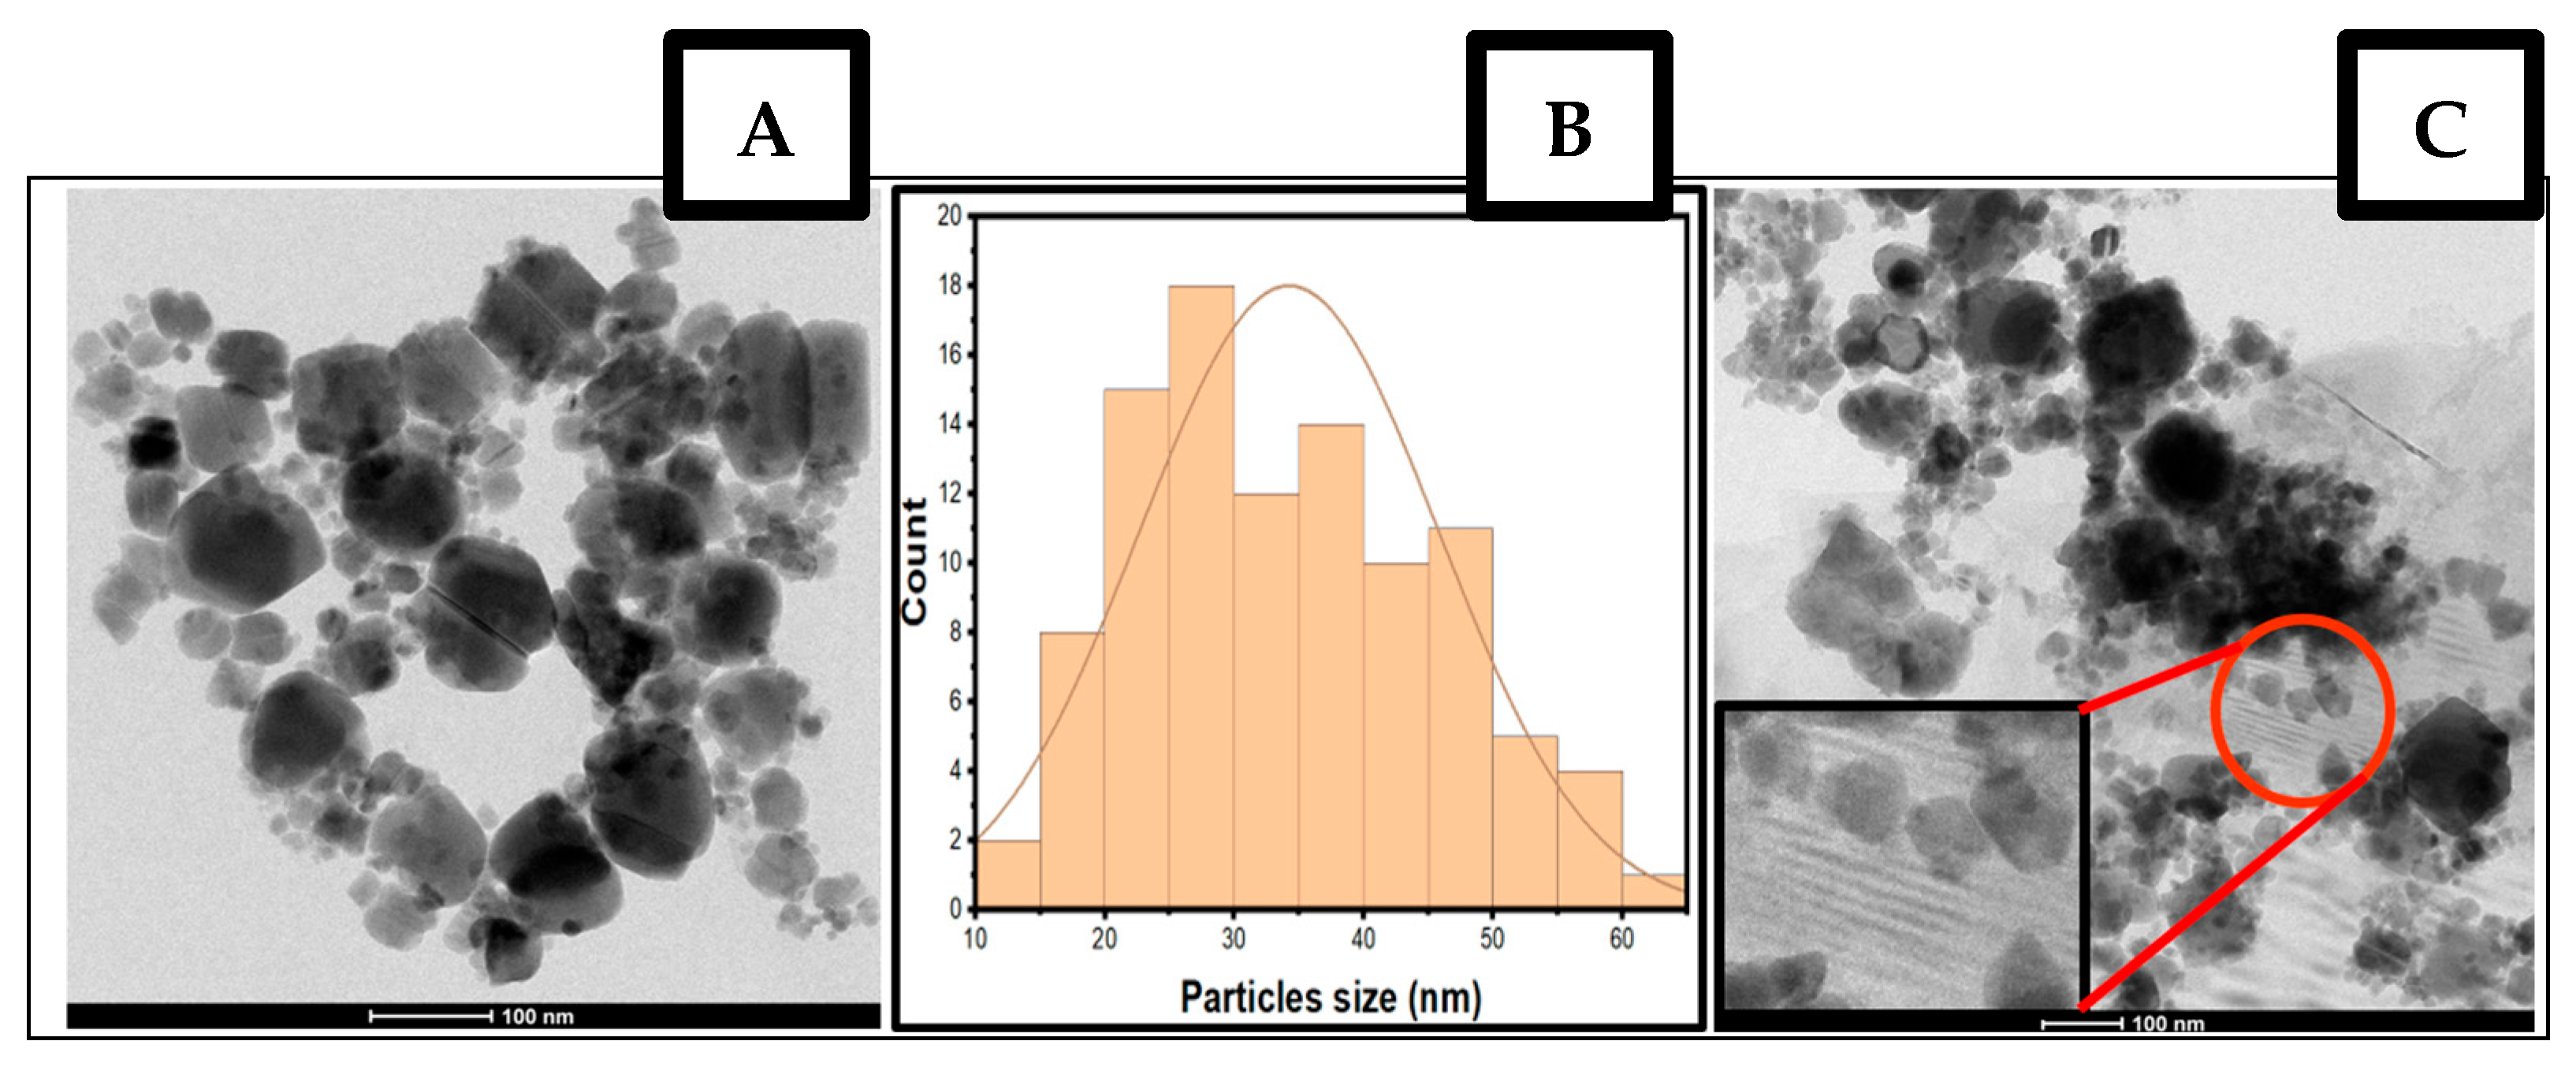
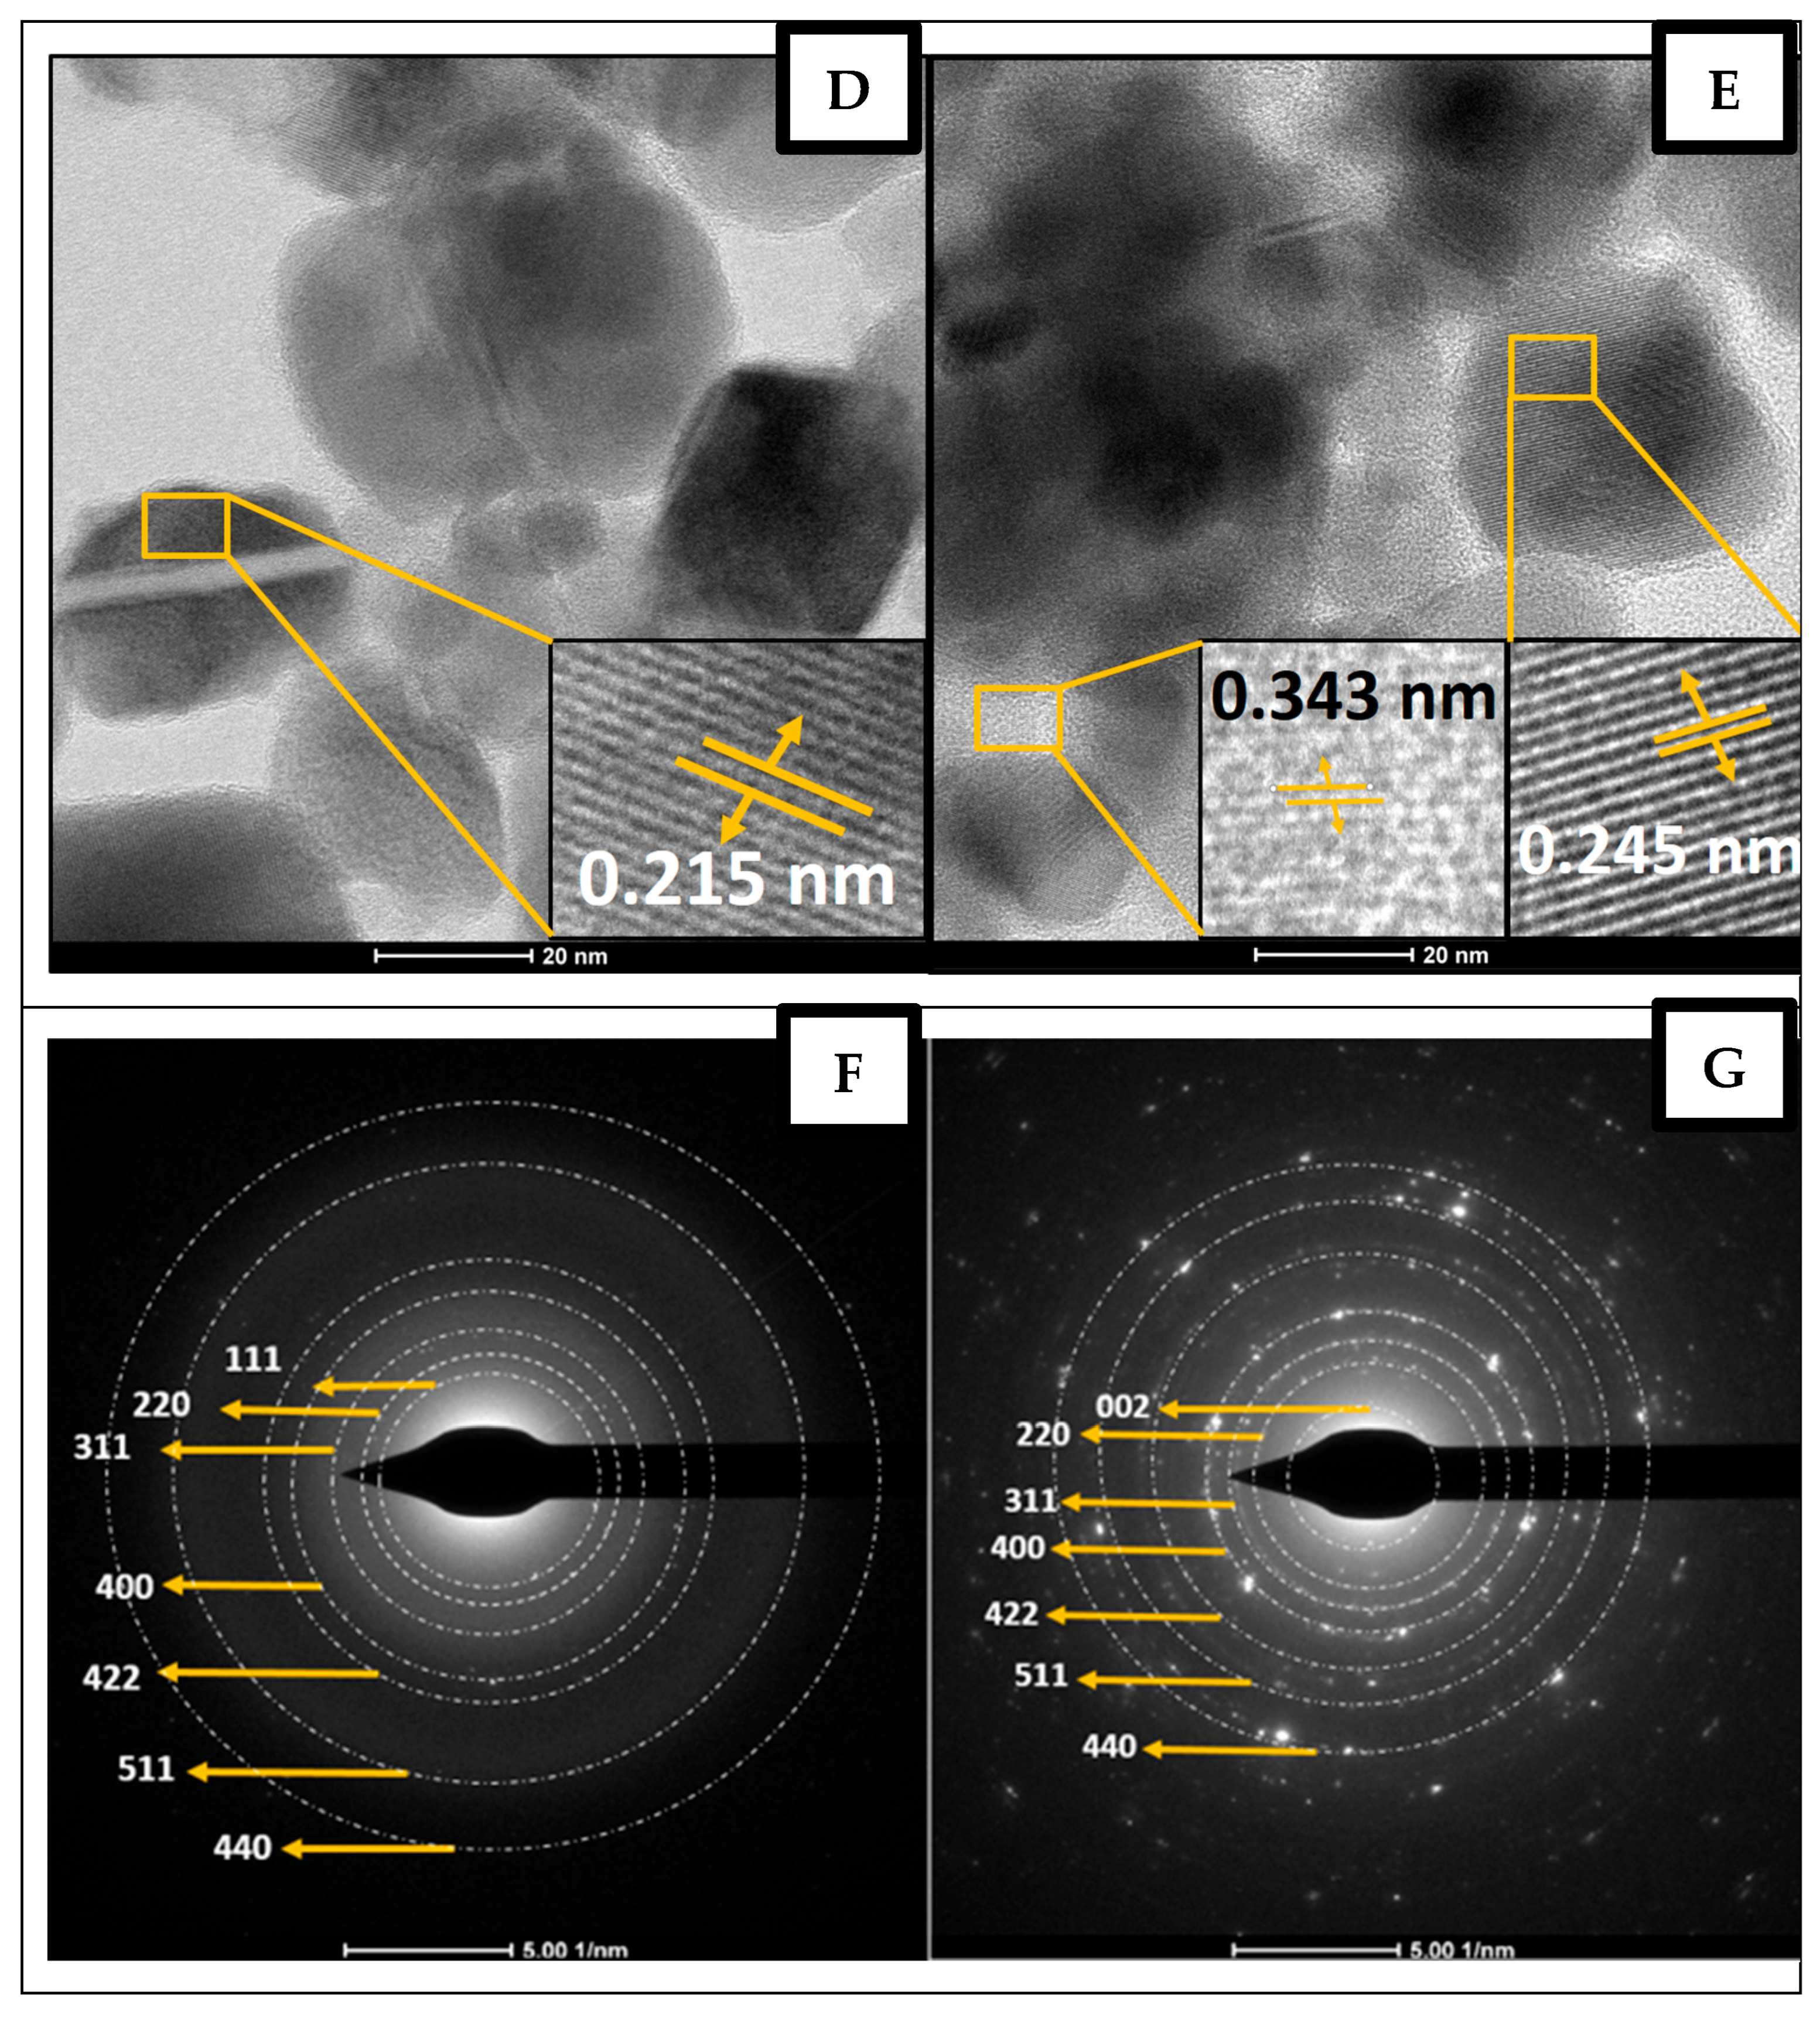
The TEM micrographs of Fe3O4 (Figure 3A) show well-dispersed spherical particles with average diameters ranging from 20 to 30 nm, indicating successful nanoscale synthesis. The narrow particle size distribution, as shown in the histogram (Figure 3B), indicates uniform nucleation and controlled growth during coprecipitation. The TEM micrographs of the Fe3O4–graphene composite show well-dispersed graphene attachments covering Fe3O4 particles (Figure 3C). High-resolution TEM (HRTEM, FEI, Oregon, USA) images show distinct lattice fringes with an interplanar spacing of 0.215 nm for Fe3O4 nanoparticles (Figure 3D). The interplanar spacings of 0.245 nm for Fe3O4 and 0.343 nm for graphene in the Fe3O4–graphene composite (Figure 3E) corresponds to the Fe3O4 (311) plane, confirming that Fe3O4 is well-dispersed on the graphene surface [30]. The Selected Area Electron Diffraction (SAED) pattern of Fe3O4 nanoparticles also shows diffraction rings corresponding to the (111), (210), (311), (400), (422), (511), and (440) planes [31] (Figure 3F). The SAED pattern of the Fe3O4–graphene composite shows diffraction rings corresponding to the (002), (111), (210), (311), (400), (422), and (511) planes for graphene [32] (Figure 3G). Overall, the HRTEM and SAED analyses indicate that Fe3O4 was successfully dispersed on graphene to form a stable, crystalline composite that could enhance the analytical performance of the modified electrode [33].

3.4. XPS Analysis

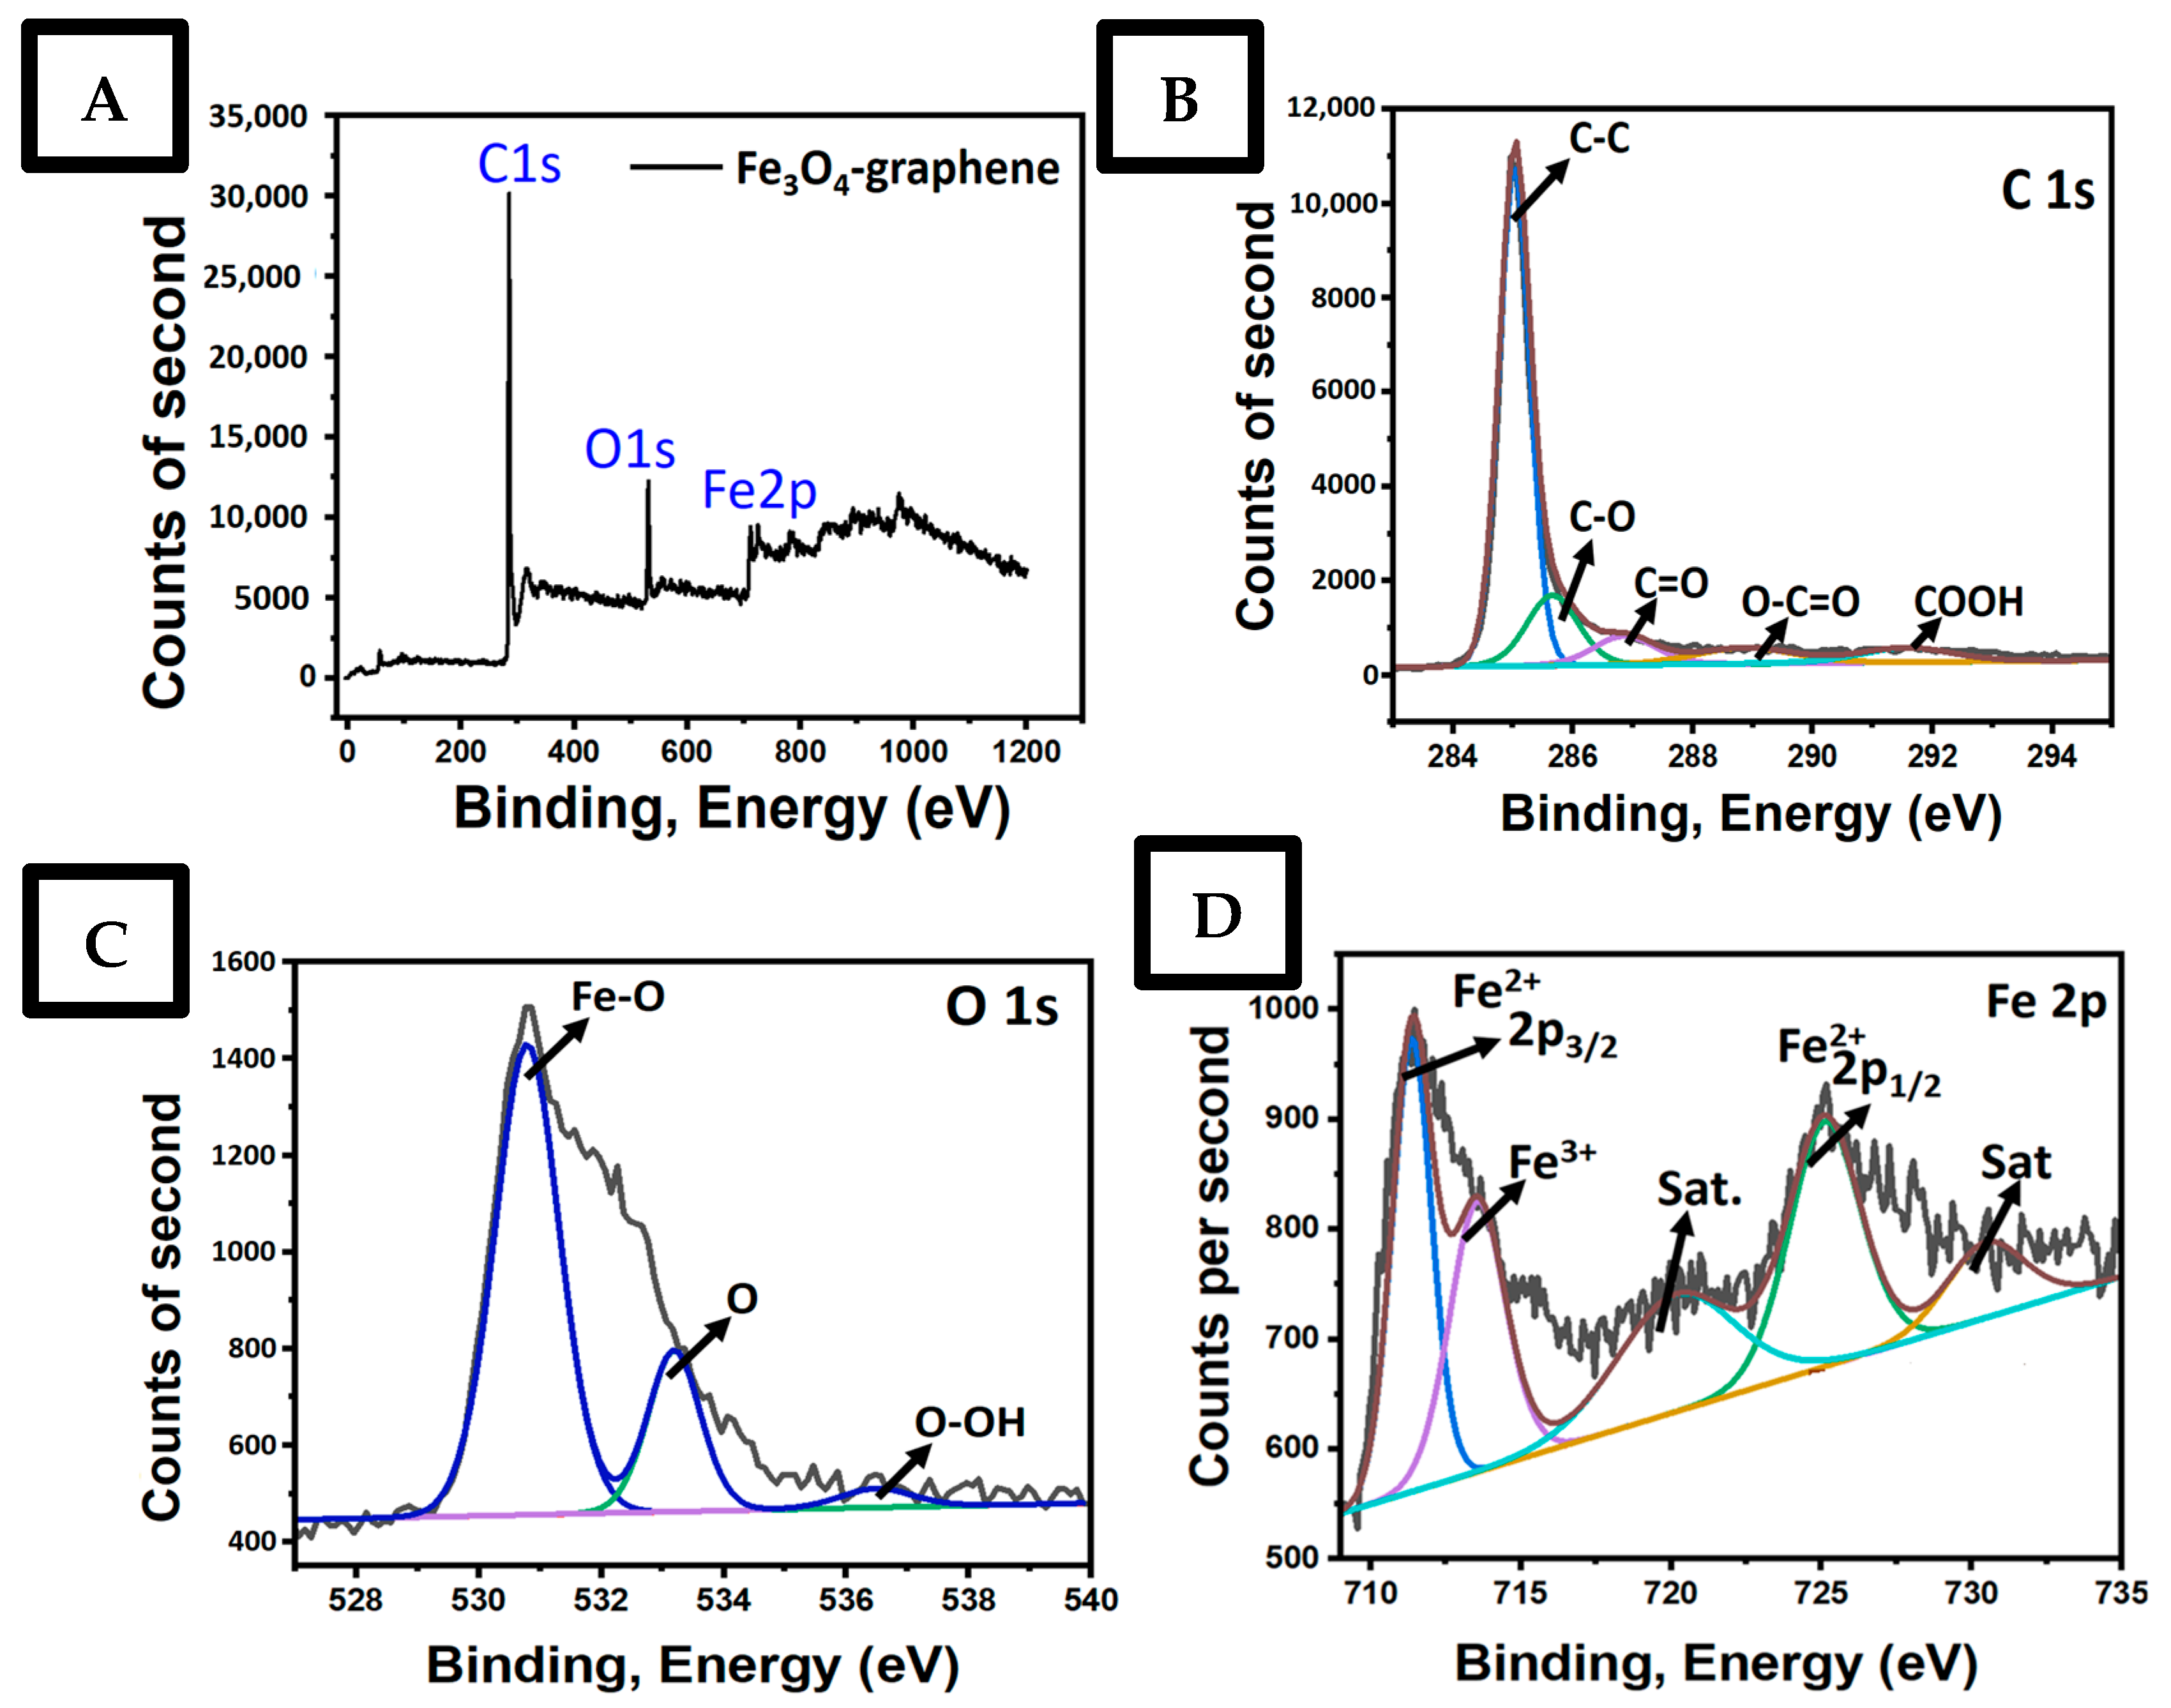
XPS was performed to examine the functional groups and chemical composition of the Fe3O4–graphene composite; details are shown in Figure 4. Figure 4A shows the XPS survey scan spectrum of the modified graphene sample at various time intervals. Three distinct peaks are observed at 285.7, 538.5, and 725 eV, representing C1s, O1s, and Fe2p, respectively, indicating the successful formation of the Fe3O4–graphene composite. The high-resolution C1s spectrum is shown in Figure 4B. Three main peaks are observed at 284.5 eV, 285.88 eV, and 287.06 eV, corresponding to the C–C, C–O, and C=O bonds, respectively. In addition, the O–C–O and COOH functional groups are detected at binding energies of 288.60 eV and 291.08 eV. Figure 4C shows the O1s spectrum, revealing the presence of three peaks in the bonding energy distribution at 530.8 eV, 532.3 eV, and 533.8 eV, corresponding to Fe-O, O, and O-OH, respectively, which are typically found in the literature [31]. Figure 4D shows the high-resolution XPS spectrum for Fe2p, which exhibits two peaks at 711.68 eV and 725.21 eV, corresponding to the Fe 2p3/2 and Fe 2p1/2 spin–orbit peaks of Fe3O4, respectively, indicating the formation of a mixed Fe(II) and Fe(III) oxide. Two satellite peaks are observed at 719.35 eV and 732.88 eV.

3.5. The Electrochemically Active Surface Area of Four Different Electrodes

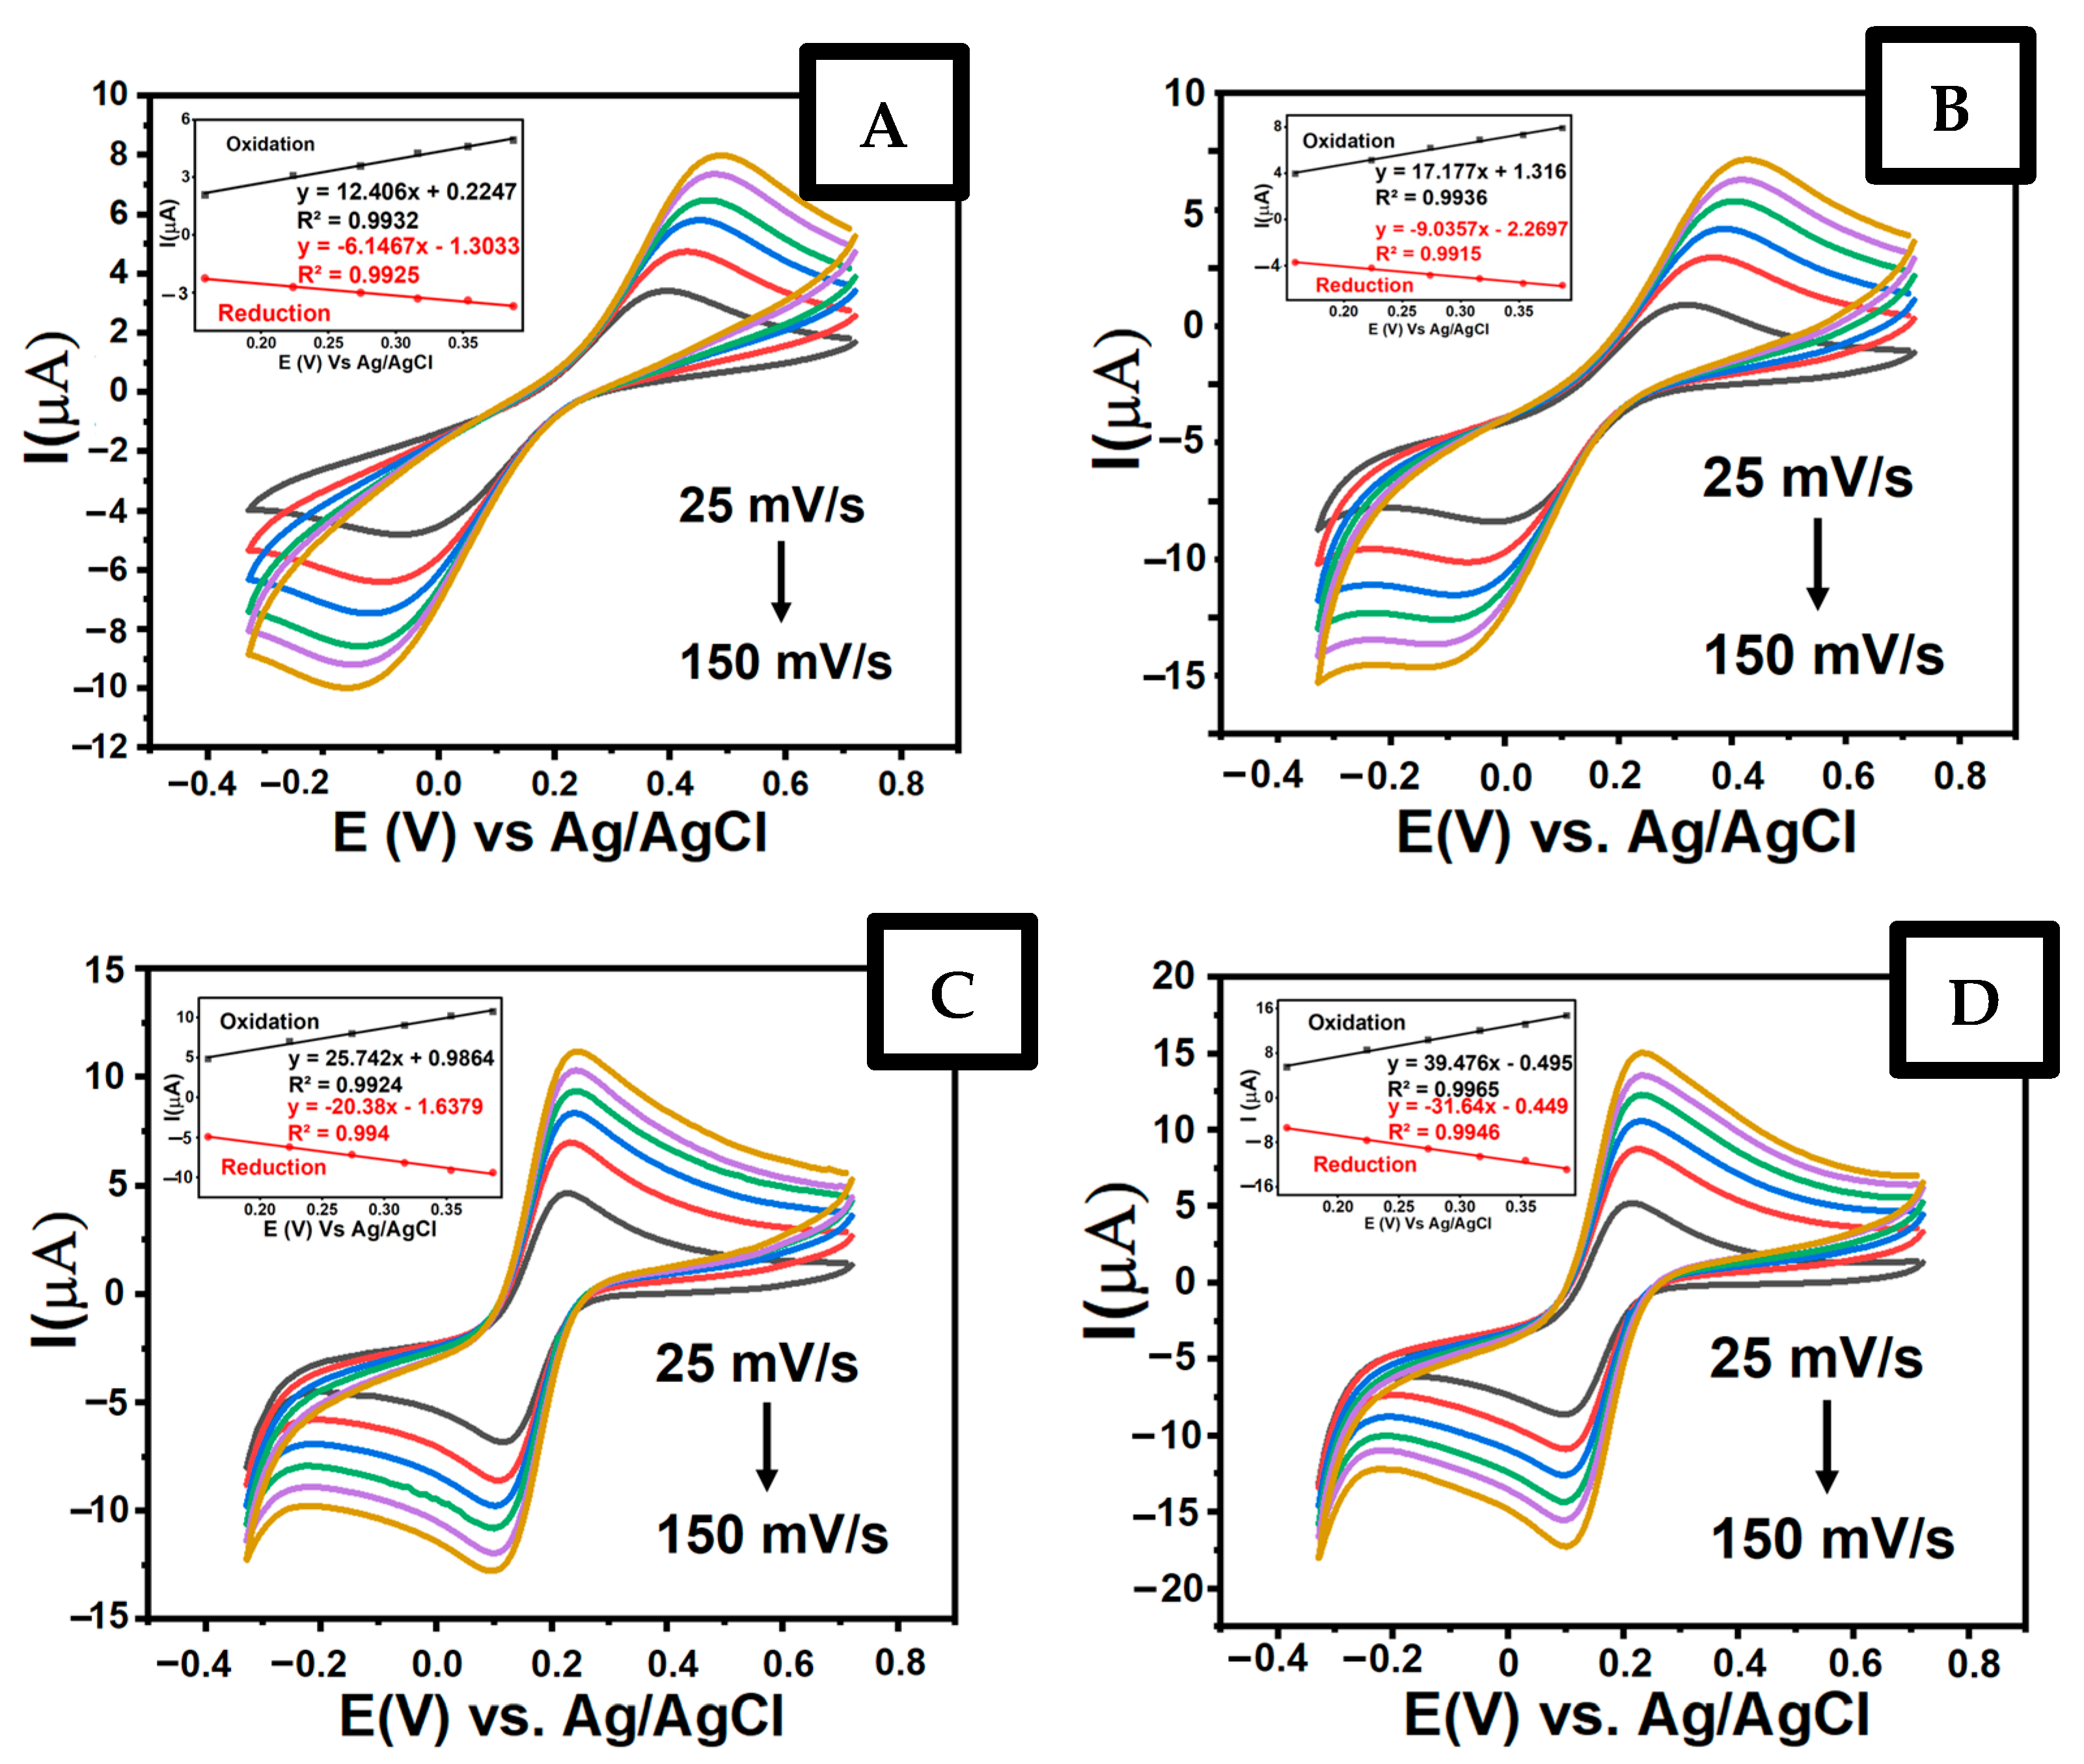
Four distinct electrodes (bare GCE, GCE/Fe3O4, GCE/graphene, and GCE/Fe3O4–graphene) were prepared with 1 mM K3[Fe(CN)4] solution in BRB (pH 5), and the impact of the scan-rate variation was investigated using cyclic voltammetry at scan rates ranging from 25 to 150 mV s−1. The linear equations for the bare GCE (Figure 5A) are determined as Ipa = 12.406x + 0.2247 (R2 = 0.9932) and Ipc = −6.1467x − 1.3033 (R2 = 0.9925); the linear equations for the GCE/Fe3O4 (Figure 5B) are determined as Ipa = 17.177x + 1.316 (R2 = 0.9936) and Ipc = −9.0357x − 2.2697 (R2 = 0.9915); the linear equations for the GCE/graphene (Figure 5C) are Ipa = 25.742x + 0.9864 (R2 = 0.9924) and Ipc = −20.38x − 1.6379 (R2 = 0.994); for the GCE/Fe3O4–graphene (Figure 5D), the linear equations are Ipa = 39.476x − 0.495 (R2 = 0.9965) and Ipc = −31.64x − 0.449 (R2 = 0.9946). These findings confirm that all three modified electrodes exhibit diffusion-controlled processes. Based on these data, the effective surface area of each electrode can be calculated using the Randles–Sevcik equation, as follows:
Ip = (2.69 × 10⁵) AD1/2 n3/2 v1/2C
The results show that the surface areas are 0.108 cm2 for the bare GCE, 0.143 cm2 for the GCE/Fe3O4, 0.361 cm2 for the GCE/graphene, and 0.515 cm2 for the GCE/Fe3O4–graphene. As shown in Figure 5, electrochemical characterization using cyclic voltammetry (CV) indicates that surface modification of the glassy carbon electrode (GCE) significantly affects its electron-transfer capability, as evidenced by changes in the peak current. The bare GCE produces the lowest current response among the electrodes. Depositing the Fe3O4 modifier on the GCE surface produces a larger surface area than the bare GCE (Figure 5A,B). The surface area further increases with the GCE/graphene (Figure 5C). The combination of Fe3O4 and graphene to form a Fe3O4–graphene composite on the GCE, producing GCE/Fe3O4–graphene, yields the highest surface area, as indicated by the highest anode and cathode peak currents among all the electrodes (Figure 5D). This enhancement confirms the synergistic effect between Fe3O4 and graphene in enlarging the electroactive surface area and improving the electron-transfer efficiency. Consequently, this surface modification significantly enhances the electrode’s electrochemical performance, rendering it more sensitive and responsive to the target analyte.
The enhanced current response of the GCE/Fe3O4–graphene could be attributed to its high electrical conductivity, large surface area, and the presence of graphene functional groups, which enhance dispersibility and the interaction with analytes. The Fe3O4–graphene composite provides excellent mechanical and electrochemical stability and strengthens the adhesion of the modification film on the electrode surface, thereby improving the electron-transfer efficiency and overall sensor sensitivity. Fe3O4 acts as an electron transport channel on the GCE surface; therefore, when combined with graphene, the two materials exhibit a synergistic effect that significantly enhances the performance of the GCE/Fe3O4–graphene [34]. Myristicin, which contains aromatic rings, can strongly interact with the carbon surface of graphene through the π-π stacking interaction. The combination of these two interactions results in the strong adsorption of myristicin on the graphene surface, thereby contributing to the enhanced electrochemical response of the sensor [35].

3.6. Evaluation of the Electrochemical Behavior of GCEs with Fe3O4, Graphene, and Fe3O4–Graphene Composite Modifiers

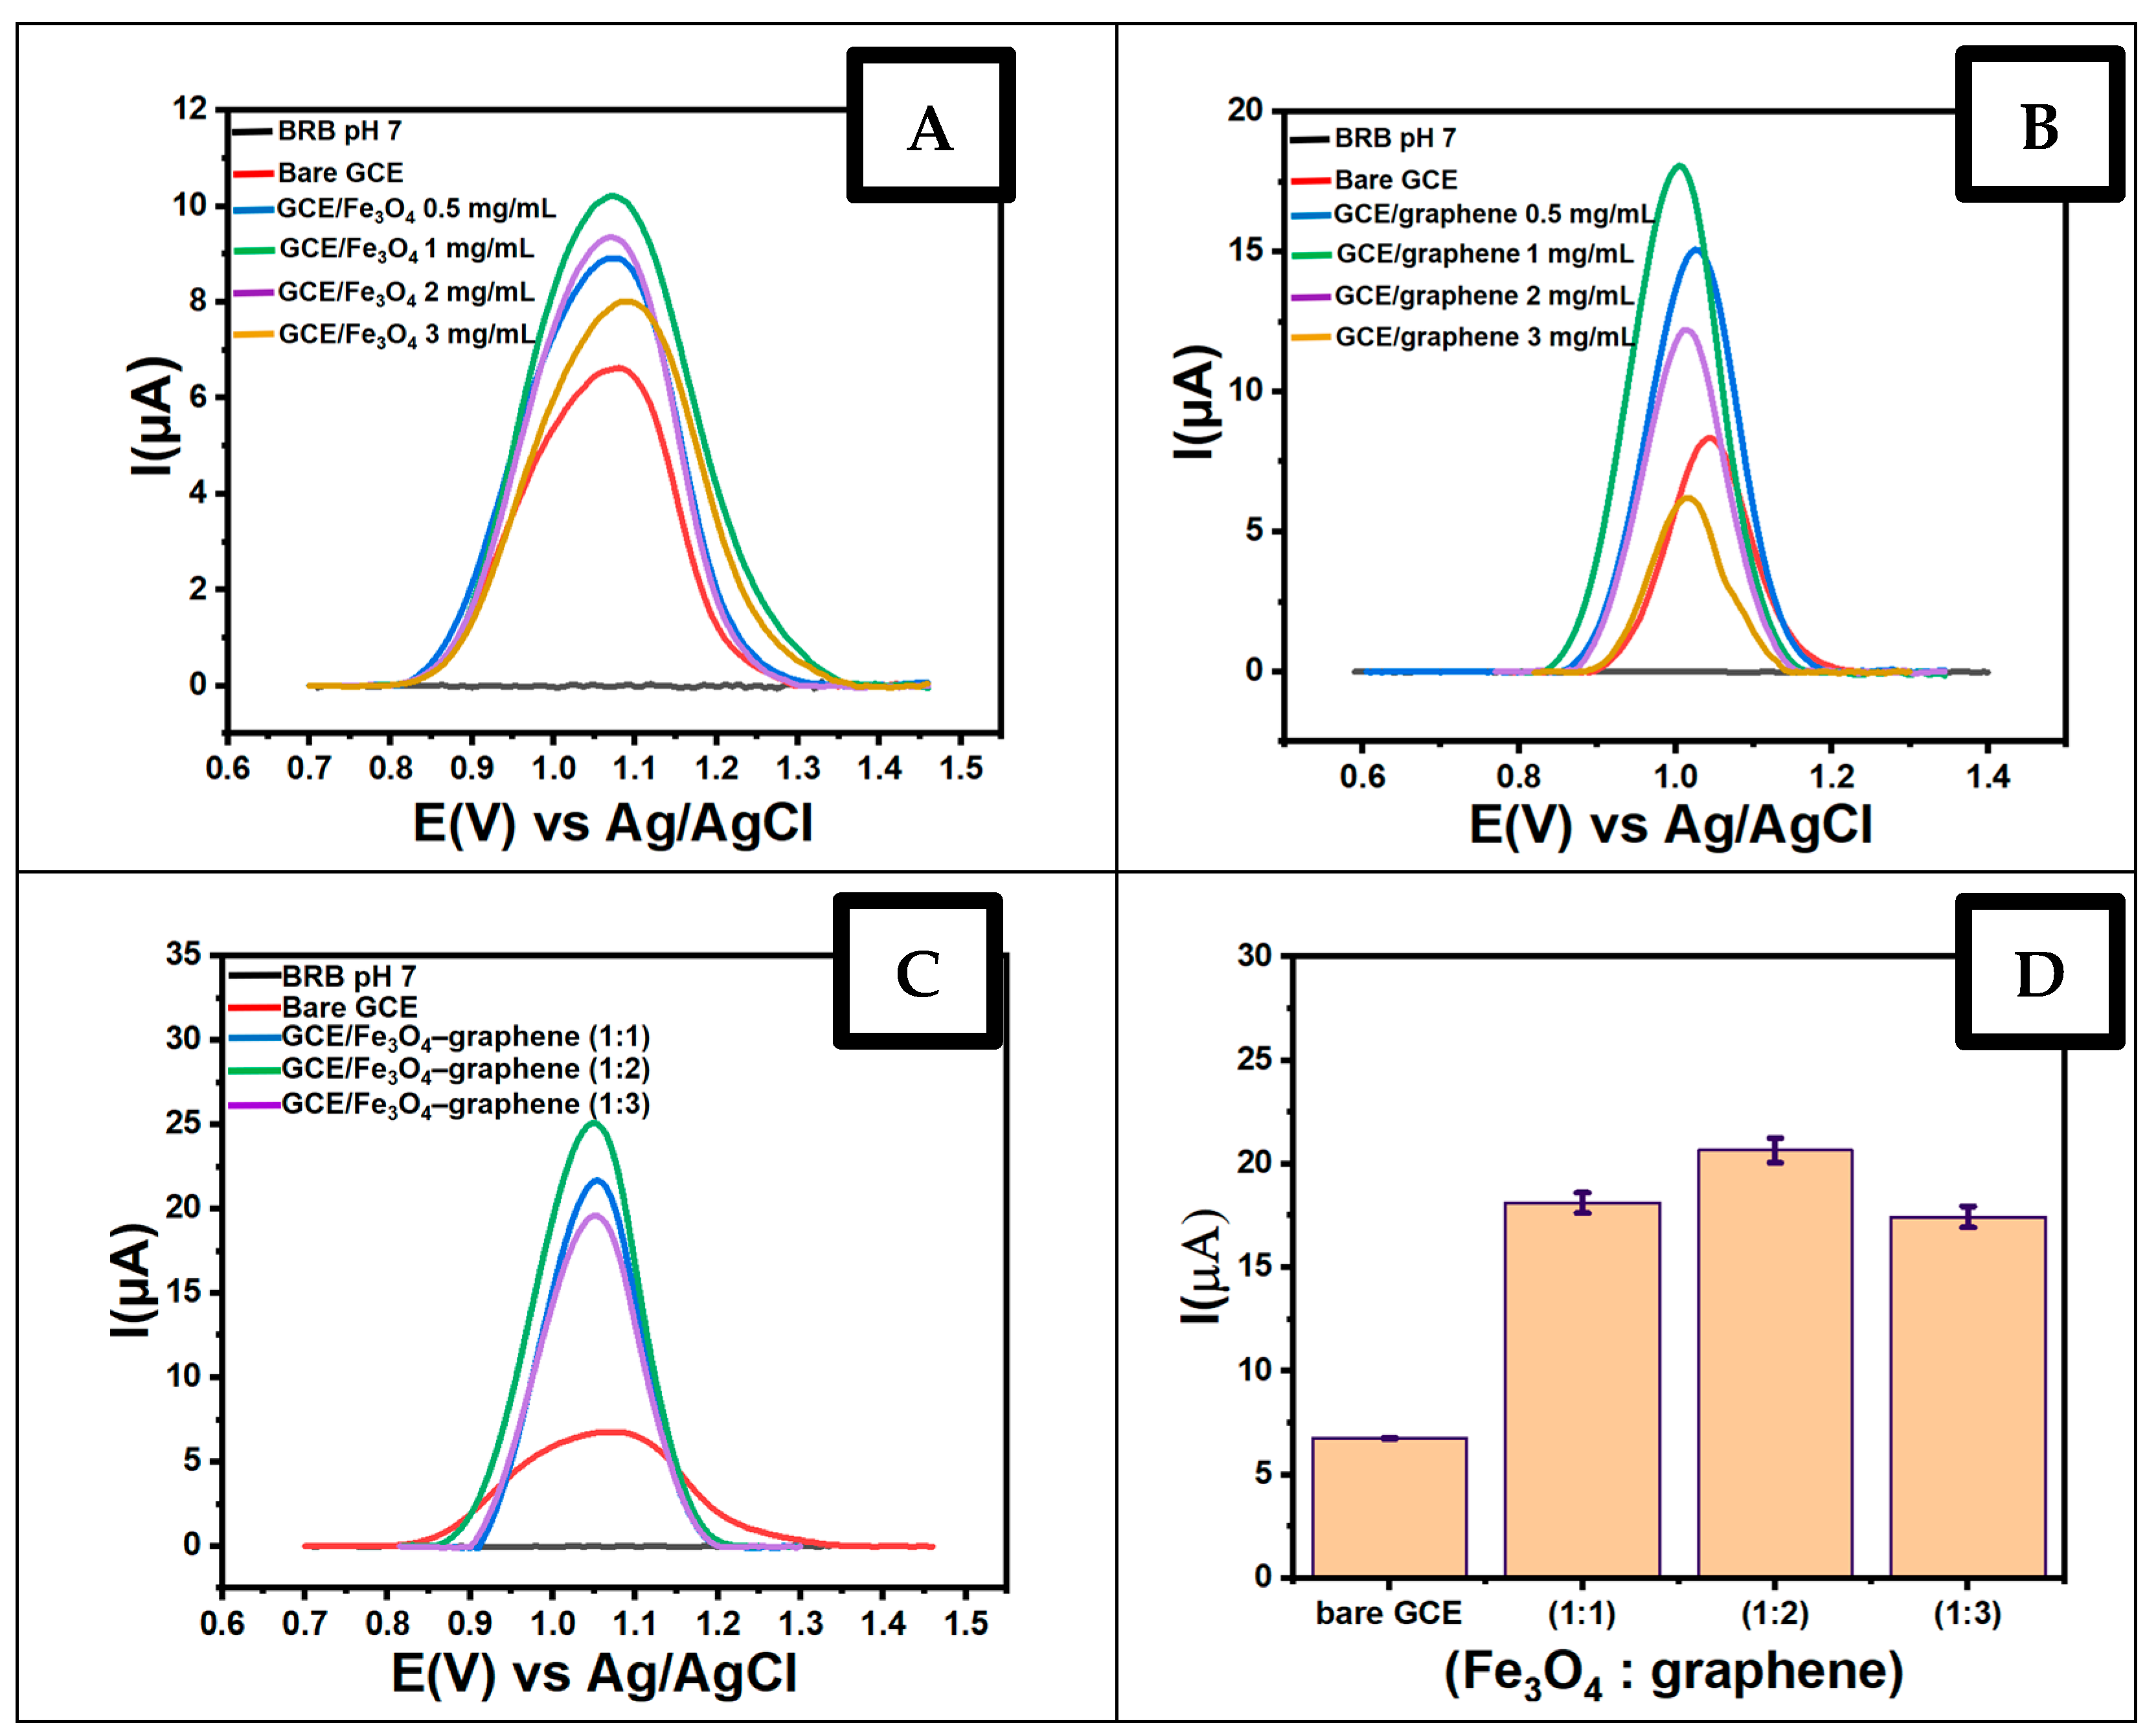
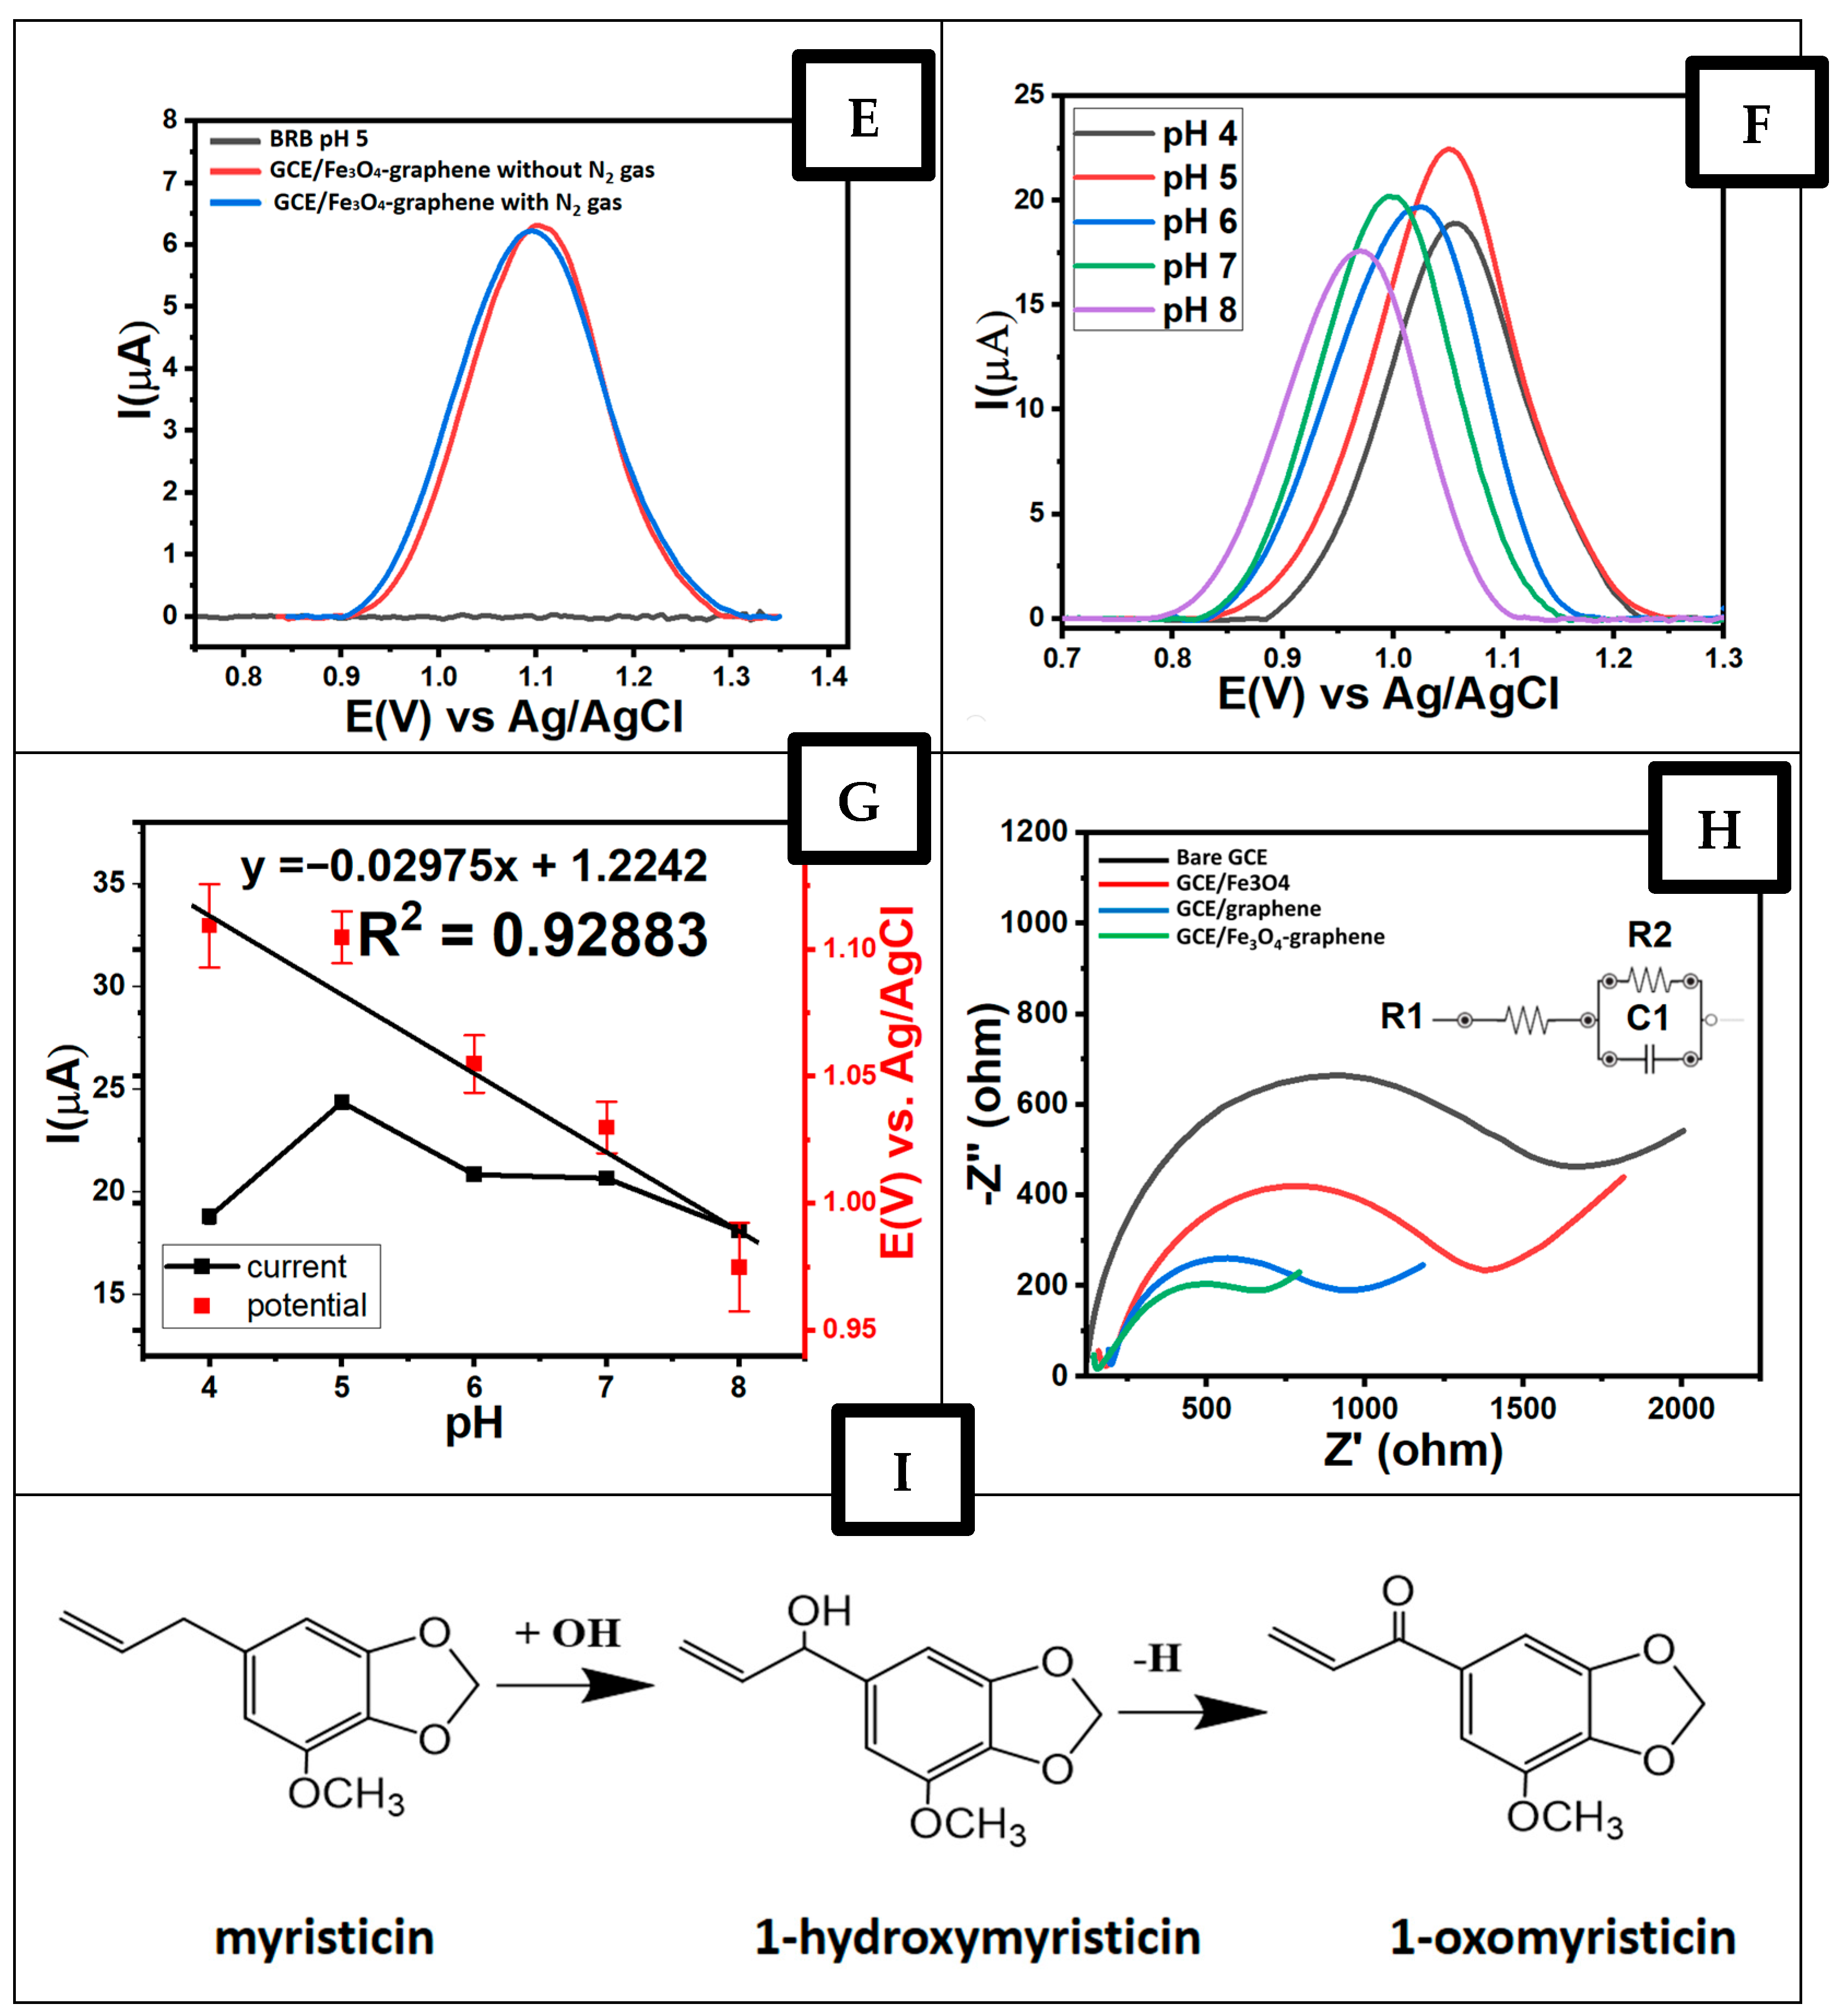
As shown in Figure 6A, the highest current response to myristicin oxidation among the modified electrodes was obtained with the GCE/Fe3O4 at 1 mg/mL. This enhanced current response to myristicin oxidation can be attributed to the electrocatalytic activity of Fe3O4 [36,37]. Additionally, graphene was employed at different concentrations (0.5, 1, 2, 3 mg/mL), and the highest current response to myristicin oxidation was obtained with the GCE/graphene at 1 mg/mL (Figure 6B). Therefore, we combined Fe3O4 and graphene as electrode modifier materials in different composition ratios (1:1, 1:2, and 1:3) and obtained the highest current response with the GCE/Fe3O4–graphene at a 1:2 ratio (Figure 6C). As illustrated in Figure 4D, this electrode exhibits the highest current response for myristicin oxidation, approximately three times that of the unmodified electrode. This phenomenon provides evidence of the synergistic effect caused by the electrical conductivity of graphene and the electrocatalytic activity of Fe3O4 [38]. Thus, GCE/Fe3O4–graphene with a 1:2 ratio was selected as the electrode for the subsequent electrochemical investigation of myristicin detection [39]. Additionally, the oxidation of dissolved oxygen in the electrolyte solution was found not to interfere with the oxidation of myristicin. This was demonstrated by first bubbling the myristicin solution with N2 gas before DPV measurements. As shown in Figure 6E, there was no difference compared to the treatment without N2 gas. This indicates that no oxidation effect occurred during the measurements due to the influence of the electrolyte (pH 5 buffer).
The variation in pH directly affects both electrochemical parameters: current and peak potential. The effect of pH on the electrochemical behavior of myristicin when using the GCE/Fe3O4–graphene composite (1:2, w/w) was investigated over the pH range of 4–8 (Figure 6F). The peak current increases to a maximum at pH 5, while the peak potential shifts to more negative values as pH increases. This phenomenon can be interpreted in the context of the relationship between pH and the potential and current responses of the GCE/Fe3O4–graphene, as shown in Figure 6G. The electrode potential at pH 5 is higher than that at pH 4, but it slowly decreases with a further increase in pH. This indicates that the electrode’s ability to oxidize myristicin is optimum at pH 5 [40]. It is essential to investigate this effect since the oxidation of myristicin involves hydrogen ions. Thus, pH can significantly affect the current response of myristicin when measured using the GCE/Fe3O–graphene. Therefore, this study meticulously examined a range of pH levels from 4 to 8, as shown in Figure 6G [41].
Further investigation was conducted to examine the impact of solution pH on the peak potential for the oxidation process of myristicin in 0.1 M BRB at various pH levels (4–8), as measured using the GCE/Fe3O4–graphene. Figure 4D shows that the oxidation potential of myristicin decreases linearly with increasing solution pH, suggesting that protons also participate in the electrocatalytic reaction. The slope obtained for myristicin is –29 mV/pH. The oxidation of myristicin is known to be a two-electron process, whereas the number of protons involved in its oxidation process is one. The obtained value is significantly lower than the theoretical value of −59.16, indicating that the redox reaction does not fully follow the ideal Nernstian behavior. This decrease in slope can be interpreted as indicating that protons do not fully participate in the electron-transfer process or that the reaction is partially reversible. In this mechanism, only one proton is released for every two electrons transferred, resulting in a proton-to-electron ratio of 0.5. Furthermore, the influence of the electric field leads to deviation from a linear relationship between the potential and pH, resulting in non-Nernstian behavior, which explains the variation in product selectivity and differences in activity across different catalyst surfaces. This phenomenon indicates that the myristicin redox mechanism is complex, involving more than just one step of proton and electron transfer and the possible formation of intermediates that influence the linearity of the potential–pH relationship. Figure 4D illustrates the chemical interaction between graphene, serving as a conductive material, and Fe3O4, acting as an electron transport channels, on the GCE surface. The improved performance of the modified electrode can be attributed to a synergistic effect at the GCE/Fe3O4–graphene surface [42]. This phenomenon is due to the π-π interaction between graphene and the carbonyl of myristicin, which enhance the electrocatalytic redox process on the modified electrode surface [43]. This phenomenon can also be observed in the myristicin oxidation reaction mechanism (Figure 6I) [44].
EIS studies were conducted at a potential of +0.25 V with respect to Ag/AgCl to evaluate the electron-transfer properties at the electrode/electrolyte interface. The figure displays the Nyquist plots for four types of electrodes: bare GCE, GCE/Fe3O4, GCE/graphene, and GCE/Fe3O4–graphene (with a ratio of 1:1). The results show that the composite electrode has a smaller semicircular diameter compared to the other electrodes, reflecting higher conductivity and lower resistivity. This result further indicates that the combination of Fe3O4 and graphene exhibits a synergistic effect that significantly improves the electrical properties of the composites. The increased conductivity and decreased resistivity are mainly attributed to the efficient electron-transfer pathways resulting from the integration of uniformly distributed Fe3O4 particles with graphene. The high electrical conductivity of Fe3O4, along with the extensive conductive network provided by graphene, offers multiple pathways for electron flow, thus minimizing the resistance in charge transfer. This enhanced electron-transfer capability is considered crucial for oxidation. The combination of a high surface area, abundant active sites, and overall enhanced conductivity results in the higher current output and better electrocatalytic performance of the Fe3O4–graphene composite. This is confirmed by the estimated charge-transfer resistance (R2) values obtained through Randles circuit analysis. Generally, a larger R2 value reflects a slower electron-transfer process at the electrolyte/electrode interface. The measured R2 values for the bare GCE, GCE/Fe3O, GCE/graphene, and GCE/Fe3O–graphene are 3770, 1042, 863.5, and 501.6 Ω, respectively.

3.7. Analytical Performance of the GCE/Fe3O4–Graphene in Detecting Myristicin

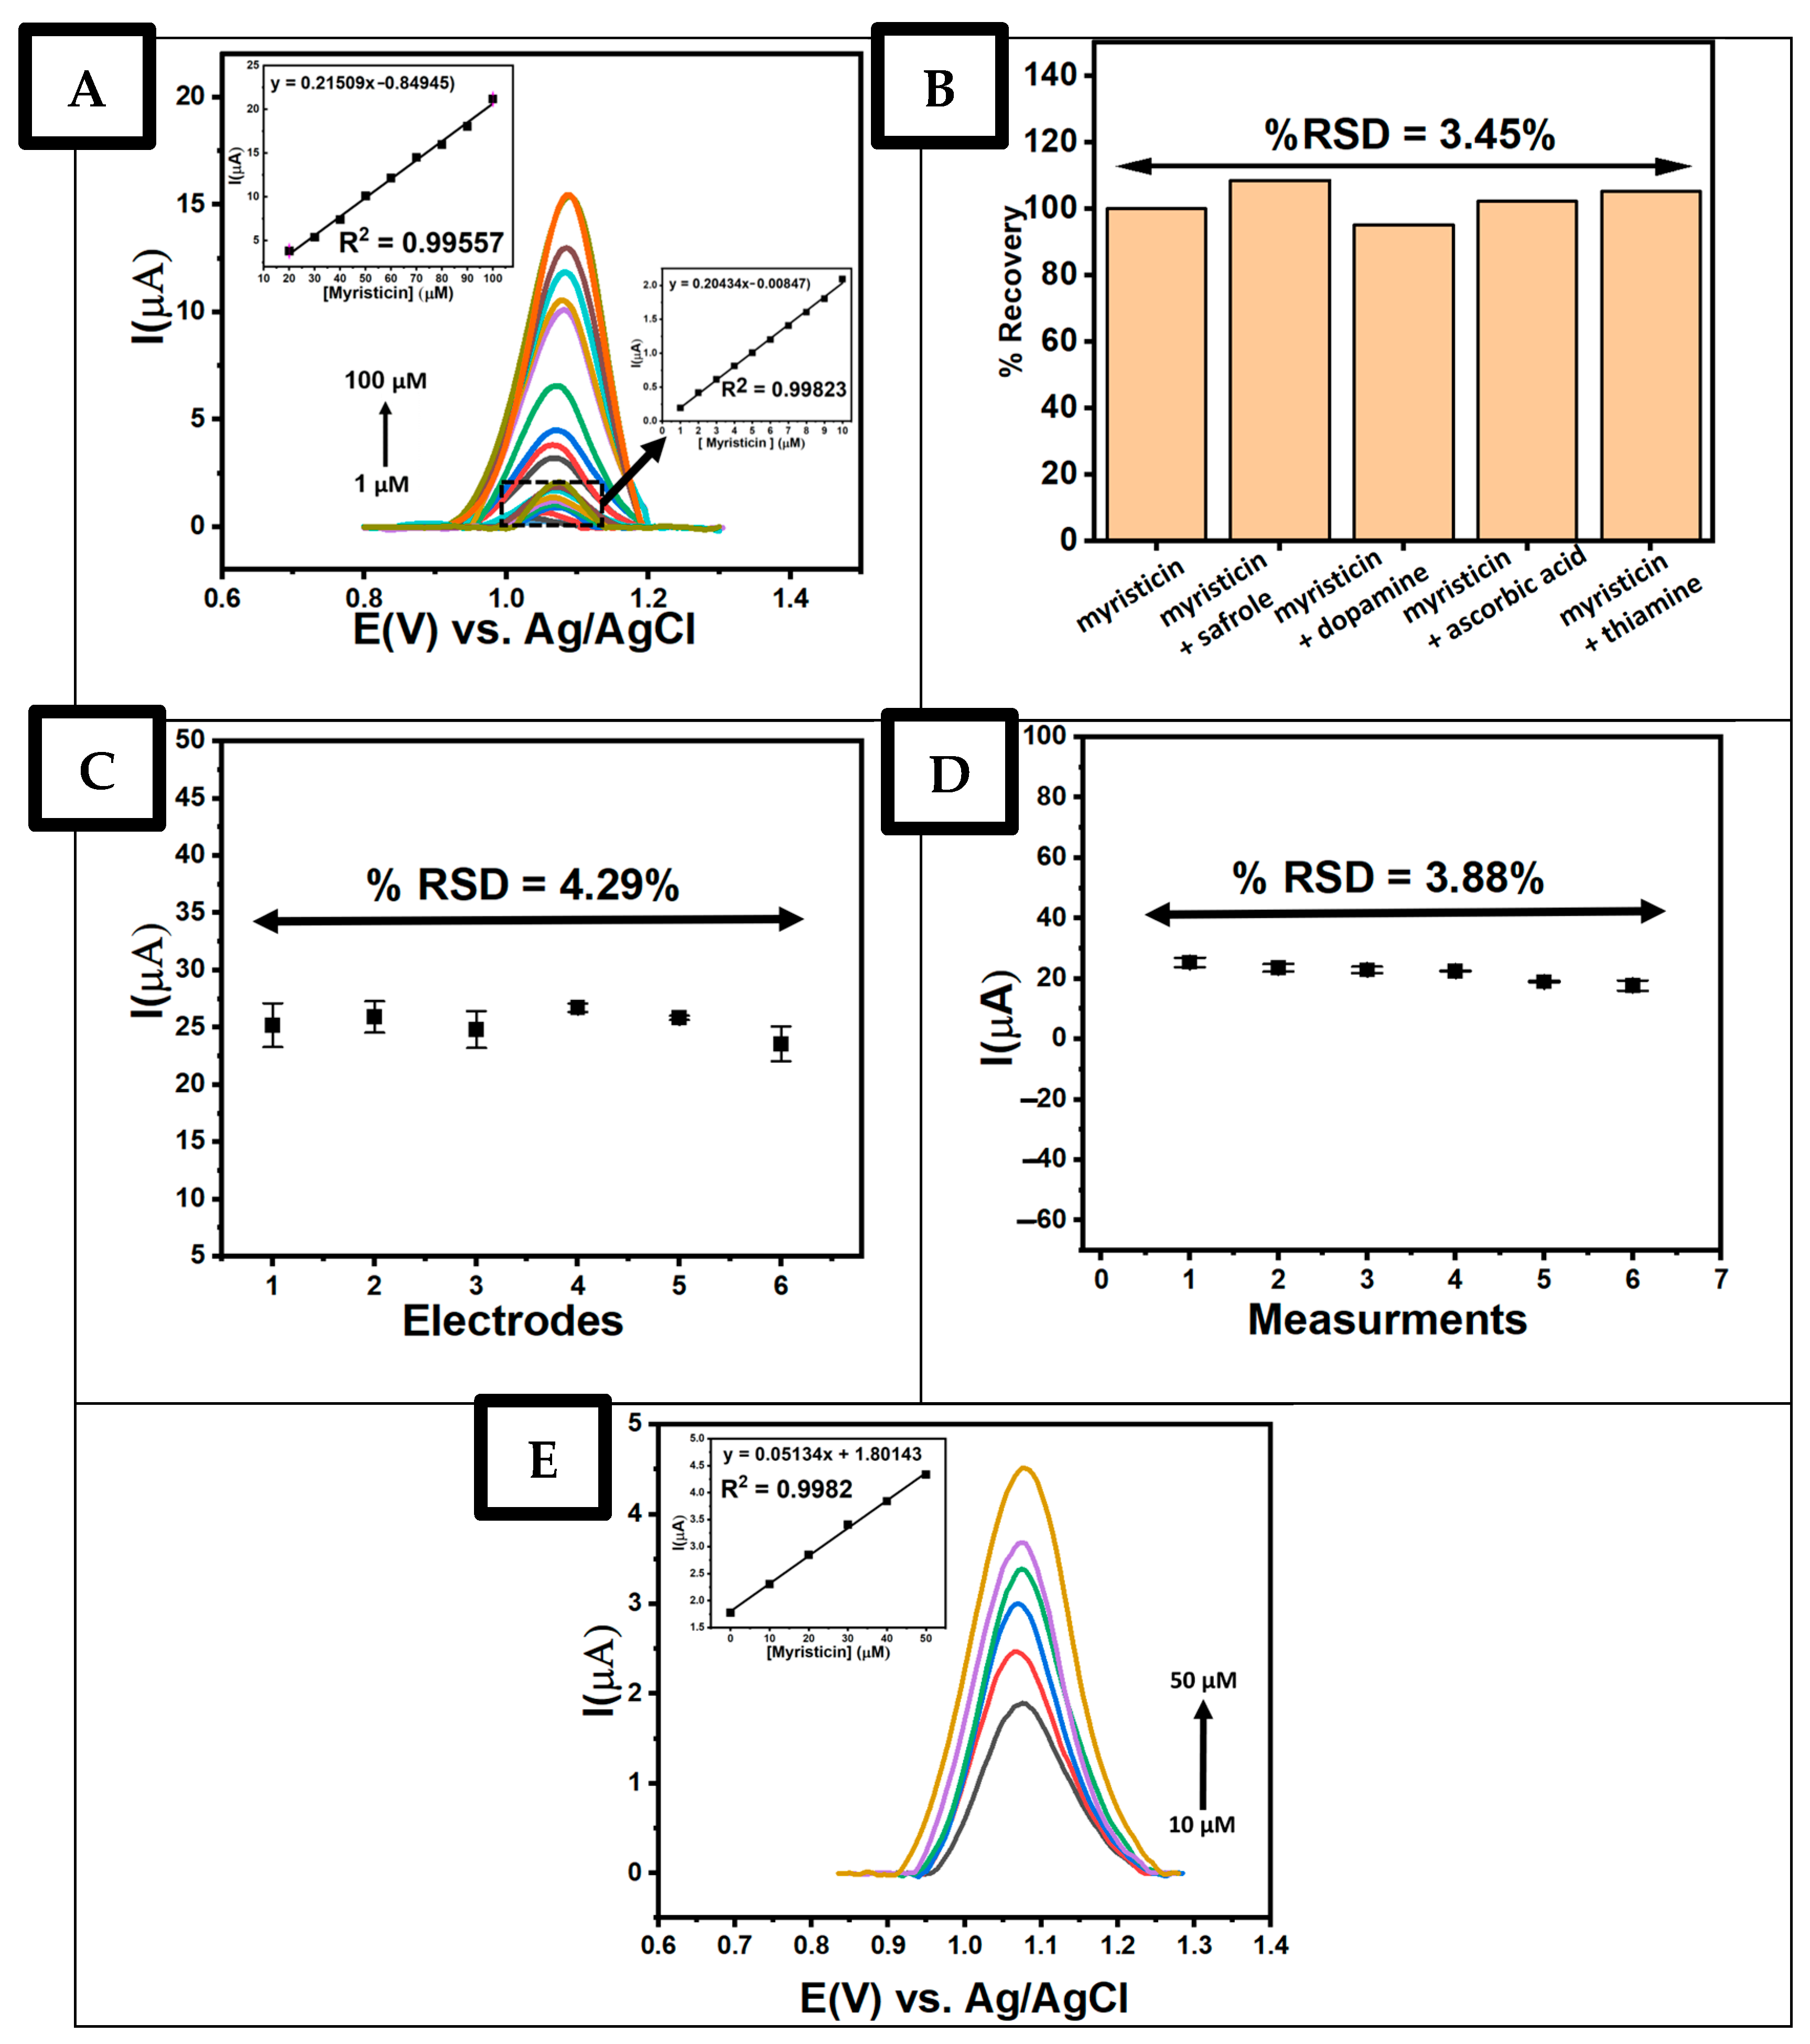
The analytical performance of the GCE/Fe3O4–graphene was evaluated based on several parameters, including the limit of detection (LOD), linearity, repeatability, and stability. Linearity was assessed using differential pulse voltammetry (DPV) by varying the myristicin concentration in the range of 1–100 µM in BRB solution (pH 5). As shown in Figure 7A, the peak current increases in proportion to the myristicin concentration. The linear regression equation obtained from the calibration curve is Ipa = 0.21509x + (−0.84945), with a correlation coefficient (R2) of 0.99557. The limit of detection (LOD) and limit of quantification (LOQ) were determined based on the signal-to-noise (S/N) ratio, using approximate values of 3 for the LOD and 10 for the LOQ, with 0.1 M BRB (pH 5) employed as the blank solution. Consequently, the LOD and LOQ were determined to be 0.19 μM and 0.58 μM, respectively. The combination of a high diffusion coefficient and superior catalytic properties ensures the rapid and effective reduction of molecules, resulting in a robust and reliable current response. Furthermore, the performance of the prepared electrode is comparable to that of other materials reported in the literature (Table 1).
The ability of the Fe3O4–graphene composite electrode to detect myristicin was also evaluated in the presence of various other compounds, such as safrole, dopamine, ascorbic acid, and thiamine. As shown in Figure 7B, these potential interferons showed negligible or minimal effects on myristicin detection, with recoveries exceeding 95%. This robustness can be attributed to the composite electrode’s selective catalytic properties, allowing it to effectively distinguish myristicin from other substances. The specific functional groups and high surface area of the Fe3O4–graphene composite provide numerous active sites that support the adsorption and oxidation of myristicin while minimizing nonspecific interactions with other molecules.
Moreover, it is assumed that the electrochemical properties of the Fe3O4–graphene composite allow for distinct potential windows within which myristicin oxidation can occur, thereby reducing the possibility of signal overlap from interfering species. The strong electron-transfer ability and high conductivity of the Fe3O4–graphene composite further ensure that the signal corresponding to myristicin remains clear and unobstructed by the presence of other compounds. Thus, the GCE/Fe3O4–graphene exhibits excellent selectivity and reliability in detecting myristicin even in complex matrices with various potential interferences.
Repeatability refers to the ability of a sensor to produce consistent results under identical measurement conditions. This parameter was evaluated using the Fe3O4–graphene-modified electrode in a 2.7 × 10⁻⁴ M myristicin solution prepared in 0.1 M BRB (pH 5). The anodic peak currents obtained from multiple electrodes exhibited good uniformity, with an RSD of 4.29%, as shown in Figure 7C. Stability was evaluated using a single electrode through repeated measurements of myristicin in 0.1 M BRB (pH 5). As shown in Figure 7D, the anodic peak currents remained highly consistent throughout successive measurements, yielding an RSD of 3.88%. According to the ICH Q2 (R1) guidelines, an RSD value below 5% indicates acceptable repeatability. These results demonstrate that the GCE/Fe3O4–graphene exhibits acceptable operational stability and is suitable for reliable repeated electrochemical analyses.

3.8. Analysis of Actual Samples

The proposed sensor, based on the GCE/Fe3O4–graphene, was investigated for its ability to detect myristicin in nutmeg extract using the DPV technique. The prepared electrode was practically applied to measure myristicin concentration in nutmeg seed extract samples using the standard addition method. As shown in Figure 7E, the results show a highly linear relationship between the current and the concentration, with an R2 value of 0.99824 at a concentration of 176.334 ± 16.250 µM. This high correlation coefficient indicates excellent sensitivity and accuracy. Furthermore, the recovery value for myristicin detection at each concentration exceeds 97%, validating the effectiveness and reliability of the electrode. This high recovery rate ensures the accurate quantification of added myristicin without significant interference from the nutmeg seed extract matrix. The myristicin concentration obtained using the GCE/Fe3O4–graphene electrochemical sensors are similar to those measured using GCMS, at 181.423 ± 16.171 µM. As expected, the specific functional groups and high surface area of the nanocomposite provide numerous active sites for the selective adsorption and oxidation of myristicin. The strong electron-transfer capability and high conductivity further enhance the detection performance, ensuring clear signals even in complex samples.
Several studies investigating Fe3O4 and graphene-based electrochemical sensors have reported different electrochemical performance characteristics in terms of the limit of detection (LOD), the limit of quantification (LOQ), sensitivity, and the linear range of sensor response. A sensor developed for capecitabine detection showed good performance, with an LOD of 0.006 µM and an LOQ of 0.02 µM, along with a high sensitivity of 0.0089 µA/µM in a linear range of 0.02–60 µM. These values confirm the sensor’s ability to detect the chemotherapy drug down to trace levels [47]. Similarly, the sensor developed for the detection of bisphenol A (BPA) had an LOD of 0.009 µM and an LOQ of 0.03 µM, with a sensitivity of 0.019 µA/µM and a very wide working range (0.05–150 µM). These values indicate that the sensor is highly efficient for the detection of endocrine pollutants with nanomolar sensitivity [48]. An electrochemical sensor developed using a graphene oxide/Fe3O4 nanocomposite for dopamine detection showed an LOD of 0.48 µM and an LOQ of 1.6 µM, with a linear response range of 1–10 µM. This sensor was developed via a simple synthesis method through the synergy between graphene oxide as a conductor and Fe3O4 as an electron transport channel [48]. A Fe3O4/graphene/carbon cloth (Fe3O4/Gr/CC)-based electrochemical sensor showed good analytical performance for H2O2 detection, with an LOD of 4.79 µM, an LOQ of 15.97 µM, and a sensitivity of 0.037 µA µM−1 cm−2 [46]. Another study used Fe3O4@graphene/GCE electrochemical sensors to detect Salmonella bacterial analytes in milk, showing high sensitivity with a slope value of 6.499 μA/log(cfu/mL) and a coefficient of determination (R2) of 0.993, indicating a very strong linear relationship between the peak current (ΔI) and the log of the Salmonella concentration. This sensor had a wide linear response range, from 2.4 × 10² to 2.4 × 10⁷ cfu/mL, so it could consistently detect Salmonella bacteria at various concentration levels [44]. The LOD value of 2.4 × 10² cfu/mL indicated the sensor’s ability to detect Salmonella at very low concentrations, while the estimated LOQ of around 2.4 × 10³ cfu/mL indicated that the measurement results remained accurate and precise at a higher level. Overall, the four studies mentioned above show that electrode surface modification with nanocomposite materials such as graphene and Fe3O4 can improve sensitivity and electrochemical performance, although differences in LOD and LOQ values reflect variations in electron-transfer mechanisms, active surface areas, and measurement environmental conditions.

4. Conclusions

In this work, a nanocomposite of magnetite and graphene was successfully synthesized using a hydrothermal method and applied as a modified material to a glassy carbon electrode (GCE) for the detection of myristicin as a bioactive marker compound in nutmeg seed extract. Structural and morphological analyses confirmed the successful fabrication of the hybrid nanomaterial: the XRD patterns revealed characteristic diffraction peaks corresponding to crystalline Fe3O4 and graphene phases, validating the formation of a Fe3O4–graphene composite. SEM-EDS images showed a homogeneous distribution of Fe, O, and C elements, confirming the effective integration of magnetite nanoparticles on graphene sheets. TEM analysis further highlighted the nanoscale dispersion of magnetite particles anchored onto the layered graphene structure, providing a large electroactive surface. The combination of magnetite and graphene enhanced the electrochemical properties of the GCE modified with the Fe3O4/graphene composite for the detection of myristicin. These findings highlight the potential of Fe3O4–graphene-modified electrodes as promising platforms for the development of portable, cost-effective, and high-performance electrochemical sensors, with potential broader applications in food authentication, nutraceutical monitoring, and bioactive compound analysis.

Author Contributions

Conceptualization, D.S., B.R.P. and I.B.; methodology, B.R.P. and I.B.; validation, D.M., B.R.P. and I.B.; formal analysis, D.M.; investigation, D.M. and U.D.S.; writing—original draft preparation, D.M.; writing—review and editing, D.M. and D.S.; supervision, D.S., B.R.P. and I.B.; project administration, I.B.; funding acquisition, D.S. All authors have read and agreed to the published version of the manuscript.

Funding

This research is supported by the Directorate General of Research and Development of the Ministry of Higher Education, Science, and Technology in accordance with the Research Program Implementation Contract for Fiscal Year 2025 Number 006/C3/DT.05.00/PL/2025.

Institutional Review Board Statement

Not applicable.

Informed Consent Statement

Not applicable.

Data Availability Statement

The original contributions presented in this study are included in the article. Further inquiries can be directed to the corresponding authors. The raw data supporting the conclusions of this article will be made available by the authors on request.

Acknowledgments

The authors also thank Alfika Rahman and Kevin Murheza for their significant contributions to the magnetite synthesis, which greatly supported the completion of this work.

Conflicts of Interest

The authors declare no conflict of interest.

References

  1. Lee, C.J.; Huang, C.W.; Chen, L.G.; Wang, C.C. (+)-Erythro-∆80-7S,8R-Dihydroxy-3,30,50-Trimethoxy-8-O-40-Neolignan, an Anti-Acne Component in Degreasing Myristica fragrans Houtt. Molecules 2020, 25, 4563. [Google Scholar] [CrossRef]
  2. Padol, M.V.; Vishwakarma, P.; Dodamani, A.S.; Gore, A.W.; Chachlani, K.S.; Kharkar, S.P. Comparative Evaluation of Nutmeg Mouthwash and 0.2% Chlorhexidine Gluconate Mouthwash on Halitosis and Plaque Control: A Randomized Clinical Trial. J. Indian Soc. Periodontol. 2020, 26, 113–118. [Google Scholar] [CrossRef]
  3. Seneme, E.F.; dos Santos, D.C.; de Lima, C.A.; Zelioli, Í.A.M.; Sciani, J.M.; Longato, G.B. Effects of Myristicin in Association with Chemotherapies on the Reversal of the Multidrug Resistance (MDR) Mechanism in Cancer. Pharmaceuticals 2022, 15, 1233. [Google Scholar] [CrossRef]
  4. Al-Rawi, S.S.; Ibrahim, A.H.; Ahmed, H.J.; Khudhur, Z.O. Therapeutic, and Pharmacological Prospects of Nutmeg Seed: A Comprehensive Review for Novel Drug Potential Insights. Saudi Pharm. J. 2024, 32, 102067. [Google Scholar] [CrossRef] [PubMed]
  5. Pertiwi, M.S.; Batubara, I.; Indariani, S.; Murni, A.; Wati, V.S.; Kuroki, Y. Potential Indonesian Plants as Energy Boosters. Rev. Agric. Sci. 2024, 12, 401–420. [Google Scholar] [CrossRef]
  6. Imran, M.; Haleem Shah, A.; Ullah, N.; Yousef Alomar, S.; Rehman, A.; Ur Rehman, N.; Nawaz, A.; Baloch, R.; Zaman, A.; Abdul Rafey, H.; et al. Integrated Computational Analysis, in Vitro, in Vivo Investigation on Myristica fragrans Houtt. Essential Oils for Potential Anti Rheumatic Activities. J. King Saud Univ.-Sci. 2024, 36, 103177. [Google Scholar] [CrossRef]
  7. Lung, I.; Stan, M.; Opriş, O.; Soran, M.-L. Determination of Myristicin and Linalool in Plants Exposed to Microwave Radiation by High-Performance Liquid Chromatography. Anal. Lett. 2015, 48, 567–574. [Google Scholar] [CrossRef]
  8. Sun, R.-B.; Chen, Y.-H.; Zhang, X.-R.; Liu, F.-T.; Wang, W.-Y.; Zhang, J.-N.; Wang, Y.-F.; Zhang, H.; Xie, M.; Xin, G.-Z.; et al. Discrimination of Easily Confused Tea Leaves with Similar Appearance (Gougu Tea vs. Gonglao Tea) via an Integrated Method of Electronic Tongue, HPLC-QTOF-MS-VirtualTaste, Electronic Nose, Electrochemical Fingerprinting and Machine Learning. J. Food Compos. Anal. 2025, 148, 108404. [Google Scholar] [CrossRef]
  9. Dawidowicz, A.L.; Dybowski, M.P. Determination of Myristicin in Commonly Spices Applying SPE/GC. Food Chem. Toxicol. 2012, 50, 2362–2367. [Google Scholar] [CrossRef]
  10. Ashokkumar, K.; Vellaikumar, S.; Muthusamy, M.; Dhanya, M.K.; Aiswarya, S. Compositional Variation in the Leaf, Mace, Kernel, and Seed Essential Oil of Nutmeg (Myristica fragrans Houtt.) from the Western Ghats, India. Nat. Prod. Res. 2021, 36, 432–435. [Google Scholar] [CrossRef]
  11. Engel, D.E.; Sudjarwo; Sukardiman. Standardization of Myristicin in Nutmeg (Myristica fragrans Houtt.) Fruit Using TLC-Densitometric Method. J. Farm. Dan Ilmu Kefarmasian Indones. 2024, 11, 12–19. [Google Scholar] [CrossRef]
  12. Qu, L.; Lin, Z.; Liu, F.; Kong, F.; Zhang, Y.; Ni, X.; Zhang, X.; Zhao, Y.; Lu, Q.; Zou, B. Research Progress on the Application of Metal Porphyrin Electrochemical Sensors in the Detection of Phenolic Antioxidants in Food. Polymers 2025, 17, 789. [Google Scholar] [CrossRef]
  13. Krishnendu, M.R.; Singh, S. Reactive Oxygen Species: Advanced Detection Methods and Coordination with Nanozymes. Chem. Eng. J. 2025, 511, 161296. [Google Scholar] [CrossRef]
  14. Madadelahi, M.; Romero-soto, F.O.; Kumar, R.; Bonilla, U.; Madou, M.J. Biosensors and Bioelectronics Electrochemical Sensors: Types, Applications, and the Novel Impacts of Vibration and Fluid Flow for Microfluidic Integration. Biosens. Bioelectron. 2025, 272, 117099. [Google Scholar] [CrossRef]
  15. Mohammad, S.; Shaik, S.B.; Allu, G.V.; Nani, D.; Munjal, S. Advancements in Electrochemical Sensors: Nanotechnology-Driven Innovations for Enhanced Detection. Pure Appl. Chem. 2025. [Google Scholar] [CrossRef]
  16. Licoo, C.N. Developing a Highly Sensitive Electrochemical Sensor for Malathion Detection Based on Green G-C3N4@LiCoO2 nanocomposites. RSC Adv. 2025, 15, 3378–3388. [Google Scholar] [CrossRef]
  17. Jakubec, P.; Panáček, D.; Nalepa, M.A.; Rossetti, M.; Álvarez-Diduk, R.; Merkoçi, A.; Vasjari, M.; Kulla, L.; Otyepka, M. Graphene Derivatives as Efficient Transducing Materials for Covalent Immobilization of Biocomponents in Electrochemical Biosensors. ChemElectroChem 2025, 12, e202400660. [Google Scholar] [CrossRef]
  18. Ismardi, A.; Fathona, I.; Sugiarto, D.; Yusril, M.; Ningtyas, A.K.; Hakim, M.N.I. GCE Modified by Graphene-Doped ZnO/PVA Nanocomposites for Highly Sensitive Pb Detection. J. Phys. Conf. Ser. 2025, 2942, 012018. [Google Scholar] [CrossRef]
  19. Chen, J.; Liu, W.; Gao, L.; Li, X.; Huang, X.; Yan, L.; Liu, F.; Wang, Y.; Chen, S.; Liu, Z.; et al. Boosted Sensitivity of Single-Atom Sites for Dopamine and Hydrogen Peroxide Detection. Carbon Neutralization 2025, 4, e70027. [Google Scholar] [CrossRef]
  20. Chen, L.; Shen, P. Electrochemical Properties of NiO Nanoparticles Modified Glassy Carbon Electrode. J. Phys. Conf. Ser. 2025, 2942, 012018. [Google Scholar] [CrossRef]
  21. Kurundawade, S.R.; Patil, Y.N.; Megalamani, M.B.; Nandibewoor, S.T. Enhancing Sulfinpyrazone Determination via Electrochemistry: Development of a S-Doped CoFe2O4 Modified Sensor. J. Electrochem. Soc. 2025, 172, 17518. [Google Scholar] [CrossRef]
  22. Zhu, H.; Shi, F.; Peng, M.; Zhang, Y.; Long, S.; Liu, R.; Li, J.; Yang, Z. Non-enzymatic electrochemical glucose sensors based on metal oxides and sulfides: Recent progress and perspectives. Chemosensors 2025, 13, 19. [Google Scholar] [CrossRef]
  23. Valizadeh, A.; Mirzapoor, A.; Hallaji, Z.; Jahanshah Talab, M.; Ranjbar, B. Innovative Synthesis of Magnetite Nanoparticles and Their Interaction with Two Model Proteins: Human Serum Albumin and Lysozyme. Part. Part. Syst. Charact. 2025, 42, 2400168. [Google Scholar] [CrossRef]
  24. Joshi, R.; Ravindran, K.V.; Lahiri, I. Graphene-Based Materials and Electrochemical Biosensors: An Overview. J. Phys. Condens. Matter 2025, 37, 143001. [Google Scholar] [CrossRef]
  25. Zhou, J.; Tan, S.Y.; Webster, R.D. Electrochemical Current Amplification of Bisphenol A in the Presence of Magnetite Nanoparticles. J. Phys. Chem. C 2025, 129, 16055–16064. [Google Scholar] [CrossRef]
  26. Fadli, A.; Amri, A.; Sari, E.O.; Sukoco, S.; Saprudin, D. Superparamagnetic Nanoparticles with Mesoporous Structure Prepared through Hydrothermal Technique. Mater. Sci. Forum 2020, 1000, 203–209. [Google Scholar] [CrossRef]
  27. Sobahi, N.; Imran, M.; Khan, M.E.; Mohammad, A.; Alam, M.M.; Yoon, T.; Mehedi, I.M.; Hussain, M.A.; Abdulaal, M.J.; Jiman, A.A. Electrochemical sensing of H2O2 by employing a flexible Fe3O4/graphene/carbon cloth as working electrode. Materials 2023, 16, 2770. [Google Scholar] [CrossRef]
  28. Xin, Z.Y.; Wang, Y.X.; Wen, F.; Di, C.Q. Special mechanical and tribological protecting effects of the in-situ grown carbon coating on natural rubber. Diam. Relat. Mater. 2024, 149, 111574. [Google Scholar] [CrossRef]
  29. Siburian, R.; Goei, R.; Manurung, H.; Aritonang, S.P.; Simanjuntak, C.; Hutagalung, F.; Anshori, I.; Alias, Y.; Paiman, S.; Affi, J.; et al. Distribution Model of Iron (Fe) on Fe/Graphene Nano Sheets. Ceram. Int. 2023, 49, 28571–28579. [Google Scholar] [CrossRef]
  30. Ren, S.; Zeng, J.; Zheng, Z.; Shi, H. Perspective and Application of Modified Electrode Material Technology in Electrochemical Voltammetric Sensors for Analysis and Detection of Illicit Drugs. Sens. Actuators A Phys. 2021, 329, 112821. [Google Scholar] [CrossRef]
  31. Anwar, U.; Kiran, S.; Feroze, R.; Noor, N.A. RSC Advances a Comparative Exploration of Room Temperature Impedance Characteristics and EMI Shielding Performance. RSC Adv. 2025, 15, 16098–16109. [Google Scholar] [CrossRef]
  32. Guzman, M.A.; Salazar, J.S.; Amaya, R.O.; Matsumoto, Y.; Lopez, M.O. Synthesis and characterization of magnetite-graphene oxide nanocomposite. In Proceedings of the 13th International Conference on Electrical Engineering, Computing Science and Automatic Control (CCE), Mexico City, Mexico, 26–30 September 2016. [Google Scholar] [CrossRef]
  33. Eldamhogy, S.F.T.; Elkorashy, S.A.; Tantawy, H.R.; Aal, N.F.A. Magnetite/Reduced Graphene Oxide Synthesis and Study as a Potential Adsorbent for Absorptive Removal of Heavy Metals. Adv. Environ. Life Sci. 2022, 2, 20–31. [Google Scholar] [CrossRef]
  34. Sartika, D.; Widhiyanuriyawan, D.; Sugeng, A.; Wardana, I.N.G. The Role of Graphene Oxide’s Aromatic Rings in Activated Carbon Made from Banana Leaves (ACBL) and Fe3O4 in Hydrogen Production. Carbon Resour. Convers. 2025, 8, 100239. [Google Scholar] [CrossRef]
  35. Ayub, S.; Hoe, B.; Soleimani, H.; Ahmad, F.; Un, Z.; Yetunde, J.; Amin, M.; Hamid, B.; Mudassir, Y. Magnetite Deposit on Graphene Nanoplatelets Surface: An Assessment of Grafting Parameters. Ain Shams Eng. J. 2023, 14, 101996. [Google Scholar] [CrossRef]
  36. Rahmawati, R.; Taufiq, A.; Sunaryono; Yuliarto, B.; Suyatman; Nugraha; Noviandri, I.; Setyorini, D.A.; Kurniadi, D. The Synthesis of Fe3O4/MWCNT Nanocomposites from Local Iron Sands for Electrochemical Sensors. In Proceedings of the 3RD International Conference on the Science and Engineering of Materials (ICoSEM 2017), Kuala Lumpur, Malaysia, 24–25 October 2017; AIP Publishing: Melville, NY, USA, 2018; Volume 1958. [Google Scholar] [CrossRef]
  37. Zameran, N.I.; Saleh, N. Graphene-Based Magnetic Covalent Organic Frameworks and Deep Eutectic Solvent Functionalized Adsorbents for Polycyclic Aromatic Hydrocarbons: A Review. R. Soc. Open Sci. 2026, 12, 251102. [Google Scholar] [CrossRef]
  38. Morariu, M.I.; Nicolaescu, M.; Orha, C.; Lăzău, C.; Duteanu, N.; Bandas, C. Heterostructure Based of Ti-TiO2 (NW)/rGO Hybrid Materials for Electrochemical Applications. Inorganics 2025, 13, 31. [Google Scholar] [CrossRef]
  39. Emon, S.H.; Hossain, M.I.; Khanam, M.; Yi, D.K. Expanding horizons: Taking advantage of graphene’s surface area for advanced applications. Appl. Sci. 2025, 15, 4145. [Google Scholar] [CrossRef]
  40. Adib, M.R.; Barrett, C.; O’Sullivan, S.; Flynn, A.; McFadden, M.; Kennedy, E.; O’Riordan, A. In Situ PH-Controlled Electrochemical Sensors for Glucose and PH Detection in Calf Saliva. Biosens. Bioelectron. 2025, 275, 117234. [Google Scholar] [CrossRef]
  41. Liu, S.; Wang, Z.; Qiu, S.; Deng, F. Mechanism in PH Effects of Electrochemical Reactions: A Mini-Review. Carbon Lett. 2024, 34, 1269–1286. [Google Scholar] [CrossRef]
  42. Elgamouz, A.; Kawde, A.; Shehadi, I.A.; Sayari, S.; Ali, S.; Mohammed, A.; Abdelrazeq, A.; Nassab, C.N.; Abdelhamid, A.A. Modified Graphite Pencil Electrode Based on Graphene Oxide-Modified Fe3O4 for Ferrocene-Mediated Electrochemical Detection of Hemoglobin. ACS Omega 2023, 8, 11880–11888. [Google Scholar] [CrossRef] [PubMed]
  43. Patel, D.M.; Kastlunger, G. Non-Nernstian effects in theoretical electrocatalysis. Chem. Rev. 2025, 125, 3378–3400. [Google Scholar] [CrossRef]
  44. Malahmeh, A.J.; Al-Ajlouni, A.; Wesseling, S.; Soffers, A.E.M.F.; Al, A.; Reiko, S.; Jacques, K. Physiologically Based Kinetic Modeling of the Bioactivation of Myristicin. Arch. Toxicol. 2017, 91, 713–734. [Google Scholar] [CrossRef] [PubMed]
  45. Series, C. Synthesis of Fe3O4/Graphene Oxide/Pristine Graphene Composite and Its Application in Electrochemical Sensor. J. Phys. Conf. Ser. 2020, 1622, 4–10. [Google Scholar] [CrossRef]
  46. Feng, K.; Li, T.; Ye, C.; Gao, X.; Yue, X.; Ding, S.; Dong, Q.; Yang, M. A Novel Electrochemical Immunosensor Based on Fe3O4@Graphene Nanocomposite Modified Glassy Carbon Electrode for Rapid Detection of Salmonella in Milk. J. Dairy Sci. 2022, 105, 2108–2118. [Google Scholar] [CrossRef] [PubMed]
  47. Afzali, M.; Mostafavi, A.; Shamspur, T. A Novel Electrochemical Sensor Based on Magnetic Core@Shell Molecularly Imprinted Nanocomposite (Fe3O4@Graphene Oxide@MIP) for Sensitive and Selective Determination of Anticancer Drug Capecitabine. Arab. J. Chem. 2020, 13, 6626–6638. [Google Scholar] [CrossRef]
  48. Beigmoradi, F.; Beitollahi, H. Fe3O4/GO nanocomposite modified glassy carbon electrode as a novel voltammetric sensor for determination of bisphenol A. J. Electrochem. Sci. Eng. 2022, 12, 1205–1214. [Google Scholar] [CrossRef]
  49. Anshori, I.; Arya, K.; Kepakisan, A.; Rizalputri, L.N.; Althof, R.R.; Nugroho, A.E.; Siburian, R. Facile Synthesis of Graphene Oxide/Fe3O4 Nanocomposite for Electrochemical Sensing on Determination of Dopamine. Nanocomposites 2022, 8, 155–166. [Google Scholar] [CrossRef]
Figure 1. (A) The synthesized Fe3O4 is attracted to the magnet; (B) XRD pattern of Fe3O4, graphene, and the Fe3O4–graphene (1:2, w/w) composite.
Chemosensors 14 00036 g001
Figure 2. SEM images of (A) Fe3O4 and (B) the Fe3O4–graphene composite; elemental mapping distribution of (C) Fe3O4 and (D) the Fe3O4–graphene composite; EDS spectrum and its elemental composition of (E) Fe3O4 and (F) the Fe3O4–graphene composite.
Chemosensors 14 00036 g002
Figure 3. (A) TEM image of Fe3O4; (B) particle size distribution of Fe3O4; (C) TEM image of the Fe3O4–graphene composite; HRTEM image of (D) Fe3O4 and (E) Fe3O4–graphene composite; SAED pattern of (F) Fe3O4 and (G) the Fe3O4–graphene composite.
Chemosensors 14 00036 g003aChemosensors 14 00036 g003b
Figure 4. XPS analysis obtained from (A) Fe3O4–graphene composite; deconvolution spectra obtained from (B) C1s, (C) O1s, and (D) Fe2p.
Chemosensors 14 00036 g004
Figure 5. Voltammogram of 1 mM K3[Fe(CN6] in 0.1 M BRB (pH 5) at a scan rate of 150 mVs−1 measured with (A) the bare GCE, (B) the GCE/Fe3O4, (C) the GCE/graphene, and (D) the GCE/Fe3O4–graphene composite.
Chemosensors 14 00036 g005
Figure 6. DPV obtained at a scan rate of 100 mVs−1 for 2.7 × 10⁻⁴ M myristicin in 0.1 M BRB (pH 7) measured with (A) GCE/Fe3O4 in different compositions (0.5, 1, 2, and 3 mg/mL), (B) GCE/graphene in different compositions (0.5, 1, 2, and 3 mg/mL), and (C) GCE/Fe3O4–graphene in different ratios (1:1, 1:2, 1:3 w/w). (D) Bar chart depicting the obtained current response to myristicin oxidation at different Fe3O4–graphene composition ratios (1:1; 1:2; 1:3 w/w). (E) Voltammogram of 50 μM myristicin in BRB (pH 5) with and without N2 gas bubbling measured with GCE/Fe3O4–graphene. (F) Voltammogram of 2.7 × 10⁻⁴ M myristicin in 0.1 M BRB in the pH range of 4–8 measured with GCE/Fe3O4–graphene (1:2). (G) Relationship between pH and the potential and current responses of GCE/Fe3O4–graphene (1:2). (H) The obtained Nyquist plot of four different types of electrodes for the measurement of 5 mM K3[Fe(CN)6] in 0.1 M KCl. Inset: The equivalent Randles circuit; (I) mechanism reaction of myristicin oxidation.
Chemosensors 14 00036 g006aChemosensors 14 00036 g006b
Figure 7. (A) Voltammogram at a scan rate of 100 mVs−1 for detecting myristicin concentrations in the range of 1–100 μ M in 0.1 M BRB, measured with the proposed electrode. (B) Selectivity of the proposed electrode for the measurement of myristicin in the presence of interfering species (safrole, dopamine, ascorbic acid, and thiamine) in specific concentration ratios (1:1). (C) Repeatability of myristicin measurements at a concentration of 2.7 × 10⁻⁴ M in 0.1 M BRB at pH 5 using six electrodes. (D) Stability of myristicin measurements at 2.7 × 10⁻⁴ M in 0.1 M BRB at pH 5 across six consecutive measurements. (E) Voltammogram obtained from the measurements of myristicin in nutmeg extract using the standard addition method by spiking with myristicin in the concentration range of 10 to 50 μM.
Chemosensors 14 00036 g007
Table 1. Comparative performance analysis of the developed sensor and other electrochemical sensors in the literature.
Modified ElectrodeAnalyteTechniquesLinear RangeLOD/LOQSensitivityRef.
GCE/Fe3O4–grapheneMyristicinDPV10–100 μM0.19 μM/0.58 μM0.21509 μA μM−1This work
Fe3O4/GO/PG/GCEDopamineDPV5–50 μMLOD 3.37 μM1.97 µA µM−1[45]
Fe3O4@graphene/GCESalmonella in MilkDPV2.4 × 102 to 2.4 × 10⁷ cfu/mLLOD 2.4 × 10² cfu mL−16.499 µA cfu mL−1[46]
Fe3O4/Graphene/Carbon ClothH2O2Carbon Cloth10–110 μMLOD 4.79 μM0.037 µA µM−1 cm−2[27]
Fe3O4@graphene oxide@MIPCapecitabineDPV1.0–100.0 nMLOD 0.324 nM0.2883 µA µM−1[47]
Fe3O4/GO/GCEBisphenolCV1.0 × 10−7–5.0 × 10⁻⁵ MLOD 9.0 × 10⁻⁸ M.0.1508 µA µM−1[48]
GO/Fe3O4/GCEDopamineCV and DPV1–10 μMLOD 0.48 μM and LOQ 1.6 μM3.9279 µA µM−1[49]
Disclaimer/Publisher’s Note: The statements, opinions and data contained in all publications are solely those of the individual author(s) and contributor(s) and not of MDPI and/or the editor(s). MDPI and/or the editor(s) disclaim responsibility for any injury to people or property resulting from any ideas, methods, instructions or products referred to in the content.