Article

High-Intensity In Situ Fluorescence Imaging of MicroRNA in Cells Based on Y-Shaped Cascade Assembly

1
School of Biomedical Engineering (Suzhou), Division of Life Sciences and Medicine, University of Science and Technology of China, Hefei 230026, China
2
CAS Key Lab of Bio-Medical Diagnostics, Suzhou Institute of Biomedical Engineering and Technology, Chinese Academy of Sciences, Suzhou 215163, China
*
Authors to whom correspondence should be addressed.
Chemosensors 2025, 13(9), 343; https://doi.org/10.3390/chemosensors13090343
Submission received: 2 August 2025 / Revised: 27 August 2025 / Accepted: 5 September 2025 / Published: 6 September 2025
(This article belongs to the Special Issue Advancements of Chemosensors and Biosensors in China—2nd Edition)

Abstract

MicroRNAs are closely associated with various physiological and pathological processes, making their in situ fluorescence imaging crucial for functional studies and disease diagnosis. Current methods for the in situ fluorescence imaging of microRNA predominantly rely on linear signal amplification, resulting in relatively weak imaging signals. This study introduces a Y-shaped cascade assembly (YCA) method for high-brightness microRNA imaging in cells. Triggered by target microRNA, catalytic hairpin assembly forms double-stranded DNA (H). Through annealing and hybridization, a Y-shaped structure (P) is created. These components assemble into DNA nanofluorescent particles with multiple FAM fluorophores, significantly amplifying fluorescence signals. Optimization experiments revealed that a 1:1 ratio of P to H and an assembly time of 60 min yielded the best results. Under these optimal conditions, the resulting fluorescent nanoparticles exhibited diameters of 664.133 nm, as observed by DLS. In Huh7 liver cancer cells, YCA generated DNA nanoparticles with a fluorescence intensity increase of 117.77%, triggered by target microRNA-21, producing high-intensity fluorescence images and enabling qualitative detection of microRNA-21. The YCA in situ imaging method offers excellent imaging quality and high efficiency, providing a robust and reliable analytical tool for the diagnosis and monitoring of microRNA-related diseases.

Graphical Abstract

1. Introduction

MicroRNAs (miRNAs) are small non-coding RNA molecules, typically 18–24 nucleotides in length, that play a critical role in regulating gene expression [1,2,3]. As key negative regulators, miRNAs bind to target mRNAs, promoting their degradation or inhibiting translation, thus controlling essential biological processes such as cell proliferation, differentiation, and apoptosis [4,5,6]. Recent studies have demonstrated that miRNAs are closely associated with various physiological and pathological processes [7,8,9], so detecting miRNAs is vital for understanding their roles in disease onset and progression, as well as their potential diagnostic and therapeutic value [10,11,12], particularly in cancer [13,14,15], cardiovascular diseases [16,17], and neurological disorders [18,19]. According to the World Health Organization (WHO), all three diseases have high rates worldwide. In 2020, nearly 10 million people died from cancer, accounting for almost one-sixth of all deaths [20]; in 2022, 19.8 million people died from cardiovascular diseases, representing approximately 32% of all global deaths [21]; in 2021, over 3 billion people worldwide were affected by neurological disorders [22]. These statistics underscore the urgent need for advanced diagnostic and therapeutic tools, such as miRNA-based technologies, to address these global health challenges.
In situ nucleic acid imaging enables the direct detection of miRNAs within the cellular or tissue microenvironment without disrupting sample morphology or spatial distribution [23]. This approach allows the visualization of miRNA expression in its native context, facilitating studies on miRNA localization in different cell types and tissue structures [24]. It also helps elucidate miRNA functions in disease processes and provides a theoretical basis for clinical diagnostics and personalized treatments [25,26].
Traditional miRNA in situ imaging probes produce weak fluorescence signals, failing to meet imaging detection requirements [27]. For example, molecular beacons [28] and binary probes, which involve one probe recognizing one target to activate a single signal, can detect high-abundance nucleic acids; however, for low-abundance miRNAs, the generated fluorescence signal is relatively weak [29,30,31]. To enhance signal intensity and sensitivity, signal amplification techniques, such as catalytic hairpin assembly (CHA) [32,33], rolling circle amplification (RCA) [34,35], and hybridization chain reaction (HCR) [36,37], have gained attention [38,39,40]. Huang et al. [41] developed a system using manganese dioxide (MnO2) nanosheets loaded with a DNAzyme amplifier and CHA system. In living cells, glutathione (GSH) triggers the release of loaded components, and target miRNAs activate the DNAzyme, cleaving substrate hairpins to form a trigger sequence (TS). This sequence initiates CHA, producing a fluorescence signal and releasing the TS to induce additional CHA cycles, resulting in linearly amplified fluorescence signals. To further enhance fluorescence signal intensity and reduce detection challenges, researchers have developed cascaded signal amplification methods. Li et al. [42] introduced a palindromic hybridization chain reaction (PHCR) triggered by miRNA-21. Palindromic structures form long-chain polymers with short branches via CHA, which then self-assemble into cross-linked networks through lateral branches, achieving cascaded signal amplification for highly sensitive miRNA-21 fluorescence imaging. However, the stepwise assembly of long-chain polymers reduces efficiency. Thus, developing a high-efficiency miRNA in situ imaging technology with cascaded fluorescence signal amplification is of great significance.
This study introduces a Y-shaped cascade assembly (YCA) method, which combines double-stranded structures formed through annealing and Y-shaped structures formed via CHA. This approach assembles nanoscale fluorescent probes containing multiple fluorophores, achieving fluorophore aggregation and cascaded signal amplification for high-signal, high-efficiency miRNA in situ fluorescence imaging. The method demonstrates superior performance in miRNA in situ imaging, providing a reliable tool for studying miRNA functions and enabling early disease diagnosis.

2. Materials and Methods

2.1. Chemicals and Apparatus

Tris-HCl (Molecular Biology Grade, DNase & RNase free, pH 8.0), 1× TE buffer (Molecular Biology Grade, 10 mmol/L Tris-HCl, 0.1 mmol/L EDTA, pH 8.0), and 50× TAE buffer (Molecular Biology Grade, 2 mol/L Tris-Acetate, 50 mmol/L EDTA, pH 8.0–8.6) were purchased from Sangon Biotech (Shanghai, China) Co., Ltd. Magnesium chloride (MgCl2, 99.99% metals basis) was obtained from Shanghai Macklin Biochemical (Shanghai, China) Co., Ltd. Regular Agarose (Molecular Biology Grade, ash content ≤ 1.0%, moisture ≤ 10%) was sourced from Shanghai Baygene Biotechnologies (Shanghai, China) Co., Ltd. 10,000× Goldview nucleic acid stain (Molecular Biology Grade) was acquired from Yeasen Biotechnology (Shanghai, China) Co., Ltd. Lipofectamine 3000 (Reagent Grade) was purchased from Thermo Fisher Scientific Inc (Waltham, MA, USA). Hoechst 33,342 staining solution (Molecular Biology Grade) was obtained from Wuhan Servicebio Technology (Wuhan, China) Co., Ltd. Huh7 liver cancer cells were obtained from the Cell Bank of the Chinese Academy of Sciences (Shanghai, China). All other chemical reagents were of analytical grade, and ultrapure water was used for all experiments.
The Gel Doc XR + Gel Imaging System (Bio-Rad Laboratories, Hercules, CA, USA) was used to scan agarose gels after electrophoresis. The Dimension ICON Atomic Force Microscope (Bruker Corporation, Billerica, MA, USA) characterized the assemblies formed in experiments. The F97 Pro Fluorescence Spectrophotometer (Shanghai Lengguang Technology Co., Ltd., Shanghai, China) measured fluorescence spectra. The RX50RFL Fluorescence Microscope (Ningbo Sunny Instruments Co., Ltd., Ningbo, China) observed assembly solutions. The Nikon A1 + Confocal Microscope (Nikon Corporation, Tokyo, Japan) was employed for cellular fluorescence imaging. The AUW220D Electronic Balance (Shimadzu Corporation, Kyoto, Japan) weighed samples.
All DNA sequences used in the experiments were synthesized and purified by high-performance liquid chromatography (HPLC) by Sangon Biotech (Shanghai, China) Co., Ltd. Details are provided in Table 1.

2.2. DNA Sequence Preprocessing

DNA powder was dissolved in TE buffer to prepare a 100 μmol/L solution. Each DNA strand was then diluted to 2 μmol/L using Tris-HCl buffer (50 mmol/L, containing 5 mmol/L MgCl2, pH 8.0), incubated at 95 °C for 5 min, and annealed. The solution was kept at room temperature for 2 h before use.

2.3. Assembly of DNA Nanoparticles

Equal volumes of 2 μmol/L P1, P2, and P3 were mixed, incubated at 95 °C for 10 min, and cooled to 20 °C at a rate of 0.1 °C/s to form assembly P. Separately, 2 μmol/L H1 and H2 were heated at 95 °C for 10 min, cooled to 65 °C at a rate of 0.01 °C/s, then rapidly cooled to room temperature and maintained for 2 h. Finally, P, H1, and H2 were mixed in equal proportions to achieve a final concentration of 0.33 μmol/L for each, combined with varying concentrations of target miRNA-21, and incubated for 60 min to obtain the DNA assembly solution.

2.4. Agarose Gel Electrophoresis

A 1% agarose gel was prepared and placed in an electrophoresis tank containing 1× TAE buffer. Each well was loaded with 0.33 μmol/L DNA assembly solution mixed with loading buffer at a 5:1 ratio. Electrophoresis was performed at 100 V for 60 min. The gel was then removed and scanned using a gel imaging analysis system.

2.5. Atomic Force Microscopy (AFM) Imaging

A 2 μL aliquot of 0.1 nM DNA nanoparticle solution was deposited onto a clean silicon wafer surface and air-dried. The surface was gently rinsed with distilled water, and excess water was removed using filter paper. After air-drying the mica substrate again, imaging was performed using an atomic force microscope. AFM imaging was performed using a Bruker Dimension Icon system. OLTESPA-R3 probes (Bruker Nano, Inc., Billerica, MA, USA) with a nominal spring constant of 2 N/m were used. Cantilever calibration was conducted using alignment station method to determine the working position. The system was operated in tapping mode to minimize sample damage. AFM imaging was performed on three DNA assembly samples to ensure their consistency. Raw AFM data were processed using NanoScope Analysis software for background correction and flattening. Images were acquired at a resolution of 512 × 512 pixels with a scan rate of 0.977 Hz to balance image quality and acquisition time.

2.6. Fluorescence Performance Testing of DNA Assemblies

The target miRNA-21 concentration was set at 20 nmol/L, with incubation times of 0, 2, 5, 10, 20, 30, 60, and 120 min. The fluorescence spectra of the DNA assembly solution were measured. Alternatively, the incubation time was fixed at 60 min, and miRNA-21 concentrations were set at 0, 0.1, 1, 5, 10, 20, 50, and 100 nmol/L. The fluorescence spectra of the DNA assembly solution were recorded. The excitation wavelength was 492 nm, and the emission wavelengths were scanned from 500 nm to 650 nm; both the excitation slit size and the emission slit size were 10 nm.
A 10 μL aliquot of 33 nmol/L hairpin H2 solution, double-stranded assembly H solution, or DNA assembly solution was applied to a clean glass slide and covered with a coverslip. Images were obtained using the RX50RFL Fluorescence Microscope (Ningbo Sunny Instruments Co., Ltd., Ningbo, China).
In the fluorescence images, the fluorescence spots were first identified and outlined through contour detection. The grayscale values of all pixels within each individual fluorescence spot contour were summed and averaged to determine the grayscale value of that spot. Subsequently, the grayscale values of all fluorescence spots were plotted as a distribution to obtain the range and peak of the fluorescence intensity distribution. All analyses were performed using Python 3.8.

2.7. In Situ Cellular Imaging of miRNA-21

The process of conducting YCA assembly experiments in cells is shown in Figure 1. Huh7 cells were seeded in confocal dishes and cultured overnight in a cell incubator. A 100 μL volume of DMEM medium containing 4 μL Lipofectamine 3000 and 0.5 μL of 20 μmol/L nucleic acid for transfection was added, followed by a 2 h incubation. The supernatant was removed, and cells were washed three times with PBS (10 mmol/L, pH 7.4). Next, 1 mL of 100-fold diluted Hoechst 33342 was added and incubated for 10 min. The solution was removed, and cells were washed three times with PBS. Imaging was performed using a confocal laser scanning microscope.

3. Results and Discussion

3.1. Principle of Y-Shaped Cascade Assembly

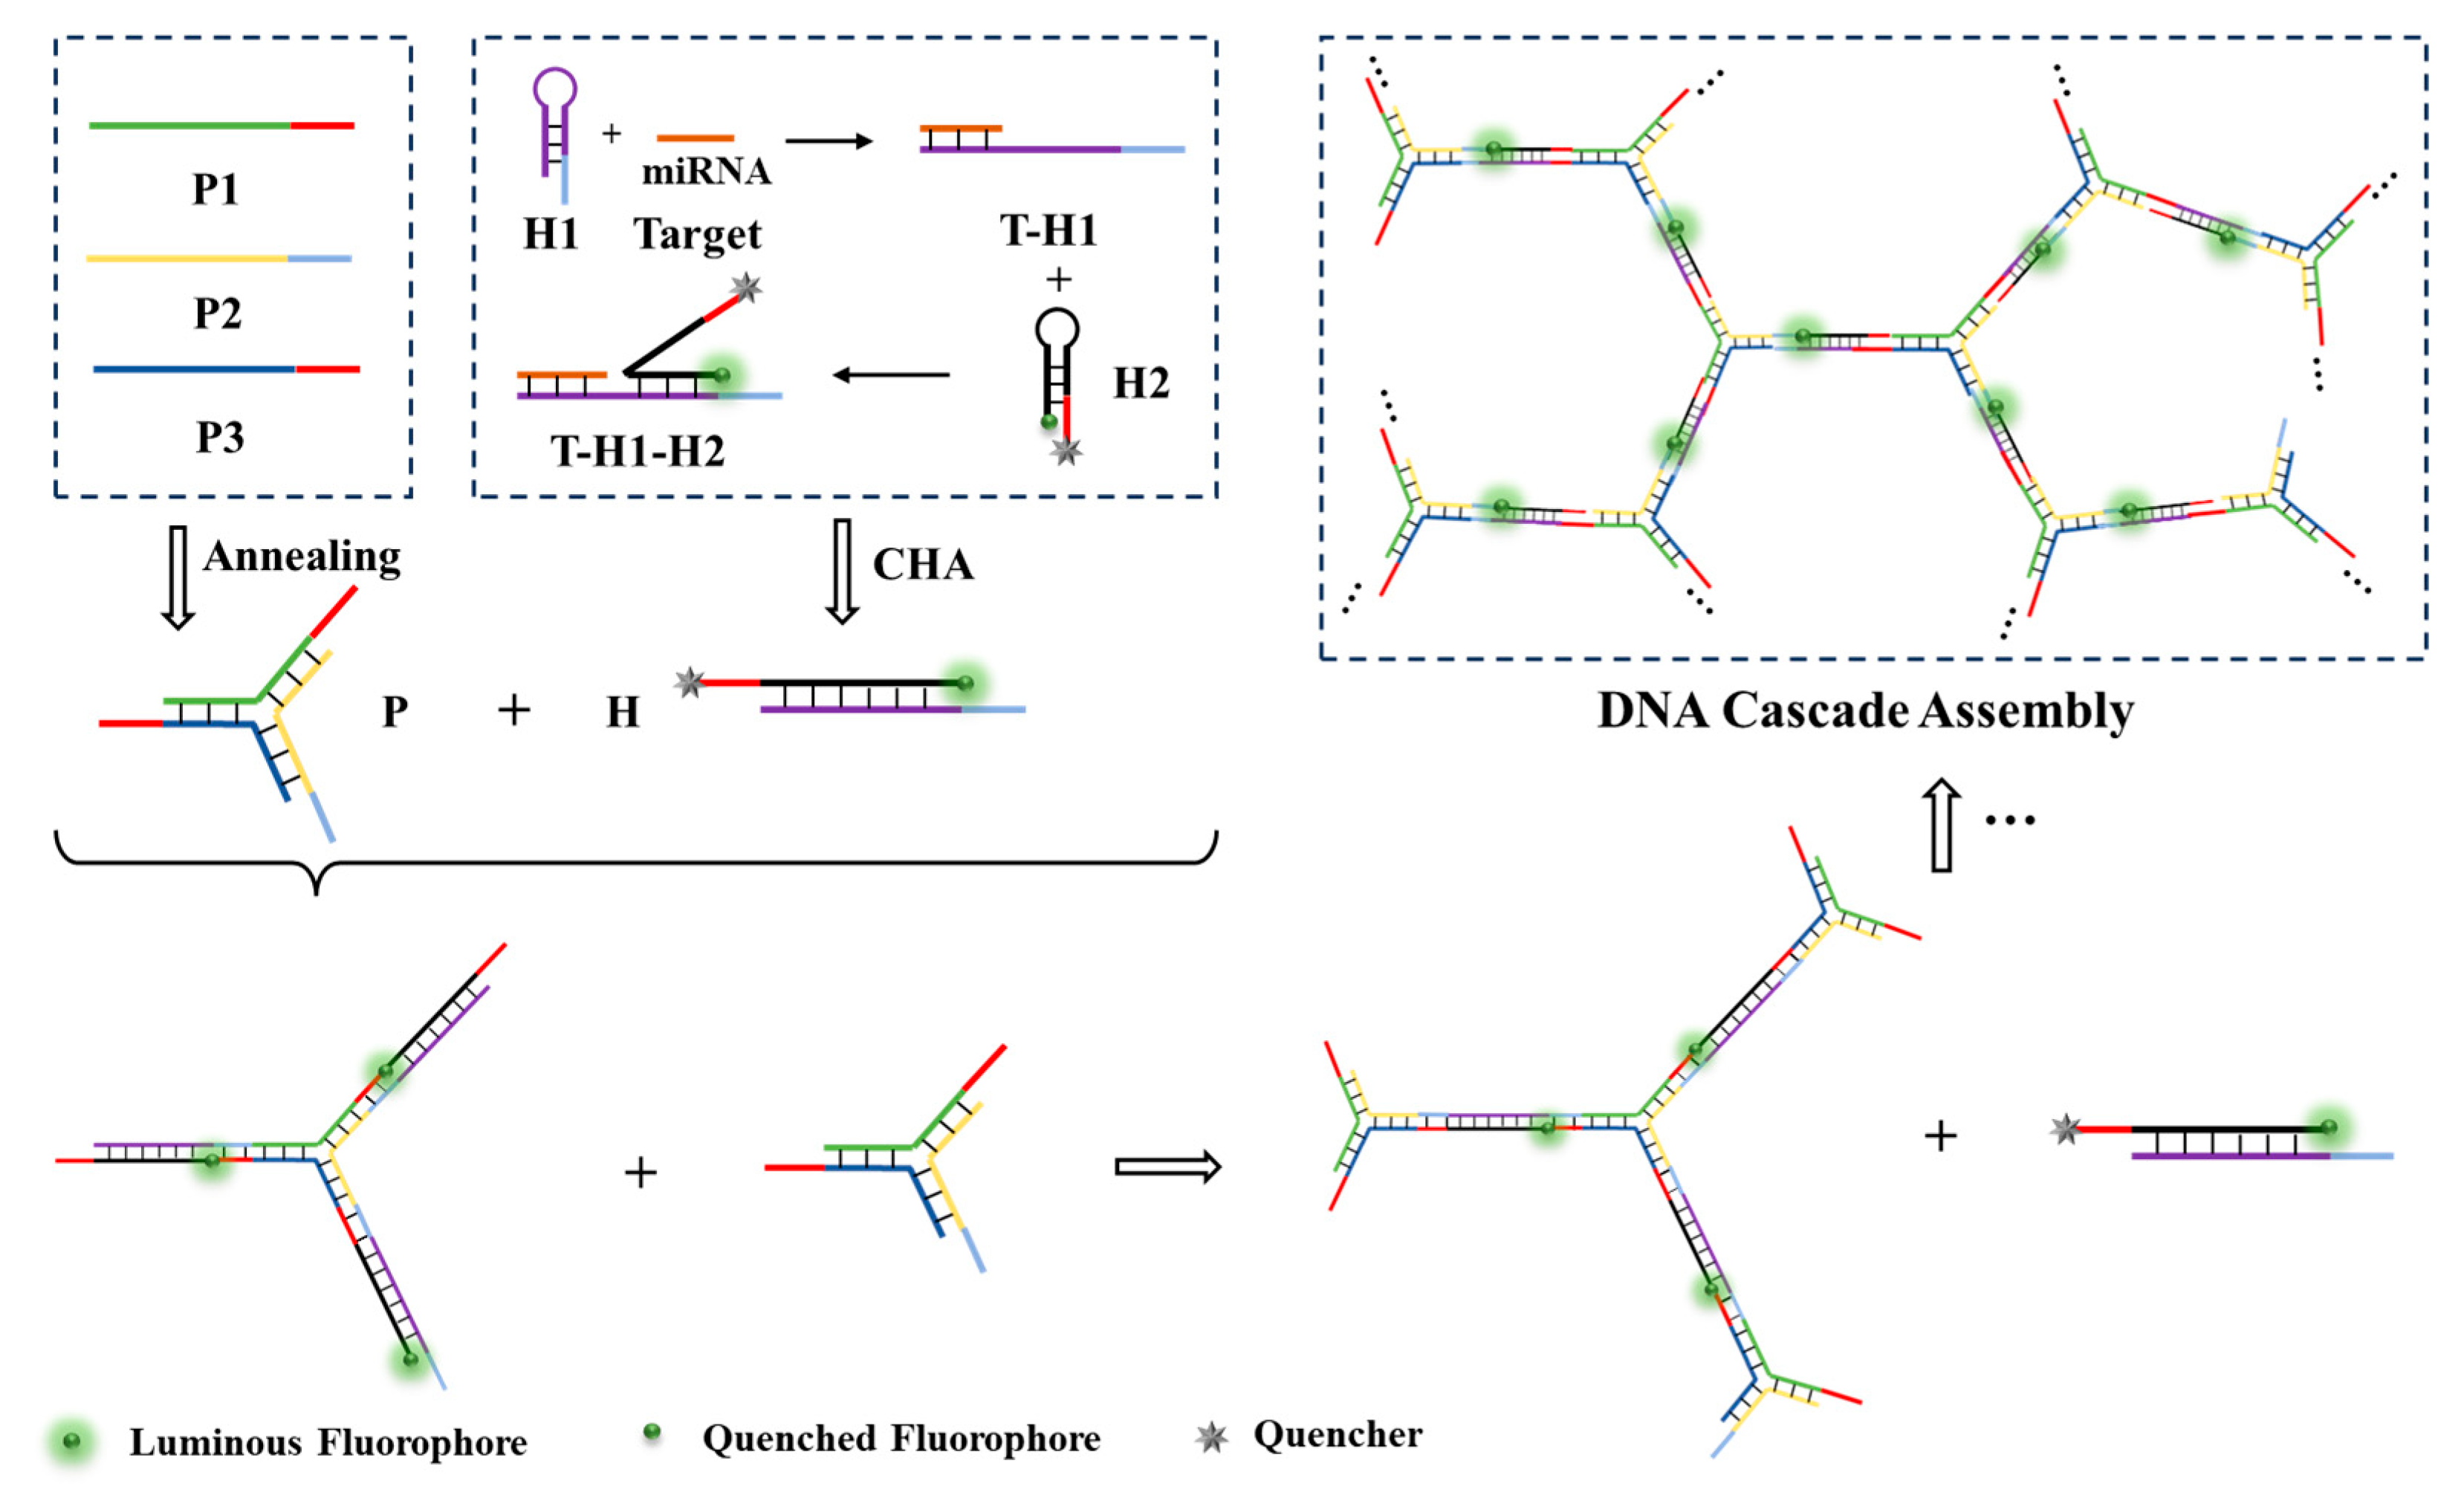
The mechanism of miRNA in situ fluorescence signal amplification via Y-shaped cascade assembly is illustrated in Figure 2. Single-stranded P1, P2, and P3 are designed for partial complementary hybridization and annealed to form a trimeric component P. Hairpin structures H1 and H2 are designed such that the 5′ end of H1 is complementary to the target miRNA sequence, while the remaining portion is complementary to H2. H2 is modified with a FAM fluorophore at one end and a Dabcyl quencher at the other, causing FAM fluorescence to be quenched due to the proximity in the hairpin structure. In the presence of target miRNA, miRNA hybridizes with H1, opening its hairpin structure to form a T-H1 complex. The exposed sticky end of H1 hybridizes with the sticky end of H2, forming a T-H1-H2 complex and releasing miRNA through a displacement reaction, resulting in a double-stranded component H. After forming the double-stranded structure, the distance between FAM and Dabcyl increases, restoring FAM fluorescence. Ultimately, component P cross-links with component H to form a macromolecular network, assembling into DNA particles. These particles contain multiple fluorophores, generating a significantly amplified fluorescence signal for high-intensity in situ miRNA imaging.

3.2. Optimization of Assembly Conditions

Agarose gel electrophoresis was used to characterize monomers before assembly and the solution after assembly. The migration positions of electrophoresis bands in the gel reveal the molecular weight, conformation, and potential secondary structure features of nucleic acids. As shown in Figure 3a,b, before pretreatment, monomers P1, P2, P3, and H2 exhibited multiple bands. After pretreatment, each monomer displayed a single band. This indicates that, without pretreatment, monomers formed unexpected complex folded conformations, hindering their movement in the gel and resulting in multiple bands. After annealing pretreatment, all monomers adopted a uniform expected conformation, facilitating subsequent experiments.
To optimize experimental conditions and enhance assembly efficiency, the ratio of components P to H and assembly time were adjusted, with assembly outcomes evaluated using gel electrophoresis. As shown in Figure 3c, component P displayed a single band, component H showed two bands, and the PH assembly exhibited multiple bands with slower migration rates. This suggests that monomers P1, P2, and P3 fully assembled into trimeric component P, while monomers H1 and H2 mostly formed double-stranded component H. Components P and H successfully assembled into a higher molecular weight PH assembly with a broad molecular weight distribution. Band patterns across different lanes indicated that P:H ratios of 3:2 and 1:1 produced similar bands, with more distribution at higher molecular weights compared to other ratios. For ease of experimental calculation and operation, a 1:1 ratio was selected for subsequent experiments. As shown in Figure 3d, with increasing assembly time, the overall migration rate of bands from the assembly solution slowed. Bands at 60 and 120 min were nearly identical, indicating that the optimal assembly time is 60 min, as the assembly process was essentially complete by then. Therefore, subsequent experiments adopted a 1:1 P:H ratio and a 60 min assembly time. In contrast, the incubation time for the PHCR method is 3 h [42], which indicates that the YCA method has a higher assembly efficiency.
The buffer used in this study contains magnesium ions, which significantly enhance the self-assembly of DNA [43]. Recently, alternative strategies have emerged to promote DNA self-assembly. Postigo et al. [44] utilized azide-functionalized polyamines to facilitate DNA assembly and achieve functionalization of DNA nanostructures, requiring a 24 h annealing process in a thermal cycler. In contrast, the annealing assembly of component P in this study takes only 1.5 h, with subsequent assembly of P and H requiring just 1 h, demonstrating far higher assembly efficiency compared to polyamine-promoted strategies. Additionally, polyamine groups exhibit certain toxicity, and their biocompatibility requires further improvement. Rodriguez et al. [45] investigated the effects of various metal ions on DNA assembly, finding that Ca2+, Ba2+, Na+, K+, and Li+ ions all enable successful DNA assembly, with monovalent ions (Na+, K+, and Li+) promoting structures with over 10-fold greater resistance to nuclease degradation, thereby enhancing the biological stability of assembled DNA structures. In future work, we plan to explore different metal ions to further improve the quality and effectiveness of the YCA method.

3.3. Characterization of DNA Assemblies

DNA fluorescent particles were assembled using the optimal ratio and assembly time, followed by characterization via agarose gel electrophoresis and atomic force microscopy (AFM). As shown in Figure 4a, gel electrophoresis bands revealed that component P migrated more slowly than monomers P1, P2, and P3, while component H migrated more slowly than monomers H1 and H2. Most bands of the PH assembly were positioned above those of components P and H. This indicates successful formation of components P and H, which assembled into a DNA assembly with a higher molecular weight. As shown in Figure 4b, AFM images displayed circular spots of varying sizes, confirming the successful construction of DNA particles. The particles exhibited non-uniform sizes due to different growth rates in the reaction buffe. Using the Particle Analysis function in NanoScope Analysis 1.5 software, the AFM images were processed and quantified, yielding an average particle dimension of 380.173 ± 201.776 nm.
The size of the DNA assembly in solution was measured using DLS. As shown in Figure 4c, after Gaussian fitting, the average particle size measured by DLS was 664.133 nm, which is larger than the average size measured by AFM. This is because AFM measurements are conducted in a dry state, while DLS measurements are performed in solution, leading to a larger hydrated hydrodynamic size.

3.4. Fluorescence Performance Analysis of YCA Method

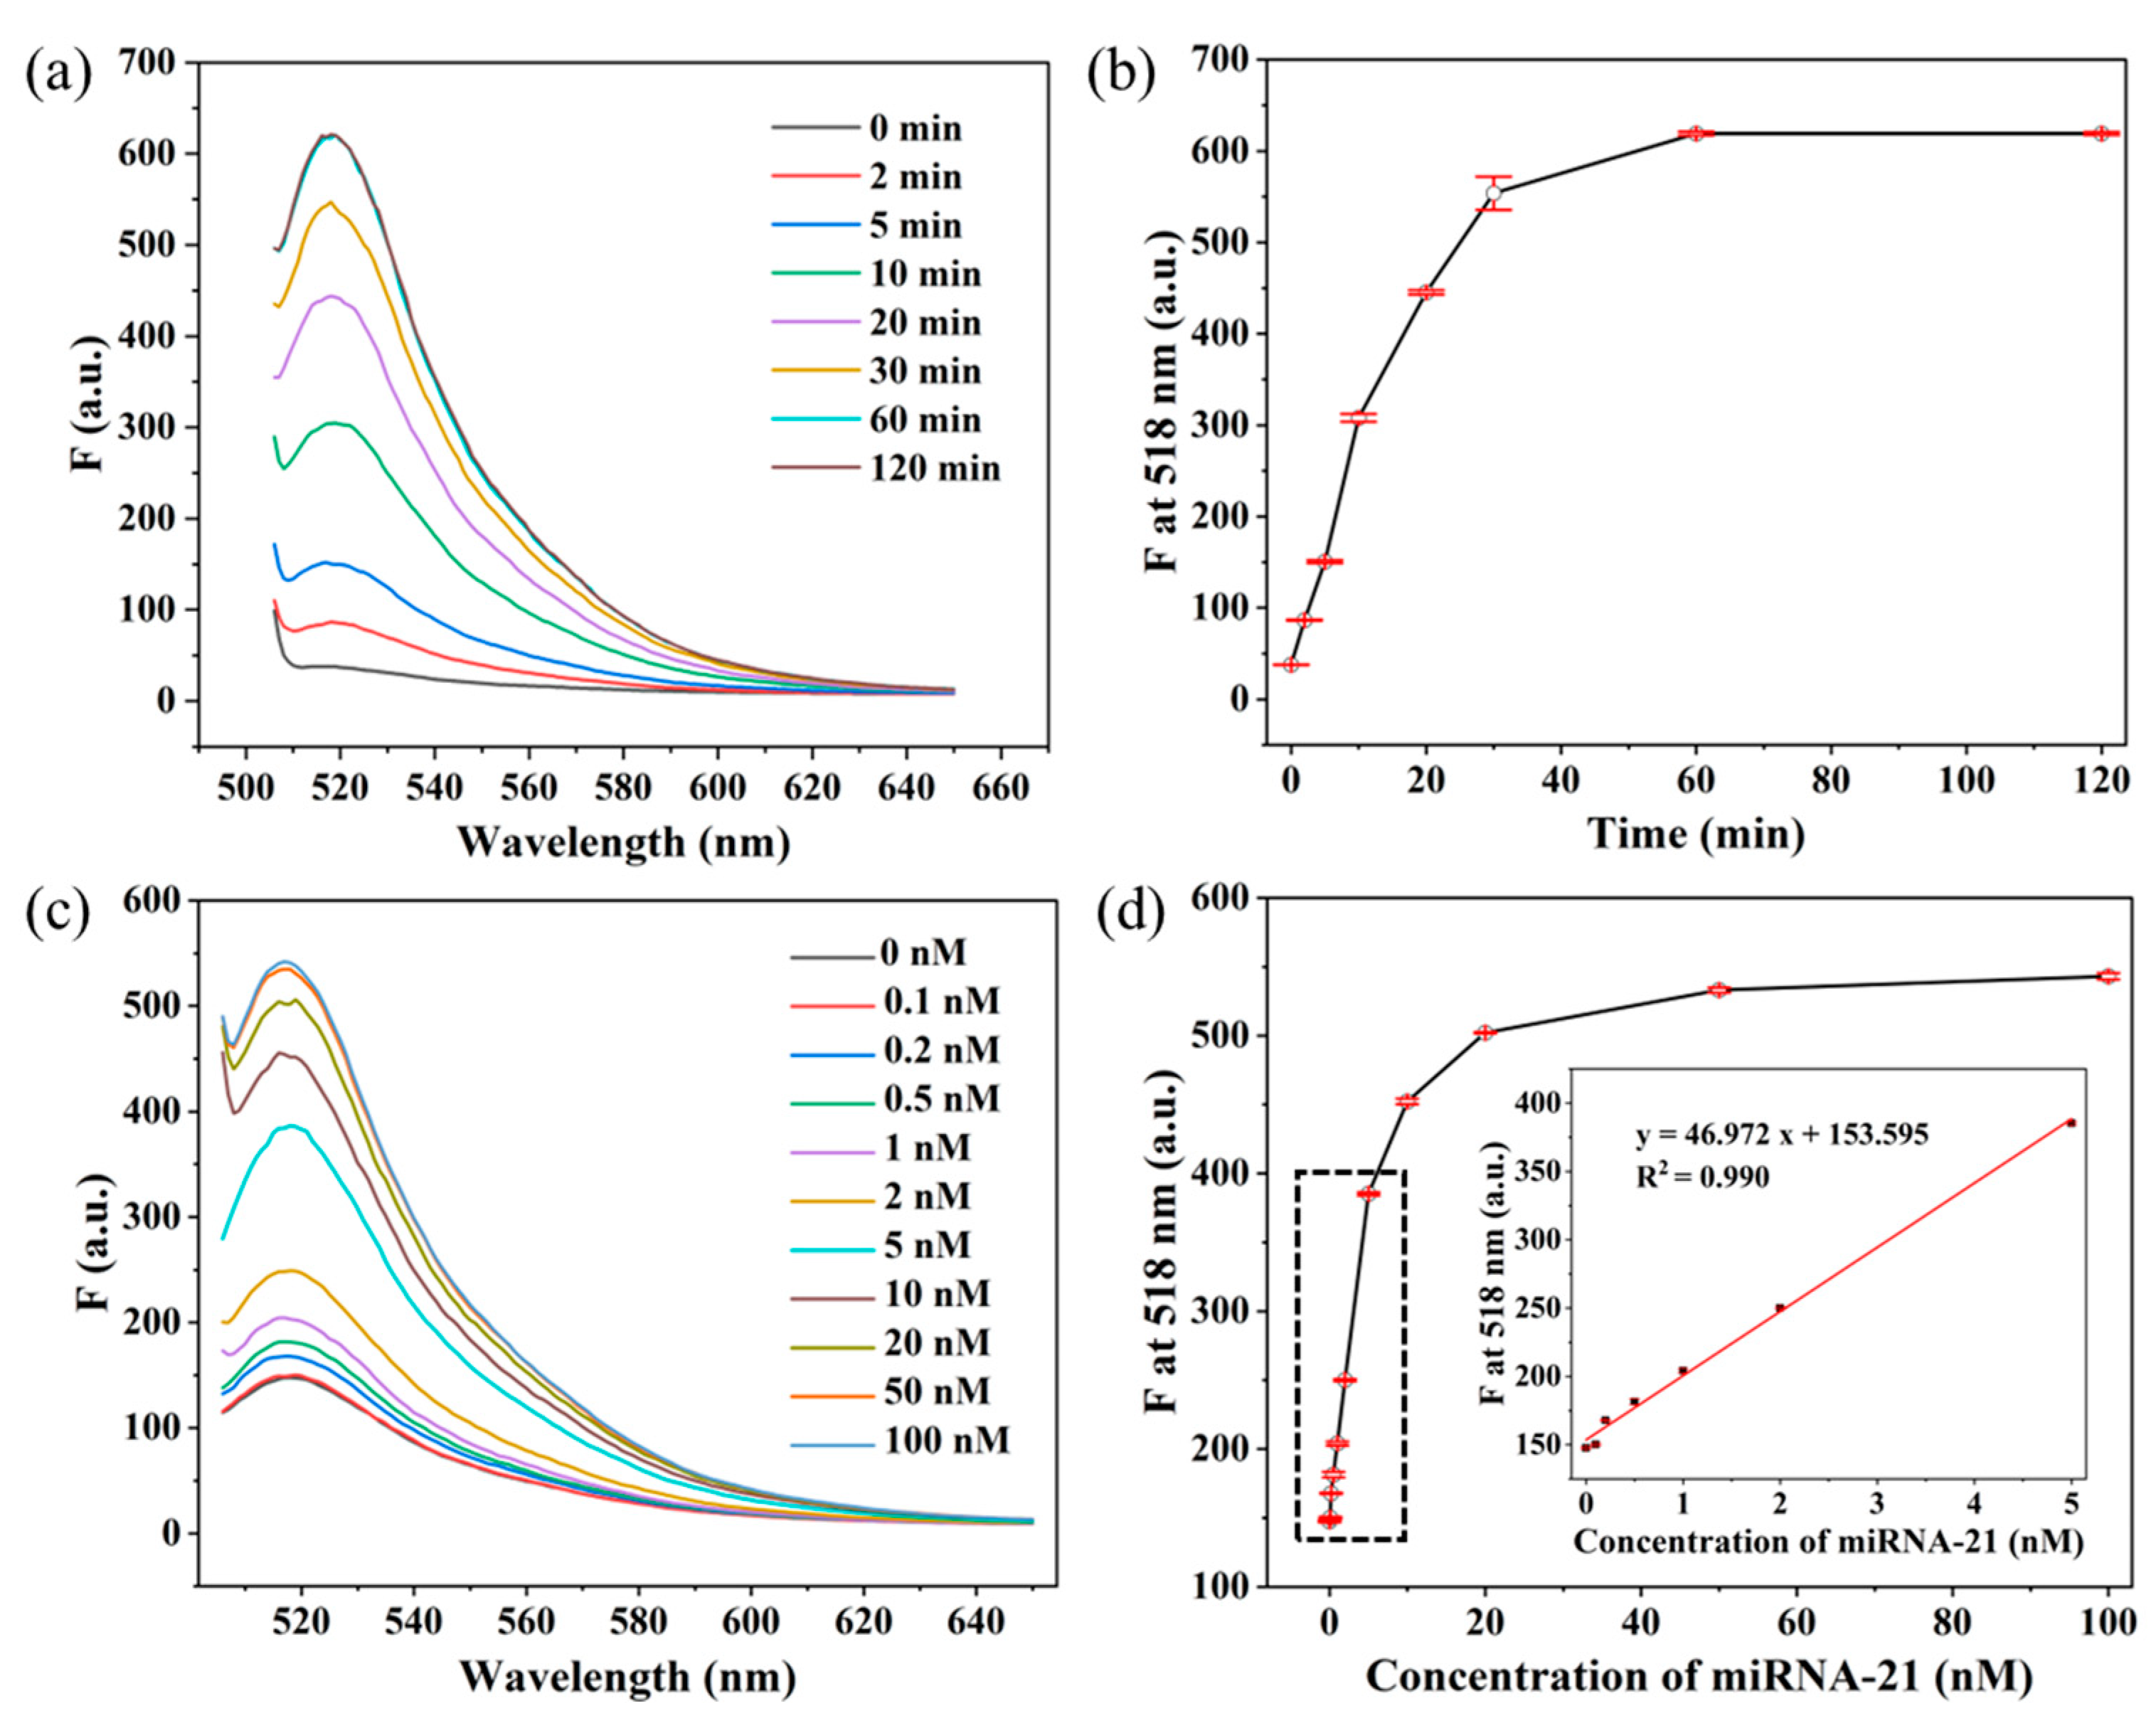
Fluorescence spectra of the DNA assembly solution were obtained using a fluorescence spectrometer at different assembly times and varying concentrations of target miRNA-21 to assess changes in fluorescence intensity. As shown in Figure 5a,b, fluorescence spectra were measured at different time points during DNA assembly. The fluorescence intensity at 518 nm increased with time, stabilizing after 60 min. This indicates that at 0 min, the hairpin structure H2 remained closed, with FAM fluorescence quenched by the nearby Dabcyl group, resulting in minimal fluorescence. As assembly time increased, H2 gradually opened and assembled with other monomers into DNA particles, increasing the number of unquenched FAM fluorophores and elevating fluorescence intensity at 518 nm. After 60 min, fluorescence intensity plateaued, confirming that DNA assembly was essentially complete, validating 60 min as the optimal assembly time. Fluorescence spectra were also measured under varying miRNA-21 concentrations, as shown in Figure 5c,d. Higher miRNA-21 concentrations led to increased fluorescence intensity at 518 nm, indicating higher DNA assembly efficiency with greater miRNA-21 concentrations. A linear fitting was performed between the concentration of 0–5 nM miRNA-21 and the fluorescence value at 518 nm, yielding a slope of 46.972. The fluorescence values of 20 blank samples (DNA assembly systems with 0 nM miRNA) were measured, resulting in a mean of 146.320 and a standard deviation (σ) of 1.423. Therefore, the limit of detection (LOD) was calculated as 3σ/slope, which equals 90.884 pM.
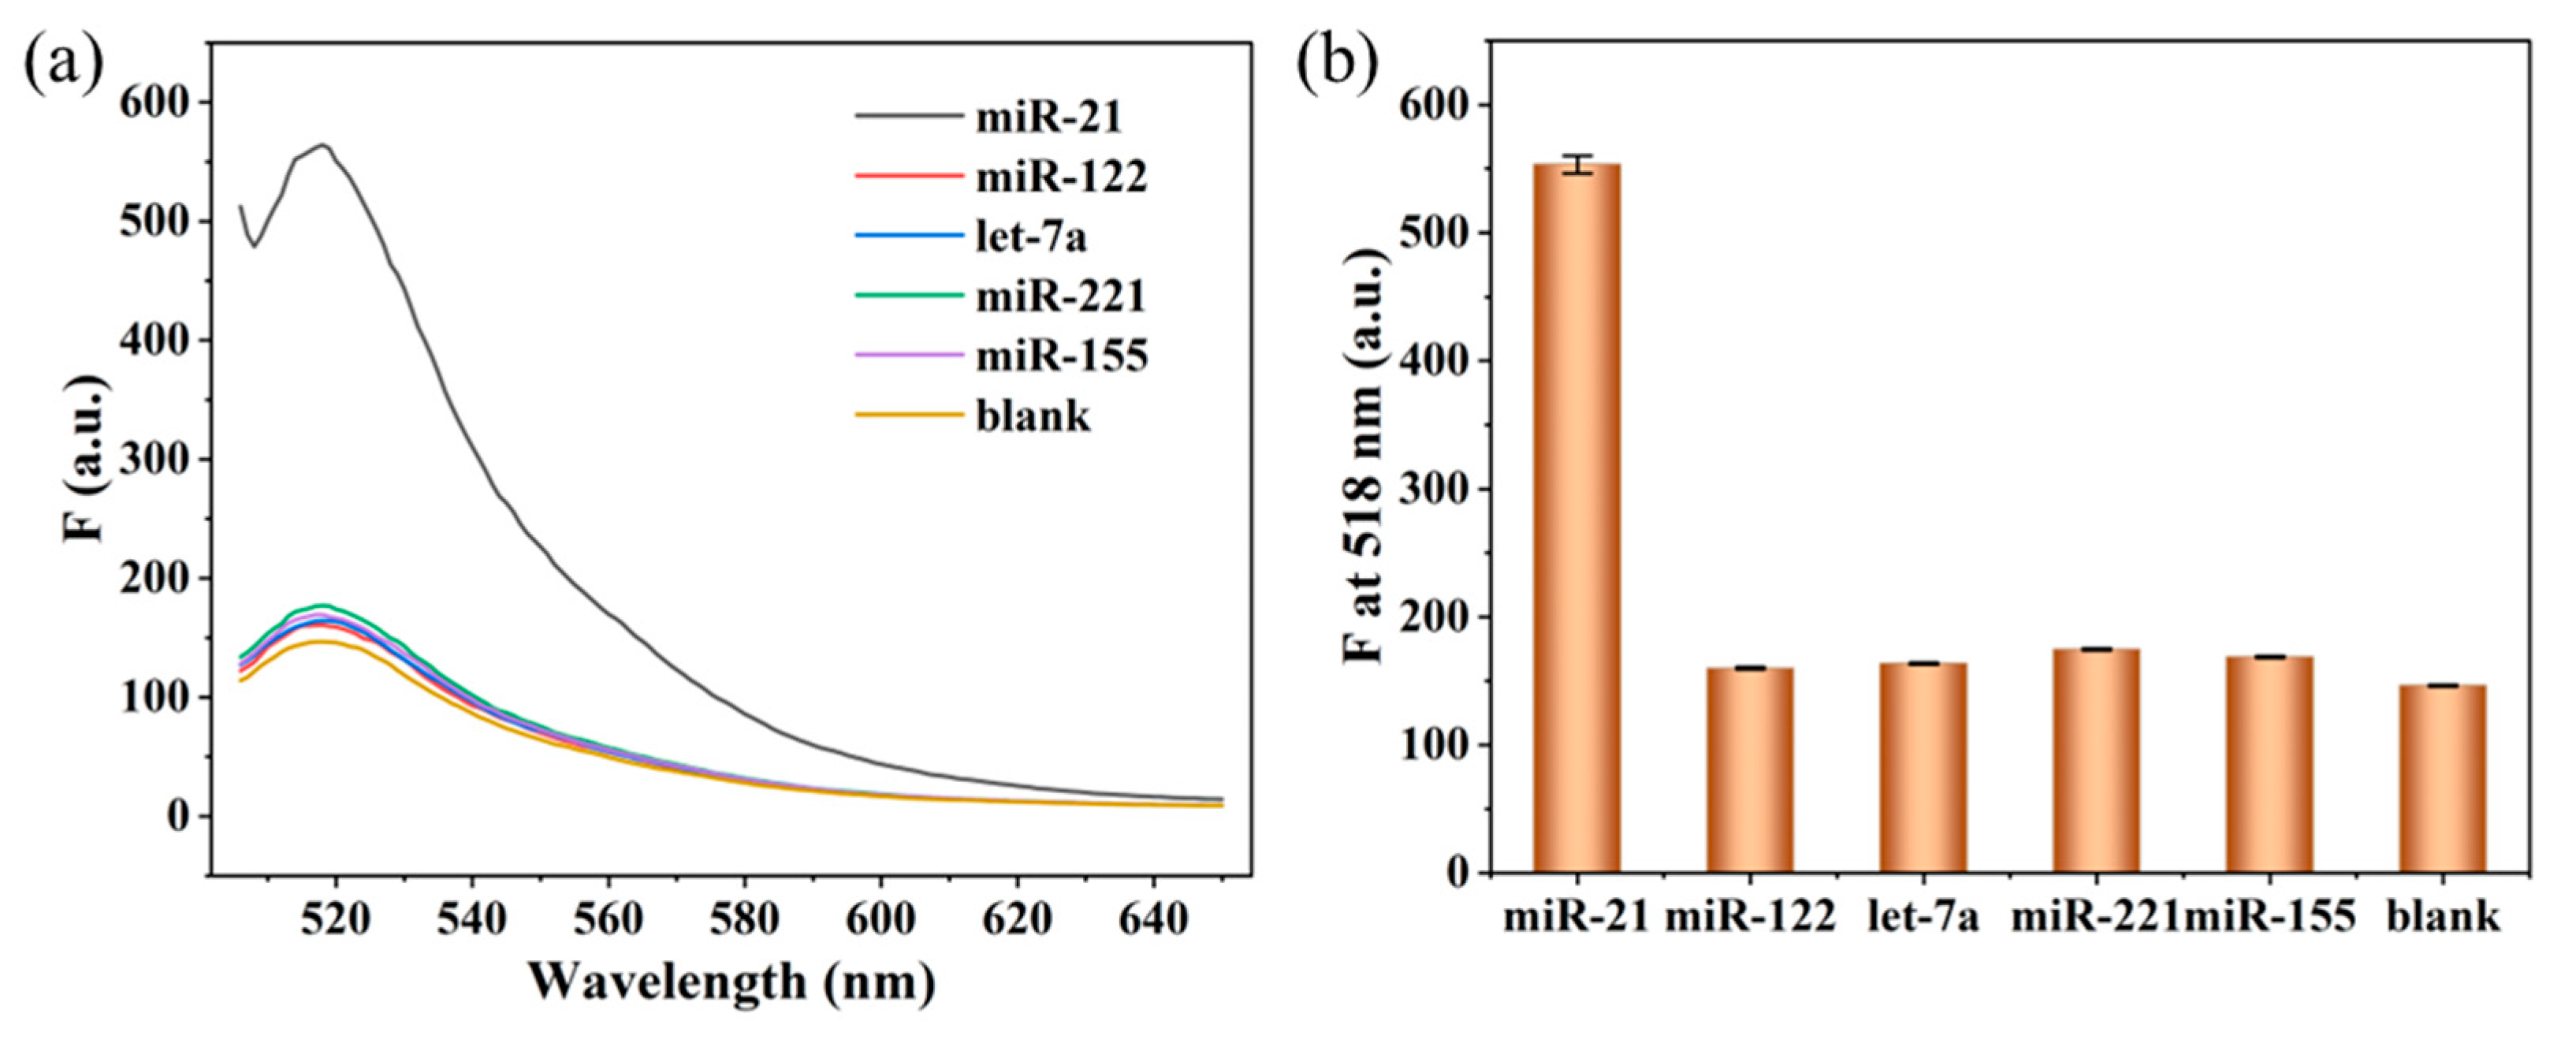
Different miRNAs were added to the DNA assembly system, and their fluorescence was measured after the reaction to evaluate the specificity of the YCA method. As shown in Figure 6, the system with miRNA-21 exhibited significantly higher fluorescence intensity, while the fluorescence intensities of miRNA-122, let-7a, miRNA-221, and miRNA-155 were similar to that of the blank control group. This indicates that only miRNA-21 can trigger the YCA reaction, demonstrating that the YCA method has good specificity.
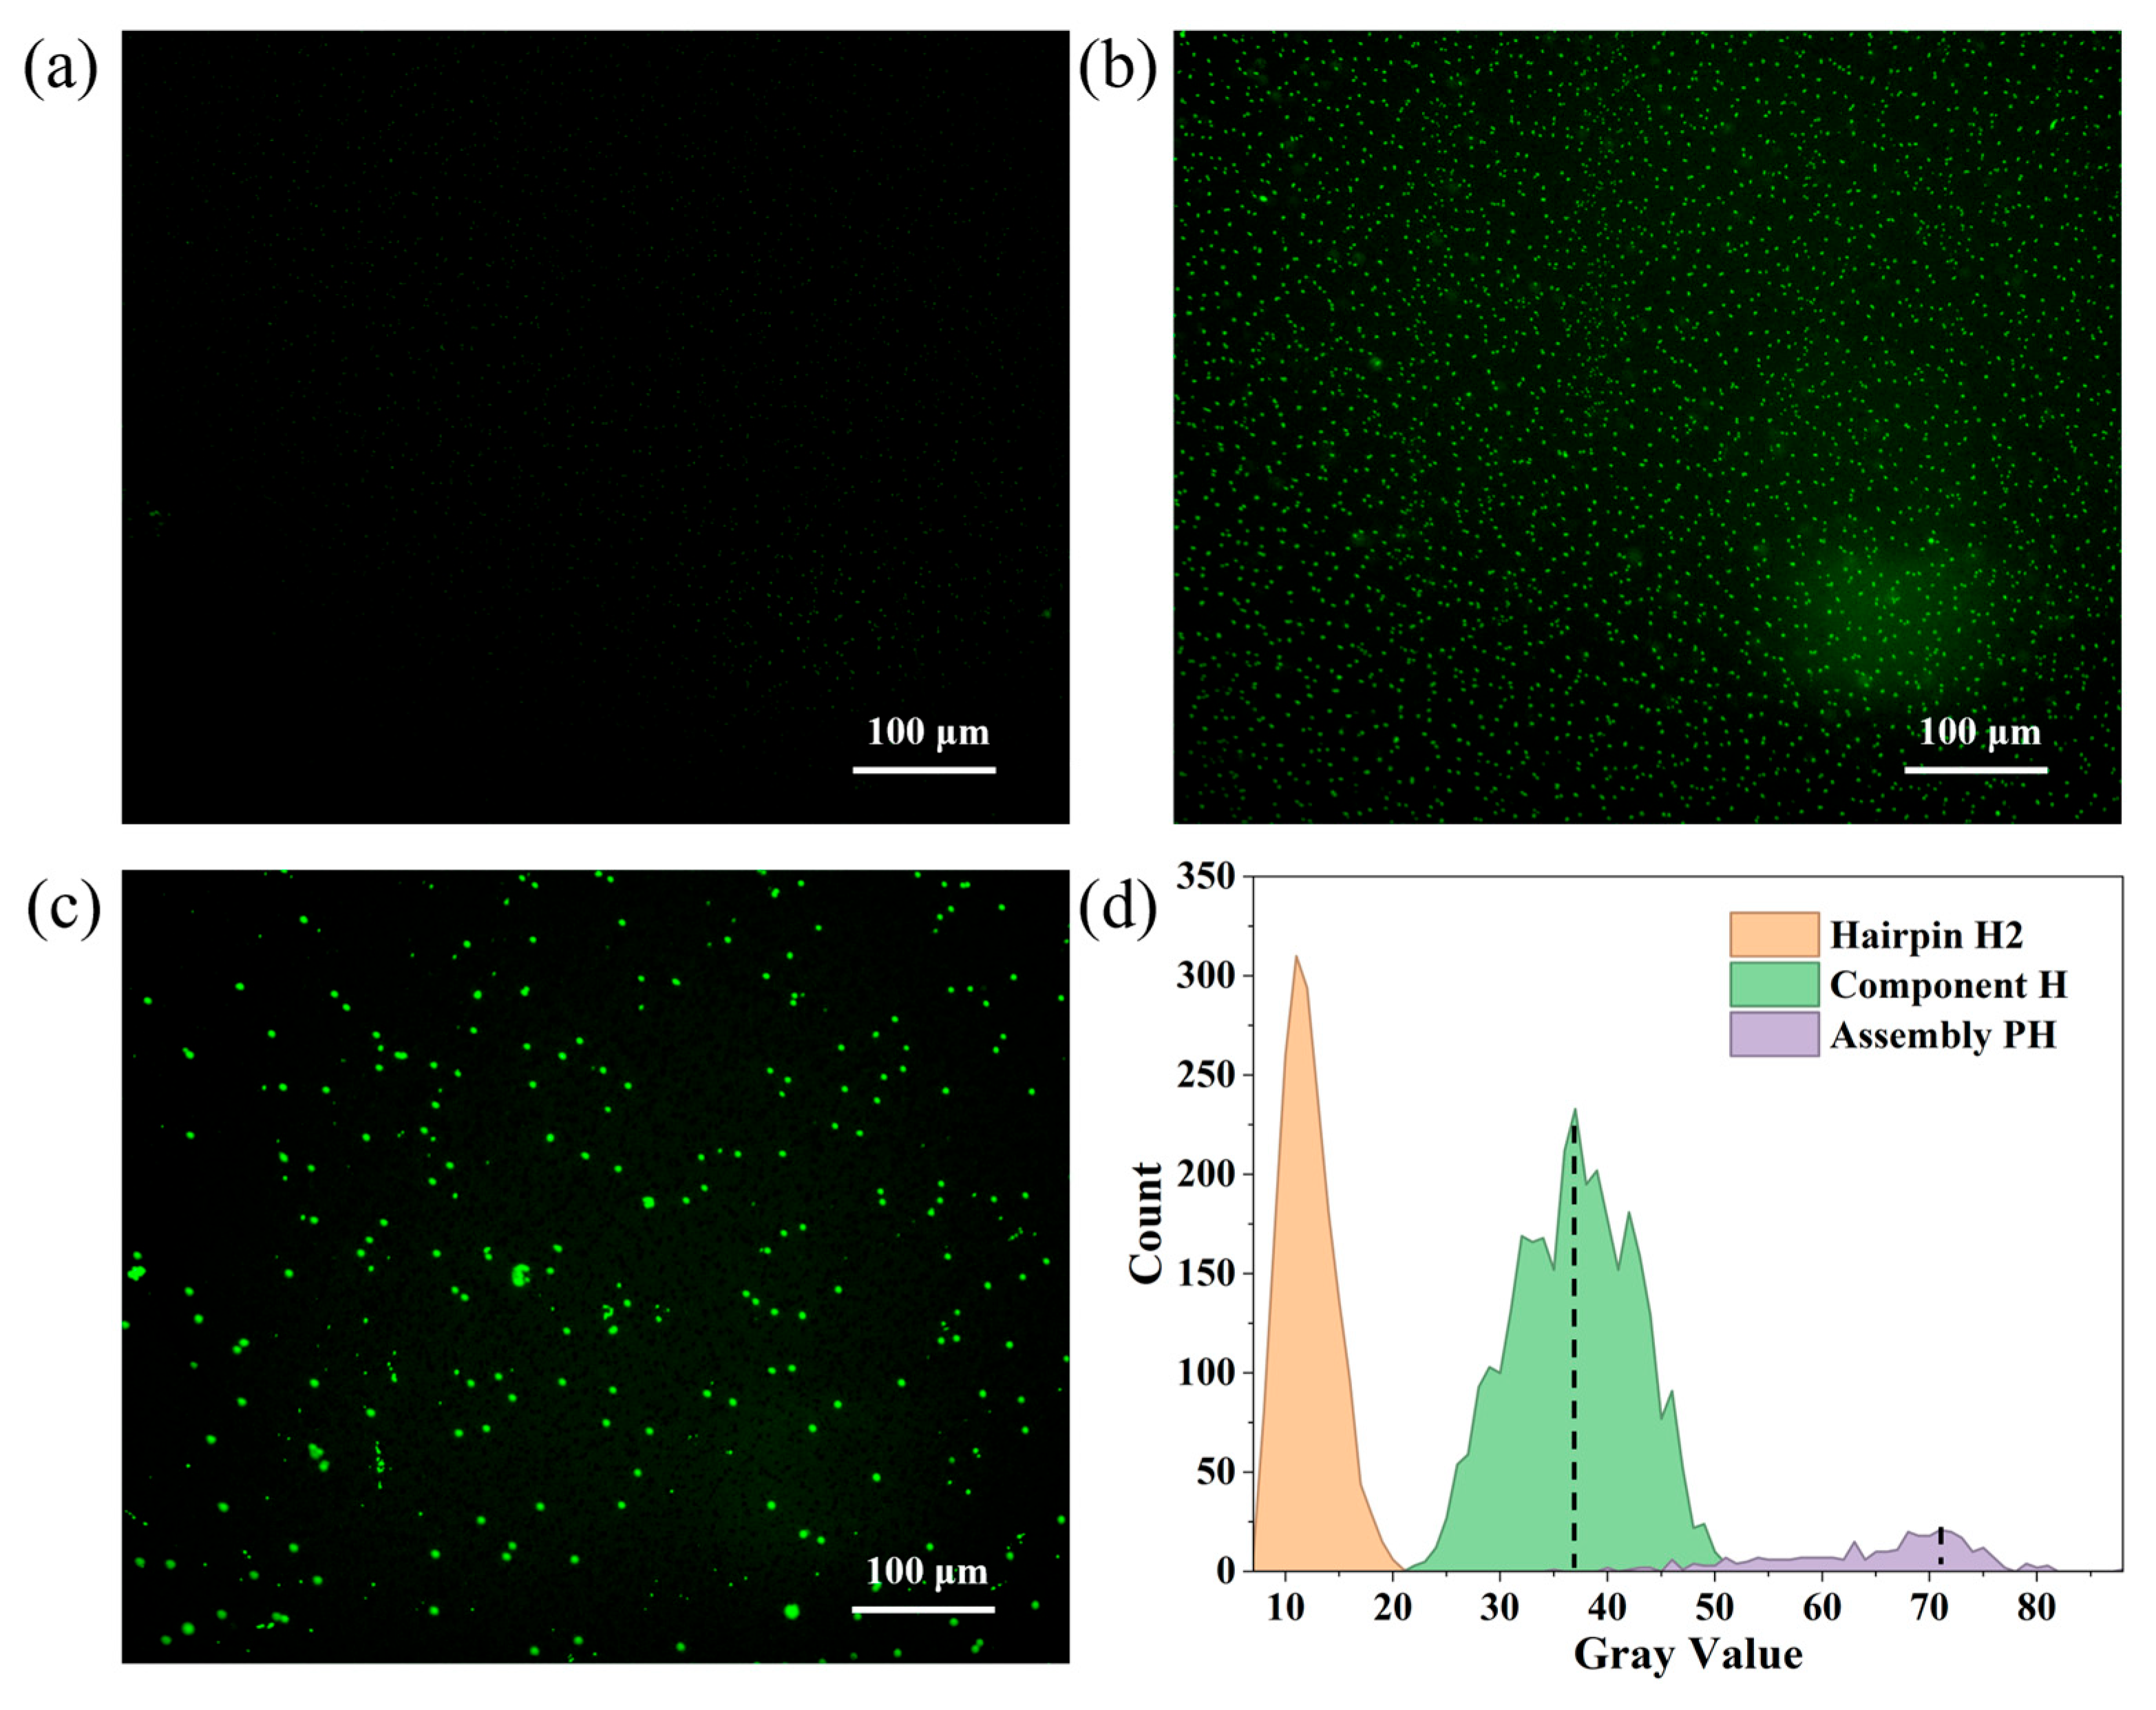
Fluorescence images of the DNA assembly solution were captured using a fluorescence microscope to evaluate its in vitro imaging performance. As shown in Figure 7, fluorescence images of FAM in different states were recorded. The hairpin structure H2 exhibited minimal fluorescence. The double-stranded component H displayed numerous fluorescence spots with low brightness. In contrast, the assembled structure PH showed fewer fluorescence spots with higher brightness. These results confirm that in the hairpin state, the FAM fluorophore on H2 is quenched. Upon forming a double-stranded structure, FAM moves away from the quenching group, restoring fluorescence. Additionally, since PH assembles multiple monomers, it exhibits fewer fluorescence spots with enhanced intensity. Grayscale analysis of the fluorescence spots, as shown in Figure 5d, revealed that component H’s fluorescence spots had a lower grayscale range with a peak value of 37. The PH assembly showed a higher grayscale peak value of 71, a 91.89% increase compared to component H, indicating a significant enhancement in fluorescence signal intensity.

3.5. In Situ Fluorescence Imaging in Cells of miRNA-21

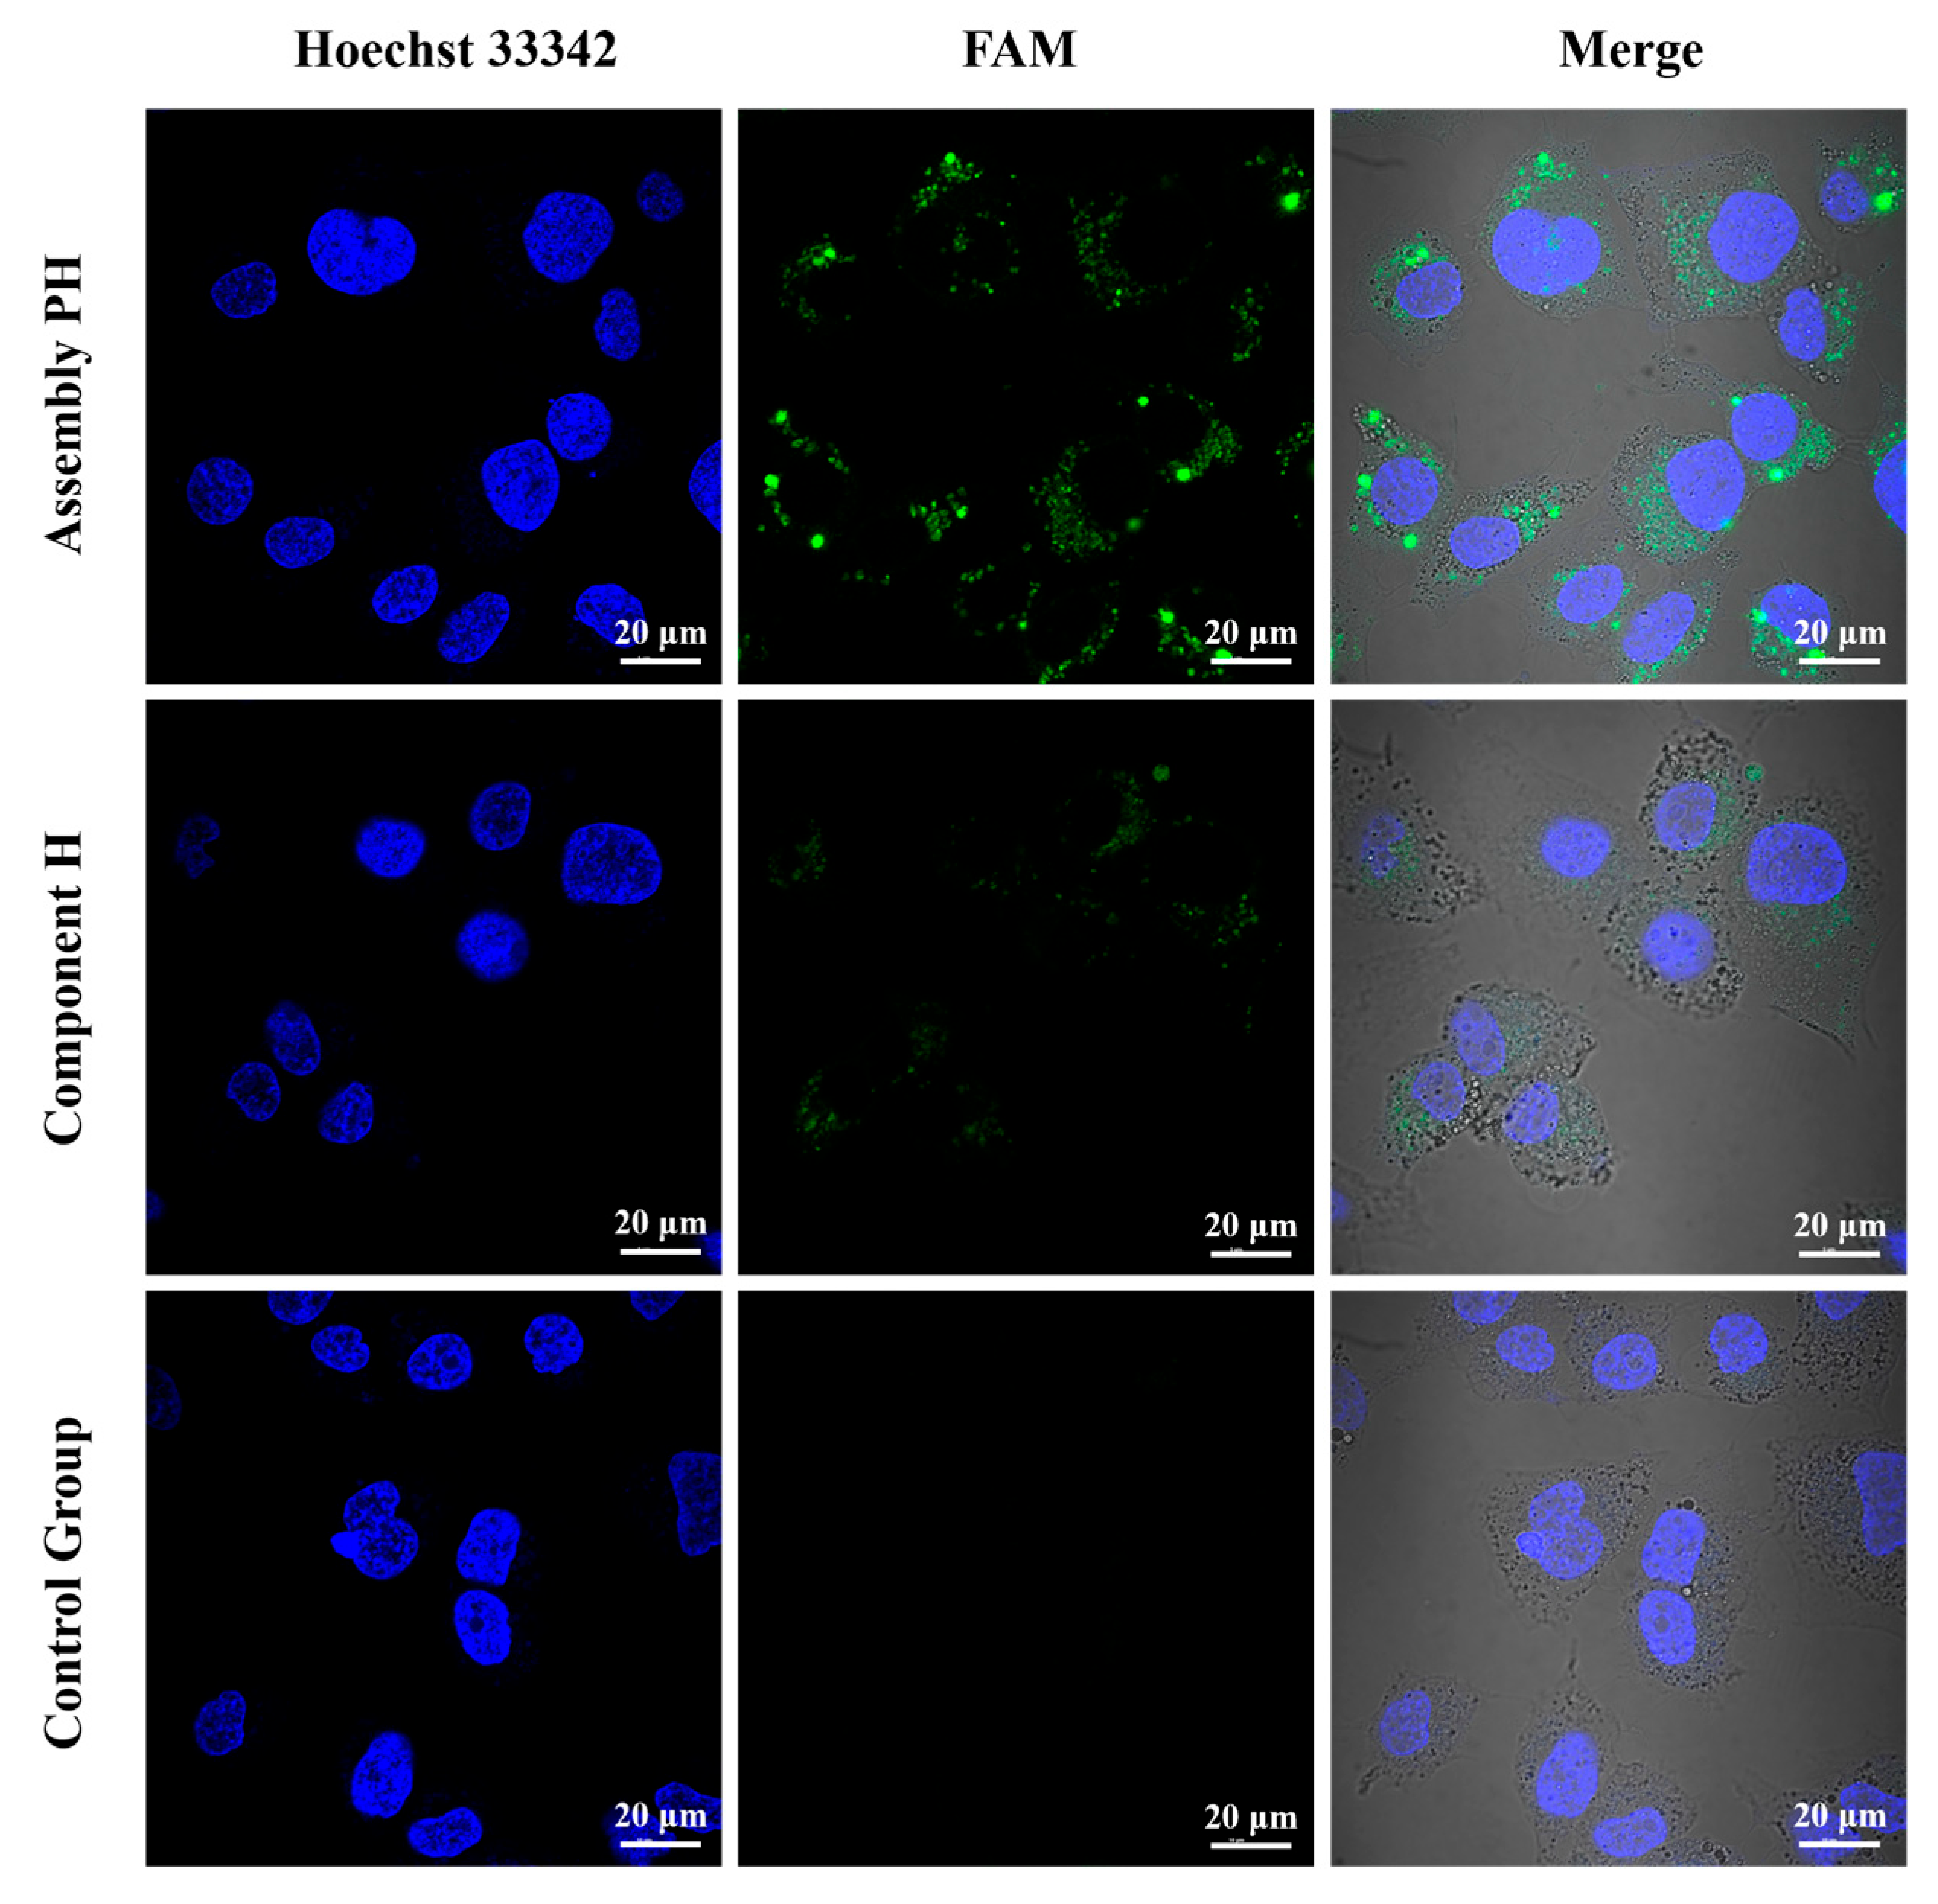
Different assembly monomers were transfected into Huh7 liver cancer cells. By observing intracellular fluorescence intensity, the method’s effectiveness for in situ miRNA-21 fluorescence imaging was evaluated. As shown in Figure 8, the PH assembly exhibited strong fluorescence in cells, while component H showed weaker fluorescence. These findings indicate that individual fluorophores have poor imaging performance in cells, whereas multiple fluorophores assembled into particles yield superior imaging results. The DSA-CHA method successfully formed DNA fluorescent particles in Huh7 cells triggered by target miRNA-21, demonstrating effective miRNA in situ fluorescence imaging capability.
Gray value analysis of FAM fluorescence was performed for each cell experimental group in Figure 8. The distribution range of FAM grayscale values for the assembled PH in Huh7 cells was from 2000 to 35,000, with Gaussian fitting revealing a mean value of 9328.22 (Figure 9a). Statistical analysis indicated that the entire image of the PH assembly (Figure 8) contained 12.5 cells and 424 FAM fluorescent spots, resulting in an average of 34 fluorescent spots per cell. In contrast, the grayscale value distribution range for component H in Huh7 cells was from 2000 to 15,000, with Gaussian fitting showing a mean value of 4283.49 (Figure 9b). The entire image of component H (Figure 8) exhibited 8.5 cells and 209 FAM fluorescent spots, yielding an average of 25 fluorescent spots per cell. Simple calculations indicated that the grayscale value for the PH assembly was 117.77% higher than that of component H, and the number of fluorescent spots per cell increased by 36%.
Furthermore, we calculated the signal-to-noise ratio (SNR) using the formula (signal-background noise)/background noise. The average grayscale value of the control group images from Figure 8 served as background noise, resulting in a noise level of 134.53. Given that the mean signal for the PH assembly was 9328.22, its SNR was calculated to be 68.34. In contrast, the SNR for the PHCR method was only 14.99 [42], indicating a significant enhancement in the SNR of the YCA method presented in this study. The YCA method in Huh7 cells produced a greater number of more intense fluorescent spots, as well as a higher SNR, thereby significantly improving the imaging quality of miRNA-21 in situ.
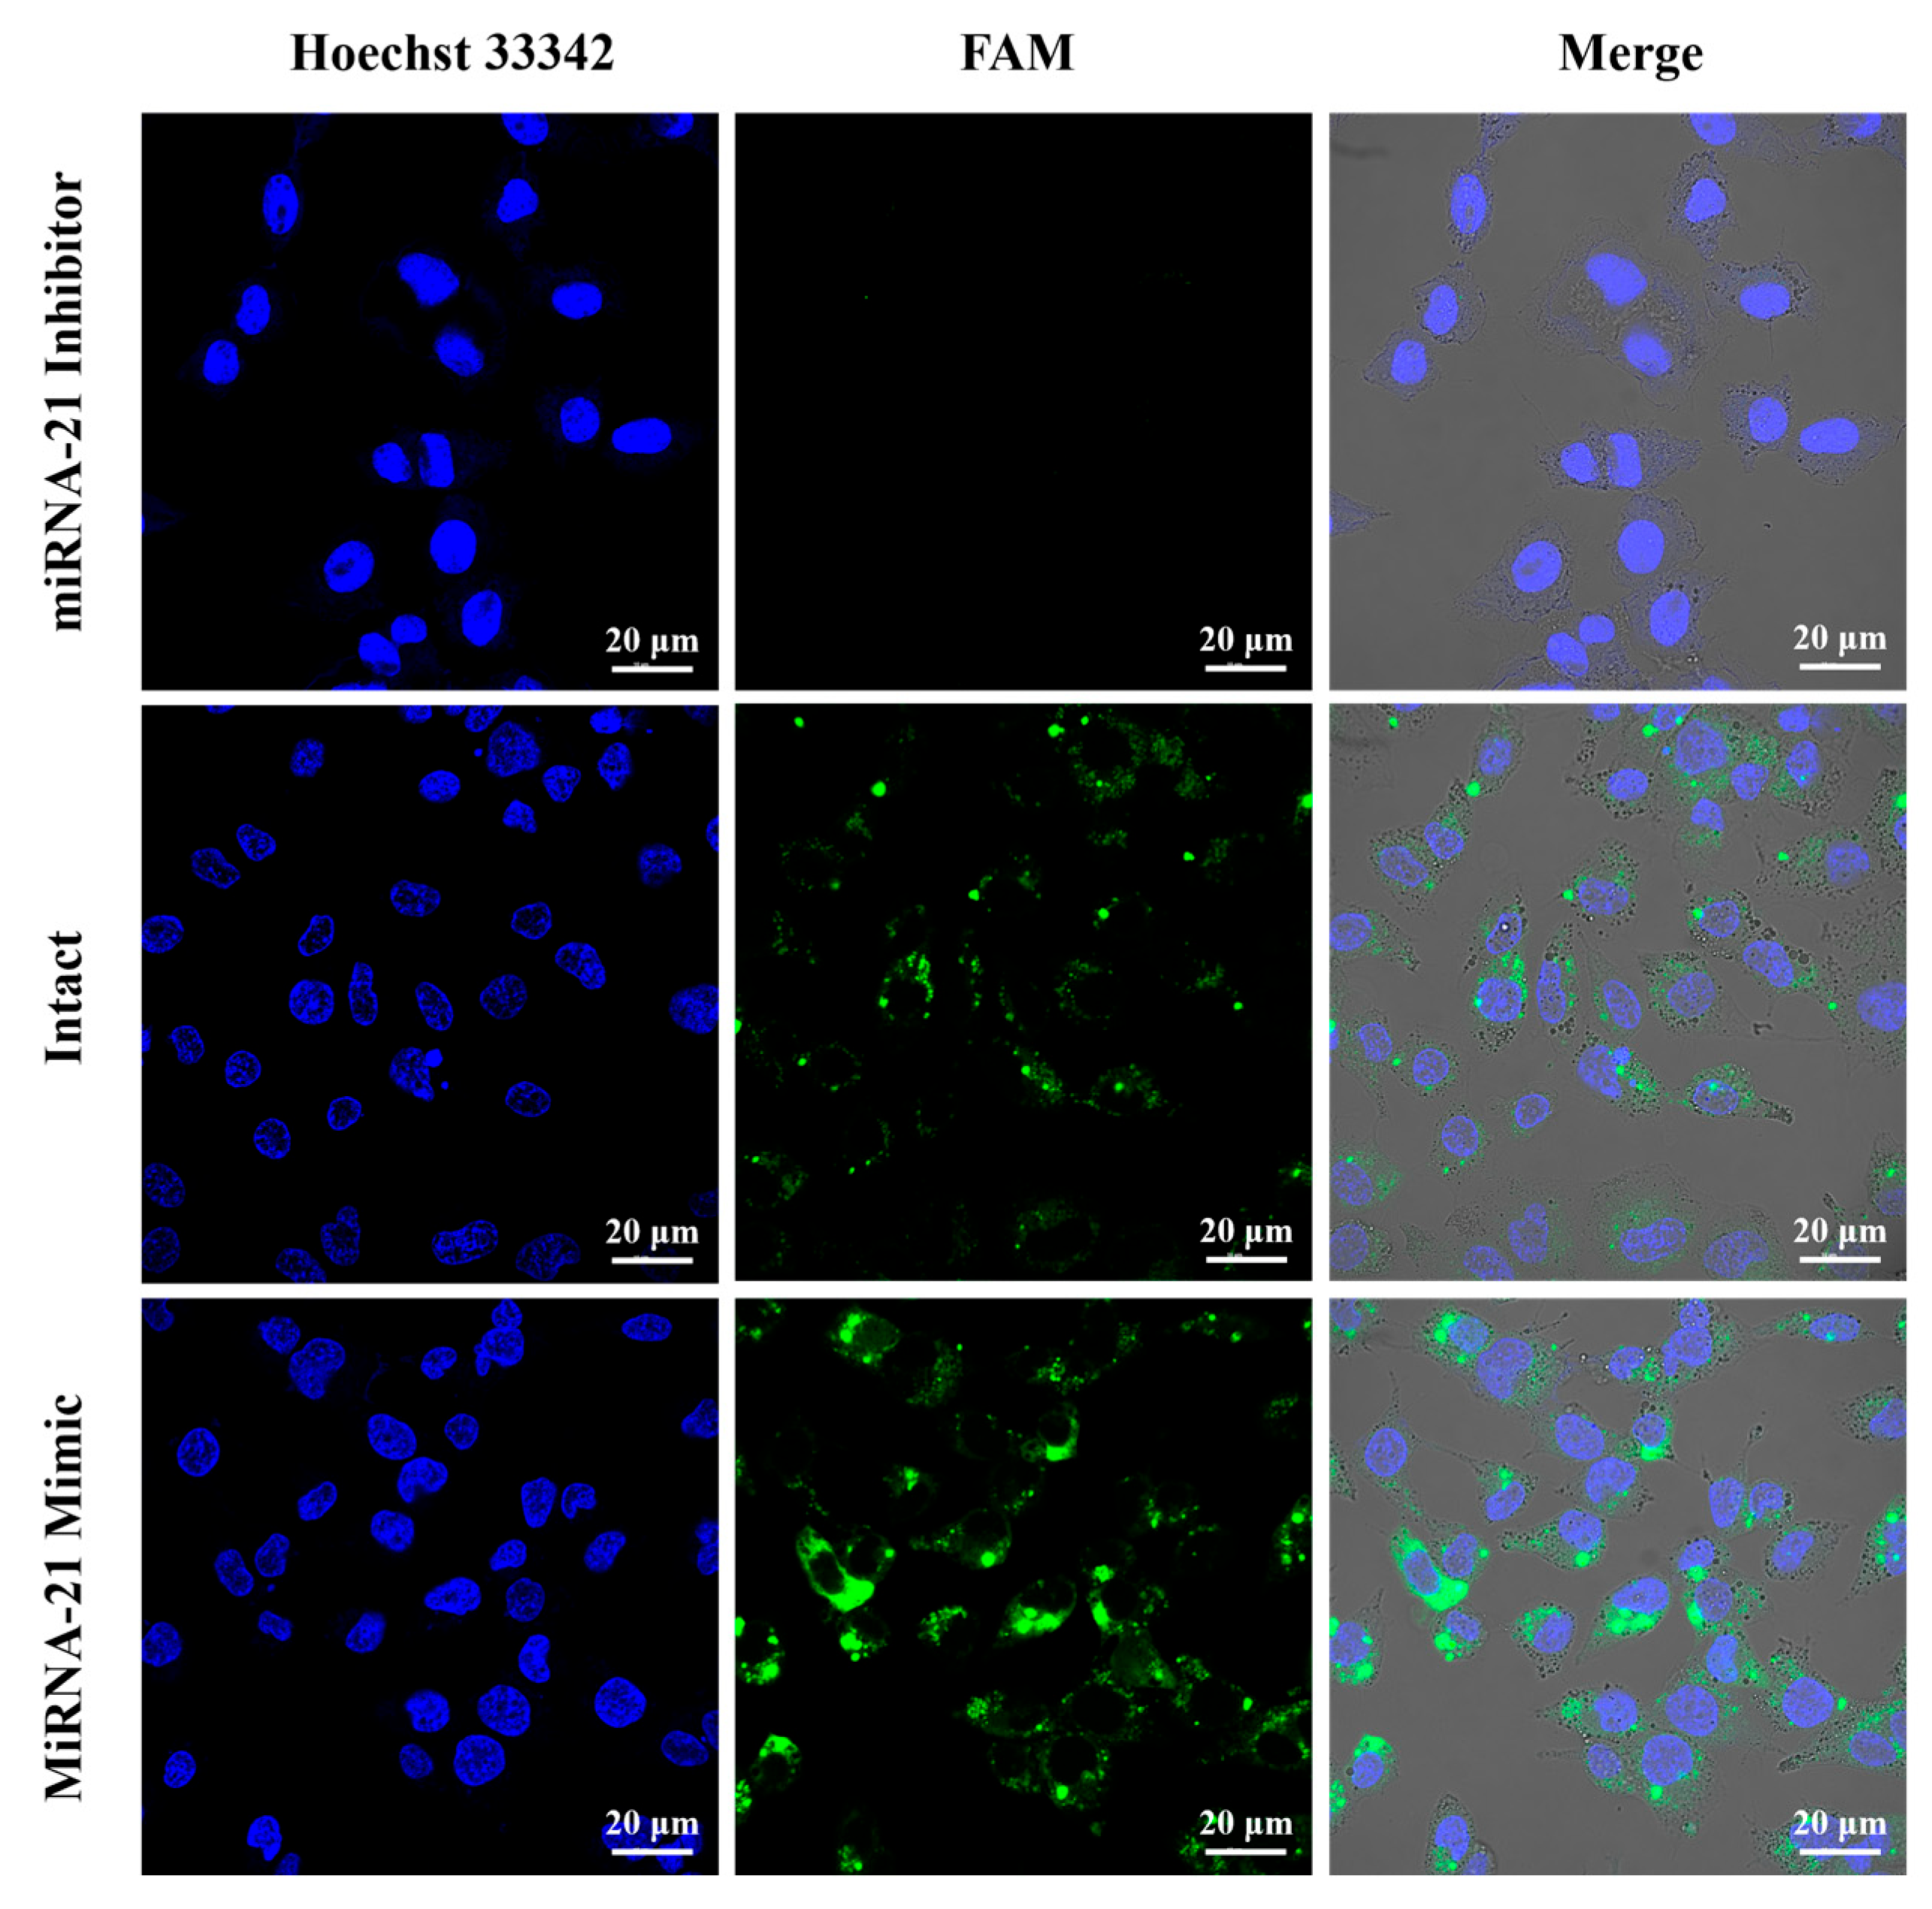
Huh7 cells were pretreated with either a miRNA-21 inhibitor or a miRNA-21 mimic, followed by transfection with fluorescent components. Cellular fluorescence images were captured to evaluate the sensitivity and specificity of the method. As shown in Figure 10, cells treated with the miRNA-21 inhibitor exhibited minimal fluorescence. The average signal of cells pre-treated with the miRNA-21 inhibitor was 193.85, while the average signal of untreated cells was 9610.95. In comparison, the signal intensity of cells treated with the miRNA-21 inhibitor decreased by 97.98%, strongly demonstrating the good specificity of the YCA metho, as it was not affected by non-target nucleic acids. In contrast, cells treated with the miRNA-21 mimic, which increased intracellular miRNA-21 levels, showed significantly stronger fluorescence signals compared to untreated cells. These results demonstrate that the fluorescent nanoprobe can effectively monitor varying miRNA-21 levels in cells with high specificity.

4. Conclusions

This study developed a YDA signal amplification method with strong fluorescence, high specificity, and efficiency for miRNA in situ fluorescence imaging. Triggered by target miRNA-21, hairpins H1 and H2 form fluorescent component H through a catalytic hairpin assembly reaction. Component H, along with annealed component P, assembles into DNA fluorescent nanoparticles (664.133 nm in diameter) within 60 min. In Huh7 cells, DNA nanoparticles produced by YCA, triggered by the target miRNA-21, showed a 117.77% enhancement in fluorescence intensity, generating high-intensity fluorescence images and enabling the qualitative detection of miRNA-21. The YDA method offers high fluorescence intensity and efficiency, making it suitable for miRNA in situ imaging. It provides a reliable approach for microRNA functional studies and disease diagnosis. Due to the editability of DNA, the sequence that recognizes miRNA-21 can be changed to a complementary sequence for other miRNAs, enabling the detection of additional miRNAs. Therefore, the YCA method has the potential for multiplex imaging capabilities. Future research will focus on exploring their compatibility with multiplexed miRNA detection for complex diseases and investigating their stability and performance in biological fluids to advance clinical translation.

Author Contributions

Conceptualization, Y.L. (Yan Liu) and J.L.; methodology, Y.L. (Yan Liu) and J.L.; formal analysis, J.L., Y.L. (Yan Liu) and X.F.; investigation, X.F., X.Z. and Y.L. (Yingxue Li); validation, Y.L. (Yan Liu) and R.Y.; resources, X.F., X.Z., Z.Z. and Y.L. (Yingxue Li); data curation, Y.L. (Yan Liu) and Q.Y.; writing—original draft preparation, Y.L. (Yan Liu); writing—review and editing, J.L., L.Z., W.Z. and Z.Z.; supervision, J.L., L.Z. and W.Z.; project administration, L.Z. and W.Z.; funding acquisition, L.Z., W.Z., R.Y. and A.Z. All authors have read and agreed to the published version of the manuscript.

Funding

This research was funded by the National Key R&D Program of China (No. 2025YFF1207800), the National Natural Science Foundation of China (No. 52275581, No. 82372142, No. 82327802, No. 22404171), the Strategic Priority Research Program of Chinese Academy of Sciences (No. XDC0250000), the Frontier Technologies R&D Program of Jiangsu Province (No. BF2024030), the Natural Science Foundation of Jiangsu Province (No. BK20240407), the Project of Jiangsu Province High-End Medical Devices Technology Innovation Center (No. BM2022012), the Youth Innovation Promotion Association of CAS (No. Y2022088), the Science and Technology Development Program of Suzhou (No. SYG2024116, No. SSD2023012, No. SSD2023017), the Innovative Key Project of Suzhou Institute of Biomedical Engineering and Technology (No. CX202501002).

Institutional Review Board Statement

Not applicable.

Informed Consent Statement

Not applicable.

Data Availability Statement

The data from this study can be obtained upon reasonable request from the authors.

Conflicts of Interest

The authors declare no conflicts of interest.

References

  1. Mohammadsaber, T.; Mohammadreza, F.; Delsuz, R.; Mohammad, A.K.; Jamal, M.; Hamid, A.; Mohammad-Davood, F.; Kosar, N.; Fatemeh, S.; Sajad, N. The Role of MicroRNAs in the Pathophysiology of the Aging Eye. Ageing Res. Rev. 2025, 111, 102805. [Google Scholar] [CrossRef] [PubMed]
  2. Vidigal, J.A.; Ventura, A. The Biological Functions of MiRNAs: Lessons from in Vivo Studies. Trends Cell Biol. 2015, 25, 137–147. [Google Scholar] [CrossRef]
  3. Celik Cogal, G.; Das, P.K.; Yurdabak Karaca, G.; Bhethanabotla, V.R.; Uygun Oksuz, A. Fluorescence Detection of miRNA-21 Using Au/Pt Bimetallic Tubular Micromotors Driven by Chemical and Surface Acoustic Wave Forces. ACS Appl. Bio. Mater. 2021, 4, 7932–7941. [Google Scholar] [CrossRef]
  4. Oliver, H. MiRNAs Play a Tune. Cell 2007, 131, 22–24. [Google Scholar] [CrossRef]
  5. Kim, H.; Lee, Y.Y.; Kim, V.N. The Biogenesis and Regulation of Animal MicroRNAs. Nat. Rev. Mol. Cell Biol. 2025, 26, 276–296. [Google Scholar] [CrossRef] [PubMed]
  6. Zare, N.; Ghasemi, R.; Rafiee, L.; Javanmard, S.H. Assessment of MicroRNA-21 Using Gold Nanoparticle-DNA Conjugates Based on Colorimetric and Fluorescent Detection. Gold Bull. 2022, 55, 107–114. [Google Scholar] [CrossRef]
  7. Budhu, A.; Ji, J.; Wang, X. The Clinical Potential of MicroRNAs. J. Hematol. Oncol. 2010, 3, 37. [Google Scholar] [CrossRef]
  8. Mehta, A.; Baltimore, D. MicroRNAs as Regulatory Elements in Immune System Logic. Nat. Rev. Immunol. 2016, 16, 279–294. [Google Scholar] [CrossRef]
  9. Liu, S.; Huo, Y.; Fan, L.; Ning, B.; Sun, T.; Gao, Z. Rapid and Ultrasensitive Detection of DNA and MicroRNA-21 Using a Zirconium Porphyrin Metal-Organic Framework-Based Switch Fluorescence Biosensor. Anal. Chim. Acta 2022, 1192, 339340. [Google Scholar] [CrossRef] [PubMed]
  10. Diener, C.; Keller, A.; Meese, E. Emerging Concepts of MiRNA Therapeutics: From Cells to Clinic. Trends Genet. 2022, 38, 613–616. [Google Scholar] [CrossRef]
  11. Shang, R.; Lee, S.; Senavirathne, G.; Lai, E. MicroRNAs in Action: Biogenesis, Function and Regulation. Nat. Rev. Genet. 2023, 24, 816–833. [Google Scholar] [CrossRef] [PubMed]
  12. Li, Y.; Guo, R.; Deng, C.; Li, D.; Wu, H. A Prussian Blue Nanoparticles-Based Fluorescent Nanoprobe for Monitoring MicroRNA-92a and MicroRNA-21. Anal. Sci. 2022, 38, 497–504. [Google Scholar] [CrossRef]
  13. Naidu, S.; Magee, P.; Garofalo, M. MiRNA-Based Therapeutic Intervention of Cancer. J. Hematol. Oncol. 2015, 8, 68. [Google Scholar] [CrossRef]
  14. Bortoletto, A.S.; Parchem, R.J. KRAS Hijacks the MiRNA Regulatory Pathway in Cancer. Cancer Res. 2023, 83, 1563–1572. [Google Scholar] [CrossRef]
  15. Naserkhaki, R.; Shokouhian, B.; Tahamtani, Y.; Khosravi, A.; Iravani, S.; Zarrabi, A.; Vosough, M. Revisiting Treatment Strategies: Addressing Epithelial-to-Mesenchymal Transition-Induced Resistance in Hepatocellular Carcinoma. BME Front. 2025, 6, 0144. [Google Scholar] [CrossRef]
  16. Barwari, T.; Joshi, A.; Mayr, M. MicroRNAs in Cardiovascular Disease. JACC 2016, 68, 2577–2584. [Google Scholar] [CrossRef]
  17. Santovito, D.; Weber, C. Non-Canonical Features of MicroRNAs: Paradigms Emerging from Cardiovascular Disease. Nat. Rev. Cardiol. 2022, 19, 620–638. [Google Scholar] [CrossRef]
  18. Rezaee, D.; Saadatpour, F.; Akbari, N.; Zoghi, A.; Najafi, S.; Beyranvand, P.; Zamani-Rarani, F.; Rashidi, M.A.; Bagheri-Mohammadi, S.; Bakhtiari, M. The Role of MicroRNAs in the Pathophysiology of Human Central Nervous System: A Focus on Neurodegenerative Diseases. Ageing Res. Rev. 2023, 92, 102090. [Google Scholar] [CrossRef] [PubMed]
  19. Barbato, C. MicroRNA-Mediated Silencing Pathways in the Nervous System and Neurological Diseases. Cells 2022, 11, 2375. [Google Scholar] [CrossRef] [PubMed]
  20. World Health Organization. Cancer. 2025. Available online: https://www.who.int/news-room/fact-sheets/detail/cancer (accessed on 25 August 2025).
  21. World Health Organization. Cardiovascular Diseases (CVDs). 2025. Available online: https://www.who.int/news-room/fact-sheets/detail/cardiovascular-diseases-(cvds) (accessed on 25 August 2025).
  22. World Health Organization. Over 1 in 3 People Affected by Neurological Conditions, the Leading Cause of Illness and Disability Worldwide. 2024. Available online: https://www.who.int/news/item/14-03-2024-over-1-in-3-people-affected-by-neurological-conditions--the-leading-cause-of-illness-and-disability-worldwide (accessed on 25 August 2025).
  23. Li, K.; Xu, S.; Xiong, M.; Huan, S.; Yuan, L.; Zhang, X. Molecular Engineering of Organic-Based Agents for In Situ Bioimaging and Phototherapeutics. Chem. Soc. Rev. 2021, 50, 11766–11784. [Google Scholar] [CrossRef]
  24. Tang, Y.; Zhang, S.; Yang, X.; Chen, Y.; Chen, S.; Xi, Q.; Chao, L.; Huang, Z.; Nie, L. In Situ Imaging of Intracellular MiRNAs in Tumour Cells by Branched Hybridisation Chain Reaction. Cell Prolif. 2024, 57, e13721. [Google Scholar] [CrossRef]
  25. Wei, R.; Wang, K.; Liu, X.; Shi, M.; Pan, W.; Li, N.; Tang, B. Stimuli-Responsive Probes for Amplification-Based Imaging of MiRNAs in Living Cells. Biosens. Bioelectron. 2023, 239, 115584. [Google Scholar] [CrossRef] [PubMed]
  26. Tan, Y.; Wang, J.; Wan, Q.; Yang, J.; Huang, J.; Zhou, Z.; Dong, H.; Zhang, X. A Switchable Magnetic Resonance Imaging Nanoplatform for In Situ MicroRNA Imaging. Chem. Sci. 2025, 16, 199–204. [Google Scholar] [CrossRef]
  27. Qing, Z.; Xu, J.; Hu, J.; Zheng, J.; He, L.; Zou, Z.; Yang, S.; Tan, W.; Yang, R. In Situ Amplification-Based Imaging of RNA in Living Cells. Angew. Chem. Int. Ed. 2019, 58, 11574–11585. [Google Scholar] [CrossRef]
  28. Luo, T.; Guan, Z.; Liu, Y.; Zhou, J.; Mergny, J.L.; Cheng, M. i-Motif DNA Molecular Beacon for MicroRNA Detection. Nucleic Acids Res. 2025, 53, gkaf556. [Google Scholar] [CrossRef] [PubMed]
  29. Sun, D.; Cao, F.; Yi, X.; Zhu, H.; Qi, G.; Xu, W.; Xu, S. MicroRNA-21 Expression in Single Living Cells Revealed by Fluorescence and SERS Dual-Response Microfluidic Droplet Platform. Lab. A Chip. 2022, 22, 2165–2172. [Google Scholar] [CrossRef] [PubMed]
  30. Huang, G.; Su, C.; Wang, L.; Fei, Y.; Yang, J. The Application of Nucleic Acid Probe–Based Fluorescent Sensing and Imaging in Cancer Diagnosis and Therapy. Front. Chem. 2021, 9, 705458. [Google Scholar] [CrossRef]
  31. Zhong, W.; Sczepanski, J.T. A Mirror Image Fluorogenic Aptamer Sensor for Live-Cell Imaging of MicroRNAs. ACS Sens. 2019, 4, 566–570. [Google Scholar] [CrossRef]
  32. Zhang, H.; Liu, W.; Zhang, F.; Wu, Z.; Lu, H.; Hao, Z.; Liu, Y.; Li, X.; Zhang, R.; Zhang, L. High-Fidelity Intracellular Imaging of Multiple MiRNAs via Stimulus-Responsive Nanocarriers and Catalytic Hairpin Assembly. Chem. Commun. 2024, 60, 2377–2380. [Google Scholar] [CrossRef]
  33. Jiang, Q.; Zhou, J.; Sha, Y.; Jiang, M.; Chai, Y.; Yuan, R. A Multifunctional Tetrahedral DNA Nanostructure for the Simultaneous Sensitive Detection and Imaging of miRNA and Zinc Ions in Living Cells. Anal. Chem. 2025, 97, 13368–13375. [Google Scholar] [CrossRef]
  34. Xu, H.; Wu, X.; Liu, Q.; Yang, C.; Shen, M.; Wang, Y.; Liu, S.; Zhao, S.; Xiao, T.; Sun, M.; et al. A Universal Strategy for Enhancing the Circulating MiRNAs’ Detection Performance of Rolling Circle Amplification by Using a Dual-Terminal Stem-Loop Padlock. ACS Nano 2024, 18, 436–450. [Google Scholar] [CrossRef]
  35. Shuai, X.; Zhang, Y.; Zhai, J.; Li, J.; Chen, J.; Long, X.; Li, D.; Huang, C.; Li, C. MicroRNA Imaging Encounters Rolling Circle Amplification: Intracellular Na+-Fueled Linear Programmable DNAzyme Nanostructure. Anal. Chem. 2023, 95, 6681–6689. [Google Scholar] [CrossRef]
  36. Zhang, B.; Tian, T.; Xiao, D.; Gao, S.; Cai, X.; Lin, Y. Facilitating In Situ Tumor Imaging with a Tetrahedral DNA Framework-Enhanced Hybridization Chain Reaction Probe. Adv. Funct. Mater. 2022, 32, 2109728. [Google Scholar] [CrossRef]
  37. Yang, B.; Gao, X.; Yu, H.; Xu, J.; Liu, W.; Xu, H.; Guo, L. Localized Hybridization Chain Reaction Amplifier Utilizing Three-Dimensional DNA Nanostructures for Efficient and Reliable MicroRNA Imaging in Living Cells. Anal. Chim. Acta 2024, 1330, 343292. [Google Scholar] [CrossRef]
  38. Sun, J.; Sun, X. Recent Advances in the Construction of DNA Nanostructure with Signal Amplification and Ratiometric Response for MiRNA Sensing and Imaging. Trends Anal. Chem. 2020, 127, 115900. [Google Scholar] [CrossRef]
  39. Yang, H.; Du, Z.; Zhu, L.; Dong, Y.; Huang, K.; Xu, W. High-Content Enhancement Strategies for Fluorescence in Situ Hybridization Imaging. Trends Anal. Chem. 2025, 191, 118354. [Google Scholar] [CrossRef]
  40. Wu, H.; Ling, X.; Huang, S.; Zhao, Q.; Zhang, D.; Wang, H. Direct Fluorescence Anisotropy Detection of miRNA Based on Duplex-Specific Nuclease Signal Amplification. Anal. Chem. 2025, 97, 8574–8580. [Google Scholar] [CrossRef] [PubMed]
  41. Huang, X.; Li, Z.; Tong, Y.; Zhang, Y.; Shen, T.; Chen, M.; Huang, Z.; Shi, Y.; Wen, S.; Liu, S.; et al. DNAzyme-Amplified Cascade Catalytic Hairpin Assembly Nanosystem for Sensitive MicroRNA Imaging in Living Cells. Anal. Chem. 2023, 95, 11793–11799. [Google Scholar] [CrossRef] [PubMed]
  42. Li, C.; Zhang, J.; Gao, Y.; Luo, S.; Wu, Z. Nonenzymatic Autonomous Assembly of Cross-Linked Network Structures from Only Two Palindromic DNA Components for Intracellular Fluorescence Imaging of MiRNAs. ACS Sens. 2022, 7, 601–611. [Google Scholar] [CrossRef] [PubMed]
  43. Roodhuizen, J.A.L.; Hendrikx, P.J.T.M.; Hilbers, P.A.J.; de Greef, T.F.A.; Markvoort, A.J. Counterion-Dependent Mechanisms of DNA Origami Nanostructure Stabilization Revealed by Atomistic Molecular Simulation. ACS Nano 2019, 13, 10798–10809. [Google Scholar] [CrossRef]
  44. Postigo, A.; Marcuello, C.; Verstraeten, W.; Sarasa, S.; Walther, T.; Lostao, A.; Göpfrich, K.; del Barrio, J.; Hernández-Ainsa, S. Folding and Functionalizing DNA Origami: A Versatile Approach Using a Reactive Polyamine. J. Am. Chem. Soc. 2025, 147, 3919–3924. [Google Scholar] [CrossRef] [PubMed]
  45. Rodriguez, A.; Gandavadi, D.; Mathivanan, J.; Song, T.; Madhanagopal, B.R.; Talbot, H.; Sheng, J.; Wang, X.; Chandrasekaran, A.R. Self-Assembly of DNA Nanostructures in Different Cations. Small 2023, 19, 2300040. [Google Scholar] [CrossRef] [PubMed]
Figure 1. Flowchart of the intracellular DNA assembly experiment using YCA.
Chemosensors 13 00343 g001
Figure 2. Schematic diagram of DNA particle formation through Y-shaped cascade assembly.
Chemosensors 13 00343 g002
Figure 3. The experimental conditions were optimized and characterized using agarose gel electrophoresis. (a) Nucleic acid monomers without annealing treatment: P1, P2, and P3 are single-stranded DNA used to form the Y-shaped component P, while H1 and H2 are hairpin structures used to form the double-stranded component H. (b) Nucleic acid monomers annealed to room temperature after incubation at 95 °C for 5 min. (c) Optimization of the ratio between components P and H, with experimental ratios of 2:1, 3:2, 1:1, 2:3, and 1:2. (d) Optimization of assembly time, with durations set at 5, 10, 20, 30, 60, and 120 min.
Chemosensors 13 00343 g003
Figure 4. The DNA particles formed through cascade assembly after condition optimization were characterized. (a) Agarose gel electrophoresis images of monomers P1, P2, P3, component P, monomers H1, H2, component H, and the assembled PH complex. (b) AFM images of the DNA assemblies. (c) The DLS particle size distribution graph of the DNA assembly.
Chemosensors 13 00343 g004
Figure 5. Fluorescence spectra of DNA assembly solutions formed under varying assembly times and target miRNA-21 concentrations were measured with an excitation wavelength of 492 nm and an emission wavelength scanning range of 500–650 nm. (a) Fluorescence spectra of DNA assembly solutions at different assembly times; (b) fluorescence intensity variation curve of DNA assembly solutions at 518 nm across different assembly times; (c) fluorescence spectra of DNA assembly solutions under different target miRNA-21 concentrations; (d) fluorescence intensity variation curve of DNA assembly solutions at 518 nm under different target miRNA-21 concentrations.
Chemosensors 13 00343 g005
Figure 6. Add different miRNAs (miRNA-21, miRNA-122, let-7a, miRNA-221, miRNA-155) to the DNA reaction solutions and examine the fluorescence spectrum of the solutions after the reaction. (a) Fluorescence curves of the solution in the range of 500–650 nm under excitation at 492 nm after the addition of different miRNAs; (b) fluorescence bar chart of the solution at 518 nm after the addition of different miRNAs.
Chemosensors 13 00343 g006
Figure 7. Fluorescence images of different DNA solutions under a fluorescence microscope. (a) Solution of monomeric hairpin H2, with fluorescent group FAM and quenching group Dabcyl labeled at its ends, positioned in close proximity. (b) Solution of component H, a double-stranded structure formed by hairpins H1 and H2, with FAM and Dabcyl positioned farther apart. (c) Solution of the PH assembly, where component H and component P are cascade-assembled into a Y-shaped network structure containing multiple FAM groups. (d) Grayscale distribution of fluorescence spots in the first three images.
Chemosensors 13 00343 g007
Figure 8. Fluorescence imaging of miRNA-21 in Huh7 cells using the YDA method. The first group consists of images of YDA formed in Huh7 cells triggered by miRNA-21; the second group comprises images formed by component H; the third group only included the transfection reagent without the transfected substance, serving as a control group.
Chemosensors 13 00343 g008
Figure 9. The gray value distribution of FAM fluorescence was analyzed for each cell experimental group in Figure 8. (a) Assembly PH in Huh7 cells; (b) component H in Huh7 cells; (c) merger of the gray value distribution of assembly PH and component H.
Chemosensors 13 00343 g009
Figure 10. Fluorescence images of YDA in Huh7 cells subjected to different treatments: miRNA-21 inhibitor treatment, no pretreatment, and miRNA-21 mimic treatment.
Chemosensors 13 00343 g010
Table 1. DNA sequences used in the experiments.
NameSequence (from 5′ to 3′)
P15′-ATTGTAGACTTATCACAGCCACCTACTCACACGAGTCCG
AGACTGAATCCATCCGCTAAG-3′
P25′-TCGGACTCGTGTGAGTAGGTTCTAATCTTGGATTGTCGG
TAGGGCGTAGATAAGAGTCTG-3′
P35′-ACCGACAATCCAAGATTAGAGGCTGTGATAAGTCTACA
ATG CTGAATCCATCCGCTAAG-3′
H15′-TCAACATCAGTCTGATAAGCTACGTGGATGTTGACTTAG
CTAGCTTATCAGACTCTTATCTACGCCCT-3′
H25′-FAM-ATAAGCTAGCTAAGTCAACATCCACGTAGCTTATC
AGACTGATGTTGACTTAGCGGATGGATTCAGTC-Dabcyl-3′
miRNA215′-UAGCUUAUCAGACUGAUGUUGA-3′
miRNA-1225′-UGGAGUGUGACAAUGGUGUUUG-3′
let-7a5′-UGAGGUAGUAGGUUGUAUAGUU-3′
miRNA-2215′-AGCUACAUUGUCUGCUGGGUUUC-3′
miRNA-1555′-UUAAUGCUAAUCGUGAUAGGGGU-3′
miRNA-21 inhibitor5′-TCAACATCAGTCTGATAAGCTA-3′
miRNA-21 mimic5′-TAGCTTATCAGACTGATGTTGA-3′
Disclaimer/Publisher’s Note: The statements, opinions and data contained in all publications are solely those of the individual author(s) and contributor(s) and not of MDPI and/or the editor(s). MDPI and/or the editor(s) disclaim responsibility for any injury to people or property resulting from any ideas, methods, instructions or products referred to in the content.