Article

An Electrochemical Aptamer Sensor with ZIF-8 Loaded CuNPs Composites for Aflatoxin B1 Determination

School of Electrical Engineering, Henan University of Technology, Zhengzhou 450001, China
*
Authors to whom correspondence should be addressed.
Chemosensors 2025, 13(9), 342; https://doi.org/10.3390/chemosensors13090342
Submission received: 9 August 2025 / Revised: 30 August 2025 / Accepted: 3 September 2025 / Published: 6 September 2025
(This article belongs to the Section (Bio)chemical Sensing)

Abstract

An electrochemical aptamer sensor for the sensitive detection of aflatoxin B1 (AFB1) in corn samples was developed using nanocomposites loaded with copper nanoparticles (CuNPs) on zeolitic imidazolate framework-8 (ZIF-8), which were modified on a glassy carbon electrode (GCE). The CuNPs@ZIF-8 nanocomposites served as modifying materials for electrodes, exhibiting a high specific surface area and excellent compatibility with aptamers, thereby enhancing the electron transfer rate and increasing the aptamer loading and immobilization efficiency. The electrochemical properties before and after modification were investigated and validated using cyclic voltammetry (CV) and electrochemical impedance spectroscopy (EIS) techniques, while the sensor’s performance was analyzed through quantitative detection via differential pulse voltammetry (DPV). Furthermore, various conditions, including the volume of ZIF-8 dispersion, electrodeposition time of copper nanoparticles, aptamer concentration, and AFB1 incubation time, were optimized. The results indicated that the sensor exhibited a wide linear range (10.0 to 1.0 × 10⁶ pg/mL), with a lower limit of detection (LOD) of 1.13 pg/mL under optimized conditions, outperforming other reported aptamer sensors. The spiked recoveries in corn samples ranged from 96.663% to 105.72%. In conclusion, this sensor presents a novel solution for low-cost and high-sensitivity detection of AFB1.

1. Introduction

Aflatoxins are primarily secondary metabolites produced by Aspergillus flavus and Aspergillus parasite, which are usually found in food, animal feed, and moldy grains, causing serious effects on human health [1,2]. Aflatoxins are a group of toxic substances produced by certain types of molds. The most prominent types are B, G, and M series, namely AFB1, AFB2, AFG1, AFG2, AFM1, and AFM2, respectively [3]. Among them, AFB1 is known for its extreme toxicity, which inhibits the synthesis of proteins, enzymes, organic substances, and cellular DNA and RNA in humans and animals and can lead to acute necrosis of hepatocytes, cirrhosis, and hepatocellular carcinoma in humans and animals, thus exhibiting the highest toxicity among all aflatoxins [4]. It has been classified as a class I carcinogen by the International Agency for Research on Cancer (IARC) [5,6]. The World Health Organization (WHO) and the Codex Alimentarius Commission (CAC) recommend a maximum level of aflatoxins in food and feed below 15 ppb (parts per billion) [7]. Food hygiene standards in China specify the permitted levels of AFB1 in a variety of susceptible foods. For corn, peanuts, and peanut oil, the permissible level of aflatoxin B1 is set at ≤20 ppb [8]. Therefore, the detection of AFB1 is crucial for human health.
Routine detection methods for AFB1 include chromatography [9,10], immunochromatographic assay [11], enzyme-linked immunosorbent assay [12,13,14], and fluorescence immunoassay [15,16]. While these methods display a high degree of accuracy and precision, they usually exhibit disadvantages as well. Among them, chromatographic detection is costly, and the complexity of the instrument requires specialized operators. Colloidal gold-based immunochromatographic assay displays a relatively low sensitivity, and enzyme-linked immunosorbent assay is prone to false positives and interference from antibody cross-reactivity. Fluorescence immunoassay is also complex and requires a more demanding experimental environment. In recent years, an assay based on nucleic acid aptamers has been developed in the field of toxin detection. Aptamers are short synthetic sequences of single-stranded oligonucleotides (ss-RNA or ss-DNA) that have evolved through the system of exponentially enriched ligands (SELEX) [17,18]. Compared to antibodies that are resistant to changes in the environment and chemically synthesized in a faster manner, they display the advantages of high specificity, strong resistance to interference, and low cost. Zhang et al. developed a nucleic acid aptamer-based chemiluminescent sensor for the detection of AFB1 in wheat. This method enables competitive detection of AFB1 and AFB1 antigens via a homemade fiber optic sensor using biotin and streptavidin (SA)-linked aptamers and horseradish peroxidase (HRP) for chemiluminescence detection [19]. Chemiluminescent methods display limitations in terms of detection sensitivity. Recently, the application of emerging materials in the field of electrochemical detection technology has become increasingly widespread. Electrochemical biosensors have attracted the interest of researchers due to their fast response capability, simple preparation method, and high sensitivity. Zhang et al. prepared an efficient electrochemical immunosensor for the detection of aflatoxin AFB1 in maize samples by utilizing chitosan–graphene nanosheet (CS–GN) composites [20]. However, the high cost of such electrochemical immunosensor antibodies and the conductivity of graphene need to be further optimized.
Based on novel nanocomposites, several researchers have developed electrochemical aptamer sensors. Electrochemical aptamer sensors developed by combining aptamers with nanocomposites can significantly improve the capability and specificity of AFB1 detection. Li Y. et al. developed a highly reproducible electrochemical aptasensor based on a radiometric signaling strategy employing thiophene–graphene nanocomposites and ferrocene-labeled AFB1 aptamers [4]. This sensor achieves continuous repeatable detection of AFB1, but the complexity of the signal ratio calculation and the aspect of detection sensitivity need to be improved. Jahangiri-Dehaghani, F. et al. introduced a sensitive label-free electrochemical sensor for the measurement of aflatoxin M1 using platinum nanoparticles (PtNPs) adorned on a MIL-101(Fe) modified glassy carbon electrode [21]. The detection limit of this sensor has been greatly improved, but the synthesis of nanoparticles of platinum, a precious metal, is costly, and the synthesis of MIL-101(Fe) is also more complicated. In recent years, metal–organic frameworks (MOFs), as a new type of nanoporous material, have triggered an extensive research boom in the field of scientific research by virtue of their tunable and diverse structures, ultra-high specific surface area, and abundant pore properties [22]. There are many types of MOF materials, among which the zeolitic imidazolate framework-8 (ZIF-8) is one of the most common MOF materials. ZIF-8 is a metal displaying a framework composed of zinc ions (Zn2+) and 2-methylimidazole (2-MIM) ligands. The special ortho-dodecahedral skeleton and porous structure give them ultra-high specific surface area and porosity, and they are easy to prepare and exhibit stable electrochemical properties. Due to the unique performance advantages of ZIF-8 material, it has become a research hotspot for sensitive sensor materials [23,24]. Of note, the direct application of ZIF-8 in the fabrication of electrochemical aptamer sensors is still difficult due to its weak conductivity and inability to bind directly to the aptamer. Thus, improving the conductivity of ZIF-8 material and effectively immobilizing the aptamer on the electrode surface become the keys to fabricating electrochemical aptamer sensors. Metal nanoparticles are widely used to enhance sensor performance due to their unique high catalytic activity, electrical conductivity, and efficient probe immobilization efficiency. Liu et al. developed a high-performance dual-signal ratio metric electrochemical aptamer sensor based on Thi/Au/ZIF-8 and catalytic hairpin assembly for ultrasensitive detection of aflatoxin B1 [25]. The selection of ZIF-8-loaded metal nanoparticles provides a new concept for later researchers to immobilize the aptamer to improve its sensitivity. Currently, precious metal-based nanoparticles are more widely used in sensors [26,27], but their cost and ease of synthesis are limiting factors for large-scale applications. Copper nanoparticles significantly control the cost compared to that for precious metal nanoparticles and exhibit qualities that are not inferior to those of precious metals in terms of catalytic activity and biocompatibility. In addition, green synthesis can be achieved by avoiding toxic reagents in the synthesis method. Ahmadpor, H. et al. reported the advantages of sulfhydryl-metal bonding in the field of nanomaterials modification, and thus its application in biosensors has received great attention [28]. Strong covalent coordination can be formed between sulfhydryl and metal (M–S) to realize the stable connection between molecules and materials. And the sulfhydryl-modified aptamers can be stably immobilized on the electrode surface with the help of M–S bonds. Thus, the combination of metal nanoparticles with the metal–organic framework ZIF-8 not only efficiently immobilized the mercaptan-based aptamer on the electrode surface, but also promoted the electron transfer on the aptamer sensor surface.

2. Experiments

2.1. Reagents and Materials

2-MIM (C4H6N2, 98%), Zinc nitrate hexahydrate (Zn(NO3)2-6H2O, 98%), and 6-Mercapto-1-ethanol (MCH, 98%) were purchased from Shanghai Aladdin Biochemical Technology Company Limited (Shanghai, China). Copper sulfate pentahydrate (CuSO4·5H2O, AR), anhydrous sodium sulfate (Na2SO4, AR), dilute sulfuric acid standard solution (H2SO4, 0.5 M), potassium ferricyanide (K3[Fe(CN)6], AR), potassium ferrocyanide (K4[Fe(CN)6], AR), and potassium chloride (KCl, AR), were purchased from the China National Pharmaceutical Group Chemical Reagent Co. Ltd. (Shanghai, China). AFB1 aptamer (HS-GTT GGG CAC GTG TTG TCT CTC TGT GTC TCG TGC CCT TCG CTA GGC CCA CA,5′-3′), phosphate buffer (PBS, PH = 7.4), was provided by Shanghai Sangong Biological Engineering Co., Ltd. (Shanghai, China). Aflatoxin B1 was purchased from Qingdao Pribolab Bioengineering Company Limited (Qingdao, China).

2.2. Apparatus

Electrochemical characterization measurements were performed using a CHI-760E electrochemical workstation from Shanghai Chenhua Instruments (Shanghai, China), including DPV, CV, and EIS. For electrochemical measurements, a three-electrode system was used, with a 3.0 mm diameter GCE as the working electrode, a saturated calomel electrode (SCE) as the reference electrode, and a platinum wire electrode (Pt) as the counter electrode, and the electrodes used in the experiments were purchased from Xuzhou Xinke Instrumentation Ltd. (Xuzhou, China). Field Emission Electron Scanning Microscopy and Energy Dispersive X-ray Spectroscopy (TESCAN MAIA3, Brno, Czech Republic), an IRTracer-100 Fourier Transform Infrared Spectrometer (FTIR) (SHIMADZU, Kyoto, Japan), and a SmartLab X-ray Diffractometer (XRD) (Rigaku Corp., Tokyo, Japan) were used to characterize the morphology and elemental composition of the nanocomposites.

2.3. Experimental Principle

In this study, a novel electrochemical aptamer sensor based on Apt/CuNPs/ZIF-8/GCE was conceptualized for the determination of AFB1 by combining the advantageous features of CuNPs and ZIF-8 (shown in Figure 1). Before modification, GCE was pretreated using conventional methods. After grinding and polishing the GCE using Al2O3 powder with grit size 0.05 µm, the electrodes were washed in aqueous solutions of pure water and ethanol and then dried until the surface was mirror-like. First, the synthesized ZIF-8 dispersion was applied dropwise on the GCE surface and dried at 35 °C for 15min. Next, electrodeposition was applied to form CuNPs on the ZIF-8-modified GCE. Due to its high specific surface area, ZIF-8 is used as a substrate for sensors. Owing to the high specific surface area, high biocompatibility, and high electron transfer rate of CuNPs/ZIF-8 nanocomplexes, they were used as a platform for recognizing sulfhydryl-modified nucleic acid aptamers, while increasing the aptamer loading. After that, the aptamer was modified on the surface of CuNPs/ZIF-8/GCE and dried at 35 °C for 30 min. Then MCH was modified on the Apt/CuNPs/ZIF-8/GCE-modified layer on its surface to prevent non-specific binding. Finally, AFB1 was quantified by DPV in a 5.0 mM [Fe(CN)6]3−/4− solution containing 0.1 M KCl. The change in DPV peak current (ΔIp) before and after incubation with AFB1 was used as a basis for quantitative analysis of AFB1 concentration, and ΔIp was linearly related to AFB1 concentration. Compared to the reported electrochemical sensor for AFB1, the developed Apt/CuNPs/ZIF-8/GCE sensors exhibit lower detection limits and wider detection linear ranges.

2.4. Synthesis of ZIF-8

The metal–organic framework ZIF-8 was prepared using the stirring method reported by Tian et al., with slight modifications [29]. First, 0.85 g of Zn(NO3)2-6H2O and 4.25 g of 2-MIM were dissolved in 20 mL of methanol solution to form solutions A and B, respectively. Solution A containing Zn(NO3)2-6H2O was slowly dripped into solution B containing the organic ligand under vigorous stirring in a room temperature environment with continuous stirring until a white mixed solution was achieved. Then, after the white creamy mixture was allowed to stand at room temperature for 24 h, the mixture was centrifuged and washed three times with methanol and deionized water. Finally, the collected centrifuged material was dried in air at 55 °C overnight to obtain ZIF-8.

2.5. Preparation of Electrochemical Aptamer Sensors

Before modification of the working electrode, the GCE was sequentially polished with 1.0 μm, 0.3 μm, and 0.05 μm Al2O3 powder on a chamois polishing cloth. The GCE was ultrasonically cleaned for 3 min in ultrapure water and ethanol aqueous solution, sequentially, and then taken out to be blown dry utilizing nitrogen to obtain the GCE with a mirror-like surface. Subsequently, the synthesized product ZIF-8 was ultrasonically dispersed in ultrapure water and configured to obtain a 0.2 wt% mixed aqueous solution, and 4 μL of the above dispersion was applied dropwise to the pre-cleaned surface of the GCE, which was then placed in a blower drying oven at 35 °C for 15 min until dry.
To prepare CuNPs/ZIF-8/GCE, the prepared ZIF-8/GCE was immersed into a mixed solution containing 0.01 M CuSO4, 0.01 M H2SO4, and 0.01 M Na2SO4 and electrically deposited via the constant potential chrono-current method (CA) mode at a constant potential set to −0.2 V (vs. SCE). CuNPs were deposited with an optimal deposition time of 400 s. The electrodeposition was accomplished by improving the method of Luo et al. [30]. A total of 5 μL of sulfhydryl-modified AFB1 aptamer at a concentration of 1.5 μM was placed on the surface of CuNPs/ZIF-8/GCE and dried in a 35 °C drying oven for 30 min. Next, 2 μL of MCH at a concentration of 0.1 mM was placed on Apt/CuNPs/ZIF-8/GCE for 35 min to eliminate nonspecific binding. After successful preparation of the above aptamer sensors, 5 μL of AFB1 solution was incubated on the surface of the MCH/Apt/CuNPs/ZIF-8/GCE sensors at 37 °C for 40 min and then washed with phosphine hydrochloric acid buffer (0.1 M, pH = 7.2) to remove unbound AFB1 molecules. Finally, the current signal was measured using the DPV technique.

2.6. Electrochemical Measurements

The electrodes with different modified layers were electrochemically characterized and tested by CV, DPV, and EIS in a 5.0 mM [Fe(CN)6]3−/4− solution containing 0.1 mol/L KCl. CV measurements were performed over a potential range of −0.2 V to 1.0 V at a scan rate of 50.0 mV S−1. EIS measurements were performed in the frequency range of 10−1 to 105 Hz with an amplitude setting of 5.0 mV. AFB1 was quantified using the DPV technique. DPV measurements were performed over a potential range of 0.0 V to 1.0 V, with a pulse period of 0.5 s. The peak current value was recorded as Ip. ΔIp represents the peak current difference between MCH/Apt/CuNPs/ZIF-8/GCE and AFB1/MCH/Apt/CuNPs/ZIF-8/GCE, which is related to the concentration of AFB1.

2.7. Pre-Processing of Real Corn Samples

The uncontaminated corn samples were mashed and ground into powder, and 5.0 g of corn meal samples were placed in 50 mL of methanol/water (7/3, v/v) and shaken for 3 min until they were completely dispersed. Next, 1 mL of the dispersion was withdrawn into a centrifuge tube and centrifuged at 9000 r/min for 10 min. After centrifugation, 100 μL of supernatant was extracted and mixed with 500 μL of methanol. The mixed solution was obtained and an amount of AFB1 standard was added so that the final sample AFB1 concentrations were 1.0 ng/mL, 10.0 ng/mL, and 100 ng/mL, respectively. Finally, it was stored at 4 °C for backup.

3. Results and Discussion

3.1. Physio-Chemical Characterization of Nanomaterials

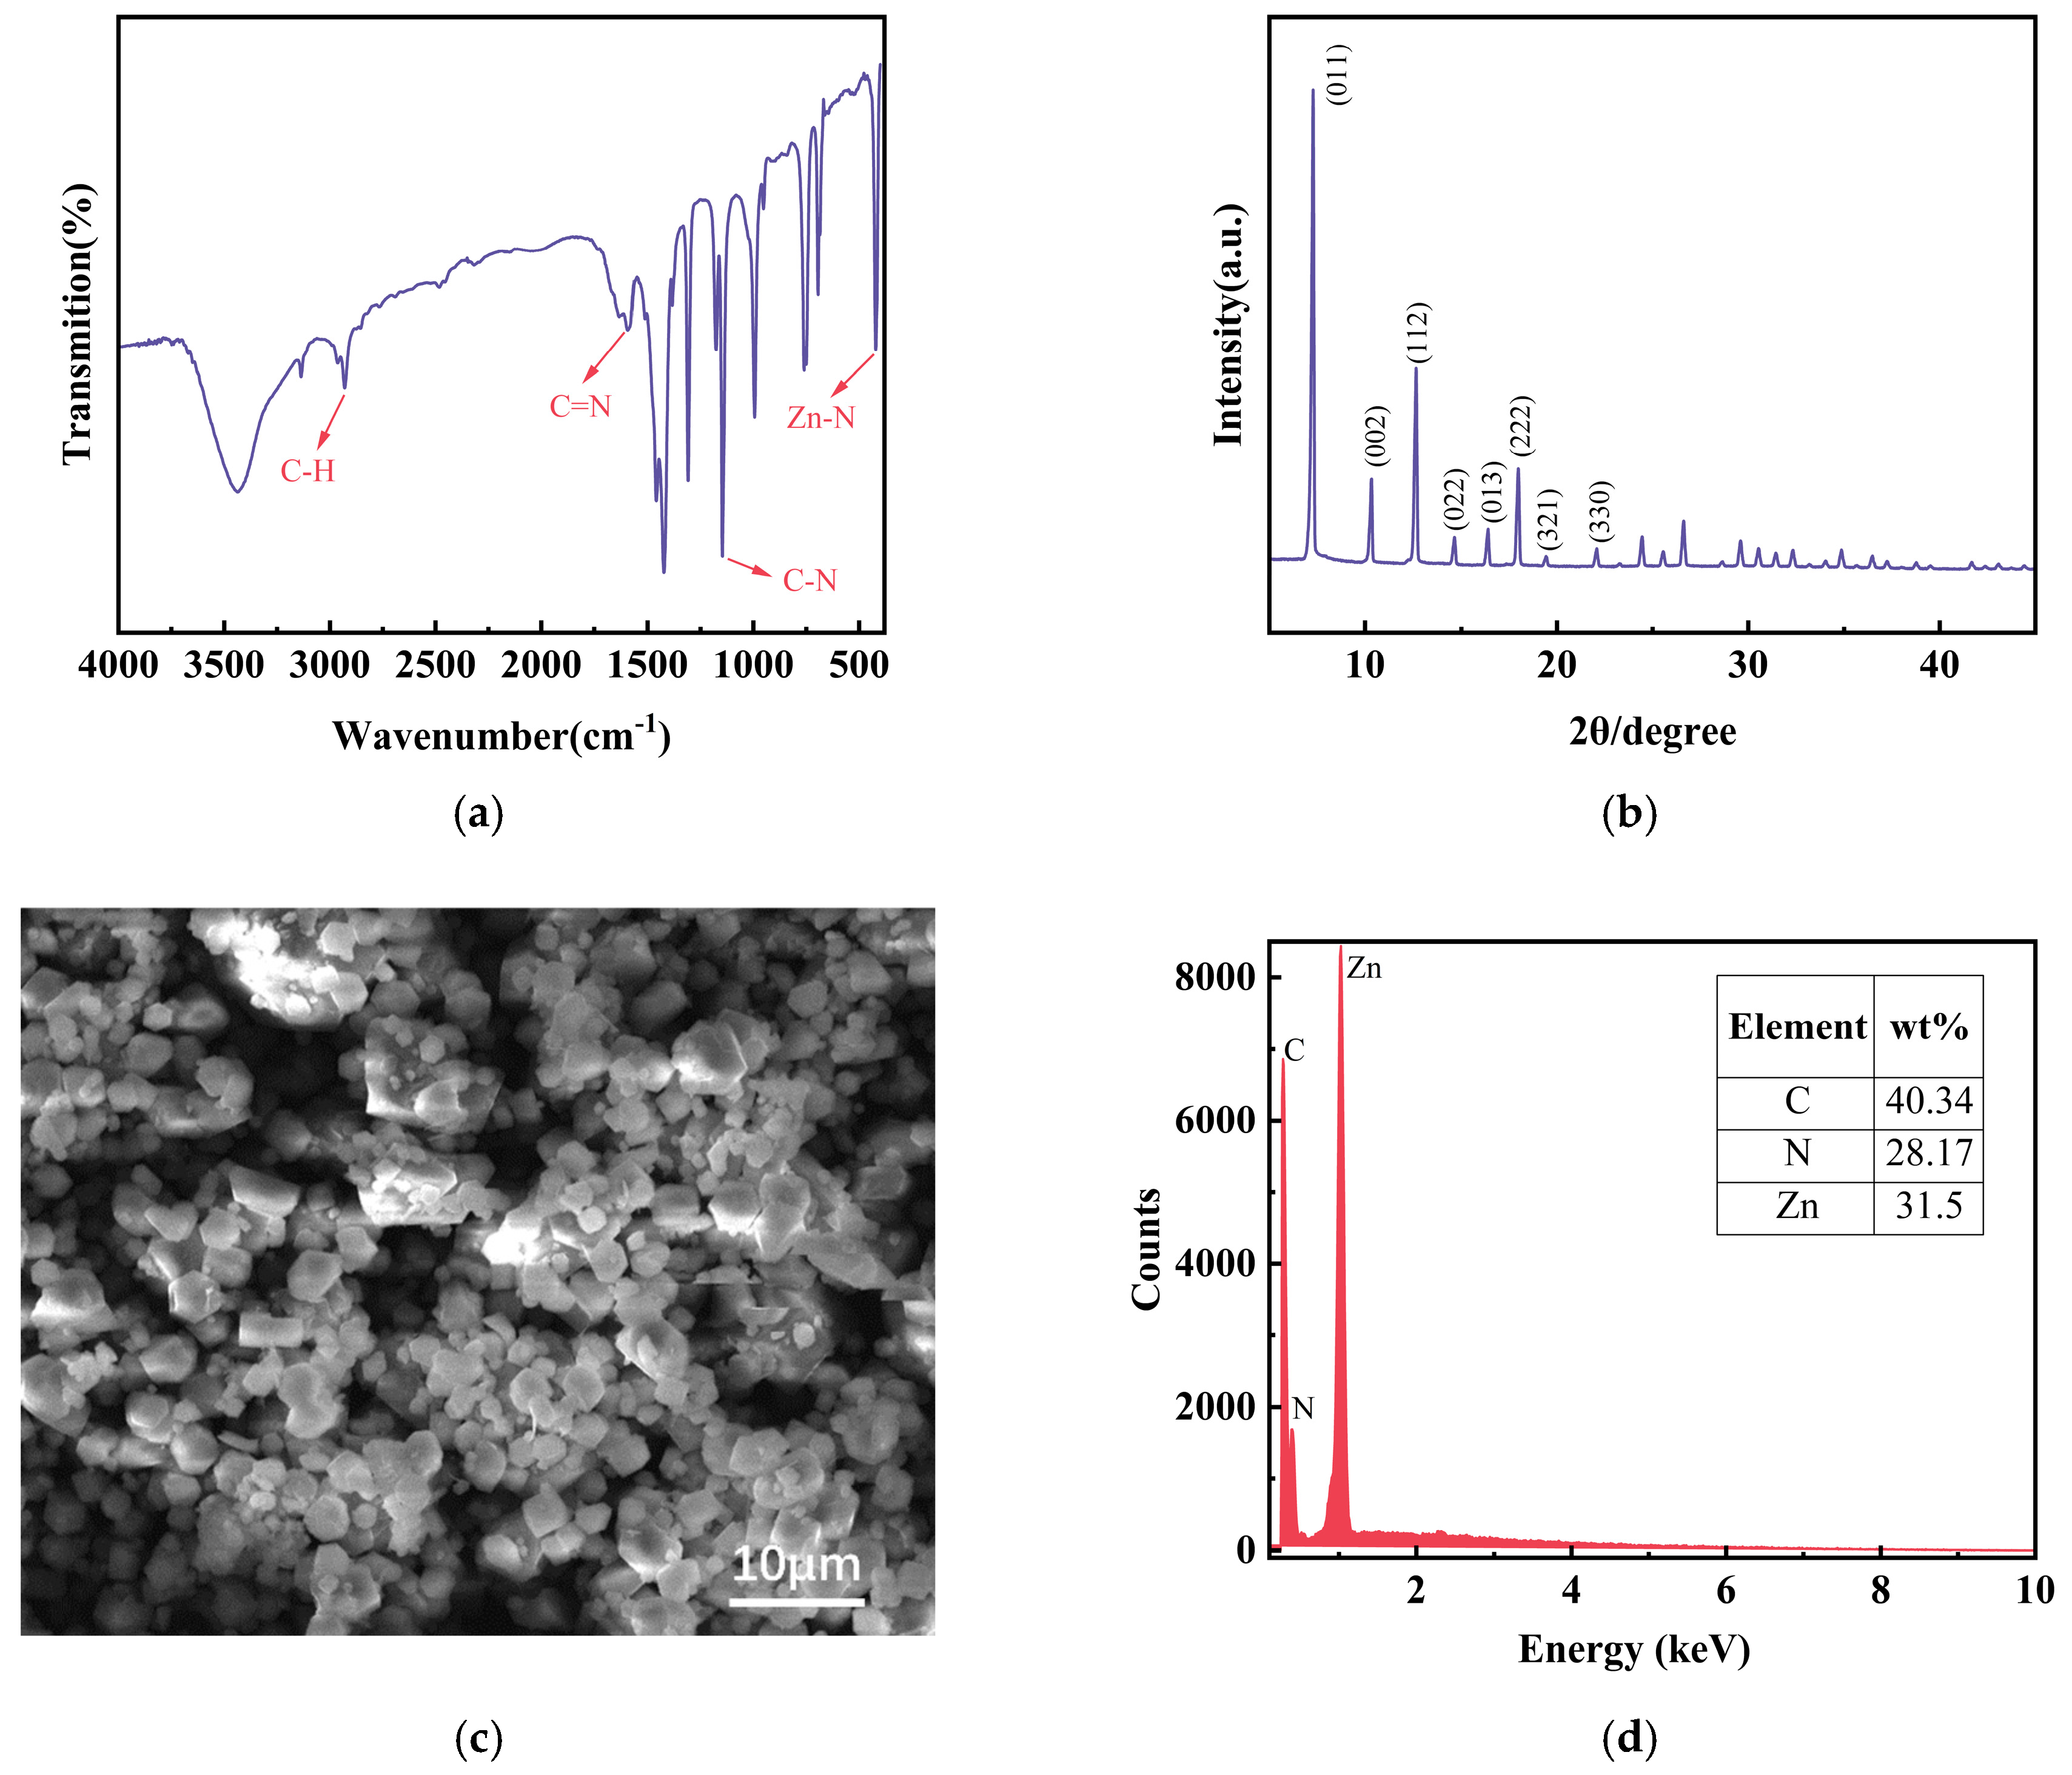
The chemical bonding of ZIF-8 was analyzed using FTIR, and the FTIR spectrum is shown in Figure 2a. Significant peaks observed at 2930 cm−1 and 3136 cm−1 correspond to aliphatic–aromatic C–H stretching vibrations of 2-MIM. At 1586 cm−1, the absorption peak represents the carbon–nitrogen stretching vibration, the absorption peak at 1350–1500 cm−1 is attributed to the stretching vibration of the aromatic ring, the absorption peak at 900–1350 cm−1 corresponds to the in-plane bending of the imidazole ring, and the absorption peaks at 600–800 cm−1 are caused by the out-of-plane bending of the ring [31]. In addition, the zinc–nitrogen stretching vibration Zn(NO3)2-6H2O in ZIF-8 matches the characteristic vibration at 423 cm−1 of the most important chemical bond produced by the reaction of 2-MIM. ZIF-8 nanocrystals are shown in Figure 2b. for XRD characterization, and their diffraction peak positions are in perfect agreement with those reported in the literature [32]. The strongest (011) facet diffraction peak is observed at 2θ = 7.27°, while the characteristic diffraction peaks of (002), (112), and (222) facets are detected at 10.3°, 12.36°, and 17.97°, respectively. Feature peaks of the remaining (022), (013), (321), and (330) series of crystalline surfaces exactly match what has been reported. Scanning electron microscopy and X-ray energy spectroscopy were used to analyze the morphology and constituent elements of the ZIF-8 samples to further verify whether the ZIF-8 samples were successfully prepared. SEM characterization is shown in Figure 2c; the synthesized ZIF-8 particles exhibit a rhombic dodecahedral morphology with an average particle size of about 119.8 nm. This well-defined structure is characteristic of high-quality ZIF-8 and provides a large surface area for subsequent modification. In order to minimize the risk of the formation of ZIF-8, the EDS spectra of ZIF-8 are shown in Figure 2d. The prepared ZIF-8 consists of the elements C (40.34%), N (28.17%), and Zn (31.50%), and the elemental ratios are basically consistent with those in the literature [33].
In addition, the interfacial morphology and elemental composition of the CuNPs/ZIF-8 modified electrodes were analyzed using SEM and EDS. As shown in Figure 3a. after electrodeposition of CuNPs, it can be clearly seen that the contours of the ZIF-8 particles are significantly brighter and have a clearer appearance, and it can be confirmed that the CuNPs are deposited on ZIF-8, which enhances the overall electrical conductivity. The EDS image of CuNPs/ZIF-8 is shown in Figure 3b. and the inserted table lists the elemental compositions, respectively. The mass fractions of C, N, Zn, and Cu are 36.30%, 25.72%, 28.86%, and 3.39%, respectively. Result showed that CuNPs were dispersed on the surface of ZIF-8 to form CuNPs/ZIF-8 nanocomposites, and the content of C, N, and Zn in the material was reduced after the modification of CuNPs. Taken together, these results indicate that CuNPs have been successfully modified on ZIF-8 particles. The positions of the signal peaks of Cu and Zn in the EDS spectra results are different but very close to each other. Since the Cu content is much lower than the Zn content, it results in the Cu peak being covered by the Zn peak signal, but from the EDS surface scanning results, it can be seen that the Cu element is uniformly distributed on the surface of ZIF-8, as shown in Figure 3.

3.2. Electrochemical Characterization of AFB1 Aptamer Sensors

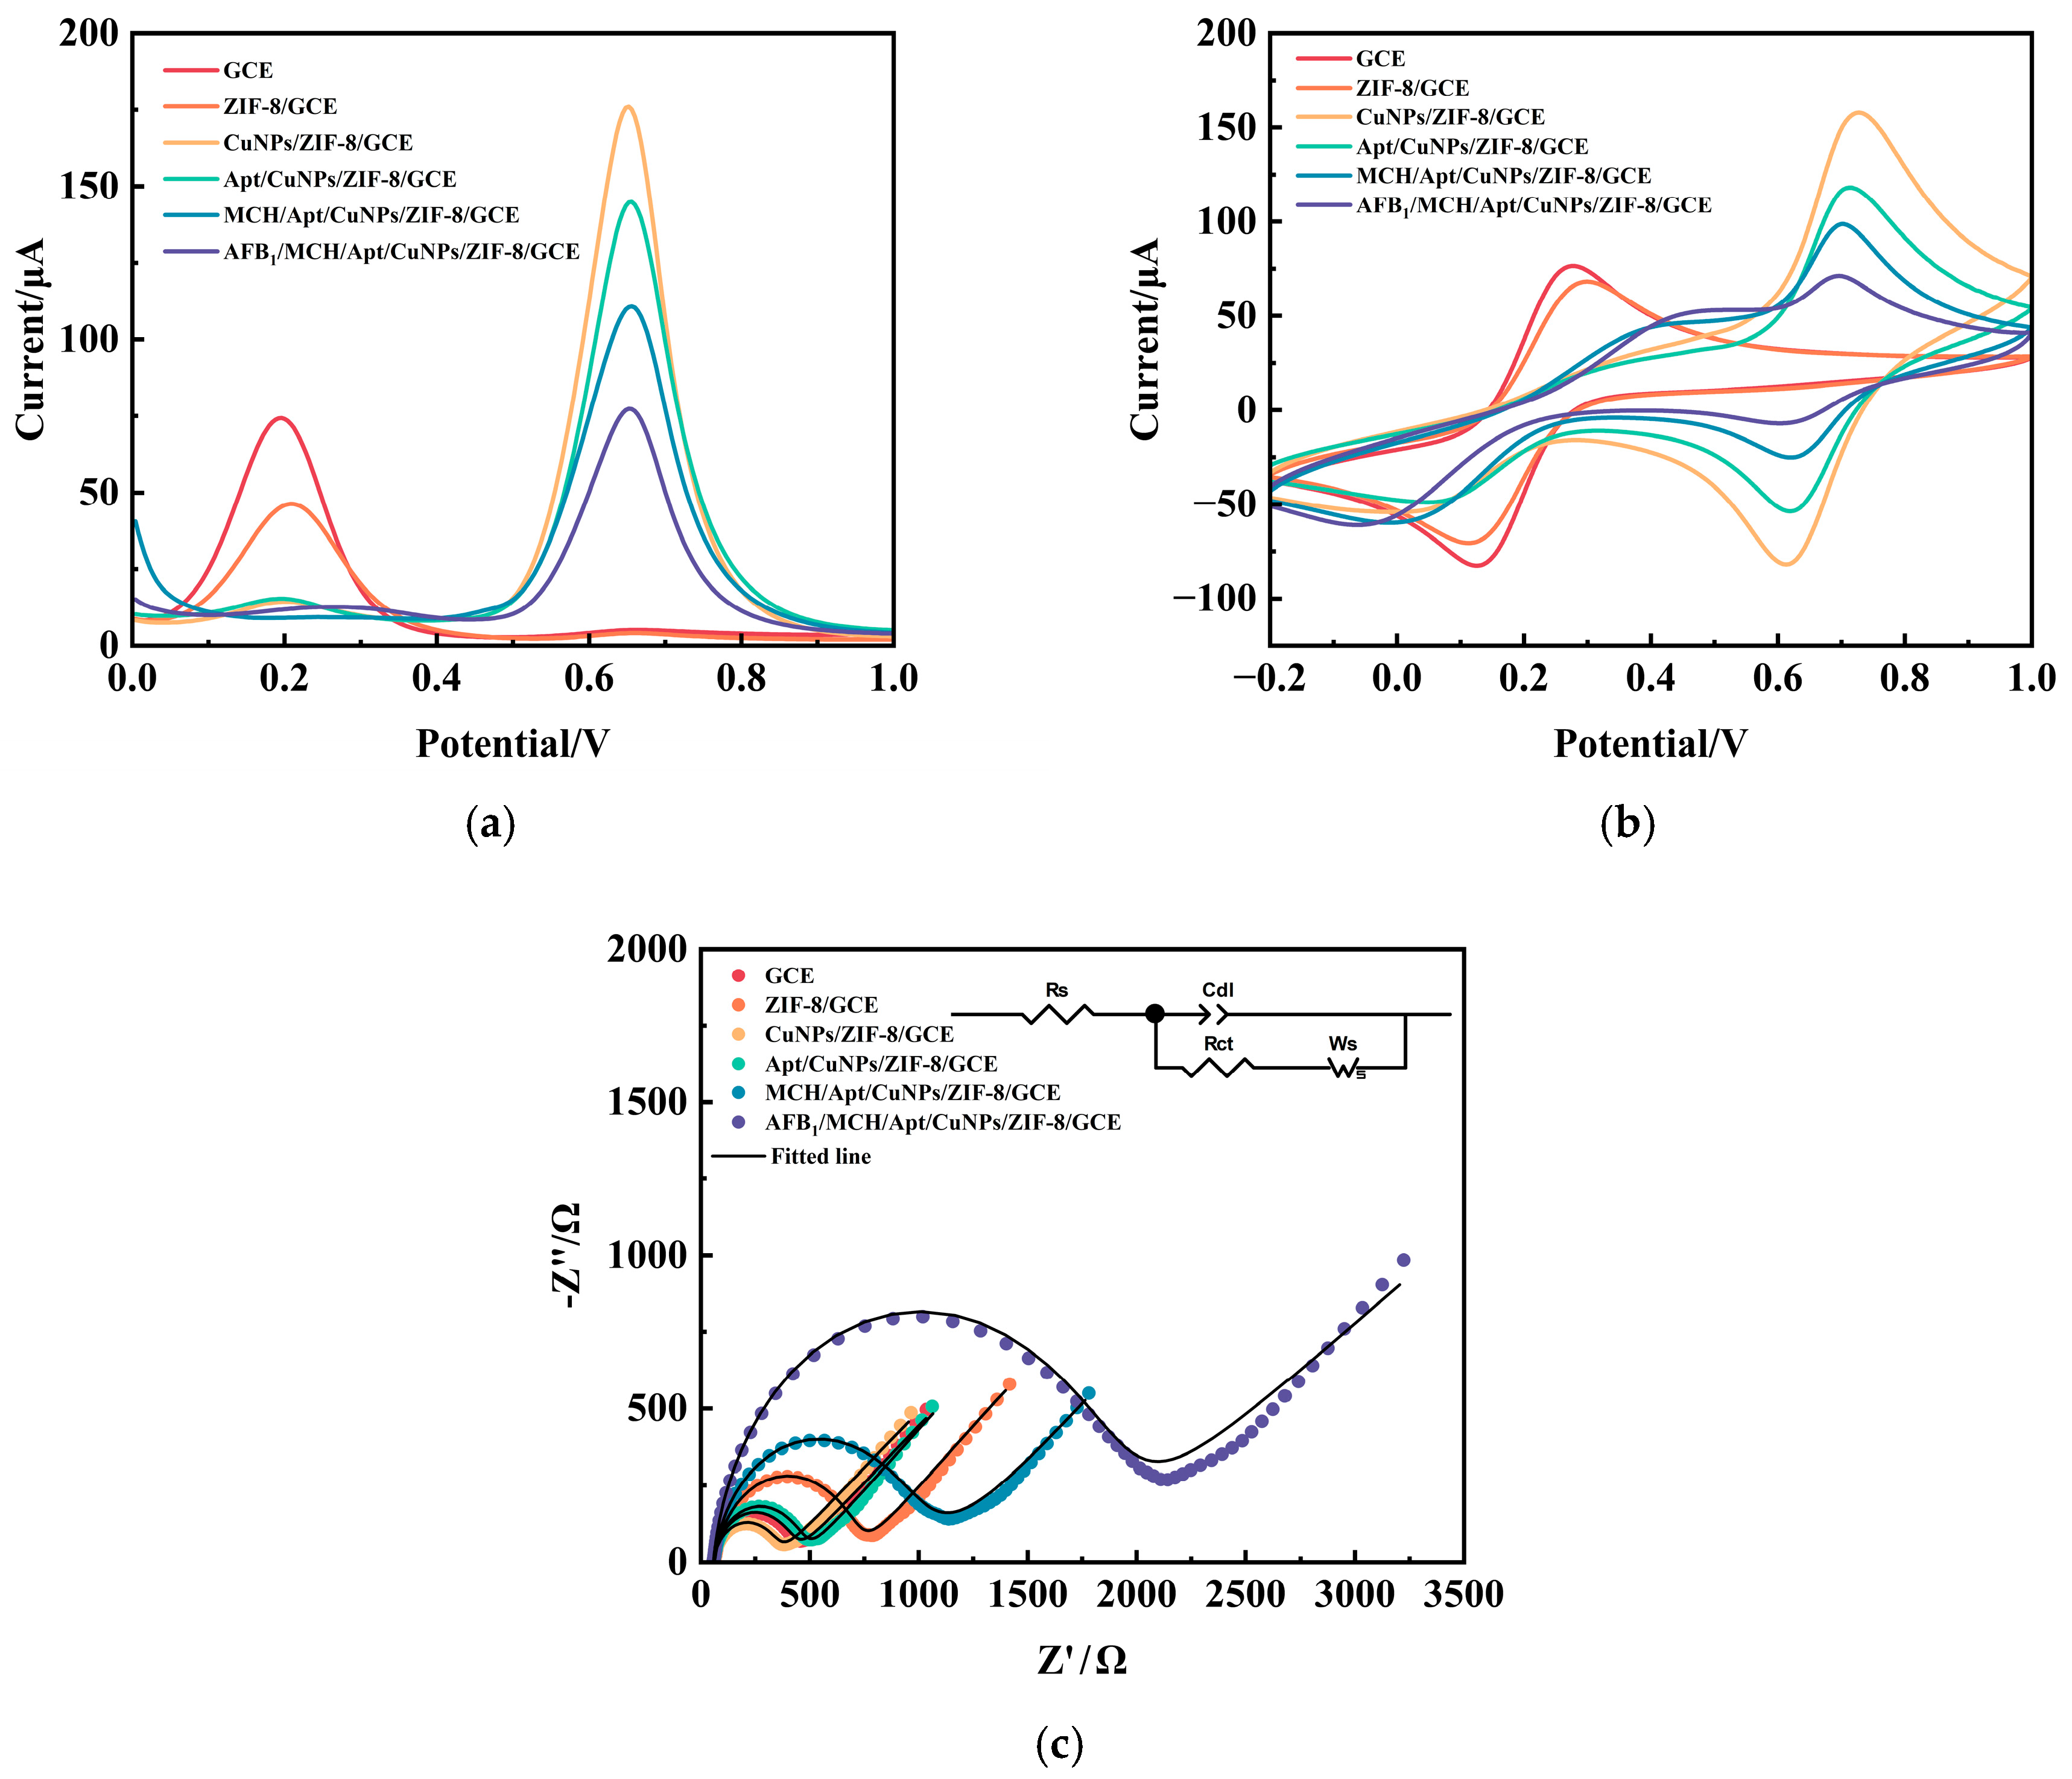
The stepwise modification of the electrode was first monitored by DPV in a 5.0 mM [Fe(CN)6]3−/4− solution (containing 0.1 M KCl) over a potential range of 0.0 to 1.0 V (pulse amplitude: 50 mV; pulse period: 0.5 s). The corresponding DPV responses are displayed in Figure 4a. The peak current (Ip) of the bare GCE is 74.02 μA. After modification with ZIF-8, the Ip value decreased significantly to 46.34 μA. This decay is attributed to the intrinsic insulating nature of the ZIF-8 framework, which acts as a kinetic barrier to the interfacial electron transfer of the [Fe(CN)6]3−/4− redox probe. Subsequent electrodeposition of CuNPs on the ZIF-8/GCE surface dramatically enhanced the electron transfer kinetics, with a significant increase in Ip to 176 μA. This enhancement, along with the apparent change in peak potential, is a strong indicator of the successful formation of CuNPs. The large increase in current suggests that CuNPs not only restore electrical conductivity but also have the potential to catalyze redox reactions, possibly due to their high electrical conductivity and large effective surface area. Immobilization of the thiolated AFB1 aptamer by Cu–S covalent bonds (Apt/CuNPs/ZIF-8/GCE) reduced Ip to 145 μA. Since the biomolecular layer partially blocks the entry of the redox probe, this reduction confirms the successful anchoring of the aptamer chains to the electrode surface. After further treatment with MCH to block the non-specific binding sites on the surface of CuNPs, Ip was further reduced to 110.8 μA (MCH/Apt/CuNPs/ZIF-8/GCE). This is due to the formation of a dense, insulating alkanethiol monolayer that further hinders electron transfer. Finally, the specific binding of AFB1 to its aptamer causes conformational changes in the structure of the aptamer, such as folding or shrinking, resulting in the formation of larger insulating complexes on the electrode surface. This event led to a further significant decrease in peak current to 77.34 μA (AFB1/MCH/Apt/CuNPs/ZIF-8/GCE), which is the basic signaling mechanism for quantitative detection of AFB1.
To further corroborate the DPV findings, the modification process was also characterized by CV at a scan rate of 50 mV/s within a potential window of −0.2 to 1.0 V (vs. SCE). The resulting voltammograms are presented in Figure 4b. The CV curve of bare GCE shows a pair of well-defined redox peaks corresponding to the reversible reaction of the [Fe(CN)6]3−/4− probe. The peak current of the ZIF-8/GCE electrodes is significantly lower, and the peak-to-peak spacing (ΔEp) is significantly higher compared to those of the bare GCE. This is typical of the slowing down of electron transfer kinetics, and the insulating properties of the ZIF-8 layer are undoubtedly responsible for this phenomenon. The CV response of CuNPs/ZIF-8/GCE electrodes changed significantly after electrodeposition of CuNPs. Not only was there a significant increase in peak current, indicating restoration or even enhancement of conductivity, but there was also a significant change in peak potential. In addition, the peak appearing at about 0.656 V is likely caused by the redox reaction (e.g., Cu0 to Cu+/Cu2+) of the CuNPs themselves, providing direct electrochemical evidence for their successful deposition. This overall behavior confirms that CuNPs form an excellent conducting network that promotes electron transfer and may also catalyze the [Fe(CN)6]3−/4− redox reaction. Subsequent assembly steps resulted in a sequential decay of the CV signal. As biomolecules increasingly blocked the redox probes from entering the electrode surface, the affixed aptamers (Apt/CuNPs/ZIF-8/GCE) and the MCH blocking layer (MCH/Apt/CuNPs/ZIF-8/GCE) led to a gradual decrease in the peak current. Finally, specific binding of AFB1 induced the largest decrease in current due to the formation of a bulky, insulating Apt–AFB1 complex that severely impedes electron transfer.
The interfacial charge transfer resistance (Rct) was quantified for each fabrication step using EIS. All EIS measurements were performed at open-circuit potential (OCP) using a sinusoidal perturbation with an amplitude of 5 mV over the frequency range of 0.1 Hz to 100 k Hz. The obtained Nyquist plots are shown in Figure 4c. Impedance data were fitted using an randlers equivalent circuit consisting of a solution resistor (Rs), a charge transfer resistor (Rct), a constant phase element (CPE) reflecting the double-layer capacitance, and a short-circuiting Warburg element (Ws).The fitted data are in good agreement with the experimental results, verifying the correctness of the chosen model. The bare GCE shows a low Rct value (406 Ω), indicating that the electron transfer process in the [Fe(CN)6]3−/4− redox couple is very easy. After modification of the electrode (ZIF-8/GCE) with ZIF-8, a significant increase in Rct to 729 Ω was observed. This large increase quantitatively confirms that the ZIF-8 layer plays an important role as a kinetic barrier, severely hindering electron transfer. After electrodeposition of CuNPs (CuNPs/ZIF-8/GCE), a sharp decrease in Rct to 321 Ω was recorded. This value is significantly lower than that of bare GCE, providing convincing quantitative evidence that CuNPs form a highly conductive substrate on the ZIF-8 surface, which not only mitigates the insulating effect but also positively promotes charge transfer, possibly due to their electrocatalytic properties and high specific surface area. Subsequent functionalization steps lead to a gradual increase in Rct, which is consistent with the formation of an increasingly insulating layer on the electrode surface. Immobilization of the aptamer (Apt/CuNPs/ZIF-8/GCE) increases Rct, confirming successful attachment of the biomolecule. Subsequent blockade with the insulating molecule MCH (MCH/Apt/CuNPs/ZIF-8/GCE) resulted in a more pronounced increase in Rct. Finally, the binding of AFB1 yields the largest Rct value (2085 Ω), which is attributed to the formation of a bulky insulating complex that maximizes steric hindrance and further blocks the electron transfer pathway. The monotonic, stepwise evolution of the interfacial properties, quantitatively tracked by fitting Rct values, provides strong complementary evidence to the DPV and CV results, unequivocally demonstrating the successful assembly of the sensitive sensor and its specific response to the target.

3.3. Optimization of AFB1 Aptamer Sensor Preparation Conditions

In order to improve the detection ability of this sensor, the effects of various factors on the sensor were investigated, and the conditions such as the volume of ZIF-8 dispersant, the electrodeposition time of CuNPs, the concentration of sensitizers, the volume of MCH, and the incubation time of AFB1 were optimized in the preparation of the sensor. Electrodes modified under different conditions were incubated with 5 μL of AFB1 solution at a concentration of 1 ng/mL. All conditions were optimized for measurement using the DPV method, while the same substrate and the same settings as those used in the actual measurements were chosen for experimental rigor.
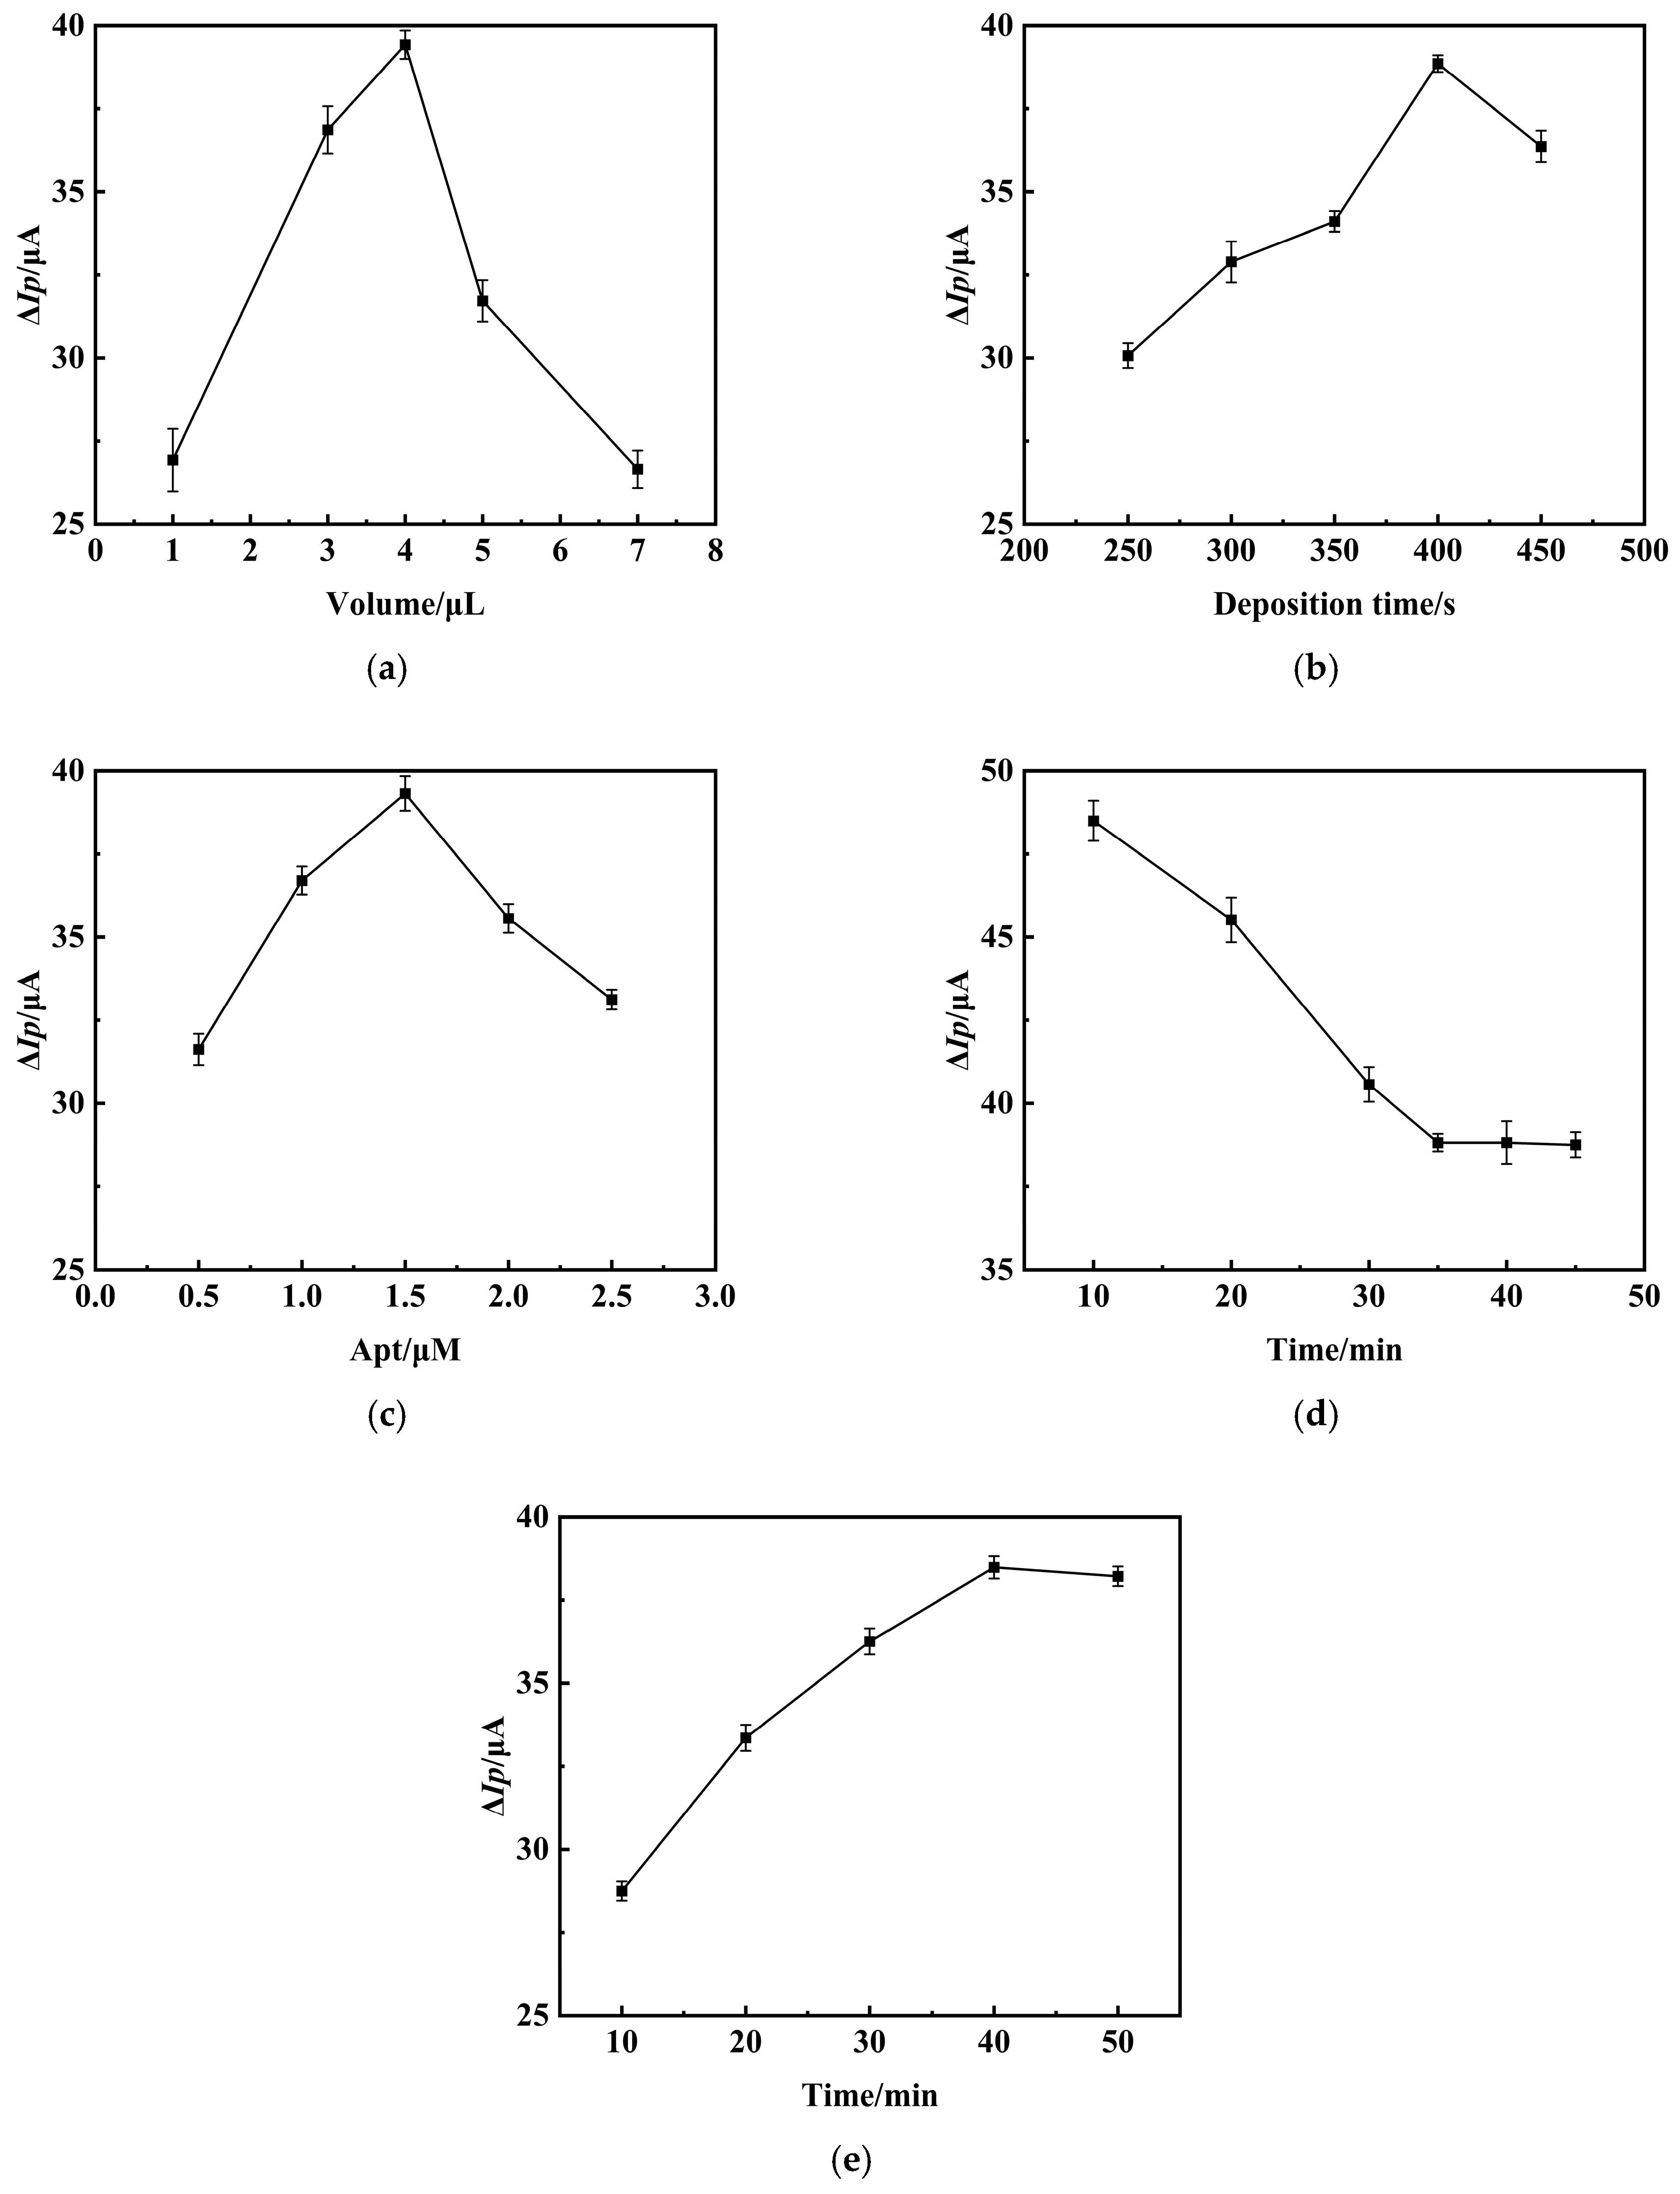
ZIF-8 provides more binding sites for subsequent different modifications due to its high specific surface area, but the volume of ZIF-8 dispersion modified on the electrode surface has an impact on the detection performance of the sensor. In Figure 5a, as the volume of ZIF-8 dispersion increased from 1 μL to 4 μL, ΔIp value also increased significantly, and this change reflected that the high specific surface area of ZIF-8 provided more attachment sites, which effectively enhanced the adsorption capacity of AFB1. A significant decrease in ΔIp values was observed when the volume of ZIF-8 dispersed liquid was further increased to 5 μL and 7 μL. This indicated that although the micropores of ZIF-8 allowed the passage of small molecules, the thickness of the modified layer increased as the volume of the dispersed liquid increased, hindering electron transfer. Therefore, 4 μL of ZIF-8 dispersion was selected as the optimal volume to modify the electrode.
Prototypes, sizes, conductivity, and catalytically active sites of CuNPs are important factors affecting the performance of aptamer sensors, while different electrodeposition times are the key to influencing the various factors mentioned above. The values of ΔIp after incubation with AFB1 were different for sensors with different electrodeposition times (250 s, 300 s, 350 s, 400 s, 450 s). In Figure 5b, the electrodeposition time is increased from 250 s to 400 s, and the sensor produces a higher response with gradually increasing ΔIp values. The electrodeposition time was further increased to 450 s. Possibly due to the agglomeration or overgrowth of deposited CuNPs over a long period of time, large-sized particles are formed, which reduces the effective specific surface area, leading to a decrease in the active sites and a decrease in the electron transfer efficiency. Therefore, 400 s was chosen as the optimal electrodeposition time for the preparation of the sensor.
Since the AFB1 nucleic acid aptamer reacts with AFB1 in a highly specific molecular recognition reaction, the performance of the aptamer sensor is dependent on the concentration of the nucleic acid aptamer immobilized on the electrode surface. As shown in Figure 5c, the change in the ΔIp value of the sensor response increased as the aptamer concentration was increased from 0.5 μmol/L to 1.5 μmol/L. However, the ΔIp values decreased significantly with further increase in the concentration of nucleic acid aptamer. This may be due to the fact that high concentrations of aptamers form a dense multilayer membrane that greatly impedes electron transfer and may lead to steric hindrance between the aptamer molecules, decreasing the effective recognition site for their binding to the target, leading to a decrease in the baseline current (when not bound to AFB1) itself and thus, to a decrease in the ΔIp value. Therefore, a nucleic acid aptamer concentration of 1.5 μmol/L was used for further experiments.
MCH’s terminal -SH bonds form strong Cu–S bonds with copper atoms, forming an ordered monomolecular layer on the copper surface that covers the surface-active sites of CuNPs that are not occupied by the probe. In order to avoid false-positive signals by AFB1 binding to CuNPs through physical adsorption or electrostatic interaction, it is necessary to utilize MCH for closure. In this experiment, the effect of different closure times (10, 20, 30, 35, 40, 45 min) was investigated. As shown in Figure 5d, the ΔIp value decreased with the increase in the closure time, and gradually stabilized up to 35 min. Therefore, 35 min was selected as the optimal closure time in the subsequent detection experiments.
The effect of different AFB1 incubation times (10, 20, 30, 40, 50 min) on the response of this sensor was investigated, and the results are shown in Figure 5e. The ΔIp value gradually increased with the incubation time and peaked at 40 min. ΔIp values then decreased as the time was increased to 50 min, but had essentially stabilized. This indicates that the binding of AFB1 to the aptamer is saturated. Consequently, 40 min was chosen as the optimal incubation time for AFB1.

3.4. Detection of AFB1 by the Aptamer Sensor DPV

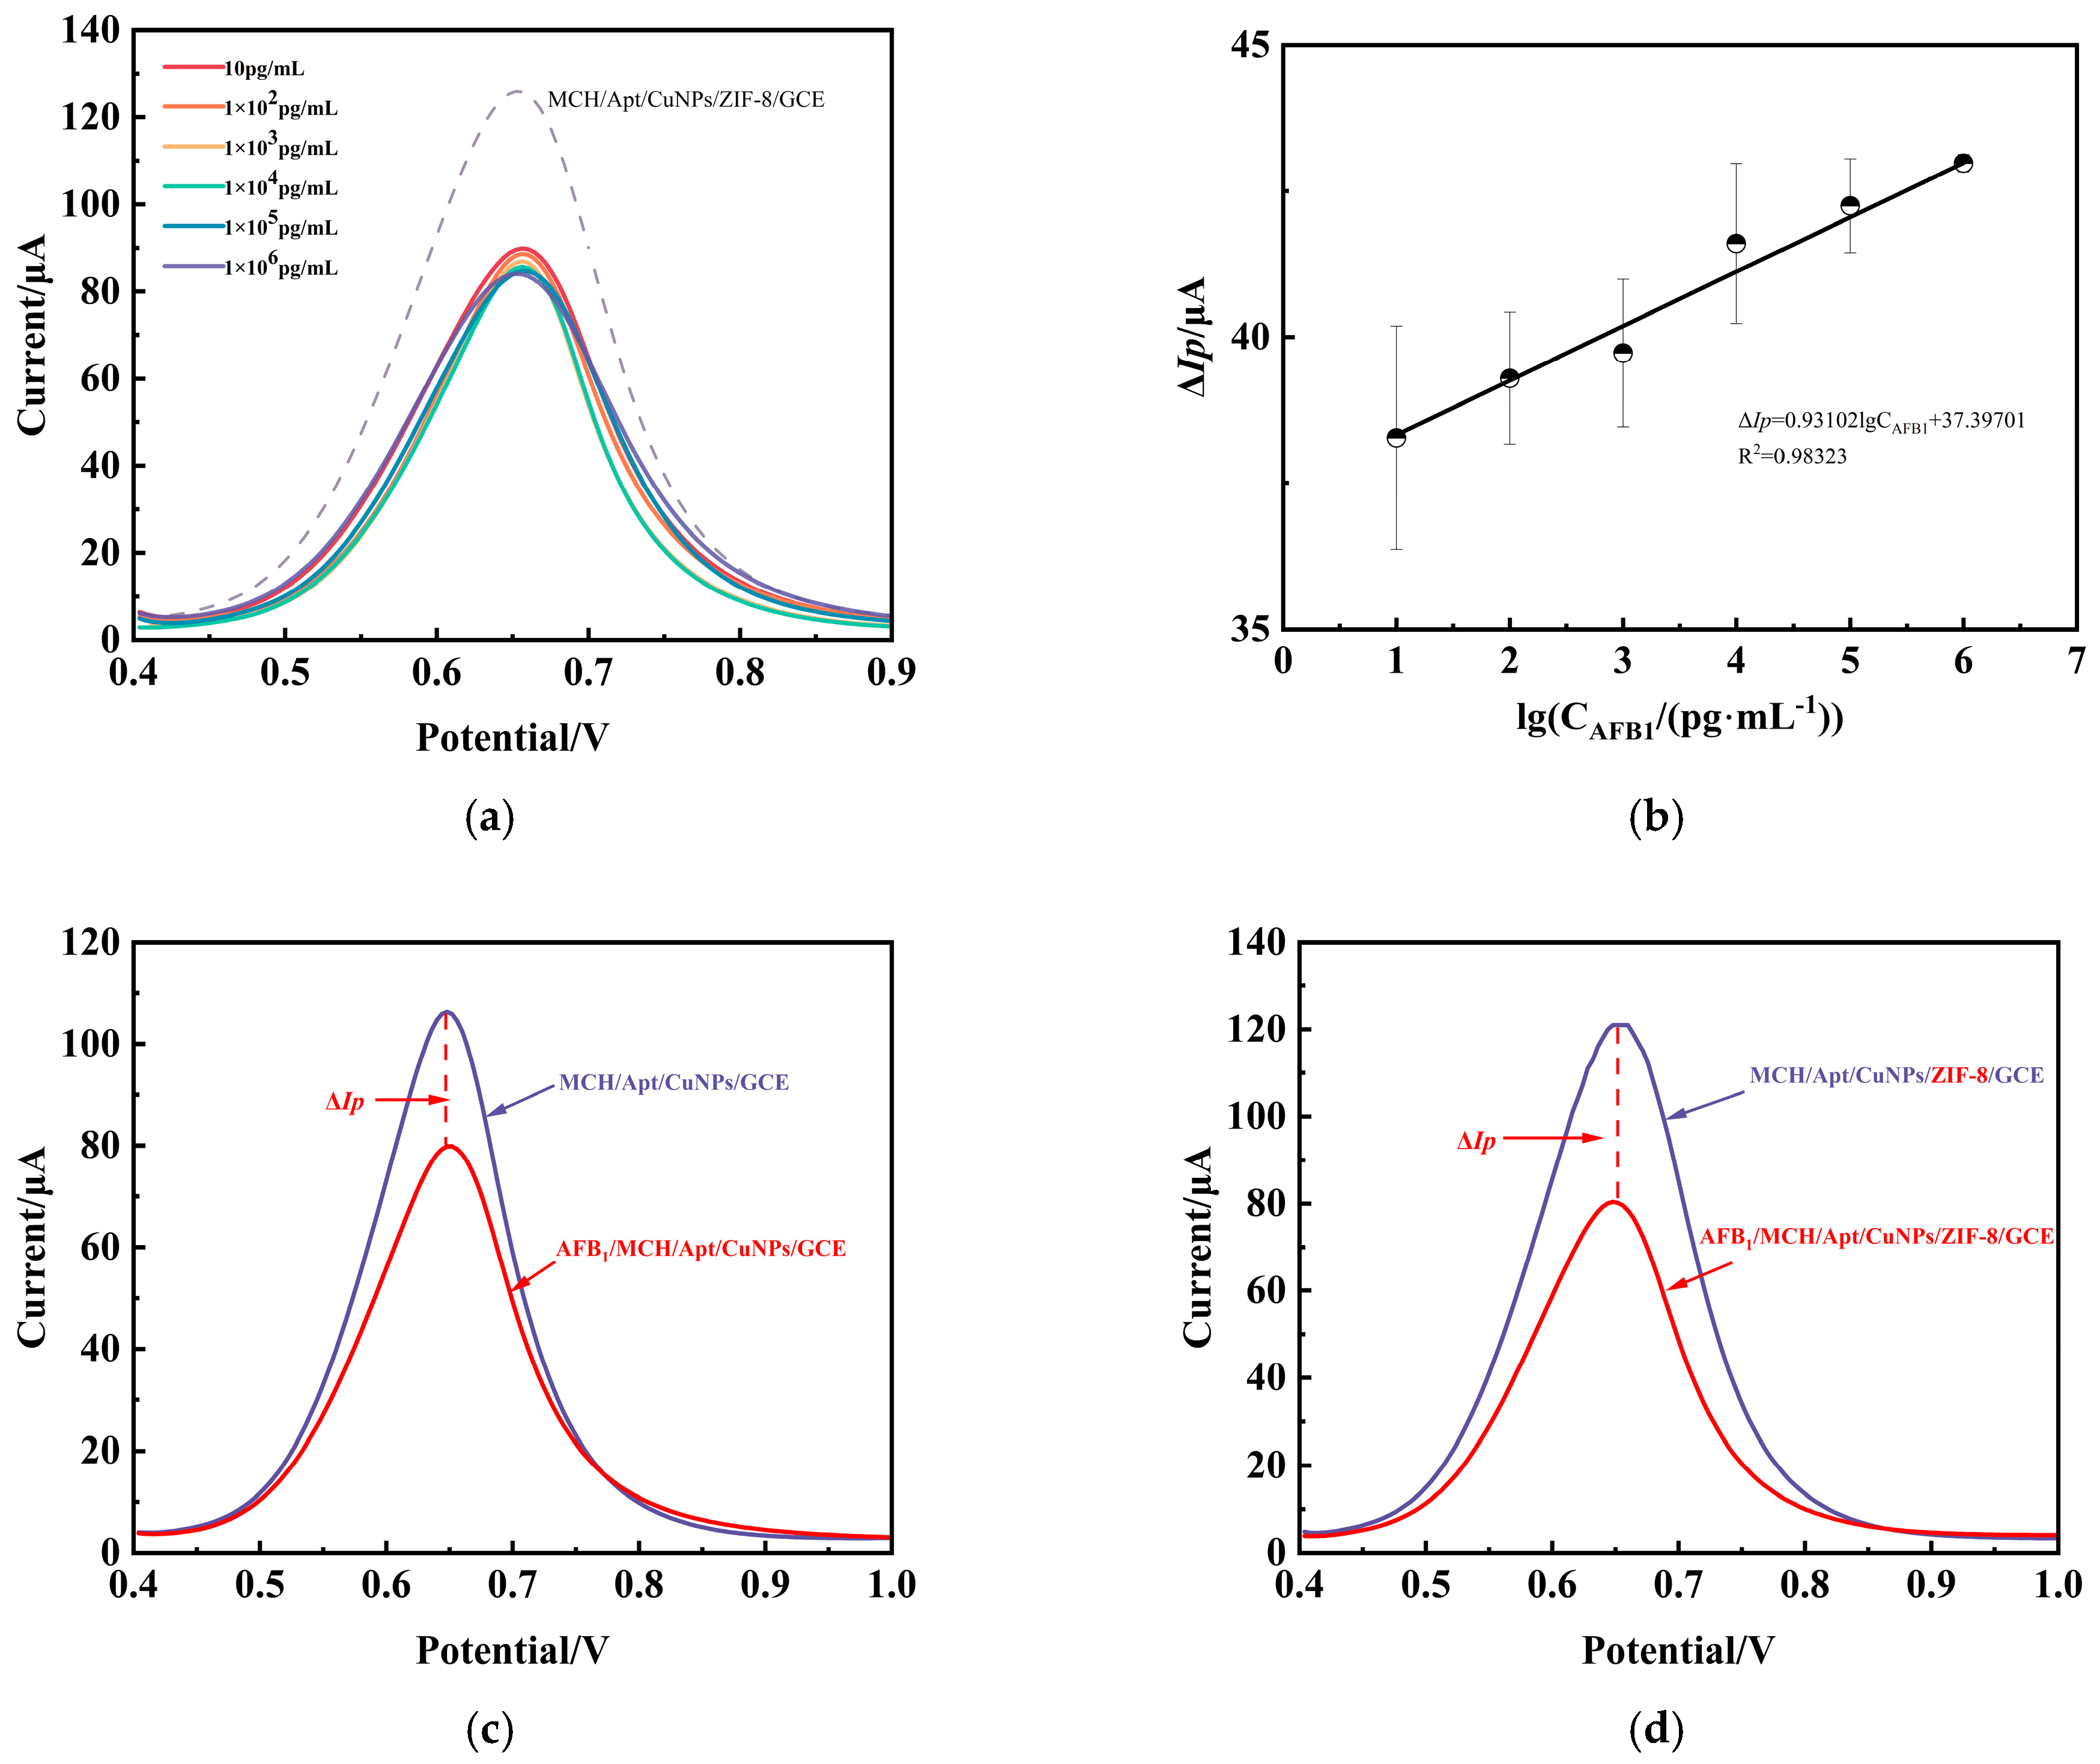
To further explore the ability of this aptamer sensor to detect AFB1, the electrical signals of this aptamer sensor were measured before and after incubation with different concentrations of AFB1 under optimal conditions using the DPV method. As shown in Figure 6a, the peak current value of DPV decreased with increasing AFB1 concentrations. For this reason, when AFB1 binds to the aptamer, the aptamer folds from a single-chain structure to a three-bit structure, and the increase in size hinders electron transfer, resulting in poorer electrical conductivity. As shown in Figure 6b, there was a corresponding linear relationship between the logarithm of the AFB1 concentration and the ΔIp value, with concentrations ranging from 10 pg/mL to 1.0 × 10⁶ pg/mL. The linear regression equation was ΔIp = 0.93102lgCAFB1 + 37.39701, and the lowest detection limit was 1.13 pg/mL. The LOD was determined from 3S/N, LOD = 3·S/N, where S is the standard deviation of the intercept, and N is the slope of the calibration curve. In addition, signal amplification strategies are crucial among the factors affecting the sensitivity of aptamer sensors. As a comparison, after incubation of 1.0 ng/mL AFB1 in the aptamer sensors using two different modification methods, the ΔIp value of the sensor unmodified with ZIF-8 was 26.44 μA, as shown in Figure 6c. In contrast, the aptamer sensor modified with ZIF-8 showed a stronger change in response, i.e., an ΔIp value of 40.9 μA, as shown in Figure 6d. This is attributed to the rhombic dodecahedral microporous structure and high specific surface area of the ZIF-8 material itself, which significantly increases the loading of CuNPs and aptamers and enhances the detection sensitivity.
Also, the performance of the proposed detection technique for this sensor is compared with the performance of other reported AFB1 detection sensors, as shown in Table 1. Comparative data showed that the linear range and detection limit of this aptamer sensor for AFB1 were significantly better than those for most of the reported sensors. Among them, the electrochemiluminescence sensor based on a zirconium-based metal–organic skeleton showed a lower detection limit, but the present sensor exhibits certain advantages in terms of manufacturing cost and detection linear range. Moreover, the photoelectrochemical sensor based on polycarboxylate ionic liquid-functionalized Yb-MOFS nanorods exhibited an ultra-low detection limit and achieved simultaneous detection of AFB1 and OTA (Ochratoxin A), which provides a new idea for our future research.

3.5. Real Sample Analysis

Spiked recoveries were measured in previously pretreated real corn samples to assess the applicability and reliability of the developed electrochemical aptamer sensor for detection and analysis in real corn samples. Three different concentrations (1.0 ng/mL, 10.0 ng/mL, and 100 ng/mL) of AFB1 spiked in the corn samples were tested for recovery using the DPV method, and the measurements are presented in Table 2. Recovery ranged from 96.663% to 105.72%. The results indicate that the developed electrochemical aptamer sensor can be applied in real corn samples with certain reliability.

4. Conclusions

In conclusion, we successfully constructed a highly sensitive and selective electrochemically induced sensor for AFB1 detection based on a novel CuNPs/ZIF-8 nanocomposite platform. This study conclusively demonstrated that the ZIF-8 framework is an excellent substrate for anchoring and dispersing CuNPs, which in turn have dual functions. This platform offers an efficient surface for stable immobilization of thiolate aptamers through robust Cu–S covalent bonding. Its excellent electrocatalytic properties and conductivity significantly amplify the signal. Under optimal conditions, the proposed sensors offer highly competitive analytical performance, including ultra-low detection limits, wide linear ranges, and satisfactory reproducibility. The usefulness of the sensor was initially verified by its successful application in corn samples, with satisfactory recoveries. However, this proof-of-concept study also revealed some challenges that point the way to future research. Stability, reusability, longevity, and validation of performance in oily matrices such as peanut oil and cooking oil remain to be addressed. By addressing these aspects, this sensor, based on a novel CuNPs/ZIF-8 nanocomposite, displays high potential for transformation into a reliable food safety monitoring tool.

Author Contributions

Conceptualization, C.W. and J.C.; methodology, C.W. and J.C.; validation, C.W., J.C., and Z.Z.; formal analysis, C.W., J.C., and Z.Z.; investigation, C.W. and Z.Z.; resources, C.W. and Z.Z.; data curation, J.C.; writing—original draft preparation, J.C.; writing—review and editing, C.W. and Z.Z.; visualization, C.W., Z.Z., and R.X.; supervision, C.W. and Z.Z.; project administration, C.W., Z.Z., and R.X.; funding acquisition, C.W. and Z.Z., All authors have read and agreed to the published version of the manuscript.

Funding

This research was supported by the Zhengzhou Science and Technology Bureau’s Natural Science Project Collaborative Innovation Special Program (22ZZRDZX07) and the Key Scientific Research Project of Henan Province Higher Education Institutions (26A535001).

Institutional Review Board Statement

Not applicable.

Informed Consent Statement

Not applicable.

Data Availability Statement

Data are contained within the article.

Conflicts of Interest

The authors declare no conflicts of interest.

References

  1. Song, C.; Yang, J.; Wang, Y.; Ding, G.; Guo, L.; Qin, J. Mechanisms and transformed products of aflatoxin B1 degradation under multiple treatments: A review. Crit. Rev. Food Sci. Nutr. 2024, 64, 2263–2275. [Google Scholar] [CrossRef]
  2. Tian, D.; Wang, J.; Zhuang, Q.; Wu, S.; Yu, Y.; Ding, K. An electrochemiluminescence biosensor based on Graphitic carbon nitride luminescence quenching for detection of AFB1. Food Chem. 2023, 404, 134183. [Google Scholar] [CrossRef]
  3. Wu, H.; Wang, H.; Wu, J.; Han, G.; Liu, Y.; Zou, P. A novel fluorescent aptasensor based on exonuclease-assisted triple recycling amplification for sensitive and label-free detection of aflatoxin B1. J. Hazard. Mater. 2021, 415, 125584. [Google Scholar] [CrossRef]
  4. Li, Y.; Liu, D.; Zhu, C.; Wang, M.; Liu, Y.; You, T. A ratiometry-induced successive reusable electrochemical aptasensing platform: Efficient monitoring of aflatoxin B1 in peanut. Sens. Actuators B Chem. 2021, 336, 129021. [Google Scholar] [CrossRef]
  5. Abd-Allah, G.A.; El-Fayoumi, R.I.; Smith, M.J.; Heckmann, R.A.; O’Neill, K.L. A comparative evaluation of aflatoxin B1 genotoxicity in fish models using the Comet assay. Mutat. Res./Genet. Toxicol. Environ. Mutagen. 1999, 446, 181–188. [Google Scholar] [CrossRef]
  6. Rushing, B.R.; Selim, M.I. Aflatoxin B1: A review on metabolism, toxicity, occurrence in food, occupational exposure, and detoxification methods. Food Chem. Toxicol. 2019, 124, 81–100. [Google Scholar] [CrossRef]
  7. Ghali, R.; Belouaer, I.; Hdiri, S.; Ghorbel, H.; Maaroufi, K.; Hedilli, A. Simultaneous HPLC determination of aflatoxins B1, B2, G1 and G2 in Tunisian sorghum and pistachios. J. Food Compos. Anal. 2009, 22, 751–755. [Google Scholar] [CrossRef]
  8. Zhao, Z.; Wang, H.; Zhai, W.; Feng, X.; Fan, X.; Chen, A.; Wang, M. A lateral flow strip based on a truncated aptamer-complementary strand for detection of type-B aflatoxins in nuts and dried figs. Toxins 2020, 12, 136. [Google Scholar] [CrossRef] [PubMed]
  9. Romero-Sánchez, I.; Ramírez-García, L.; Gracia-Lor, E.; Madrid-Albarran, Y. Simultaneous determination of aflatoxins B1, B2, G1 and G2 in commercial rices using immunoaffinity column clean-up and HPLC-MS/MS. Food Chem. 2022, 395, 133611. [Google Scholar] [CrossRef] [PubMed]
  10. Li, X.; Liu, L.; Song, S.; Sun, M.; Kuang, H.; Xu, C.; Guo, L. Colloidal gold immunochromatographic assay for the detection of total aflatoxins in cereals. Food Chem. 2025, 472, 142877. [Google Scholar] [CrossRef]
  11. Zhang, J.; Li, X.; Xie, J.; Huang, Z. Rapid and simultaneous detection of aflatoxin B1, zearalenone, and T-2 toxin in medicinal and edible food using gold immunochromatographic test strip. Foods 2023, 12, 633. [Google Scholar] [CrossRef] [PubMed]
  12. Charernchai, S.; Chikae, M.; Phan, T.T.; Wonsawat, W.; Hirose, D.; Takamura, Y. Automated paper-based femtogram sensing device for competitive enzyme-linked immunosorbent assay of aflatoxin B1 using submicroliter samples. Anal. Chem. 2022, 94, 5099–5105. [Google Scholar] [CrossRef]
  13. Batrinou, A.; Houhoula, D.; Papageorgiou, E. Rapid detection of mycotoxins on foods and beverages with enzyme-linked immunosorbent assay. Qual. Assur. Saf. Crops Foods 2020, 12, 40–49. [Google Scholar] [CrossRef]
  14. Pereira, C.S.; Cunha, S.C.; Fernandes, J.O. Validation of an enzyme-linked immunosorbent assay (ELISA) test kit for determination of aflatoxin B1 in corn feed and comparison with liquid-chromatography tandem mass spectrometry (LC-MS/MS) method. Food Anal. Methods 2020, 13, 1806–1816. [Google Scholar] [CrossRef]
  15. Wang, Y.; Deng, C.; Qian, S.; Li, H.; Fu, P.; Zhou, H.; Zheng, J. An ultrasensitive lateral flow immunoassay platform for foodborne biotoxins and pathogenic bacteria based on carbon-dots embedded mesoporous silicon nanoparticles fluorescent reporter probes. Food Chem. Chem. 2023, 399, 133970. [Google Scholar] [CrossRef]
  16. Li, S.; Zhong, X.; Xu, Y.; Zheng, Y.; Shi, X.; Li, F.; Guo, S.; Yang, J. Smartphone-based reading system integrated with phycocyanin-enhanced latex nanospheres immunoassay for on-site determination of aflatoxin B1 in foodstuffs. Food Chem. 2021, 360, 130019. [Google Scholar] [CrossRef]
  17. Hou, Y.; Jia, B.; Sheng, P.; Liao, X.; Shi, L.; Fang, L.; Zhou, L.; Kong, W. Aptasensors for mycotoxins in foods: Recent advances and future trends. Compr. Rev. Food Sci. Food Saf. 2022, 21, 2032–2073. [Google Scholar] [CrossRef]
  18. Liu, J.; Cao, Z.; Lu, Y. Functional nucleic acid sensors. Chem. Rev. 2009, 109, 1948–1998. [Google Scholar] [CrossRef] [PubMed]
  19. Zhang, Z.; Wu, C.; Zhao, Z. Detection of Aflatoxin B1 in Wheat Based on Nucleic Aptamer Chemiluminescence Sensor. Sensors 2025, 25, 988. [Google Scholar] [CrossRef] [PubMed]
  20. Zhang, S.; Wu, C.Z.; Zhao, Z.K.; Xu, K. An Electrochemical Immunosensor Based on Chitosan–Graphene Nanosheets for Aflatoxin B1 Detection in Corn. Molecules 2024, 29, 1461. [Google Scholar] [CrossRef]
  21. Jahangiri–Dehaghani, F.; Zare, H.R.; Shekari, Z. Measurement of aflatoxin M1 in powder and pasteurized milk samples by using a label–free electrochemical aptasensor based on platinum nanoparticles loaded on Fe–based metal–organic frameworks. Food Chem. 2020, 310, 125820. [Google Scholar] [CrossRef]
  22. Wang, Z.; Wang, C.; Hu, Q.; Lei, X.; Guo, R.; You, J.; Tian, Y.; Yang, F.; Lv, M. Covalent-metal organic frameworks: Preparation and applications. Chem. Eng. J. 2024, 483, 149217. [Google Scholar] [CrossRef]
  23. Trino, L.D.; Albano, L.G.S.; Granato, D.C.; Santana, A.G.; de Camargo, D.H.S.; Correa, C.C.; Bufon, C.C.B.; Leme, A.F.P. ZIF-8 metal–organic framework electrochemical biosensor for the detection of protein–protein interaction. Chem. Mater. 2021, 33, 1293–1306. [Google Scholar] [CrossRef]
  24. Pham, T.N.; Tien, V.M.; Ong, V.H.; Le, N.T.N.; Ho, T.N.L.; Le, H.D.T.; Hoa, N.Q.; Tran, H.V.; Xuan, D.N.; Quang, H.T.; et al. Electrochemical Kinetic Behaviors and Sensing Performance of Au@ ZIF-8 and Ag@ ZIF-8 Nanocomposites-Based Platforms Towards Ultrasensitive Detection of Chloramphenicol. J. Electrochem. Soc. 2024, 171, 077517. [Google Scholar] [CrossRef]
  25. Liu, J.; Wan, Z.; Wang, X.; Suo, Z.; Liu, Y.; Wei, M. A dual-signal ratiometric electrochemical aptasensor based on Thi/Au/ZIF-8 and catalytic hairpin assembly for ultra-sensitive detection of aflatoxin B1. Microchim. Acta 2024, 191, 256. [Google Scholar] [CrossRef]
  26. Zhao, X.; Zhao, H.; Yan, L.; Li, N.; Shi, J.; Jiang, C. Recent developments in detection using noble metal nanoparticles. Crit. Rev. Anal. Chem. 2020, 50, 97–110. [Google Scholar] [CrossRef]
  27. Putri, L.A.; Prabowo, Y.D.; Dewi, D.M.M.; Mumtazah, Z.; Adila, F.P.; Fadillah, G.; Amrillah, T.; Triyana, K.; Nugroho, F.A.A.; Wasisto, H.S. Review of noble metal nanoparticle-based colorimetric sensors for food safety monitoring. ACS Appl. Nano Mater. 2024, 7, 19821–19853. [Google Scholar] [CrossRef]
  28. Ahmadpor, H.; Milani-Hosseini, S.M.R. A comparative study of different techniques for quantum dot nano-particles immobilization on glass surface for fabrication of solid phase fluorescence opto-sensors. Surf. Interfaces 2021, 23, 100907. [Google Scholar] [CrossRef]
  29. Tian, Y.; Li, J.; Li, X.; Wang, R.; Zhang, Y.; Chen, W.; Song, K.; Wang, G.; Shi, G. ZIF-8/ZIF-67 solid electrolyte ozone sensor at room temperature. Sens. Actuators A Phys. 2023, 354, 114281. [Google Scholar] [CrossRef]
  30. Luo, J.; Jiang, S.; Zhang, H.; Jiang, J.; Liu, X. A novel non-enzymatic glucose sensor based on Cu nanoparticle modified graphene sheets electrode. Anal. Chim. Chim. Acta 2012, 709, 47–53. [Google Scholar] [CrossRef]
  31. Zhang, Z.; Chen, Y.; Hu, C.; Zuo, C.; Wang, P.; Chen, W.; Ao, T. Efficient removal of tetracycline by a hierarchically porous ZIF-8 metal organic framework. Environ. Res. 2021, 198, 111254. [Google Scholar] [CrossRef]
  32. Ahmad, U.; Ullah, S.; Rehman, A.; Najam, T.; Alarfaji, S.S.; Jamshaid, M.; Kumar, O.P.; Ullah, S.; Shahid, M.; Shah, S.S.A.; et al. ZIF-8 composites for the removal of wastewater pollutants. ChemistrySelect 2024, 9, 202401719. [Google Scholar] [CrossRef]
  33. Pei, Z.; Fei, P.; Zhang, A.; Guo, J.; Hao, J.; Jia, J.; Dong, H.; Shen, Q.; Wei, L.; Jia, H.; et al. Thermal oxygen sensitization modification and its visible light catalytic antibacterial performance for ZIF-8. J. Alloys Compd. 2022, 904, 164055. [Google Scholar] [CrossRef]
  34. Meng, D.; Gan, X.; Tian, T. An electrochemical sensing method for aflatoxin B1 detection based on Pt-coordinated titanium-based porphyrin MOF. Int. J. Electrochem. Sci. 2022, 17, 220247. [Google Scholar] [CrossRef]
  35. Li, Y.; Liu, D.; Zhu, C.; Shen, X.; Liu, Y.; You, T. Sensitivity programmable ratiometric electrochemical aptasensor based on signal engineering for the detection of aflatoxin B1 in peanut. J. Hazard. Mater. 2020, 387, 122001. [Google Scholar] [CrossRef]
  36. Jahangiri–Dehaghani, F.; Zare, H.R.; Shekari, Z. Simultaneous measurement of ochratoxin A and aflatoxin B1 using a duplexed-electrochemical aptasensor based on carbon nanodots decorated with gold nanoparticles and two redox probes hemin@ HKUST-1 and ferrocene@ HKUST-1. Talanta 2024, 266, 124947. [Google Scholar] [CrossRef]
  37. Rahmanian, H.; Malekkiani, M.; Dadmehr, M.; Es’haghi, Z.; Moshirian-Farahi, S.S. A biosensor integrating the electrochemical and fluorescence strategies for detection of aflatoxin B1 based on a dual-functionalized platform. Anal. Chim. Acta 2024, 1323, 343085. [Google Scholar] [CrossRef] [PubMed]
  38. Li, Y.; Dong, X.; Wu, T.; Zhang, X.; Ren, X.; Feng, R.; Du, Y.; Lee, J.; Liu, X.; Wei, Q. Zirconium based metal–organic frameworks with aggregation-induced electrochemiluminescence for sensitive analysis of aflatoxin B1 by signal dual-amplification strategy. Chem. Eng. J. 2024, 500, 157308. [Google Scholar] [CrossRef]
  39. Xu, L.; Li, W.; Hong, Y.; Cai, X.; Chen, X.; Liang, H.; Xu, X.; Wang, Y.; Li, C.; Sun, D. Polycarboxyl ionic liquid functionalized Yb-MOFs nanoballs based dual-wavelength responsive photoelectrochemical aptasensor for the simultaneous determination of AFB1 and OTA. Anal. Chim. Acta 2024, 1298, 342383. [Google Scholar] [CrossRef] [PubMed]
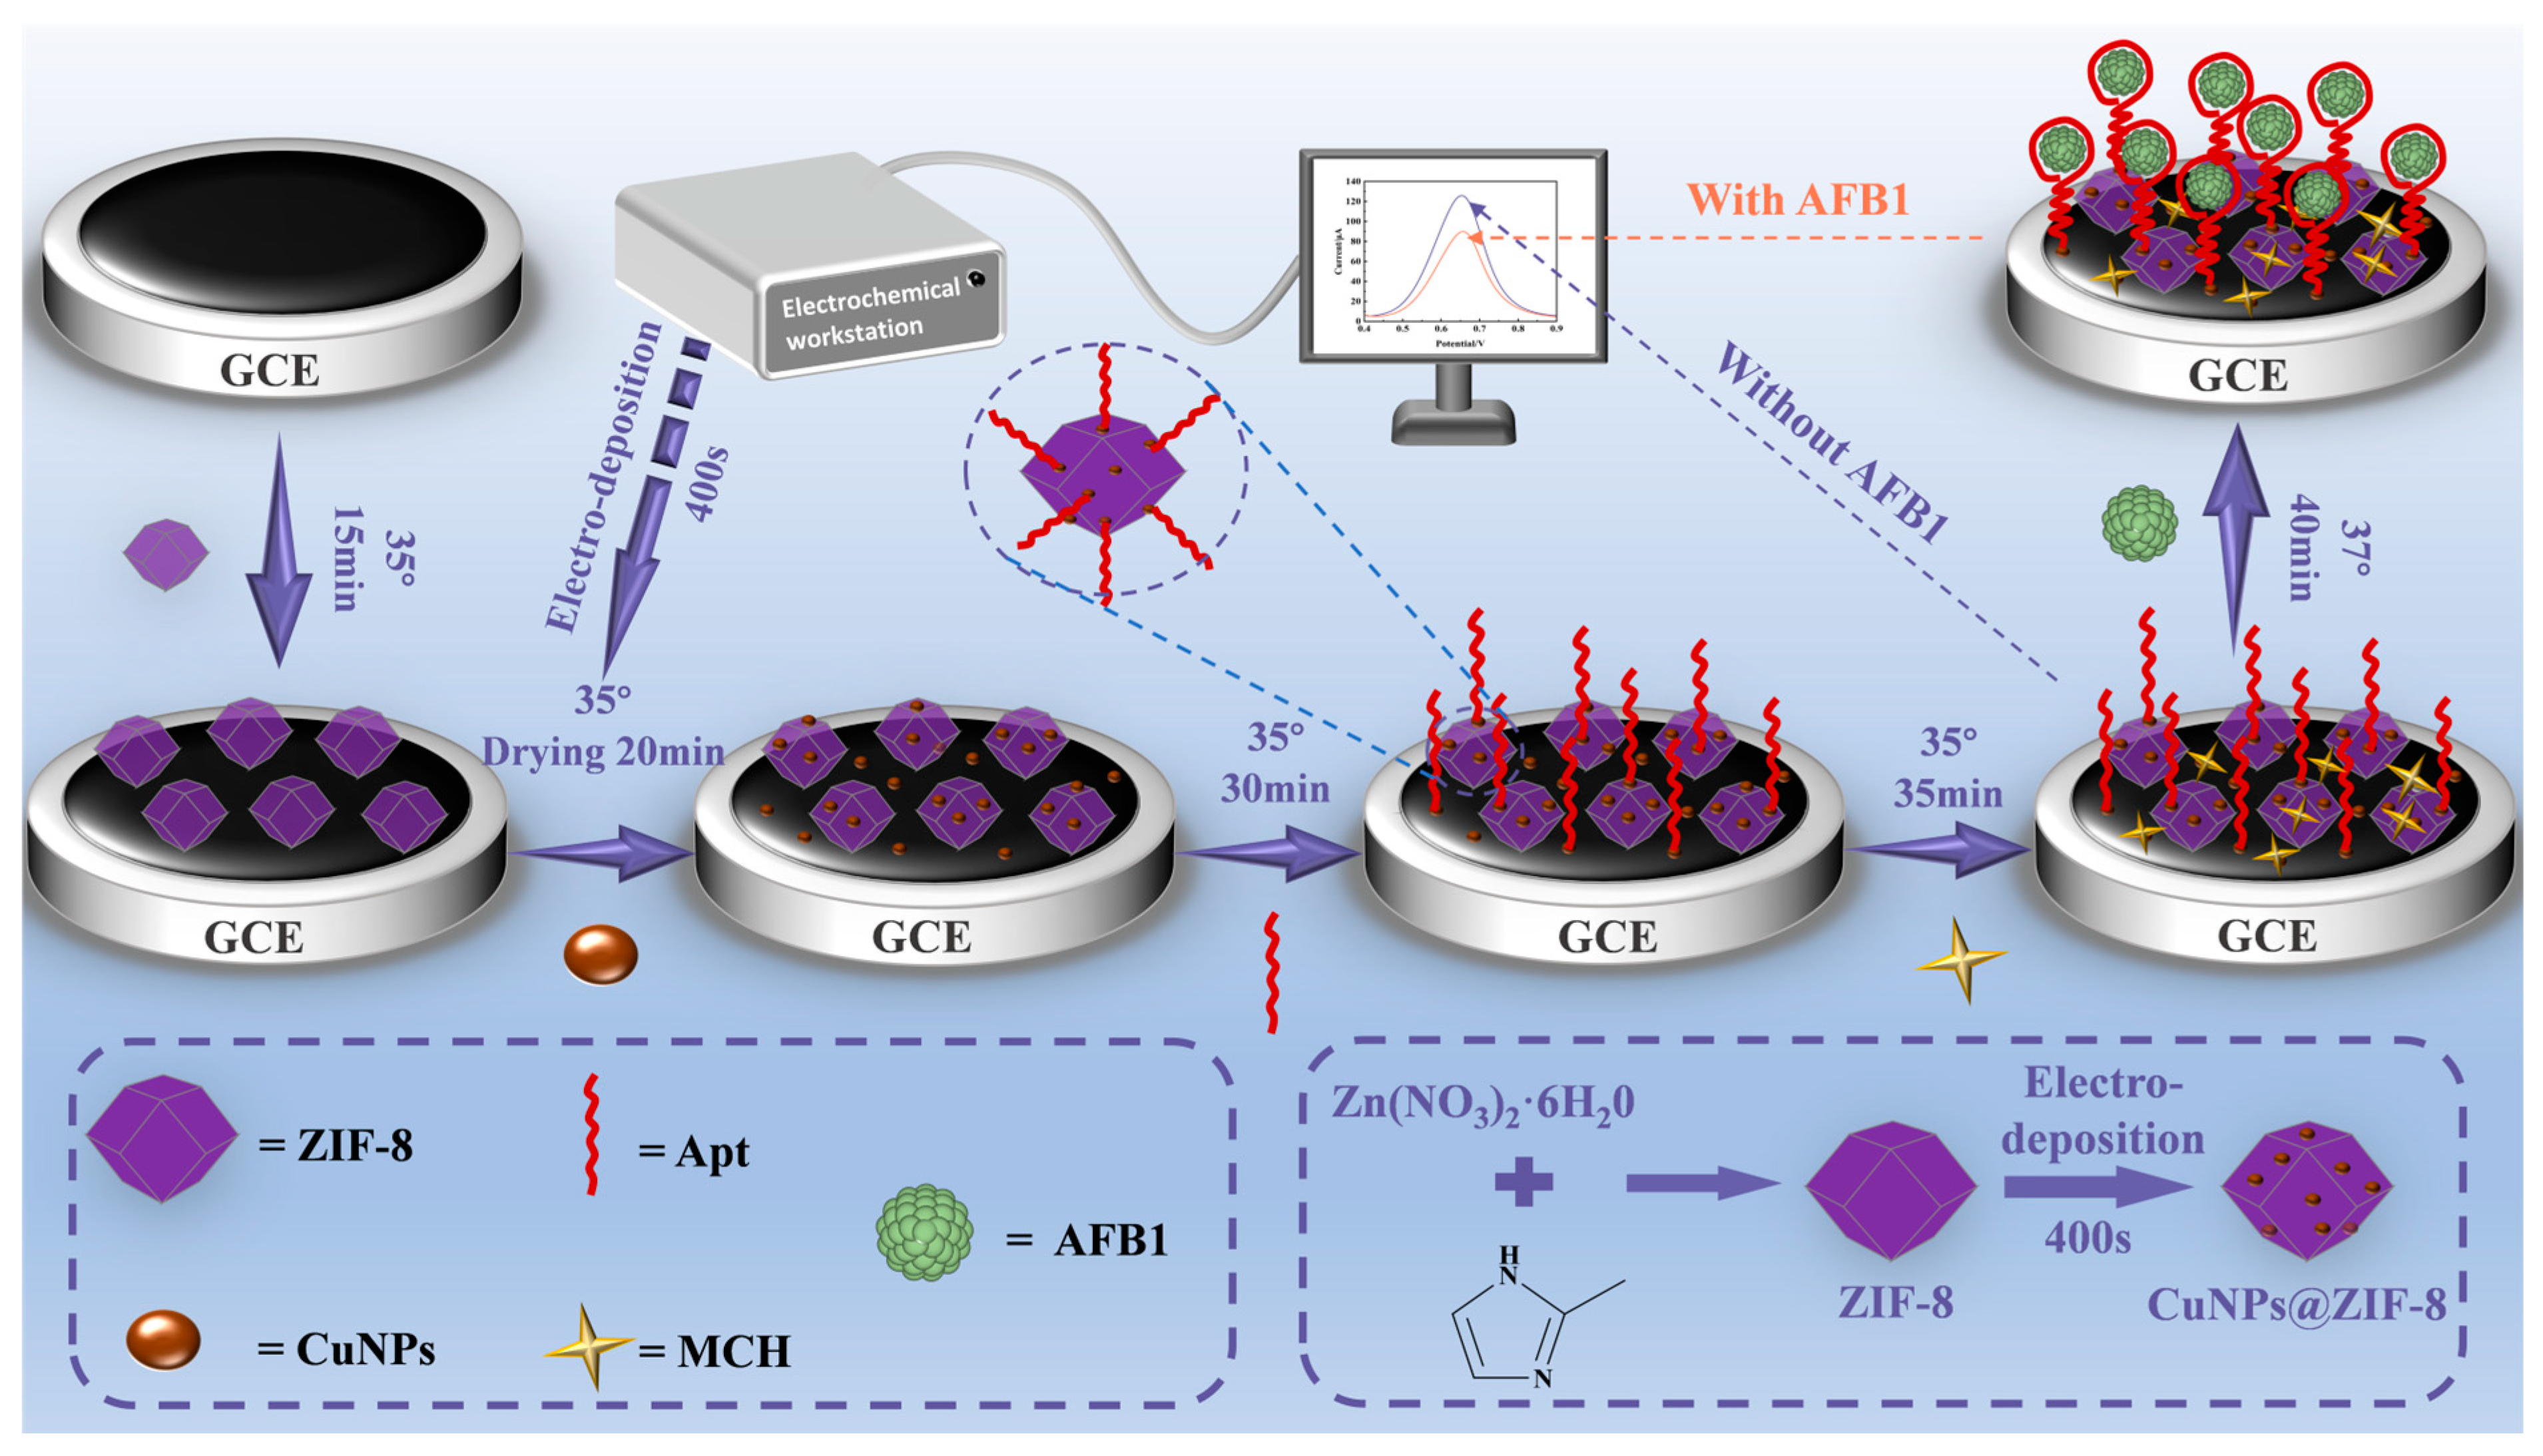
Figure 1. Schematic diagram of the preparation process of Apt/CuNPs/ZIF-8/GCE electrochemical aptamer sensor.
Chemosensors 13 00342 g001
Figure 2. (a) FTIR spectrum of synthesized ZIF-8 (powder sample); (b) XRD characterization map of ZIF-8 powder; (c) SEM image of ZIF-8 powders; (d) EDS image of ZIF-8.
Chemosensors 13 00342 g002
Figure 3. (a) SEM image of CuNPs/ZIF-8/GCE; (b) EDS image of CuNPs/ZIF-8/GCE; (c) EDS mapping of CuNPs/ZIF-8/GCE.
Chemosensors 13 00342 g003
Figure 4. Chemical characterization of different modified layer electrodes by (a) DPV, (b) CV, and (c) EIS in 5.0 mM [Fe(CN)6]3−/4− solution containing 0.1 M KCl.
Chemosensors 13 00342 g004
Figure 5. (a) Volume of ZIF-8 dispersion, (b) electrodeposition time of CuNPs, (c) aptamer concentration, (d) volume of MCH, and (e) incubation time of AFB1. The AFB1 concentration was 1 ng/mL for all condition optimization experiments.
Chemosensors 13 00342 g005
Figure 6. (a) DPV responses of the aptamer sensor after incubation with different concentrations (10, 100, 1.0 × 10³, 1.0 × 10⁴, 1.0 × 10⁵, 1.0 × 10⁶ pg/mL) of AFB1 vs. DPV responses of MCH/Apt/CuNPs/ZIF-8/GCE. (b) ΔIp calibration curves for different concentrations of AFB1 detected by the aptamer sensor. (c) DPV response without ZIF-8 added. (d) DPV response with ZIF-8 added.
Chemosensors 13 00342 g006
Table 1. Performance comparison of MCH/Apt/CuNPs/ZIF-8/GCE sensors with other electrochemical sensors.
SensorsLinear RangeLODReferences
AP/Ti-MOFs-Pt/GCE0.1–75 μg/L31 ng/L[34]
AFB1/Fc-apt/MCH/cDNA/AuNPs/THI-rGO/GCE0.05–20 ng/mL0.016 ng/mL[35]
AFB1/BSA/anti-AFB1/CS-GNs/GCE0.05–25 ng/mL0.021 ng/mL[20]
AFB1/Bioconj/Apts/AuNPs-CNDs/GCE10–10 × 104 pg/mL5.2 pg/mL[36]
Apt/Fe3O4@AuNPs/ZIF-8/CS/GCE0.5–10 × 104 pg/mL0.32 pg/mL[37]
H2-AgNPs/cDNA/MCH/H1/AuNPs/Zr-TCPB/GCE1–10 × 104 pg/mL0.79 pg/mL[38]
AFB1/AuNRs- Apt/AuNPs- Apt/BSA/hDNA/Yb-MOF@AuNPs/GCE1–50 × 104 pg/mL0.40 pg/mL[39]
AFB1/MCH/Apt/CuNPs/ZIF-8/GCE10–1.0 × 106 pg/mL1.13 pg/mLThis work
“Fe3O4@AuNPs” indicates Fe3O4 loaded with AuNPs; “Yb-MOF@AuNPs” indicates Yb-MOF loaded with AuNPs.
Table 2. Spiked recoveries of different concentrations of AFB1 in corn samples.
Added AFB1 (ng/mL)Found AFB1 (ng/mL)Recovery (%)
11.013 ± 0.012101.33 ± 1.206
109.666 ± 0.10496.663 ± 1.037
100105.720 ± 1.025105.72 ± 1.025
Disclaimer/Publisher’s Note: The statements, opinions and data contained in all publications are solely those of the individual author(s) and contributor(s) and not of MDPI and/or the editor(s). MDPI and/or the editor(s) disclaim responsibility for any injury to people or property resulting from any ideas, methods, instructions or products referred to in the content.