Abstract
Propolis is a substance produced by bees from the collection of plant resins, with a chemical composition that varies according to the available flora and region, and it has several biological activities. Stingless bee propolis is often produced in reduced amounts, posing a challenge to the study of their volatile compounds, as traditional hydrodistillation extraction would demand more raw propolis than available. These bees collect resins from various sources, resulting in a variable composition, so a standardized reproducible method is fundamental for their analysis. Headspace solid-phase microextraction (HS-SPME), associated with gas chromatography, appears to be an efficient alternative for the analysis of these volatiles. In this study, the GC-MS results of three types of SPME fibers were compared to those of extracts obtained by hydrodistillation to evaluate their efficiency in representing the composition of essential oils from (geo)propolis of different species. The extraction time and temperature were also standardized. Among the fibers tested, PDMS/DVB extracted the volatiles in a similar manner to the essential oil obtained by hydrodistillation for all the samples tested, indicating this to be the best choice of fiber coating for propolis volatile extraction and analysis.
Keywords:
propolis; geopropolis; volatiles; chromatography; SPME; mass spectrometry; Brazilian stingless bees 1. Introduction
Propolis is a resinous substance collected by bees from plant exudates, used as a protective barrier for the hive [1] and recognized for its biological properties, such as antimicrobial, antioxidant and antiviral activity [2,3,4,5]. Its chemical composition can vary according to the region and local flora, with more than 300 compounds identified in different samples [6,7]. Recently, some studies have focused on geopropolis, produced by stingless bees of the genera Melipona, Lestrimelitta and Trigona, from plant resins, soil and wax [8]. Most studies have focused on ethanolic extracts, with few studies regarding its volatile compounds, which are essential for further understanding the relationship between the flora and the biological activity of propolis.
The most conventional methods of essential oil extraction, such as hydrodistillation, are time-consuming and require a large sample size for a reasonable yield [9,10]. The great variability in the essential oil composition of these samples, combined with the low extraction yield, present an analytical challenge for studies with many samples. It is not feasible to extract essential oil from hundreds of samples; therefore, another method of capturing volatiles is necessary. Gas chromatography (GC) is the most recommended technique for the analysis of volatile compounds. This analytical technique is dependent on the sample extraction process, since no type of matrix containing fixed, non-volatile components should be directly injected into a gas chromatograph. This is a common problem in the analysis of plant matrices, which often contain non-volatile particles that may compromise the analysis and the equipment. Therefore, the feasibility of GC analysis depends on an appropriate sample preparation method. As an alternative, solid phase microextraction (SPME) stands out as being fast, solvent-free, and suitable for GC analysis [11,12,13]. Other advantages include the integration of sample extraction and concentration in a single step in a (reusable) extraction device and the introduction of this device into the analytical system for the desorption process [13].
The application of headspace solid-phase microextraction–gas chromatography–mass spectrometry is not new; in fact, our study was based on the method described by Pellati et al. [14], who used only a polydimethylsiloxane (PDMS) fiber. Another study compared the volatiles of an ethanol extract of Apis mellifera propolis from Argentina using a polydimethylsiloxane/divinylbenzene (PDMS/DVB) fiber with those from the ground sample with a PDMS fiber, concluding that most of the volatiles detected through the direct extraction of propolis coincided with those detected in the alcoholic tincture, but did not explain why different fibers were used [15]. A study of Croatian A. mellifera propolis used only the divinyl-benzene/carboxen/polydimethylsiloxane (DVB/CAR/PDMS) fiber [16]. Although this fiber coating was used in several studies of A. mellifera propolis volatiles [17,18,19], the reason for this choice was not discussed in any of the studies. Three fibers were compared in another study analyzing Mediterranean A. mellifera propolis and using standardized extraction and equilibration times and temperatures: PDMS/DVB, CAR/PDMS and DVB/CAR/PDMS [20]. The authors observed differences in the chemical composition of the essential oil and the fibers, but did not conclude which fiber coating was the most appropriate. The chemical variation observed due to the sampling procedure makes the direct comparison of the results of all these studies impossible.
Therefore, to compare the volatile composition of A. mellifera propolis and stingless bee geopropolis samples from Brazil, a single method must be applied to all the samples. This study evaluated the performance of three SPME fibers with different coatings, PDMS, PDMS/DVB and DVB/CAR/PDMS, in the extraction of volatiles from (geo)propolis, comparing the profiles with those obtained from essential oils extracted from the same samples, in order to define a fast but reproducible extraction procedure with a minimal amount of sample.
2. Materials and Methods
2.1. Samples
Two geopropolis samples from the species Melipona quadrifasciata (MQ and MQA), and one of each of the species Melipona bicolor (MB), Melipona seminigra (MS), and Scaptotrigona postica (SP), as well as Apis mellifera (AM) propolis, kindly provided by beekeepers and researchers from Jaguariúna-SP and Paraná-PR, were used. The samples, collected in 2020, were stored in a freezer at the Department of Plant Physiology at UNICAMP until extraction.
2.2. Essential Oil Extraction
The essential oil extraction was performed using approximately 60 g of crushed raw (geo)propolis in 200 mL of water and subjected to hydrodistillation for 3 h, using the Clevenger apparatus. The essential oil was collected and transferred to a previously weighed glass bottle whose yield was calculated based on the mass obtained in relation to the raw sample. Only one sample was obtained for each type of propolis.
2.3. Headspace Solid-Phase Microextraction (HS-SPME)
Headspace solid-phase microextraction (HS-SPME) was performed with three types of Sulpeco (Bellefonte, PA, USA) fibers, PDMS/DVB (65 μm—BLUE), DVB/CAR/PDMS (50/30 μm—GRAY), and PDMS (100 μm—RED), all conditioned according to the manufacturer’s instructions. Initially, a range of temperatures between 60 and 80 °C was tested, as well as times between 10 and 30 min, observing that the chromatograms stabilized under the following conditions. The extraction of volatile compounds was based on Pellati [14], with modifications. Approximately 1 g of the ground sample was placed in a 20 mL vial and thermostated at 75 °C for 30 min. The SPME fiber was exposed to the headspace for 20 min and, after sampling, inserted into the GC injector for thermal desorption for 1 min at 230 °C (splitless mode). Essential oil samples were diluted in ethyl acetate (1:10, v/v) and analyzed by gas chromatography–mass spectrometry (GC-MS). All samples were analyzed in triplicate with each fiber. Initially, a range of temperatures between 60 and 80 °C were tested, as well as times between 10 and 30 min, observing that the chromatograms stabilized under the conditions described above. All samples were analyzed in triplicate with each fiber.
2.4. Gas Cromatography–Mass Spectrometry Analyses (GC-MS)
Analyses were performed on a Thermo Scientific™ (Waltham, MA, USA) TRACE 1300 gas chromatograph with an HP-5ms capillary column (30 m × 0.25 mm × 0.25 μm) coupled to an ISQ QD mass spectrometer. The oven temperature ranged from 60 °C to 250 °C (3 °C/min) and was maintained for 3 min at the end. For HS-SPME-GC-MS, splitless injection was used; for oil, 0.1 μL (split 1:100) was injected. The carrier gas was helium at 0.7 mL/min. MS detection was performed by electron ionization (70 eV), in positive mode, scanning from m/z 40 to 400.
2.5. Statistics
The chemical composition data were analyzed by ANOVA, with comparison of means using the Tukey test (p < 0.05). Principal component analysis (PCA) was also applied to correlate the fiber results with those from the essential oil. The analyses were performed on the MetaboAnalyst online platform (McGill University, Montreal, QC, Canada).
3. Results
3.1. Comparison of the Composition of Essential Oils Obtained by Hydrodistillation
The essential oils extracted from the samples of Melipona quadrifasciata (MQ), Melipona bicolor (MB), Melipona seminigra (MS) and Scaptotrigona postica (SP) from Jaguariúna-SP showed yields of 0.08%, 0.14%, 0.16% and 0.21%, respectively. The (geo)propolis samples of Melipona quadrifasciata (MQA) and Apis mellifera (AM) from Paraná-PR yielded 1.03% and 0.16% essential oil, respectively. The essential oil yield was not directly correlated with the species or region; for example, the essential oil of the M. quadrifasciata sample from São Paulo had a lower yield when compared to the samples of the same species from Paraná, which had the highest of all. Of the 82 identified compounds, 10 were common across the essential oils of all species, α-pinene, β-pinene, α-cubebene, α-copaene, trans-caryophyllene, cis-β-guaiene, α-muurolene, δ-cadinene, cubenol and α-cadinol, but in different percentages (Table 1).

Table 1.
Percentages of identified compounds in the essential oil of propolis and geopropolis samples.
In the essential oil of the M. quadrifasciata sample from PR (MQA), the main compounds with percentages above 5% were α-pinene (20.05%), β pinene (10.96%), germacrene (6.62%) and trans-caryophyllene (5.86%). However, in the M. quadrifasciata sample from SP (MQ), the following were present: trans-caryophyllene (27.25%), α-copaene (8.94%), α-humulene (6.68%) and δ-cadinene (5.38%). This result indicates that the local flora exerted a strong influence on the volatile composition of these samples.
When comparing the composition of the essential oil from the geopropolis samples from Jaguariúna (SP) for the different species studied, M. quadrifasciata (MQ), M. bicolor (MB), M. scutellaris (MS) and S. postica (SP), variations in the composition were noted. For the MQ sample, the main compounds have already been mentioned above. The essential oil of the MB sample presented the following main compounds: α-copaene (13.17%), α-pinene (9.10%), δ-cadinene (8.29%) and β-chamigrene (5.43%). The essential oil from MS presented the following main components: α-pinene (17.91%), δ-3-carene (6.34%) and α-terpineol (5.10%). Finally, the essential oil of the SP sample presented α-pinene (26.94%), β-pinene (5.52%) and δ-cadinene (5.15%).
The essential oil of Apis mellifera propolis presented the main components trans-caryophyllene (11.52%), trans-nerolidol (11.01%), δ-cadinene (9.14%) and spatulenol (6.80%). This variability in composition has already been discussed by other authors [21,22].
3.2. Comparison of SPME Fibers with Essential Oil
When comparing essential oil with the fibers, the classes of compounds extracted by each fiber were the starting point for our evaluation. For the MQA sample, monoterpenes predominated in the essential oil, totaling 91.89% of the compounds (40.05% monoterpenes, 5.7% oxygenated monoterpenes, 38.12% sesquiterpenes, 7.69% oxygenated sesquiterpenes and 0.33% others), with 49 substances identified. The PDMS/DVB (A) fiber adsorbed 34 compounds, with a distribution similar to the essential oil (OE): 27.56% monoterpenes, 3.86% oxygenated monoterpenes, 49.58% sesquiterpenes, 2.97% oxygenated sesquiterpenes and 0.76% others. Principal component analysis (PCA) (Figure 1 MQA) indicated that the compounds extracted with this fiber placed were closer to the OE along the PC1 axis, which described the greatest percentage of variation. In the Tukey test, 38 peaks extracted with the PDMS/DVB fiber did not differ significantly from the essential oil, showing that it adsorbed compounds with a similar chemical profile to the essential oil.
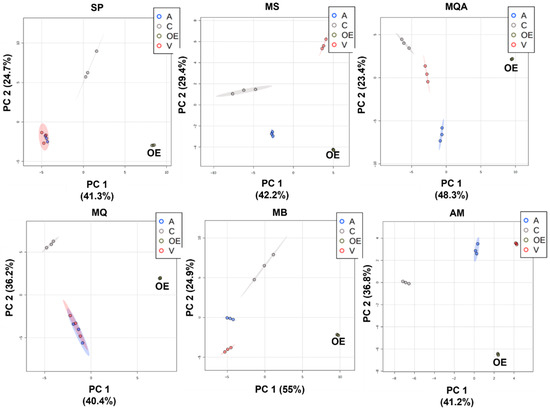
Figure 1.
Principal component analysis score plots (PC1 × PC2) comparing essential oils (OE) and PDMS/DVB (A), DVB/CAR/PDMS (C) and PDMS (V) fibers for samples S. postica (SP), M. scutellaris (MS), M. quadrifasciata (MQ), M. quadrifasciata A (MQA), M. bicolor (MB) and A. mellifera (AM).
For the Apis mellifera (AM) propolis sample, 84.13% of the compounds were identified in the essential oil: 1.74% monoterpenes, 0.37% oxygenated monoterpenes, 57.46% sesquiterpenes and 24.56% oxygenated sesquiterpenes. The PDMS/DVB (A) fiber adsorbed 29 substances of the 33 identified in the essential oil. The distribution of classes for this fiber was also similar: 2.05% monoterpenes, 0.56% oxygenated monoterpenes, 67.26% sesquiterpenes, 17.75% oxygenated sesquiterpenes and 1.20% other compounds. The PCA (Figure 1 AM) indicated that the results obtained with the PDMS/DVB fiber were closer to the OE along PC1, and Tukey’s analysis showed that with this fiber, 15 compounds did not differ significantly from the OE. For this sample, the PDMS/DVB fiber chemical profile was the closest to the essential oil.
For the sample of Melipona bicolor (MB) geopropolis, sesquiterpenes were predominant in the essential oil, corresponding to 89.1% of the identified compounds; the rest were 15.57% monoterpenes, 6.34% oxygenated monoterpenes, 55.04% sesquiterpenes, 10.17% oxygenated sesquiterpenes and 1.98% others, totaling 45 compounds. The DVB/CAR/PDMS (C) fiber adsorbed 32 substances, with a distribution similar to the essential oil: 32.86% monoterpenes, 7.64% oxygenated monoterpenes, 40.09% sesquiterpenes, 2.86% oxygenated sesquiterpenes and 3.48% other compounds. PCA (Figure 1 MB) indicated that the compounds adsorbed on the DVB/CAR/PDMS (C) fiber were closest to the OE in the PC1 axis. However, Tukey’s analysis showed that 30 compounds extracted with the PDMS/DVB (A) fiber were not significantly different from the essential oil, and 15 compounds with the DVB/CAR/PDMS fiber did not differ significantly from the essential oil. The results indicated that, for this species, both DVB/CAR/PDMS (C) and PDMS/DVB (A) fibers extracted compounds that resembled the essential oil in terms of chemical composition.
Regarding the Scaptotrigona postica (SP) sample, 88.58% of the compounds were identified in the essential oil: 42.03% monoterpenes, 6.35% oxygenated monoterpenes, 29.46% sesquiterpenes, 8.66% oxygenated sesquiterpenes and 2.08% others. The PDMS/DVB (A) fiber adsorbed 23 compounds, with the following distribution: 8.91% monoterpenes, 2.12% oxygenated monoterpenes, 70.89% sesquiterpenes, 1.63% oxygenated sesquiterpenes and 1.31% others. This was different from the essential oil. In the PCA (Figure 1 SP), the DVB/CAR/PDMS (C) fiber was placed closest to the OE in the PC1 axis, but the Tukey test showed that 32 compounds extracted with the PDMS/DVB (A) fiber were not significantly different from the essential oil, while with the DVB/CAR/PDMS (C) fiber, only 17 compounds showed no significant difference. Again, both DVB/CAR/PDMS (C) and PDMS/DVB (A) fibers extracted compounds that resembled the essential oil in terms of chemical composition.
Regarding the Melipona scutellaris (MS) sample, 51.1% of the compounds were identified in the essential oil: 30.45% monoterpenes, 7.25% oxygenated monoterpenes, 8.8% sesquiterpenes, 1.75% oxygenated sesquiterpenes and 2.85% other compounds. The PDMS/DVB (A) fiber adsorbed 21 substances, corresponding to 26 in the essential oil, with the distribution of 57.08% monoterpenes, 9.94% oxygenated monoterpenes, 14.21% sesquiterpenes and 4.26% others, similar to the essential oil. In the PCA (Figure 1 MS), the results of the PDMS/DVB (A) fiber were placed closest to the OE. The Tukey test revealed that 23 compounds extracted with the blue PDMS/DVB (A) fiber were not significantly different from the OE, indicating that this fiber represented the essential oil composition more closely.
Regarding the Melipona quadrifasciata (MQ) sample from São Paulo state, 83.78% of the compounds were identified in the essential oil: 4.3% monoterpenes, 72.7% sesquiterpenes, 4.64% oxygenated sesquiterpenes and 2.14% other compounds. The PDMS/DVB (A) adsorbed 19 of the compounds found in the essential oil, with the following distribution: 4.22% monoterpenes, 79.21% sesquiterpenes, 0.58% oxygenated sesquiterpenes and 0.48% other compounds. In the PCA (Figure 1 MQ), both PDMS/DVB (A) and PDMS (V) fibers presented profiles similar to the OE. The Tukey test showed that 31 compounds extracted with the PDMS/DVB (A) fiber were not significantly different from the OE, while the PDMS (V) only adsorbed 19 compounds without a significant difference from the OE, making the PDMS/DVB (A) the best choice for this sample.
In general, PDMS/DVB (A) fiber extracted a volatile composition similar to the essential oil for most of the samples analyzed. The essential oil always presented a higher number of identified compounds, but the amount of sample necessary for OE extraction is not always available (1 g for SPME vs. 60 g OE), nor is the advantage of the direct analysis in 20 min (vs. 3 h hydrodistillation). Table 2 presents a summary of the criteria evaluated for each sample and fiber choice. Fiber V (PDMS only) was never the best choice.
Table 2.
Results analyzed to choose the fiber that best represents the essential oil.
4. Discussion
According to Park et al. (2002) [2], the chemical composition of propolis samples can be influenced by the genetic variability of queen bees, which affects the behavior of workers, including their preferences and efficiency in collecting plant resins, which also vary according to the local flora. This results in distinct chemical profiles, since bees from different lineages can collect resins with different bioactive compounds. In addition, genetic and environmental factors also play an important role in this variation [21,22].
Studies on the chemical composition of (geo)propolis essential oils are rare, but some researchers have used hydrodistillation followed by organic solvent extraction to analyze volatiles. Compounds such as α-pinene, β-pinene, trans-caryophyllene and δ-cadinene were found in these studies, as in the case of Apis mellifera propolis from the state of Piauí [23,24]. Pino [25] analyzed propolis samples from Apis mellifera and Melipona beecheii collected in the Yucatan Peninsula, Mexico, using dichloromethane extraction. For the stingless bee propolis, the predominant compounds were α-pinene, trans-caryophyllene, spathulenol and caryophyllene oxide, whereas for honey bees, the main components were α-pinene, palmitic acid, and trans-verbenol. Comparing with the data of the present study, four of these compounds (α-pinene, β-pinene, α-copaene, trans-caryophyllene) were found in all samples analyzed, with some variations in the presence of other compounds such as palmitic acid and trans-verbenol. This result indicates that the use of SPME fibers presents results which are comparable to other extraction methods.
Some authors used hydrodistillation to extract the essential oil of Apis mellifera propolis in Italy and identified 99 compounds, the main ones being linalool, benzaldehyde, δ-cadinene and α-cadinol [14]. In the present study, some of these compounds, such as linalool and δ-cadinene, were also identified in the A. mellifera sample from the state of Paraná. Fernandes-Silva [26] studied A. mellifera propolis from the state of Minas Gerais and identified 12 compounds, with emphasis on 3-prenylcinnamic acid and spathulenol, as also found in this study. Researchers analyzed propolis from the state of Rio de Janeiro, finding β-caryophyllene, acetophenone and linalool, which were also identified in the A. mellifera samples from Paraná [27].
Despite the plethora of studies of Apis mellifera propolis, few have addressed their volatile composition and even fewer have studied native stingless bees. Identifying the plant and geographic origin of samples is essential for quality control and standardization for therapeutic uses [2]. This study highlights the need to analyze more samples from different regions, preferably collected in different seasons to better understand how these factors influence the volatile composition of propolis in Brazil.
Although volatiles are frequently extracted by hydrodistillation (essential oil), this method requires more material and time than direct extraction by SPME fibers. However, the literature on the use of SPME fibers for propolis volatile analysis is still limited. Pellati [14] compared the HS-SPME technique with hydrodistillation using Italian A. mellifera propolis and observed that both techniques detected the same compounds, although the relative amount of certain compounds varied. The HS-SPME technique showed a higher amount of δ-cadinene and α-cadinol, while the hydrodistillation method detected a higher percentage of 3-methyl-3-buten-1-ol. Other studies, reviewed in the introduction, show that many studies employ varied extraction procedures, making the direct comparison of the results impossible. Another study carried out by researchers from Brazil [28] analyzed brown A. mellifera propolis from different regions of Brazil using the same method described by Pellati et al. [14]. They found significant variations in the volatile compounds, mainly terpenes, which was confirmed by PCA. The differences observed between the samples indicate that factors such as local flora, bee species and collection time can influence the volatile composition of propolis. If the study had been carried out with different methods for each sample, they could not have reached this conclusion. Therefore, the standardization of the HS-SPME technique for propolis volatile composition analysis, as described herein, is fundamental for further studies.
5. Conclusions
Variability in the chemical composition of propolis samples from different bee species is quite common, due to the particularities of each species. A total of 82 compounds were identified in the essential oil of the samples, with 10 common to the essential oils from all species. Comparing the set of results presented herein, we observed that the use of the fiber coated with polydimethylsiloxane and divinylbenzene (PDMS/DVB), which is indicated for the extraction of volatile and non-volatile compounds of mixed polarity, was the one that presented the greatest extraction efficiency for most samples and was the most representative of the volatiles present in essential oils. This is probably related to its characteristic of capturing compounds of varied polarities. The standardization of the HS-SPME technique for propolis volatile composition analysis, as described herein, is fundamental for studies of the volatiles of the highly variable Brazilian propolis and can be directly applied to the study of potential plant sources, as well. Further studies of Brazilian stingless bee propolis and geopropolis are being performed using this method.
Author Contributions
Conceptualization, M.B.G. and A.C.H.F.S.; methodology, M.B.G.; software, G.P.P.; formal analysis, M.B.G.; investigation, M.B.G.; resources, L.W.H.; data curation, M.B.G. and G.P.P.; writing—original draft preparation, M.B.G.; writing—review and editing, A.C.H.F.S., G.P.P. and L.W.H.; supervision, L.W.H. and A.C.H.F.S. All authors have read and agreed to the published version of the manuscript.
Funding
This research was funded by CAPES 001 and 88887.973568/2024-00, CNPq 401230/2022-8 and CNPq 306100/2021-5. L.W.H. acknowledges FAPESP (22/07406-1) for financial support.
Institutional Review Board Statement
Ethical review and approval were waived for this study as the studies did not involve animals or humans.
Data Availability Statement
Data may be supplied by the corresponding author on reasonable request.
Conflicts of Interest
The authors declare no conflicts of interest.
Abbreviations
The following abbreviations are used in this manuscript:
| HS-SPME | Headspace solid-phase microextraction |
| PDMS/DVB | Polydimethylsiloxane/divinylbenzene |
| SPME | Solid-phase microextraction |
| GC | Gas chromatography |
| MS | Mass spectrometry |
| PDMS | Polydimethylsiloxane |
| DVB/CAR/PDMS | Divinylbenzene, carboxene and polydimethylsiloxane |
| MQ | Melipona quadrifasciata |
| MQA | Melipona quadrifasciata Azul |
| MB | Melipona bicolor |
| MS | Melipona seminigra |
| SP | Scaptotrigona postica |
| AM | Apis mellifera |
| GC-MS | Gas chromatography–mass spectrometry |
| PCA | Principal component analysis |
| OE | Essential oil |
| HD | Hydrodistillation |
References
- Chen, Y.W.; Wu, S.W.; Ho, K.K.; Lin, S.B.; Huang, C.Y.; Chen, C.N. Characterisation of Taiwanese propolis collected from different locations and seasons. J. Sci. Food Agric. 2008, 88, 412–419. [Google Scholar] [CrossRef]
- Park, Y.K.; Alencar, S.M.; Scamparine, A.R.P.; Aguiar, C.L. Própolis produzida no sul do Brasil, Argentina e Uruguai: Evidências fitoquímicas de sua origem vegetal. Ciênc. Rural 2002, 2, 997–1003. [Google Scholar] [CrossRef]
- Cardozo, D.V.; Mokochinski, J.B.; Machado, C.S.; Sawaya, A.C.H.F.; Caetano, I.K.; Felsner, M.L.; Torres, Y.R. Variabilidade química de geoprópolis produzida pelas abelhas sem ferrão Jataí, Mandaçaia e Mandurí. Rev. Virtual Quím. 2015, 7, 2456–2474. [Google Scholar]
- Santos, H.F.D.; Campos, J.F.; Santos, C.M.D.; Balestieri, J.B.P.; Silva, D.B.; Carollo, C.A.; de Picoli Souza, K.; Estevinho, L.M.; Dos Santos, E.L. Chemical profile and antioxidant, anti-inflammatory, antimutagenic and antimicrobial activities of geopropolis from the stingless bee Melipona orbignyi. Int. J. Mol. Sci. 2017, 18, 953. [Google Scholar] [CrossRef]
- Bonamigo, T.; Campos, J.F.; Alfredo, T.M.; Balestieri, J.B.P.; Cardoso, C.A.L.; Paredes-Gamero, E.J.; de Picoli Souza, K.; Dos Santos, E.L. Antioxidant, cytotoxic, and toxic activities of propolis from two native bees in Brazil: Scaptotrigona depilis and Melipona quadrifasciata anthidioides. Oxidative Med. Cell. Longev. 2017, 2017, 1038153. [Google Scholar] [CrossRef]
- Marcucci, M.C. Propriedades biológicas e terapêuticas dos constituintes químicos da própolis. Quím. Nova 1996, 19, 529–536. [Google Scholar]
- Usia, T.; Banskota, A.H.; Tezuka, Y.; Midorikawa, K.; Matsushige, K.; Kadota, S. Constituents of Chinese propolis and their antiproliferative activities. J. Nat. Prod. 2002, 65, 673–676. [Google Scholar] [CrossRef]
- Pedro, S.R. The stingless bee fauna in Brazil (Hymenoptera: Apidae). Sociobiology 2014, 61, 348–354. [Google Scholar] [CrossRef]
- Valcanaia, C.P.; Masote, J.B.B.; Sommer, H.F.; Schiquet, S.; Padilha, B.; Krepsky, L.; Paganelli, C.J.; Borges, P.P.; Danielli, L.J.; Apel, M.A.; et al. Antimicrobial activity of volatile oils from Brazilian stingless bees Melipona quadrifasciata quadrifasciata and Tetragonisca angustula Propolis. Chem. Biodivers. 2022, 19, e202200369. [Google Scholar] [CrossRef] [PubMed]
- Storch Portal, A.; Schiquet, S.; Padilha Amaral, B.; Mascarenhas Krepsky, L.; Curbani, L.; Andrade Rebelo, R.; Rau, M.; Althoff, S.L.; Guedes, A.; Mendes de Cordova, C.M. Composition, antibiofilm, and antibacterial potential of volatile oils from geopropolis of different stingless bees’ species. Chem. Biodivers. 2023, 20, e202300592. [Google Scholar] [CrossRef] [PubMed]
- Pawliszyn, J. Solid Phase Microextraction: Theory and Practice; John Wiley & Sons: New York, NY, USA, 1997. [Google Scholar]
- Shirey, R.E. Optimization of extraction conditions and fiber selection for semivolatile analytes using solid-phase microextraction. J. Chromatogr. Sci. 2000, 38, 270–288. [Google Scholar] [CrossRef] [PubMed]
- Queiroz, M.E.C. Microextração em sase sólida no capilar (in-tube SPME) para automação das análises de fármacos em fluidos biológicos. Sci. Chromatogr. 2009, 1, 13. [Google Scholar]
- Pellati, F.; Prencipe, F.P.; Benvenuti, S. Headspace solid-phase microextraction-gas chromatography–mass spectrometry characterization of propolis volatile compounds. J. Pharm. Biomed. Anal. 2013, 84, 103–111. [Google Scholar] [CrossRef]
- González, M.; García, M.E.; Slanis, A.; Bonini, A.; Fiedler, S.; Fariña, L.; Dellacassa, E.; Condurso, C.; Lorenzo, D.; Russo, M.; et al. Phytochemical Findings Evidencing Botanical Origin of New Propolis Type from North-West Argentina. Chem. Biodivers. 2019, 16, e1800442. [Google Scholar] [CrossRef]
- Jerković, I.; Marijanović, Z.; Kuś, P.M.; Tuberoso, C.I.G. Comprehensive Study of Mediterranean (Croatian) Propolis Peculiarity: Headspace, Volatiles, Anti-Varroa-Treatment Residue, Phenolics, and Antioxidant Properties. Chem. Biodivers. 2016, 13, 210–218. [Google Scholar] [CrossRef]
- Kurek-Górecka, A.; Kara, Y.; Pokajewicz, K.; Ben Hammouda, I.; Wieczorek, P.P.; Marciniak, D.; Balwierz, R.; Kłósek, M.; Czuba, Z.P.; Kolaylı, S. Phenolic content, volatile compounds and antioxidant activity in pooled propolis samples from Turkey and Poland. Eur. Food Res. Technol. 2025, 251, 2199–2210. [Google Scholar] [CrossRef]
- Santanatoglia, A.; Acquaticci, L.; Marcucci, M.C.; Maggi, F.; Oliveira, C.R.; Caprioli, G. Valorizing Brazilian Propolis Residue: Comprehensive Characterization for Sustainable Reutilization Strategies. Plants 2025, 14, 1989. [Google Scholar] [CrossRef] [PubMed]
- Calta, E.; de Groot, A.; van Oers, E.M.; Ipenburg, N.A.; Rustemeyer, T. Composition of Brazilian and Chinese Propolis for Patch Testing. Contact Dermat. 2025, 93, 56–60. [Google Scholar] [CrossRef] [PubMed]
- Svečnjak, L.; Marijanović, Z.; Okińczyc, P.; Marek Kuś, P.; Jerković, I. Mediterranean Propolis from the Adriatic Sea Islands as a Source of Natural Antioxidants: Comprehensive Chemical Biodiversity Determined by GC-MS, FTIR-ATR, UHPLC-DAD-QqTOF-MS, DPPH and FRAP Assay. Antioxidants 2020, 9, 337. [Google Scholar] [CrossRef]
- Bankova, V. Chemical diversity of propolis and the problem of standardization. J. Ethnopharmacol. 2005, 100, 114–117. [Google Scholar] [CrossRef]
- Sousa, J.P.; Furtado, N.A.; Jorge, R.; Soares, A.E.; Bastos, J.K. Perfis físico-químico e cromatográfico de amostras de própolis produzidas nas microrregiões de Franca (SP) e Passos (MG), Brasil. Rev. Bras. Farmacogn. 2007, 17, 85–93. [Google Scholar] [CrossRef]
- Sousa, S.A.A.; Citó, A.M.G.L.; Lopes, J.A.D. Constituintes do óleo essencial da própolis produzida na cidade de Pio IX-Piauí. Rev. Bras. Plantas Med. 2006, 8, 1–3. [Google Scholar]
- Torres, R.N.S.; Lopes, J.A.D.; Moita Neto, J.M.; Citó, A.M.D.G.L. The volatile constituents of propolis from Piaui. Quím. Nova 2008, 31, 479–485. [Google Scholar] [CrossRef]
- Pino, J.A.; Marbot, R.; Delgado, A.; Zumárraga, C.; Sauri, E. Volatile constituents of propolis from honeybees and stingless bees from Yucatan. J. Essent. Oil Res. 2006, 18, 53–56. [Google Scholar] [CrossRef]
- Fernandes-Silva, C.C.; Lima, C.A.; Negri, G.; Salatino, M.L.; Salatino, A.; Mayworm, M.A. Composition of the volatile fraction of a sample of Brazilian green propolic and its phytotoxic activity. J. Sci. Food Agric. 2015, 95, 3091–3095. [Google Scholar] [CrossRef]
- Oliveira, A.P.; França, H.S.; Kuster, R.M.; Teixeira, L.A.; Rocha, L.M. Chemical composition and antibacterial activity of Brazilian propolis essential oil. J. Venom. Anim. Toxins Incl. Trop. Dis. 2010, 16, 121–130. [Google Scholar] [CrossRef]
- Olegário, L.S.; Andrade, J.K.S.; Andrade, G.R.S.; Denadai, M.; Cavalcanti, R.L.; da Silva, M.A.A.P.; Narain, N. Chemical characterization of four Brazilian brown propolis: An insight in tracking of its geographical location of production and quality control. Food Res. Int. 2019, 123, 481–502. [Google Scholar] [CrossRef] [PubMed]

Disclaimer/Publisher’s Note: The statements, opinions and data contained in all publications are solely those of the individual author(s) and contributor(s) and not of MDPI and/or the editor(s). MDPI and/or the editor(s) disclaim responsibility for any injury to people or property resulting from any ideas, methods, instructions or products referred to in the content. |
© 2025 by the authors. Licensee MDPI, Basel, Switzerland. This article is an open access article distributed under the terms and conditions of the Creative Commons Attribution (CC BY) license (https://creativecommons.org/licenses/by/4.0/).