Abstract
Biothiols, including cysteine (Cys), homocysteine (Hcy), and glutathione (GSH), are crucial for physiological regulation and their imbalance poses severe health risks. Herein, we developed a pH-responsive liquid crystal (LC)-based sensing platform for detection of biothiols by doping 4-n-pentylbiphenyl-4-carboxylic acid (PBA) into 4-n-pentyl-4-cyanobiphenyl (5CB). Urease catalyzed urea hydrolysis to produce OH−, triggering the deprotonation of PBA, thereby inducing a vertical alignment of LC molecules at the interface corresponding to dark optical appearances. Heavy metal ions (e.g., Hg2+) could inhibit urease activity, under which condition LC presents bright optical images and LC molecules maintain a state of tilted arrangement. However, biothiols competitively bind to Hg2+, the activity of urease is maintained which enables the occurrence of urea hydrolysis. This case triggers LC molecules to align in a vertical orientation, resulting in bright optical images. This pH-driven reorientation of LCs provides a visual readout (bright-to-dark transition) correlated with biothiol concentration. The detection limits of Cys/Hcy and GSH for the PBA-doped LC platform are 0.1 μM and 0.5 μM, respectively. Overall, this study provides a simple, label-free and low-cost strategy that has a broad application prospect for the detection of biothiols.
1. Introduction
Biothiols, including Cys, Hcy, and GSH, serve as essential components of living organisms and play pivotal regulatory roles in numerous physiological processes [1,2,3]. When the content of these three substances in a living body deviates from the normal range, they easily cause various diseases, posing a huge threat to human life and health. It is reported that the Cys deficiency may lead to diseases such as slow growth, edema, liver damage, and hair depigmentation [4], and the increase of Cys concentration in plasma is prone to cause neurotoxicity [5]. Excessive Hcy content in the blood is closely related to diseases such as cancer, osteoporosis and Alzheimer’s disease [6,7,8,9]. In addition, abnormal levels of GSH are prone to cause major diseases such as cancer, neurodegenerative diseases, AIDS, and diabetes [10,11,12]. Therefore, accurately detecting the levels of biothiols in the body is helpful for the early diagnosis and prevention of related diseases. At present, the commonly used detection methods for biothiols include high performance liquid chromatography [13,14], capillary electrophoresis [15], the colorimetric method [16,17], and fluorescence method [18,19,20], etc. Although these methods have high detection sensitivity and good selectivity, their application in the commercial sphere is greatly limited due to excessive reliance on precise large-scale instruments, cumbersome sample preparation processes, and complicated operation steps. Therefore, it is extremely urgent to develop simple, rapid, and low-cost methods for the analysis and detection of biothiols.
As reported [21,22,23], amphiphilic substances can induce the liquid crystal molecules to transition from a disordered to an ordered alignment when they self-assemble at the liquid–liquid crystal interface. However, when external stimuli such as pH variations or oppositely charged polyelectrolytes are applied, the liquid crystal alignment undergoes further changes. Kinsinger’s group modified the water–liquid crystal interface with pH-sensitive amphiphilic polymers and observed that alternating exposure to phosphate buffers at pH 5.0 and 9.0 triggered reversible optical responses of the LC between bright and dark states [24]. This phenomenon can be attributed to pH-induced modulation of polymer molecular structure and self-assembly, which alters the interfacial alignment of LC molecules. However, the 10-h response time severely limits practical applications.
In order to achieve a rapid response to minor pH changes, Bi’s group developed a pH-responsive LC sensor by doping PBA into 5CB [25]. The main reason for choosing PBA is that it contains a pH-sensitive group, namely the carboxyl group (–COOH), and the amphiphilicity of the molecule causes it to undergo self-assembly behavior similar to that of surfactants at the LC interface. Furthermore, as shown in Figure 1, the molecular structure of PBA is similar to that of 5CB. Therefore, it is more likely to interact with 5CB and can more effectively influence the alignment of 5CB molecules. The 5CB doped with PBA was added to the copper mesh modified with penicillinase, and then the copper mesh was immersed in the sodium phosphate buffer solution containing penicillin G. It was found that the optical response of the LC shifted from dark to bright images which corresponds to a transition in the LC alignment from homeotropic to tilted states. This phenomenon arises from the enzymatic hydrolysis of penicillin G, which releases protons (H+) and protonates the carboxyl groups of PBA. This method can be used to detect the small amount of H+ released in the enzymatic hydrolysis reaction. However, the inhomogeneous distribution of penicillinase on the copper grid restricts the applicability of this immobilization-based method for detecting subtle pH variations.

Figure 1.
Chemical structures of (a) 5CB and (b) PBA.
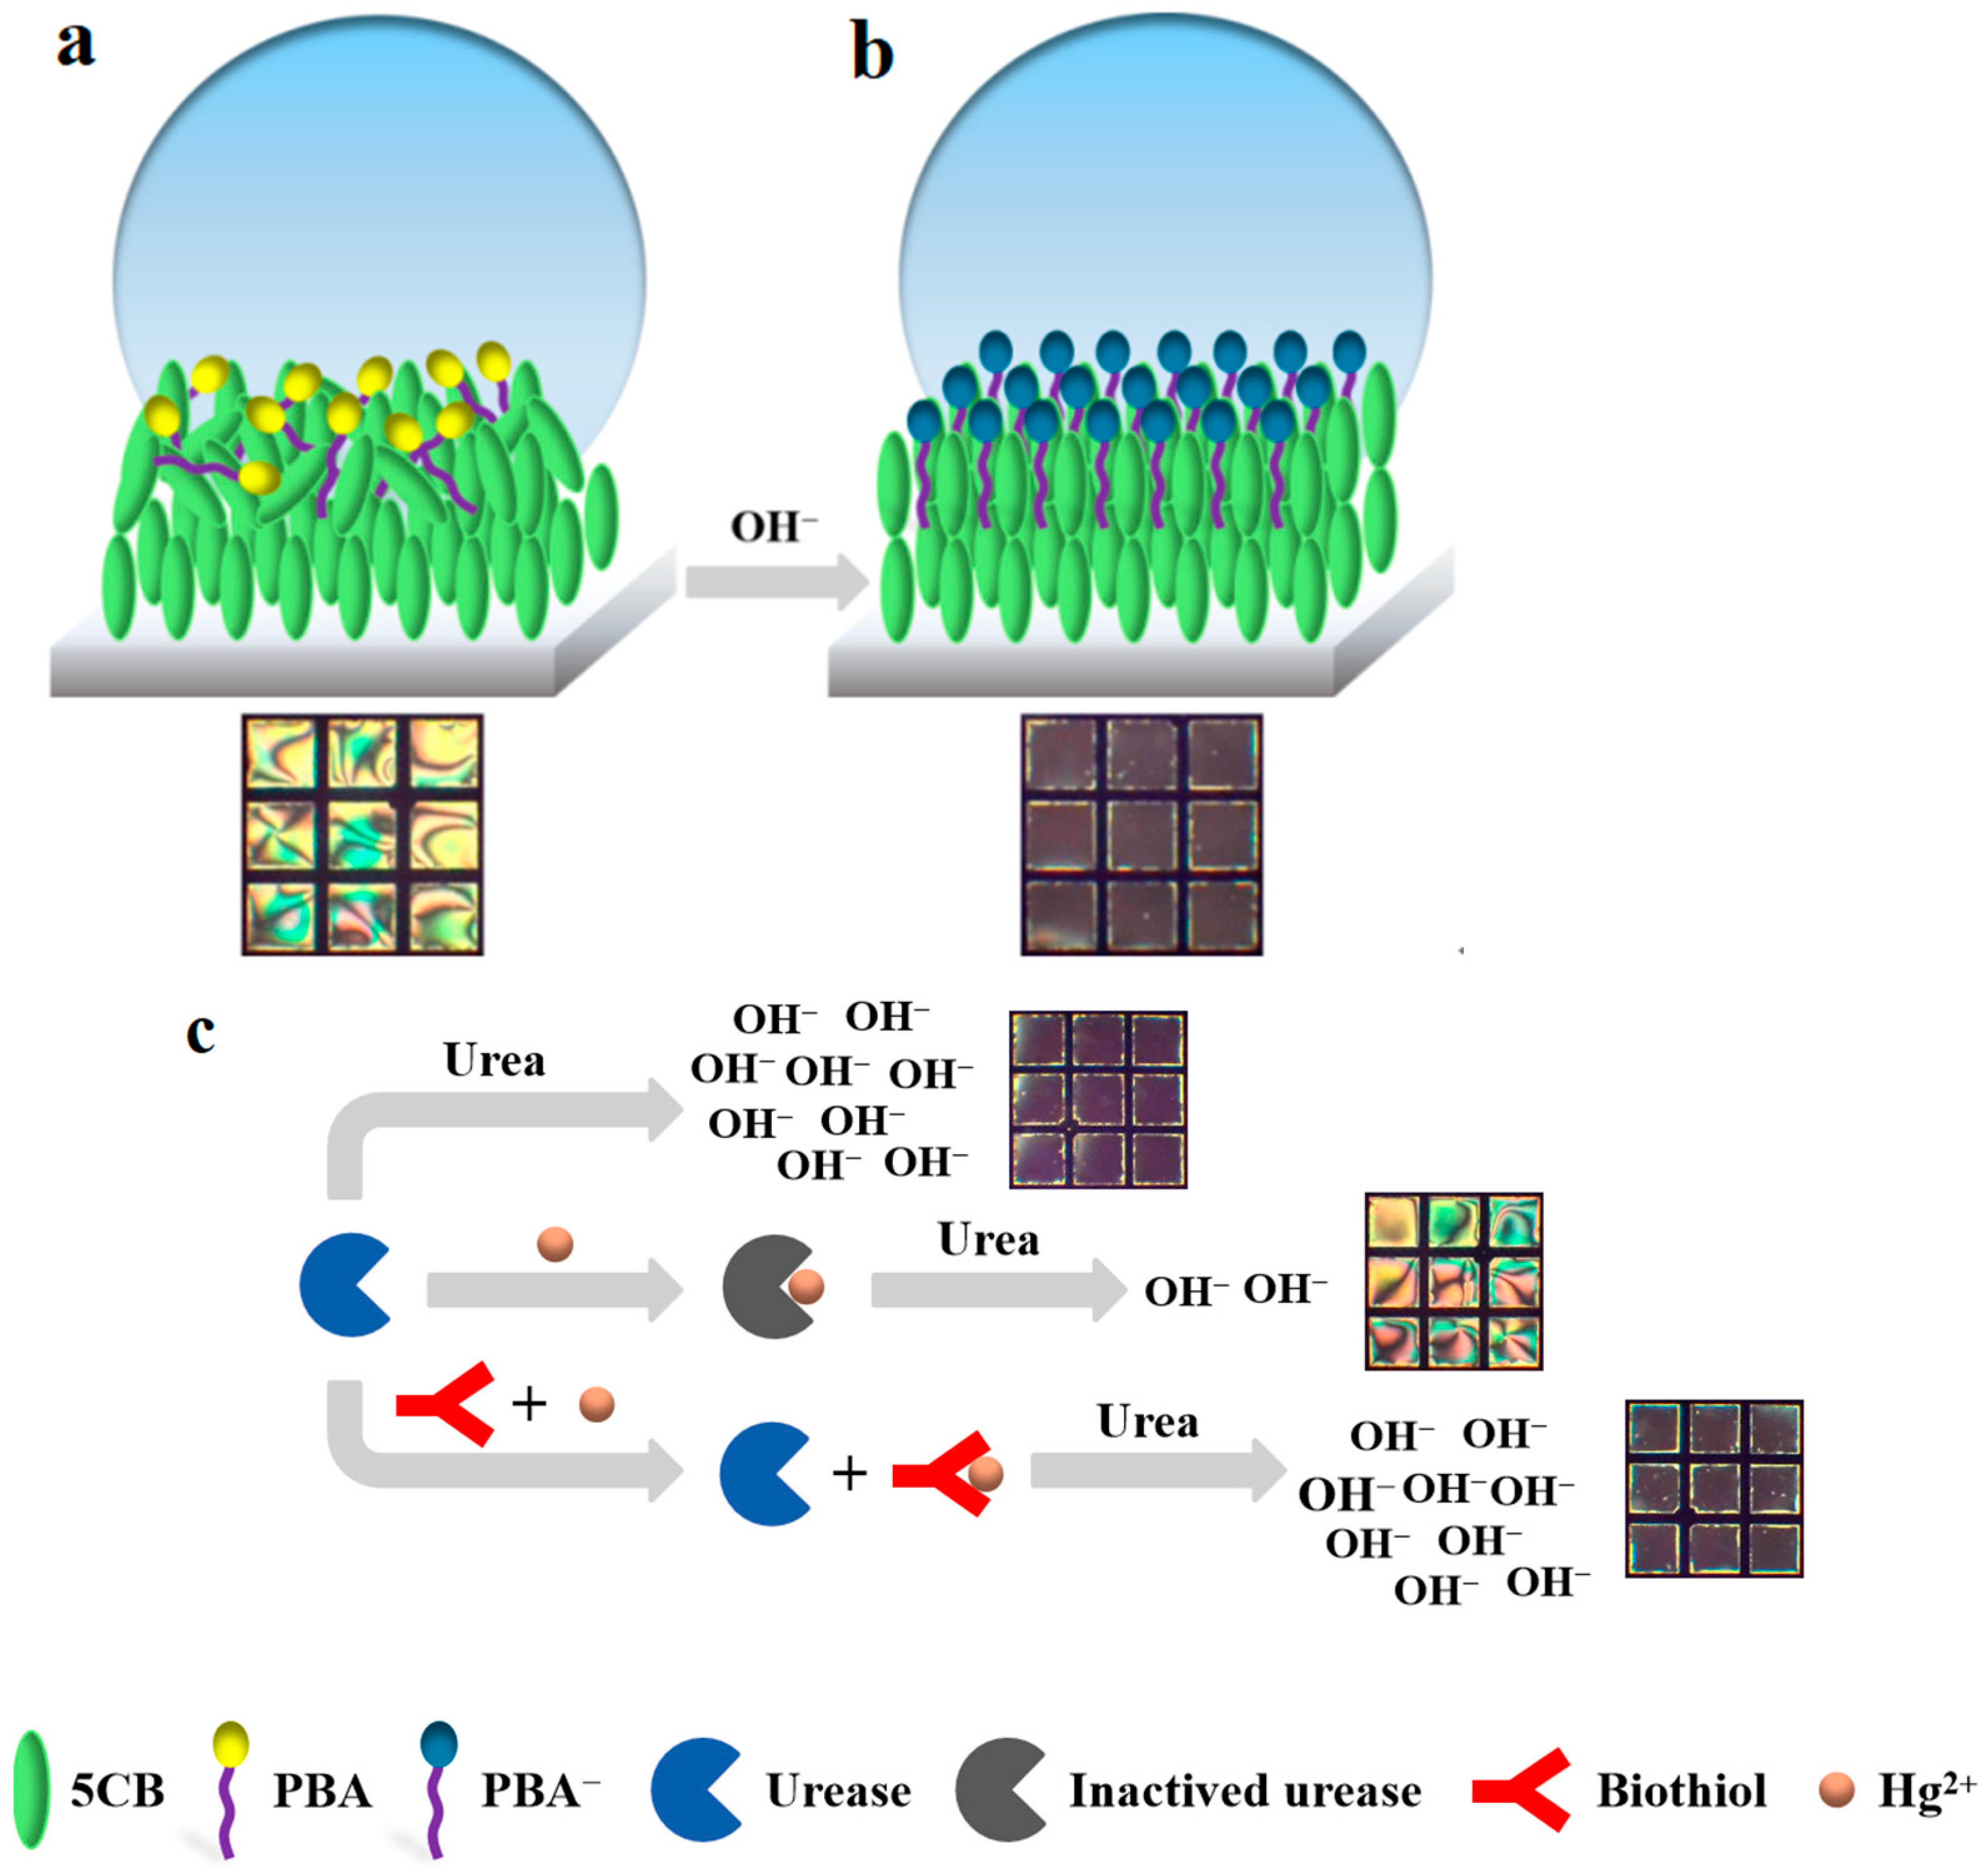
Given the rapid pH responsiveness of PBA, in this work we developed a simple, label-free and cost-effective LC sensing platform by doping PBA into 5CB. The urease and urea solutions were directly mixed and then incubated. Based on the OH− released by the enzymatic hydrolysis reaction, the existence state of PBA was changed, which in turn induced a change in the alignment of LC to detect biothiols. The detection mechanism is shown in Figure 2. When the constructed LC platform comes into contact with the aqueous solution, the LC presents bright optical images, which indicates that the alignment of LC molecules at the interface is tilted (Figure 2a). Then, an alkaline solution with a pH value of 9.2 was used to replace the aqueous solution. The dark optical images of LC were observed through a polarized optical microscope (POM), indicating that the alignment of 5CB is homeotropic (Figure 2b). This pH-dependent optical response forms the basis for the detection of biothiols via urease-mediated urea hydrolysis (the reaction equation illustrated in Figure 3) [26,27,28]. The detection mechanism is shown in Figure 2c. When the mixed aqueous solution of urease and urea is pre-incubated and added to the 5CB interface, the optical images of the LC are dark at this time. If the activity of urease is inhibited by heavy metal ions (e.g., Hg2+) and then incubated with the urea solution, bright optical images are observed. Conversely, pre-incubation of metal ions with biothiols (e.g., GSH) enables the occurrence of urea hydrolysis. The liberated OH− deprotonates PBA, inducing homeotropic alignment of LC molecules at the interface and dark optical images.
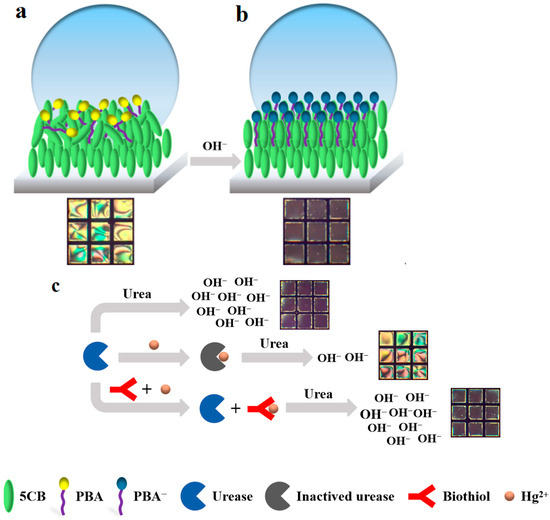
Figure 2.
Schematic representation of the alignment and corresponding optical images of PBA-doped 5CB after contacting with (a) Deionized water, tilted alignment associated with bright appearance. (b) Alkaline aqueous solution with a pH of 9.2, homeotropic alignment associated with dark appearance. (c) Schematic illustration for the detection of biothiols and corresponding optical images of LC.

Figure 3.
Enzymatic hydrolysis reaction of urea by urease.
2. Materials and Methods
2.1. Reagents and Instruments
Urea (99%) and PBA (95%) are sourced from the Shanghai Bide Pharmaceutical Technology Co., Ltd., Shanghai, China. Urease (from the giant bean, 359 U/mg) was purchased from the Shanghai Yuanye Biotechnology Co., Ltd., Shanghai, China. Hcy, (98%) and mercury ion standard solutions (1000 μg/mL, 1.0 mol/L HNO3) are obtained from the Shanghai Maclean Biochemical Technology Co., Ltd., Shanghai, China. The standard solution of lead ions (100 μg/mL, 1% HNO3) was purchased from the Shanghai RON Chemical Technology Co., Ltd., Shanghai, China. Copper (II) chloride dihydrate (CuCl2·2H2O, ≥99.0%) is from the Sinopharm Chemical Reagent Co., Ltd., Shanghai, China. GSH (99%, reduced form), GSH (98%, oxidized form), histidine (His, 98%), lysine (Lys, 98%), serine (Ser, 99%), leucine (Leu, 99%), glutamic acid (Glu, 99%), arginine (Arg, 99%), and phenylalanine (Phe, 99%) were all purchased from the Beijing Bailingwei Technology Co., Ltd., Beijing, China. Alanine (Ala, 99%) was purchased from the Shanghai Aladdin Biochemical Technology Co., Ltd., Shanghai, China. 5CB (98%), Cys (99%), aspartic acid (Asp, 99%), isoleucine (Ile, 98.5%), valine (Val, 99%), proline (Pro, 98%), threonine (Thr, 99%), tryptophan (Try, 99%) Tyrosine (Tyr, 99%), glycine (Gly, 99%), asparagine (Asn, 99%), glutamine (Gln, 99%), and methionine (Met, 98%) were purchased from the Saen Chemical Technology (Shanghai) Co., Ltd., Shanghai, China. All chemicals were used as received without further purification. The water used in the experiment was all ultrapure water with a resistivity of 18.25 MΩ·cm.
2.2. Cleaning of Glass Substrates
According to the literature [29], the piranha solution (H2SO4:H2O2 = 7:3, v/v) can effectively remove organic contaminants from glass substrates while hydroxylating the surface. The glass substrates were treated as follows: In a fume hood, they were immersed in freshly prepared piranha solution heated to 353.15 K in a constant-temperature oil bath for 30 min. (Caution: Piranha solution reacts violently with organic materials. Avoid contact and never store in sealed containers!) After cooling, the glass substrates were rinsed sequentially with ultrapure water, anhydrous ethanol, and methanol under sonication. Residual solvents were removed by N2 blowing, followed by baking at 383.15 K for 12 h in a convection oven. Treated substrates were stored in a desiccator until use.
2.3. Silanization of Glass Substrates
As reported in the previous literature [30,31,32], the cleaned glass substrates were functionalized with a 0.5% (v/v) aqueous solution of N, N-dimethyl-N-octadecyl-3-(trimethoxysilyl) propylammonium chloride (DMOAP) for 30 min, following established protocols. Then, the surface of the glass was repeatedly rinsed with ultrapure water, dried with nitrogen, and baked in an oven at 383.15 K for 2 h. It was then stored in a desiccator for future use.
2.4. Preparation of LC Sensing Platform
Firstly, 0.3 wt% PBA-doped 5CB was prepared as follows. A total of 300 μL of 1 mg/mL PBA trichlormethane solution was added to 100 mg of 5CB, mixing evenly by vortex, and dried in an oven at 333.15 K to ensure complete evaporation of trichlormethane, then stored in a desiccator for future use. Subsequently, the PBA-doped 5CB was heated to its isotropic phase (>308.15 K). One μL of the mixture was dispensed onto a copper mesh (placed on a DMOAP-modified glass substrate) with a pipette, and the excess mixture was removed with a 20 μL capillary tube to form a smooth LC interface.
2.5. Detection of Biothiols
Firstly, 15 μL of biothiol (Cys, Hcy and GSH) solutions with different concentrations were separately taken and placed into 1.5 mL centrifuge tubes, and then 15 μL of 50 ng/mL Hg2+ solution was added to each of them, respectively. The mixed solutions were incubated at room temperature for 20 min. Then, 30 μL of 1 μg/mL urease solution was added to the mixed solutions of biothiols and Hg2+, respectively, and incubated at room temperature for 20 min. Finally, the resulting mixtures were separately combined with an equal volume of 1 mM urea solution and incubated at room temperature for 10 min. Afterwards, 30 μL of the pre-incubated mixed solutions were taken and dropped onto the PBA-doped 5CB interface. After stabilization, the optical images of the LC were observed. All the experiments were repeated at least three times.
2.6. Acquisition and Processing of LC Optical Images
The optical morphological changes in the LC were observed under crossed polarizers using a polarized optical microscope (XPF-800C, Tiansheng, Shanghai) equipped with a 2.5× objective lens. Optical images were captured at ambient temperature with a digital camera (TK-9301EC, JVC, Yokohama, Japan).
3. Results and Discussion
3.1. Feasibility Study
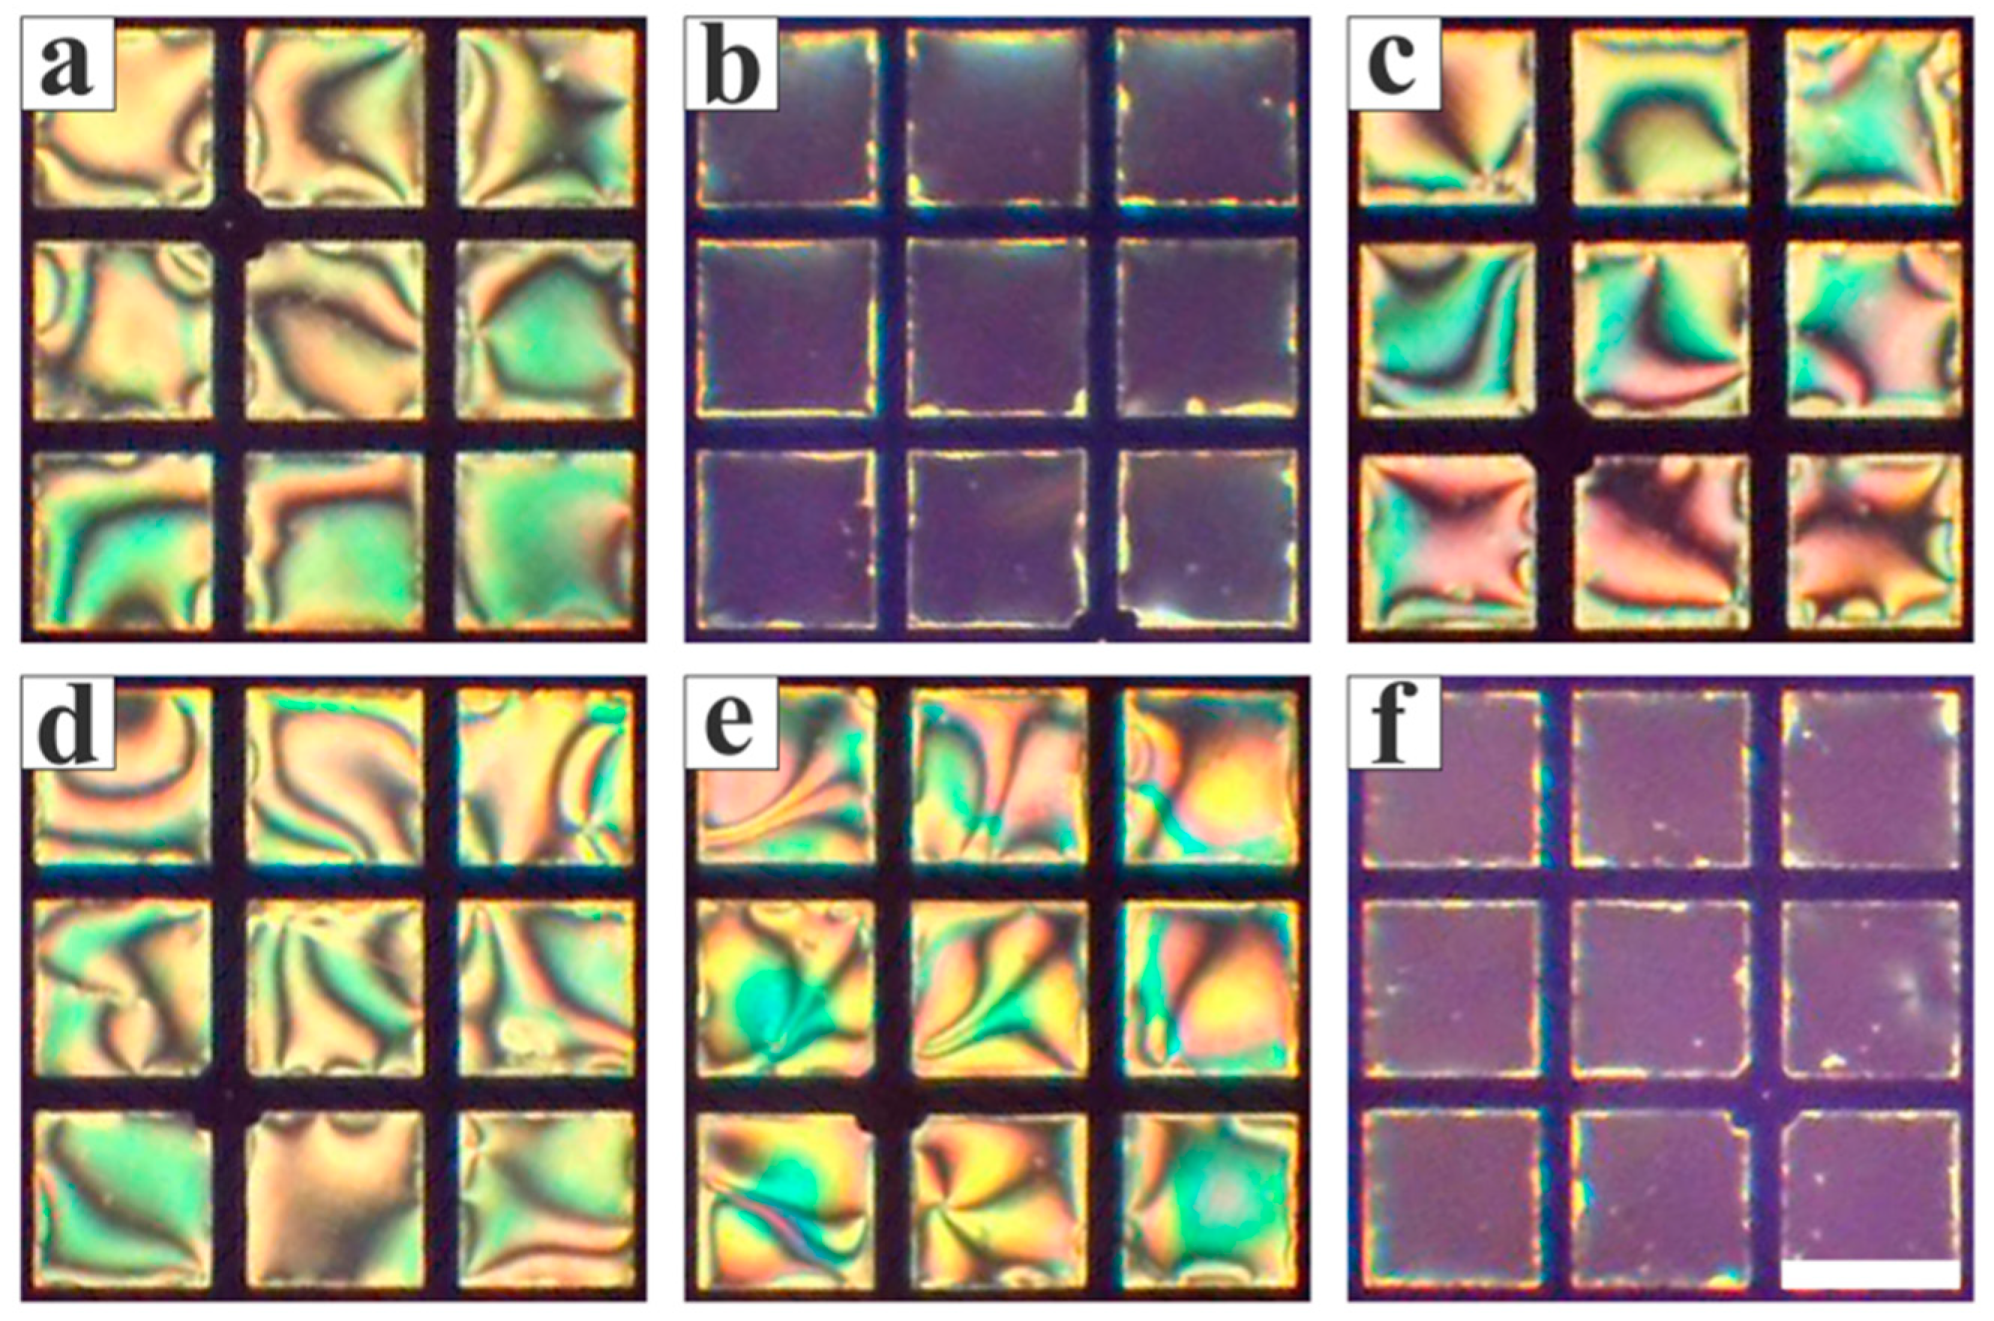
The feasibility of the PBA-doped 5CB sensing platform for detecting biothiols was explored. Firstly, when deionized water was added to the LC interface, a bright optical image was observed (Figure 4a), which indicates that the 5CB molecules are in a tilted alignment at the water–LC interface. Then, a mixed solution of urease and urea pre-incubated at room temperature was used to replace the deionized water. It was found that the optical images of 5CB rapidly changed from bright to completely dark (Figure 4b), indicating that the LC underwent a shift of tilted-to-homeotropic orientation. In addition, urea solution and urease solution were separately dropped onto the constructed LC sensing platform. It was observed that the LC maintained a bright optical appearance in both cases (Figure 4c,d), corresponding to a tilted arrangement of 5CB molecules at the interface. These findings can be attributed to the enzymatic hydrolysis reaction that occurs when urease hydrolyzes urea. In the case of deionized water being adding to the optical cell, the number of deprotonated PBA molecules adsorbed on the water–LC interface is very small and cannot disrupt the tilted alignment of the LC molecules at the interface. Due to the release of OH− from enzymatic reactions, a large number of PBA molecules are in a deprotonated state (namely, PBA−). There exists hydrophobic interaction between the tail chain of PBA− and the LC molecule; therefore, PBA− adsorbed on the LC interface forms a stable self-assembled monolayer film which triggers LC molecules change from a tilted alignment to a homeotropic alignment.
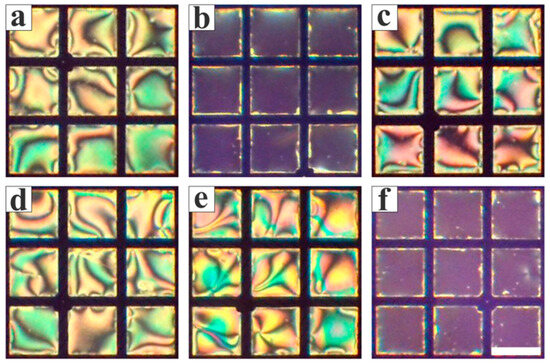
Figure 4.
Optical images of LC after contacting with (a) deionized water, (b) the pre-incubated mixture of 1 μg/mL urease and 1 mM urea, (c) 1 mM urea, (d) 1 μg/mL urease, (e) the pre-incubated mixture of 1 μg/mL urease and 50 ng/mL Hg2+, and 1 mM urea, sequentially, (f) the pre-incubated mixtures of 50 ng/mL Hg2+ and 1 μM Cys, 1 μg/mL urease and 1mM urea, sequentially. Scale bar: 285 μm.
Heavy metal ions can effectively inhibit the activity of urease. When the solution containing urease and Hg2+ was pre-incubated and added to the LC interface, LC still presented a bright optical image (Figure 4e). However, in the presence of biothiols, a dark optical image was observed (Figure 4f). This is mainly because the thiol groups of biothiols have a high affinity for heavy metal ions which enables the maintenance of urease activity [33,34]. Therefore, based on the changes in the optical images of LC between bright and dark, the detection of biothiols can be achieved.
3.2. Optimization of the Conditions for the LC Sensing Platform
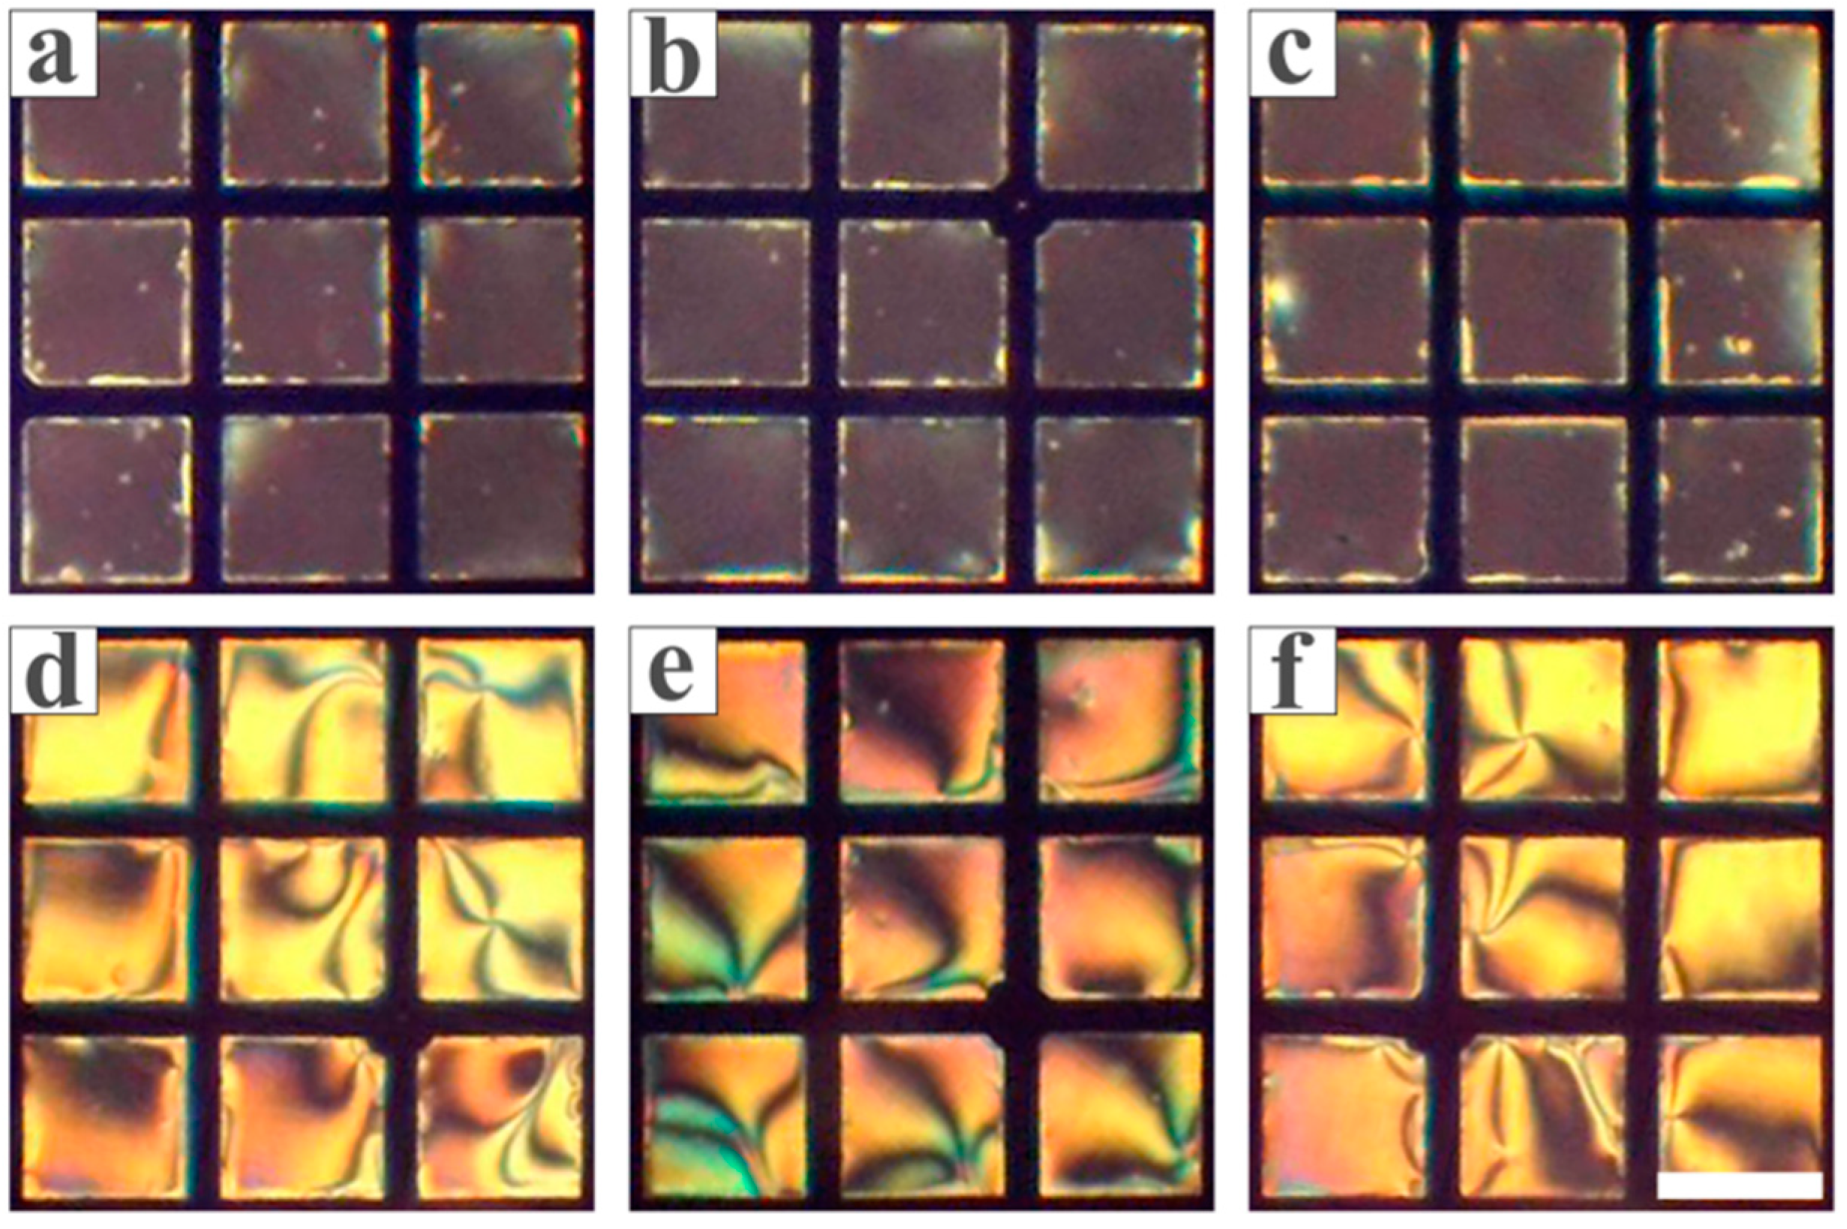
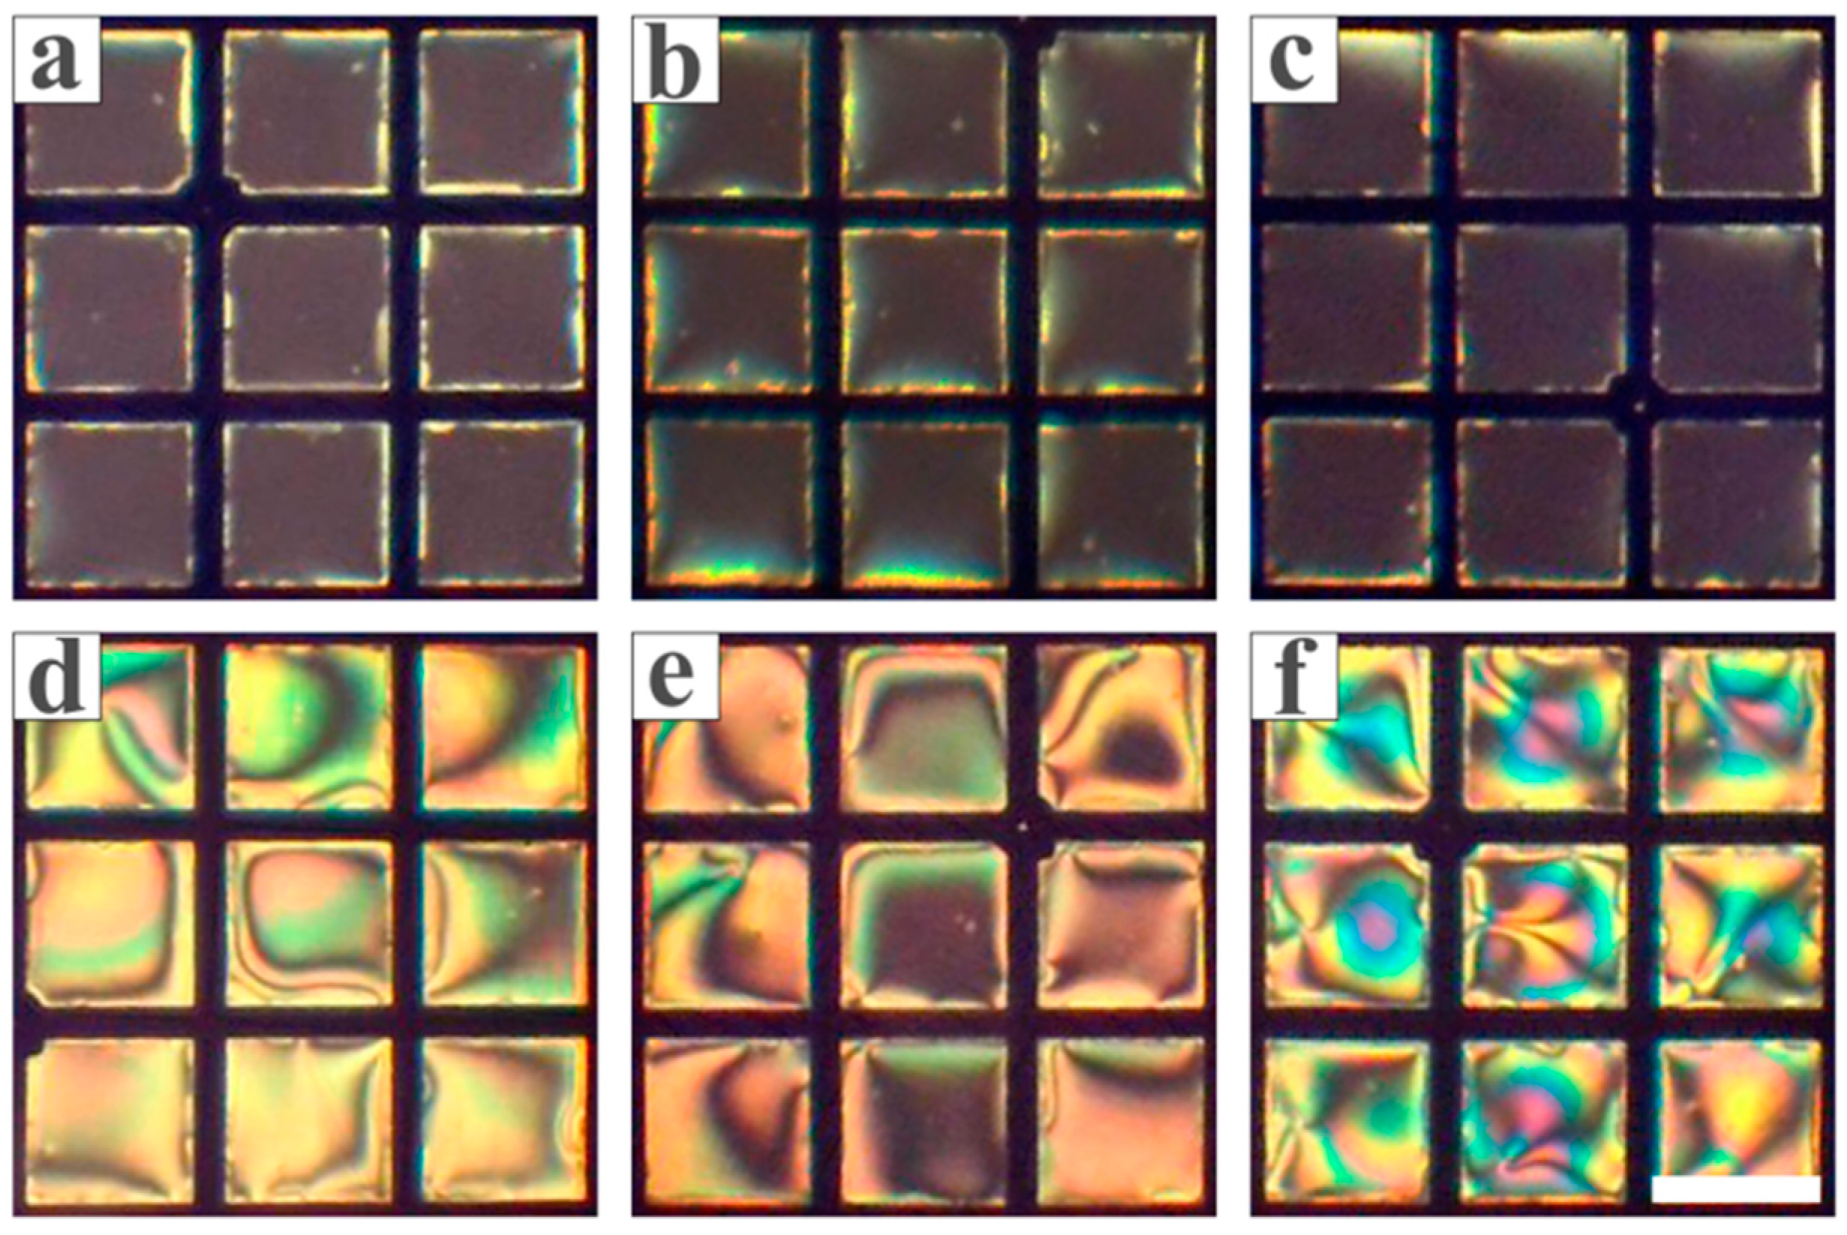
After investigating the feasibility of detecting biothiols, the working conditions of the LC-based sensing platform were explored. Urea solutions with different concentrations were separately mixed with 5 μg/mL urease solution at room temperature and co-incubated for 10 min. Then, the mixed solutions were dropped onto the LC sensing platform, respectively; the corresponding optical images of the LC are shown in Figure 5. When the urea concentration was 1 mM or higher, completely dark optical images were observed (Figure 5a–c). This is mainly because OH− released by the enzymatic hydrolysis reaction leads to the deprotonation of PBA molecules and adsorption at the interface to form a stable monolayer film. As for the concentration of urea lower than 1 mM, fully bright optical images were observed (Figure 5d–f). Therefore, the concentration of urea was fixed at 1 mM to explore the optical concentration of urease. The urease solutions with different concentrations were separately mixed with 1 mM urea solution at room temperature and incubated. The observed optical images of LC were displayed in Figure 6. When the concentration of the added urease was 1 μg/mL or above, LC presented completely dark optical images (Figure 6a,b). When the concentration of urease was lower than 1 μg/mL, fully bright optical images of LC were obtained (Figure 6c,d). Based on the above experimental results, the minimum urease concentration that can completely hydrolyze 1 mM urea is 1 μg/mL. Therefore, the subsequent experiments were conducted with 1 μg/mL urease solution and 1 mM urea solution.
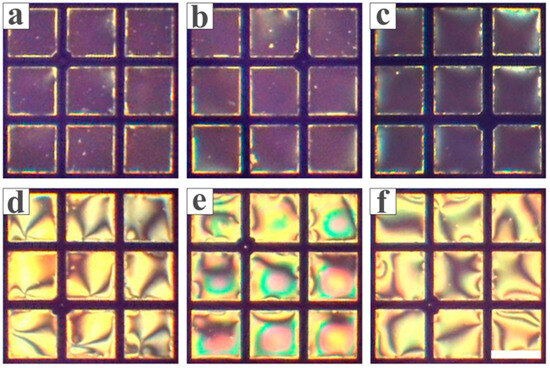
Figure 5.
Optical images of LC after contacting with the pre-incubated mixture of 5 μg/mL urease and (a) 5 mM, (b) 2.5 mM, (c) 1 mM, (d) 0.5 mM, (e) 0.1 mM, and (f) 0.01 mM urea, respectively. Scale bar: 285 μm.

Figure 6.
Optical images of LC in contact with the pre-incubated mixture of 1 mM urea and (a) 2 μg/mL, (b) 1 μg/mL, (c) 0.5 μg/mL, and (d) 0.1 μg/mL urease, respectively. Scale bar: 285 μm.
3.3. Inhibitory Effect of Heavy Metal Ions on Urease
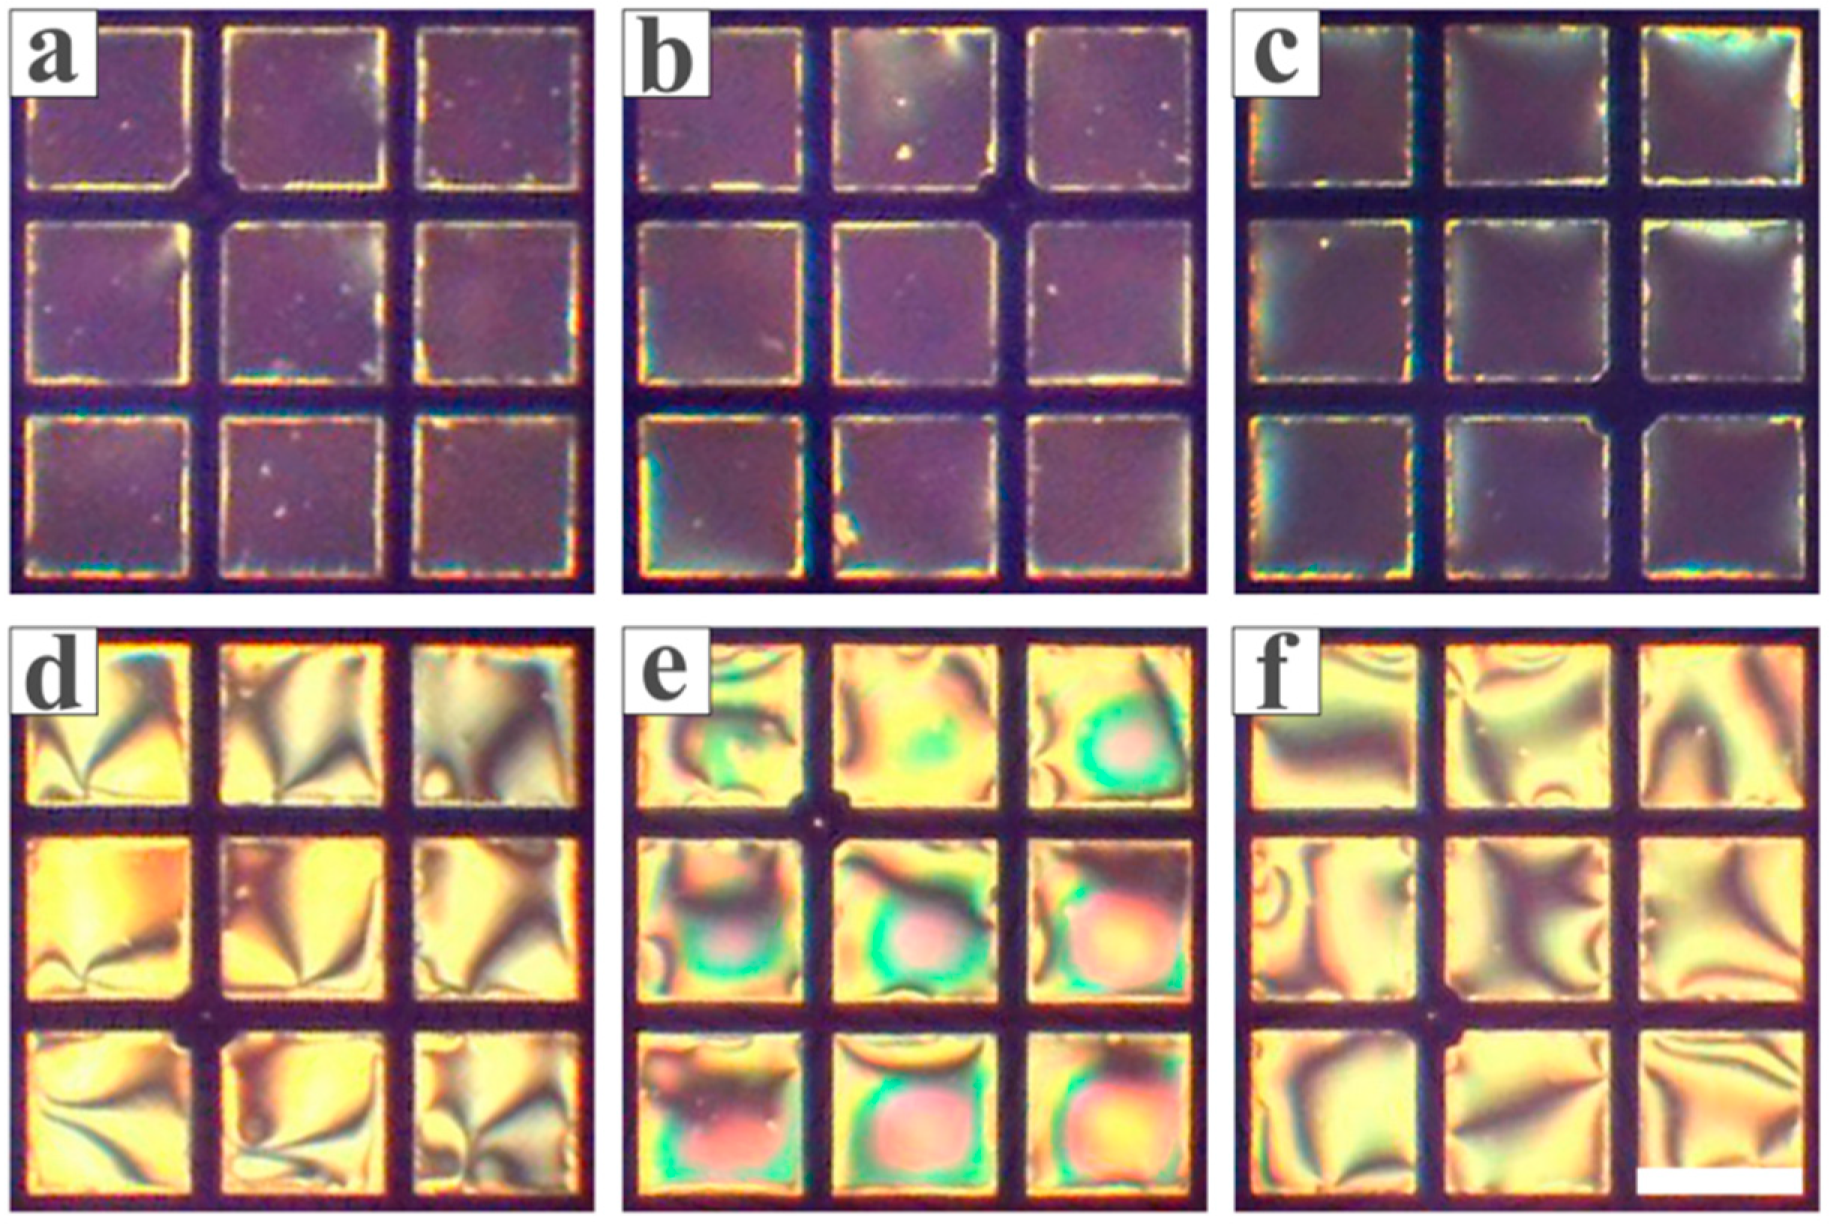
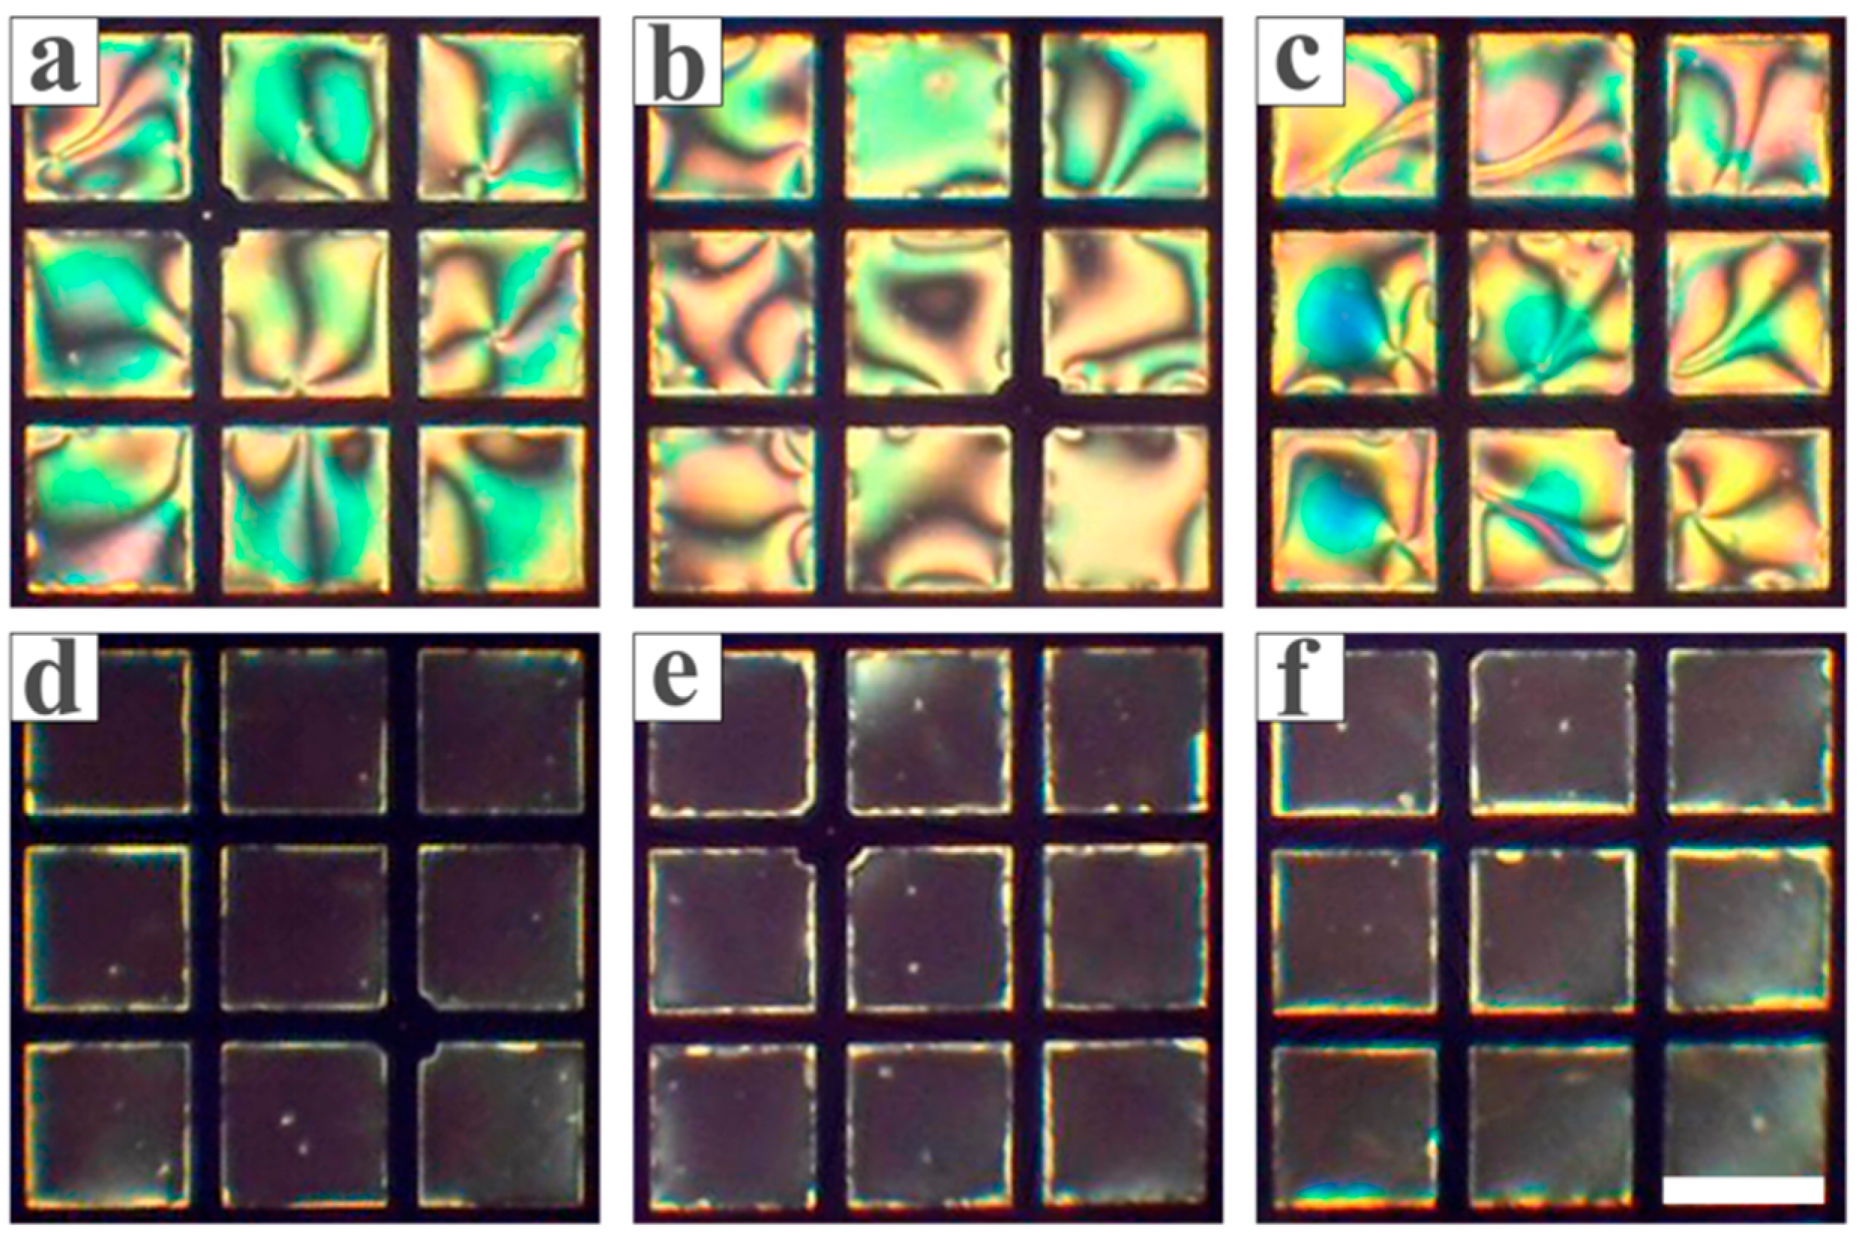
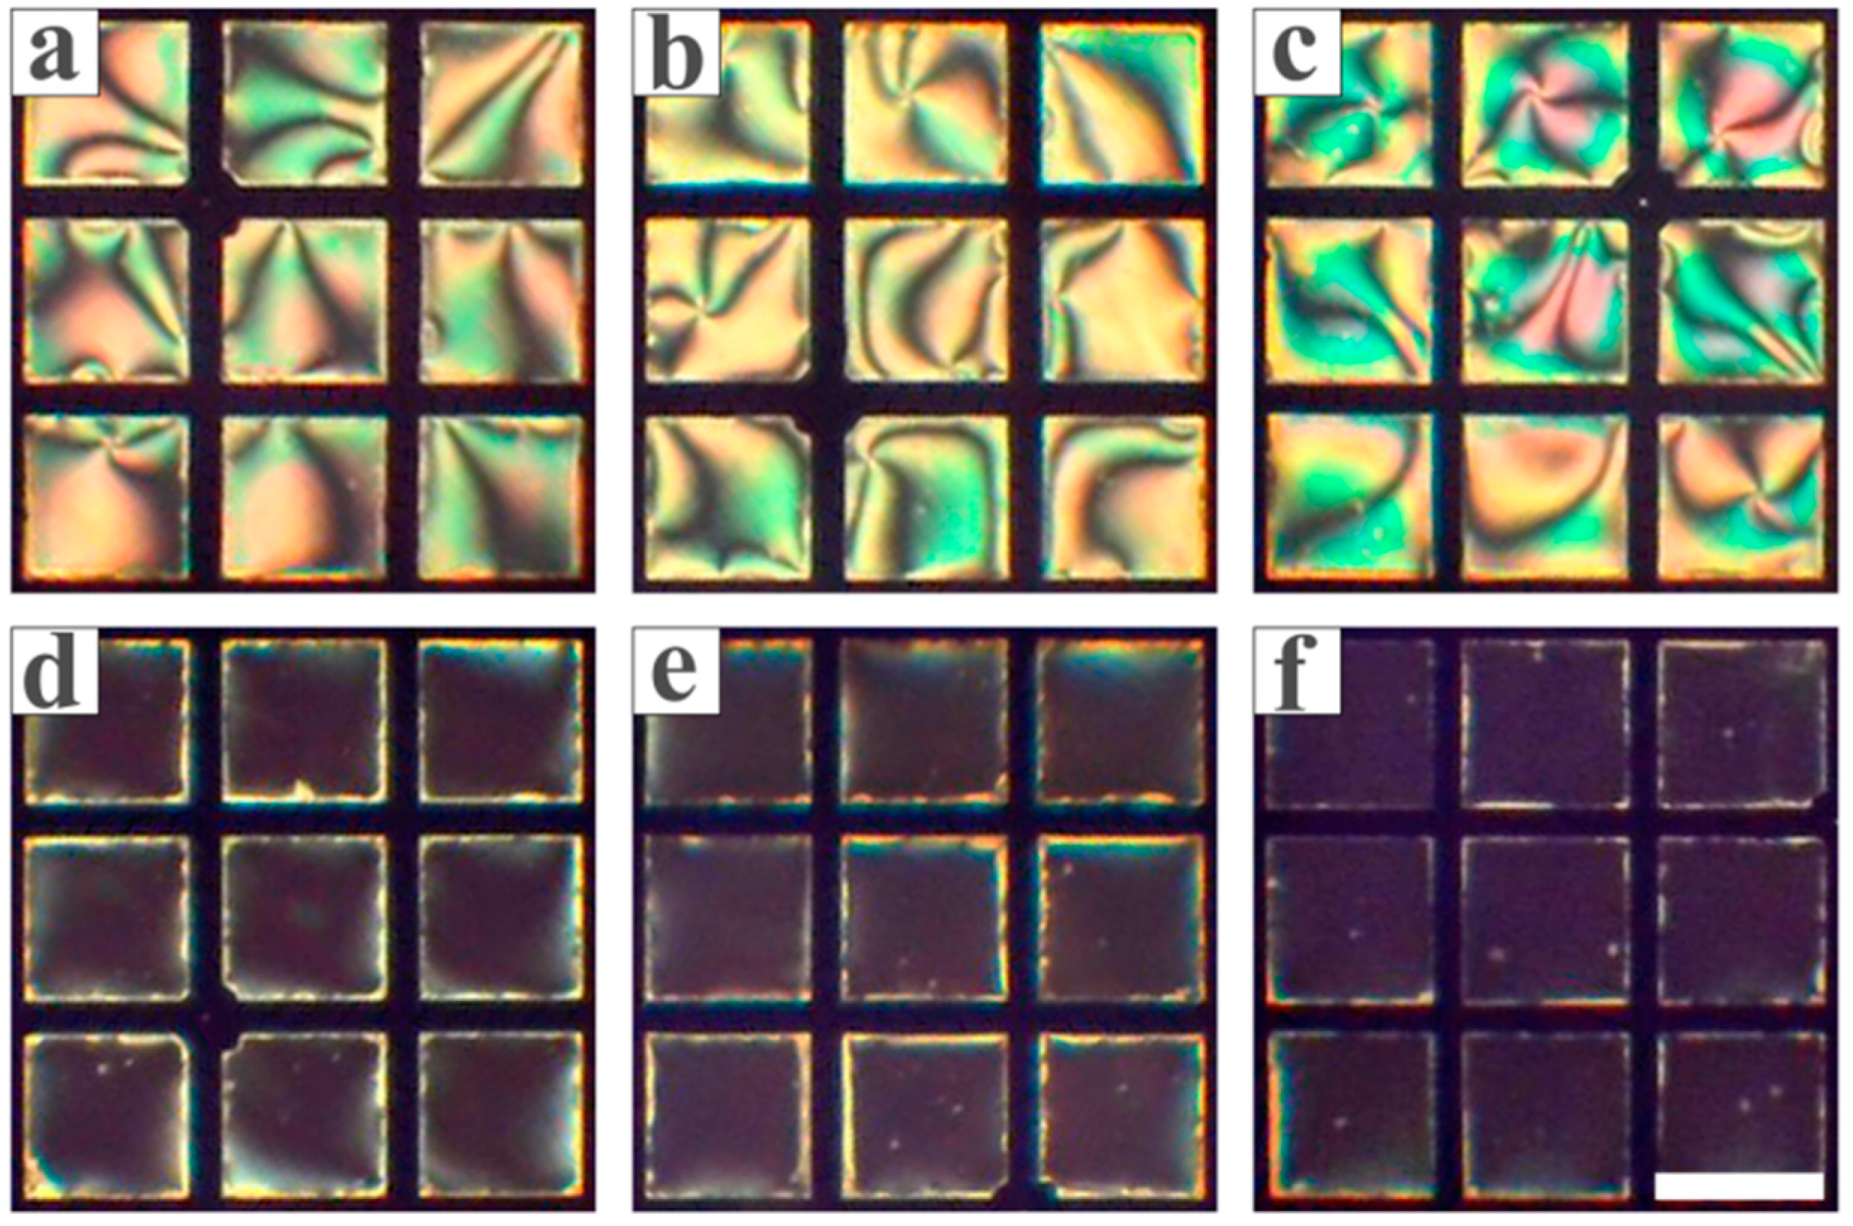
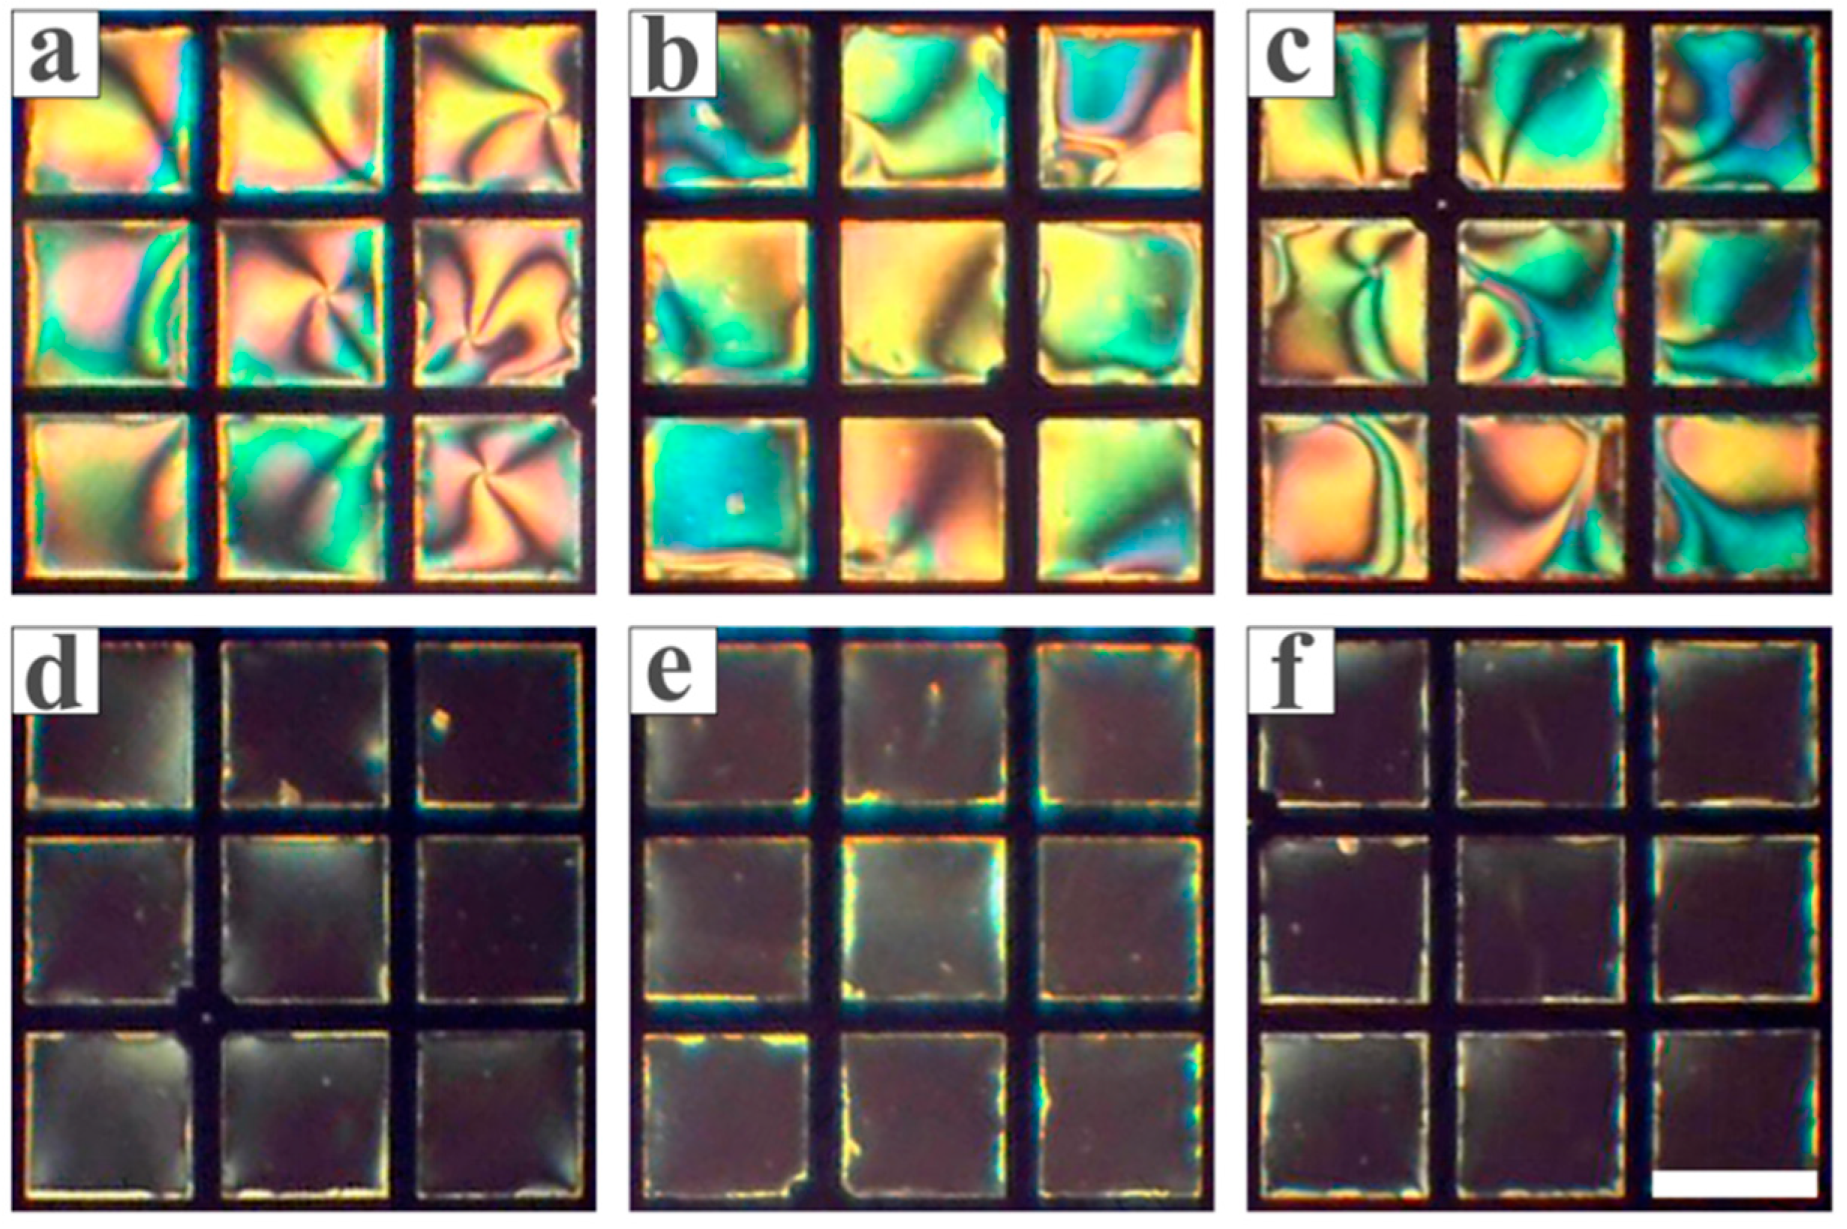
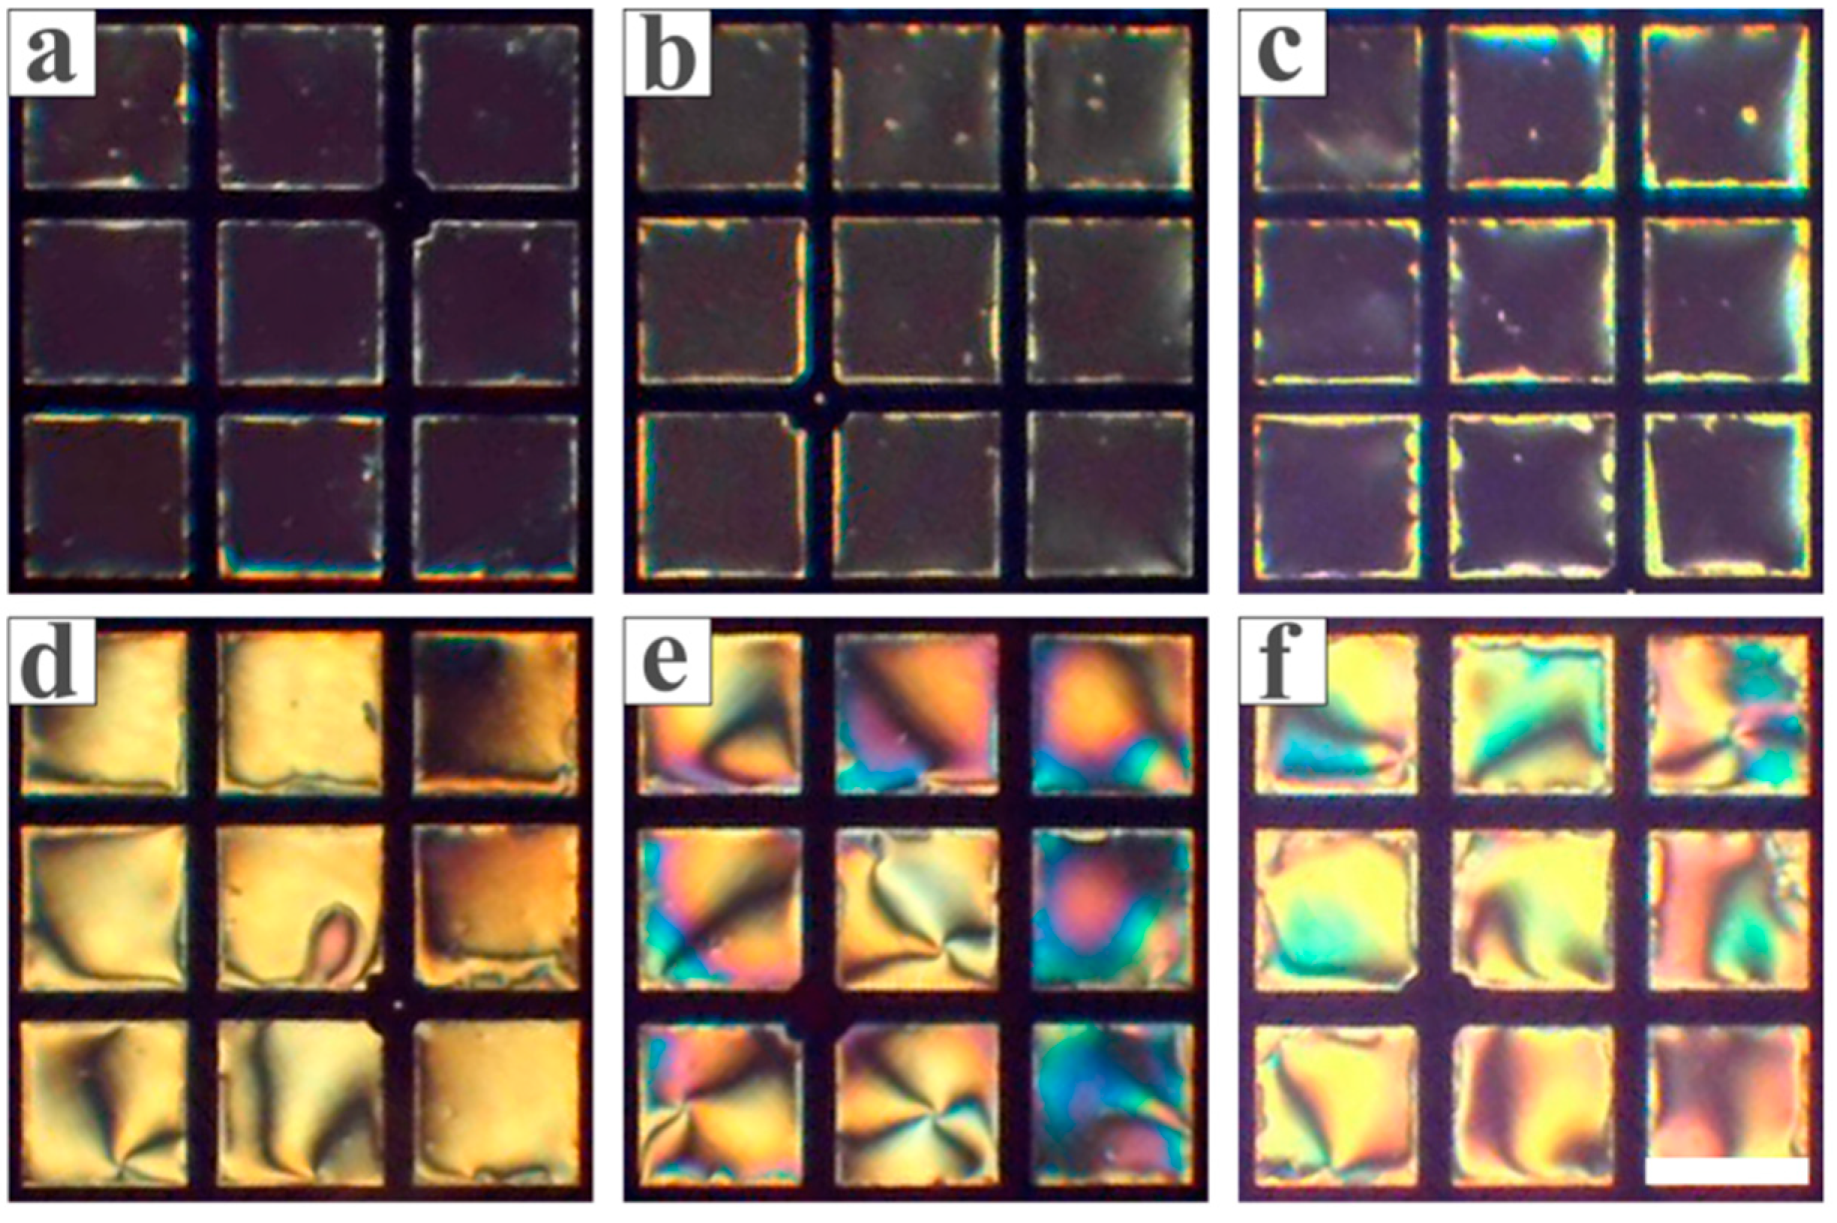
It is reported [35,36] that the catalytic active site of urease contains a thiol group, and heavy metal ions can interact with it, leading to the inactivation of urease. Therefore, three common heavy metal ions, namely Hg2+, Cu2+, and Pb2+, were selected to investigate their inhibitory effects on urease. First, the solutions of heavy metal ions with different concentrations were mixed with the urease solution; then, the urea solution was added. After pre-incubation, the reaction mixture was transferred to the LC-based sensing platform. The observed optical images of LC are demonstrated in Figure 7. When the concentration of Hg2+ was relatively high (100 ng/mL, 75 ng/mL and 50 ng/mL), bright optical images of LC were observed (Figure 7a–c), which can be attributed to the inhibited activity of urease. In the case of the concentration of Hg2+ lower than 50 ng/mL, the activity of urease was maintained and the enzymatic hydrolysis reaction can still occur, obtaining the dark optical images (Figure 7d–f). This indicates that the minimum concentration of Hg2+ that can completely inhibit urease activity is 50 ng/mL. Correspondingly, under the same conditions, the effects of different concentrations of Cu2+ and Pb2+ on urease activity were investigated. The obtained optical images of LC are illustrated in Figure 8 and Figure 9, respectively. It was found that the minimum concentrations of Cu2+ and Pb2+ that could completely inhibit urease activity were 60 ng/mL and 200 ng/mL, respectively. From the above results, it can be concluded that the order of inhibitory ability of these three heavy metal ions on urease is Hg2+ > Cu2+ > Pb2+, which is consistent with the research results reported in the literature [37,38,39]. According to the soft and hard acid-base theory of Pearson [40,41], Hg2+ is a soft acid, both Cu2+ and Pb2+ are borderline acids, and the thiol group of urease is a soft base. Therefore, compared with Cu2+ and Pb2+, Hg2+ has a stronger binding ability to the thiol group on the active site of urease and a stronger ability to inhibit urease activity. Therefore, 50 ng/mL of Hg2+ was selected to inhibit the activity of urease for the subsequent experiments of detecting biothiols.
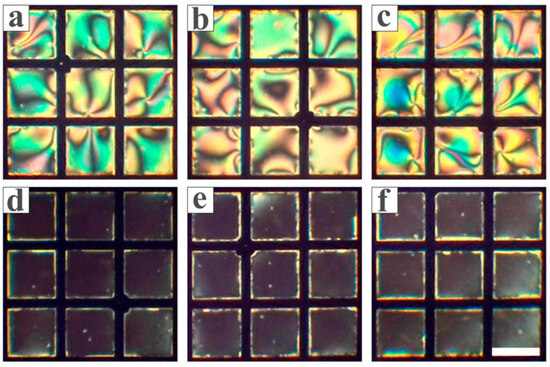
Figure 7.
Optical images of LC when 1 mM urea was pre-incubated with the mixture of 1 μg/mL urease and (a) 100 ng/mL, (b) 75 ng/mL, (c) 50 ng/mL, (d) 25 ng/mL, (e) 10 ng/mL, and (f) 1 ng/mL Hg2+, respectively. Scale bar: 285 μm.
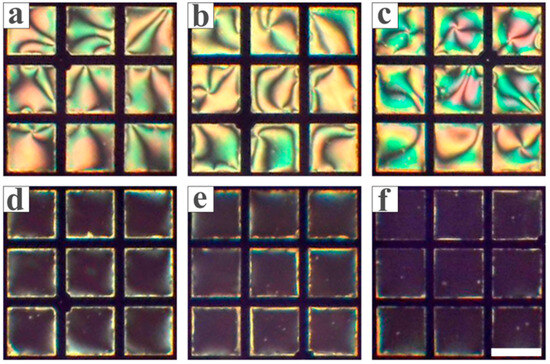
Figure 8.
Optical images of LC when 1 mM urea was pre-incubated with the mixture of 1 μg/mL urease and (a) 100 ng/mL, (b) 75 ng/mL, (c) 60 ng/mL, (d) 50 ng/mL, (e) 25 ng/mL, and (f) 10 ng/mL Cu2+, respectively. Scale bar: 285 μm.
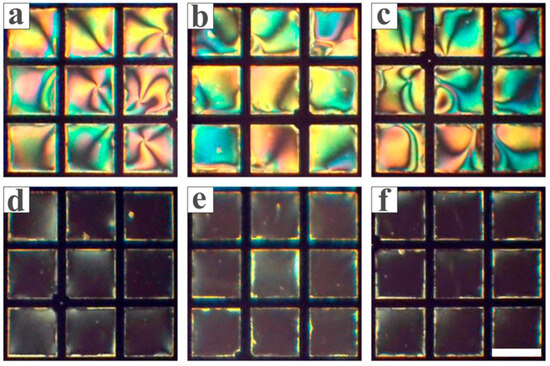
Figure 9.
Optical images of LC when 1 mM urea was pre-incubated with the mixture of 1 μg/mL urease and (a) 500 ng/mL, (b) 250 ng/mL, (c) 200 ng/mL, (d) 150 ng/mL, (e) 100 ng/mL, and (f) 10 ng/mL Pb2+, respectively. Scale bar: 285 μm.
3.4. The Sensitivity and Specificity of the LC-Based Sensing Platform in Detecting Biothiols
Using Hg2+ as the inhibitor of urease, the sensitivity of the LC-based sensing platform in detecting biothiols was explored. A series of biothiol solutions with different concentrations were separately incubated with 50 ng/mL Hg2+ solution, and then urease solution and urea solution were added successively. After the pre-incubation was completed, the observed optical images of LC are shown in Figure 10. When the concentration of added Cys reached or exceeded 0.1 μM, dark LC images were obtained (Figure 10a–c). This occurred because Hg2+ had a stronger binding affinity for the thiol groups of Cys. When the urease solution was introduced, Hg2+ no longer interacted with urease, thereby maintaining urease activity and ensuring the enzymatic hydrolysis reaction proceeded normally. When the concentration of Cys was lower than 0.1 μM, the LC images exhibited a bright morphology (Figure 10d–f). After the reaction of Hg2+ with the low-concentration Cys solution was completed, the remaining Hg2+ in the solution could still interact with urease, thereby inhibiting its activity and preventing the enzymatic hydrolysis reaction from proceeding normally. Based on observation of the changes in the optical images of LC, the detection limit of Cys can be obtained as ~0.1 μM. Similarly, according to the corresponding experimental results (Figure 11c and Figure 12c), the detection limits of Hcy and GSH are ~0.1 μM and ~0.5 μM, respectively. Compared with the LC-based sensing platform constructed based on the coordination effect [42,43], the pH-responsive LC-based sensing platform has significantly improved sensitivity in detecting Cys and Hcy.
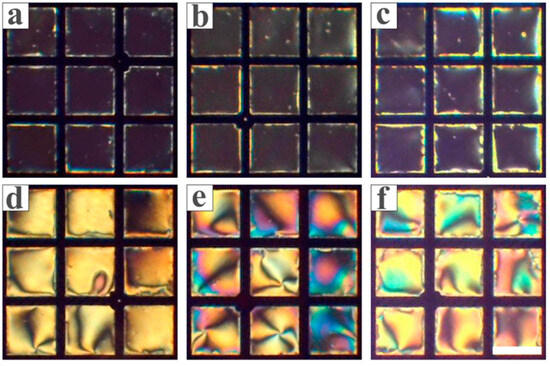
Figure 10.
Optical images of LC in contact with the pre-incubated 50 ng/mL Hg2+ and (a) 10 μM, (b) 1 μM, (c) 0.1 μM, (d) 0.05 μM, (e) 0.01 μM and (f) 1 nM Cys, 1 μg/mL urease, and 1 mM urea, sequentially. Scale bar: 285 μm.
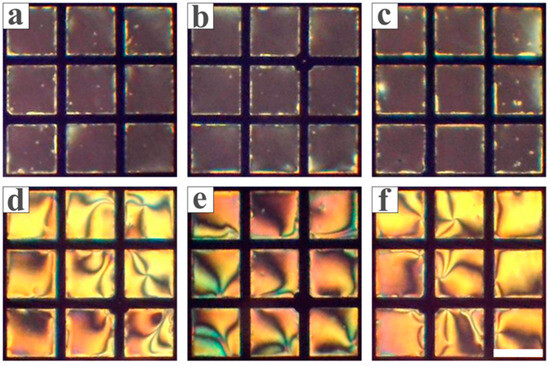
Figure 11.
Optical images of LC in contact with the pre-incubated 50 ng/mL Hg2+ and (a) 10 μM, (b) 1 μM, (c) 0.1 μM, (d) 0.05 μM, (e) 0.01 μM and (f) 1 nM Hcy, 1 μg/mL urease, and 1 mM urea, sequentially. Scale bar: 285 μm.
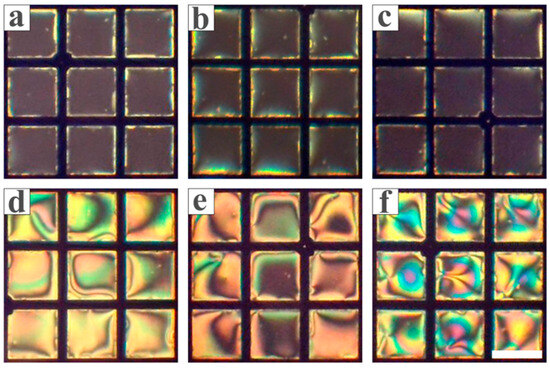
Figure 12.
Optical images of LC in contact with the pre-incubated 50 ng/mL Hg2+ and (a) 10 μM, (b) 1 μM, (c) 0.5 μM, (d) 0.1 μM, (e) 0.05 μM and (f) 0.01 μM GSH, 1 μg/mL urease, and 1 mM urea, sequentially. Scale bar: 285 μm.
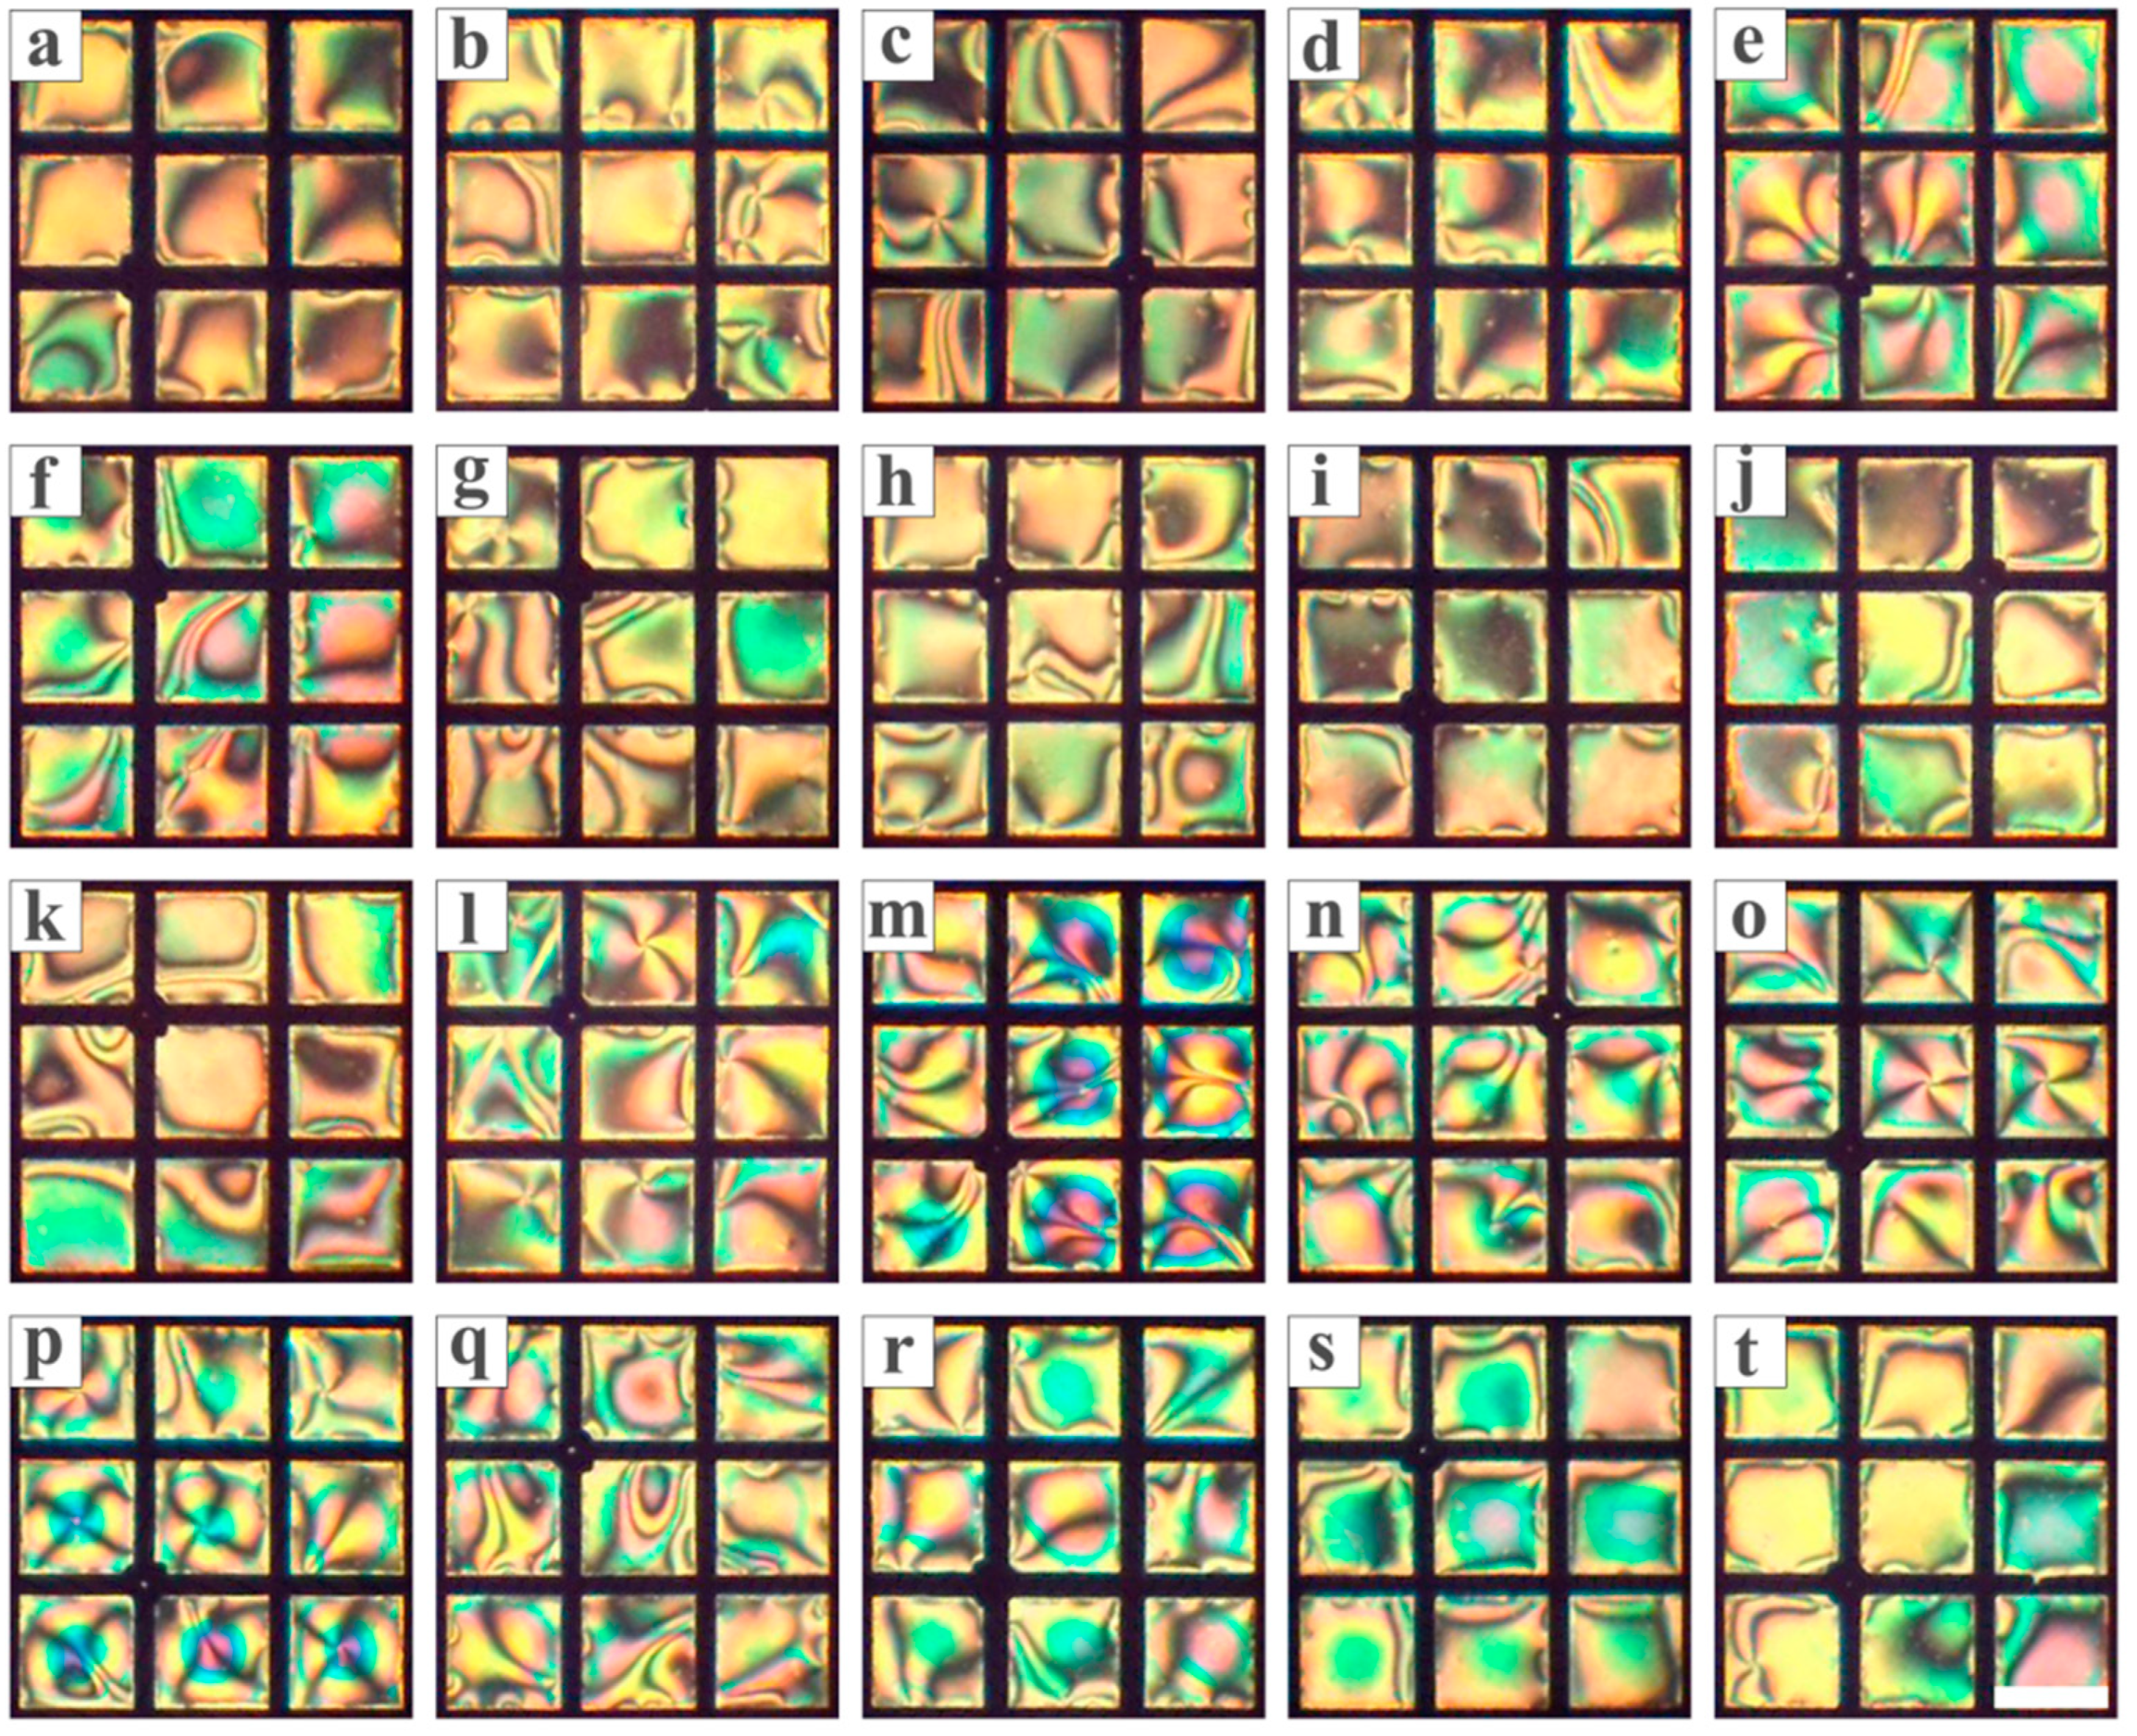
Subsequently, the specificity of the LC-based sensing platform constructed by PBA-doped 5CB was examined in detecting biothiols. The Hg2+ solution was separately pre-incubated with 10 μM solutions of various amino acids (His, Asp, Thr, Trp, Gly, Glu, Leu, Pro, Ser, Met, Lys, Arg, Ile, Val, Tyr, Asn, Gln, Phe, Ala) and GSSG, respectively. Subsequently, urease and urea solution were added successively for incubation. The experimental results obtained by transferring the mixed solution to the LC-based sensing platform are shown in Figure 13. It was found that when the above-mentioned interfering substances without thiol groups were added, all the obtained optical images of LC were bright, which was completely different from the completely dark optical images obtained in the presence of 10 μM Cys, Hcy, and GSH (Figure 10a, Figure 11a and Figure 12a). This indicates that only when the biothiols solution is incubated with the Hg2+ solution can the urease maintain activity and ensure the normal progress of the enzymatic hydrolysis reaction. Accordingly, dark optical appearances of LCs were observed. However, in other cases, the enzymatic hydrolysis reaction is inhibited. This means that the PBA-doped LC sensing platform constructed has high specificity in detecting biothiols.
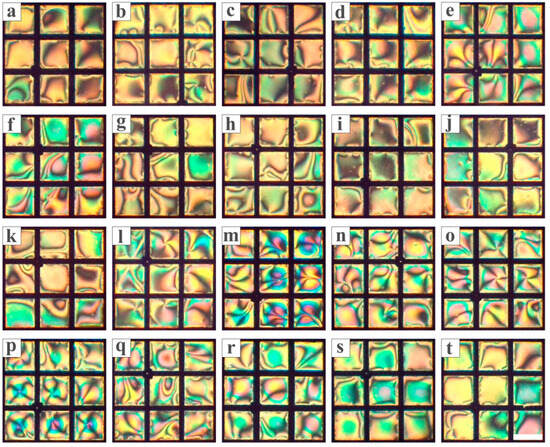
Figure 13.
Optical images of LC after contacting with the pre-incubated 50 ng/mL Hg2+ and 10 μM (a) His, (b) Asp, (c) Thr, (d) Try, (e) Gly, (f) Glu, (g) Leu, (h) Pro, (i) Ser, (j) Met, (k) Lys, (l) Arg, (m) Ile, (n) Val, (o) Tyr, (p) Asn, (q) Gln, (r) Phe, (s) Ala and (t) GSSH, 1 μg/mL urease, and 1 mM urea, sequentially. Scale bar: 285 μm.
A detailed performance comparison between the proposed LC-based platform and existing colorimetric or fluorescence-based biothiol sensors has been provided in Table 1.

Table 1.
Comparison of the assays proposed by this work and other reports for detecting Cys, Hcy, and GSH.
As can be seen from Table 1, by comparison with the existing colorimetric or fluorescence-based biothiol sensors, the proposed LC-based platform exhibits a satisfying performance for detecting biothiols. Although this method does not have the lowest detection limit, it has remarkable advantages in response time and cost. Moreover, it is also a simple and convenient assay for detecting biothiols.
4. Conclusions
A pH-responsive LC sensing platform was constructed for detecting biothiols by doping PBA molecules into LCs. Based on the pH change in solution caused by urease hydrolysis of urea, Hg2+ can interact with urease and thereby inhibit the activity of urease. Accordingly, the LC molecules adopted a tilted alignment, and a bright optical image was observed under POM. While in the presence of biothiols, the activity of urease was maintained due to the stronger binding ability of Hg2+ to biothiols. The OH− released by the enzymatic hydrolysis reaction of urea increased the pH of the solution. In this case, the deprotonated PBA molecules induced the LC molecules on the interface to adopt a homeotropic alignment, and LC presented dark optical images. Hence, the detection of Cys, Hcy, and GSH can be achieved based on the changes in the optical images of LC, and their detection limits are approximately 0.1 μM, 0.1 μM, and 0.5 μM, respectively. In addition, when other interference substances without thiol groups were used to replace the biothiols, the obtained optical images of LC were all bright, indicating that the LC-based sensing platform has good specificity for the detection of biothiols. A simple, low-cost and label-free strategy for detecting biothiols was proposed in this study and it has potential application prospects in the diagnosis of diseases related to biothiols.
Author Contributions
X.M.: Conceptualization, Investigation, Writing—original draft, Data curation. R.Z.: Methodology, Formal analysis, Writing—original draft, Data curation. X.D.: Formal analysis, Writing—original draft. Z.W.: Conceptualization, Supervision, Funding acquisition, Writing—review and editing. L.Y.: Resources, Supervision, Funding acquisition, Writing—review and editing. All authors have read and agreed to the published version of the manuscript.
Funding
This work was supported by the Innovation Team Project of Jinan of China (202333024).
Informed Consent Statement
Not applicable.
Data Availability Statement
The original contributions presented in this study are included in the article.
Conflicts of Interest
The authors declare no competing financial interest.
Abbreviations
The following abbreviations are used in this manuscript:
| Cys | Cysteine |
| Hcy | Homocysteine |
| GSH | Glutathione |
| LC | Liquid crystal |
| PBA | 4-n-pentylbiphenyl-4-carboxylic acid |
| 5CB | 4-n-pentyl-4-cyanobiphenyl |
| DMOAP | N, N-dimethyl-N-octadecyl-3-(trimethoxysilyl) propylammonium chloride |
| POM | Polarized optical microscope |
References
- Huang, W.; He, M.; Chen, S.; Yin, G.; Gan, Y.; Li, H.; Wu, C.; Yin, P. Dual-channel fluorescent detection of biothiols: A novel probe for distinguishing cysteine, homocysteine, glutathione, and N-Acetylcysteine in cellular environments. Spectrochim. Acta A Mol. Biomol. Spectrosc. 2025, 326, 1235221. [Google Scholar] [CrossRef] [PubMed]
- Cugnasca, B.S.; Santos, H.M.; Duarte, F.; Capelo-Martínez, J.L.; Dos Santos, A.A.; Lodeiro, C. Fluorescent discrimination of cysteine, homocysteine, and glutathione in urine samples using a novel seleno-BODIPY Probe. J. Mater. Chem. B 2024, 123, 123038–123049. [Google Scholar] [CrossRef]
- Li, H.; Zhao, C.; Wei, S.; Liu, X.; Li, J.; Wang, J. A pH-regulated colorimetric sensor array for discrimination of biothiols based on two different-sized β-cyclodextrin-functionalized AuNPs. J. Anal. Test. 2023, 7, 101–109. [Google Scholar] [CrossRef]
- Ding, X.; Yang, B.; Liu, Z.; Shen, M.; Fan, Z.; Wang, X.; Yu, W. A novel intramolecular charge transfer-based near-infrared fluorescent probe with large stokes shift for highly sensitive detection of cysteine in vivo. Anal. Chim. Acta 2023, 12380, 341873. [Google Scholar] [CrossRef]
- Hasan, T.; Arora, R.; Bansal, A.K.; Bhattacharya, R.; Sharma, G.S.; Singh, L.R. Disturbed homocysteine metabolism is associated with cancer. Exp. Mol. Med. 2019, 51, 1–13. [Google Scholar] [CrossRef]
- Fontana, M.; Gunaydin Akyildiz, A.; D’Alonzo, C.; Giovannercole, F.; Zicchi, A.; Francioso, A.; Capuozzo, E.; De Biase, D. Synthesis and biological activity of homohypotaurine obtained by the enzyme-based conversion of homocysteine sulfinic acid using recombinant escherichia coli glutamate decarboxylase. Molecules 2024, 29, 3985. [Google Scholar] [CrossRef]
- Cotton, K.; Ayers, E.; Jin, Y.; Beauchet, O.; Derby, C.A.; Lipton, R.B.; Katz, M.; Galery, K.; Gaudreau, P.; Verghese, J. Elevated blood homocysteine increases the risk of incident motoric cognitive risk syndrome: A two-cohort study. J. Gerontol. Ser. A 2024, 79, 114. [Google Scholar] [CrossRef]
- Wang, C.Y.; Zhang, X.; Qiu, B. Genetically predicted circulating serum homocysteine levels on osteoporosis: A two-sample mendelian randomization study. Sci. Rep. 2023, 13, 9063. [Google Scholar] [CrossRef]
- Ruseva, S.; Popova, I.; Lozanov, V.; Mitev, V. Insight into the metabolite pattern of psoriasis: Correlation among homocysteine, methionine, and polyamines. Symmetry 2021, 13, 606. [Google Scholar] [CrossRef]
- Haseena, P.; Diwakar, L.; Ravindranath, V. Protein glutathionylation and glutaredoxin: Role in neurodegenerative diseases. Antioxidants 2022, 11, 2334. [Google Scholar] [CrossRef] [PubMed]
- Erdos, T.; Masuda, M.; Venketaraman, V. Glutathione in HIV-associated neurocognitive disorders. Curr. Issues Mol. Biol. 2024, 46, 5530–5549. [Google Scholar] [CrossRef]
- Hu, Y.; Heo, C.H.; Kim, G.; Jun, E.J.; Yin, J.; Kim, H.M.; Yoon, J. One-photon and two-photon sensing of biothiols using a bis-pyrene-Cu(II) ensemble and its application to image GSH in the cells and tissues. Anal. Chem. 2015, 87, 3308–3313. [Google Scholar] [CrossRef]
- Yutani, R.; Venketaraman, V.; Sheren, N. Treatment of acute and long-COVID, diabetes, myocardial infarction, and alzheimer’s disease: The potential role of a novel nano-compound—The transdermal glutathione-cyclodextrin complex. Antioxidants 2024, 13, 1106. [Google Scholar] [CrossRef]
- Özyürek, M.; Baki, S.; Güngör, N.; Çelik, S.E.; Güçlü, K.; Apak, R. Determination of biothiols by a novel on-line HPLC-DTNB assay with post-column detection. Anal. Chim. Acta 2012, 750, 173–181. [Google Scholar] [CrossRef]
- Pudova, P.A.; Ivanov, A.V.; Popov, M.A.; Maslennikov, R.A.; Aleksandrin, V.V.; Galdobina, M.P.; Kubatiev, A. Determination of main aminothiols in blood plasma using capillary electrophoresis with UV detection. Biomed. Chromatogr. 2025, 39, e70017. [Google Scholar] [CrossRef] [PubMed]
- Negi, S.; Takkar, P.; Gahlyana, P.; Kumar, R. A new pyranopyrazole based colorimetric chemosensor for the selective recognition of biothiols: Applications in real samples. Anal. Methods 2025, 17, 377–387. [Google Scholar] [CrossRef] [PubMed]
- Lin, J.; Ni, P.; Sun, Y.; Wang, Y.; Wang, L.; Li, Z. Highly sensitive colorimetric determination of biothiols based on I−-H2O2-3,3′,5,5′-tetramethylbenzidine system. Sens. Actuators B 2018, 255, 3472–3478. [Google Scholar] [CrossRef]
- Shellaiah, M.; Sun, K.W. Review on carbon dot-based fluorescent detection of biothiols. Biosensors 2023, 13, 335. [Google Scholar] [CrossRef] [PubMed]
- Han, S.; Zeng, Y.; Liu, M.; Yang, L.; Wang, J.; Song, X. Regulating sensing patterns in fluorescent probes for discriminative detection of biothiols. Anal. Chem. 2025, 97, 419–426. [Google Scholar] [CrossRef]
- Li, H.; An, Y.; Gao, J.; Yang, M.; Luo, J.; Li, X.; Lv, J.; Li, X.; Yuan, Z.; Ma, H. Recent advances of fluorescence probes for imaging of ferroptosis process. Chemosensors 2022, 10, 233. [Google Scholar] [CrossRef]
- Yang, X.; Tian, Y.; Li, F.; Yu, Q.; Tan, S.; Chen, Y.; Yang, Z. Investigation of the Assembly Behavior of an Amphiphilic Lipopeptide at the Liquid Crystal-Aqueous Interface. Langmuir 2019, 35, 2490–2497. [Google Scholar] [CrossRef]
- Yang, C.; Chen, L.; Zhang, R.; Chen, D.; Laura, R.A.; David, A. Local high-density distributions of phospholipids induced by the nucleation and growth of smectic liquid crystals at the interface. Chin. Chem. Lett. 2022, 8, 3973–3976. [Google Scholar] [CrossRef]
- Satyabratt, P.; Madeeha, R.; Vishal, S.; Garima, S.; Chandan, B.; Rohit, V.; Dharm, D.; Ranjan, K.; Sachin, K. Real-time optical detection of mercury contamination in drinking water using an amphiphilic recognition probe at liquid crystal/aqueous interfaces. Anal. Methods 2024, 16, 8139–8147. [Google Scholar]
- Kinsinger, M.I.; Sun, B.; Abbott, N.L.; Lynn, D.M. Reversible control of ordering transitions at aqueous/liquid crystal interfaces using functional amphiphilic polymers. Adv. Mater. 2007, 19, 4208–4212. [Google Scholar] [CrossRef]
- Bi, X.; Hartono, D.; Yang, K.-L. Real-time liquid crystal pH sensor for monitoring enzymatic activities of penicillinase. Adv. Funct. Mater. 2009, 19, 3760–3765. [Google Scholar] [CrossRef]
- Li, G.; Xiao, F.; Liao, S.; Chen, Q.; Zhou, J.; Wu, Z.; Yu, R. Label-free 2D colloidal photonic crystal hydrogel biosensor for urea and urease inhibitor. Sens. Actuators B 2018, 277, 591–597. [Google Scholar] [CrossRef]
- Liu, J.; Tai, W.; Wang, D.; Su, J.; Yu, L. Cholesteric liquid crystal photonic hydrogel films immobilized with urease used for the detection of Hg2+. Chemosensors 2022, 10, 140. [Google Scholar] [CrossRef]
- Recky, J.R.N.; Montero-Jimenez, M.; Scotto, J.; Azzaroni, O.; Marmisollé, W.A. Urea biosensing through integration of urease to the PEDOT-polyamine conducting channels of organic electrochemical transistors: pH-change-based mechanism and urine sensing. Chemosensors 2024, 123, 1234. [Google Scholar]
- Zhang, R.; Liao, W.; Sun, Y.; Heng, J.Y.Y.; Yang, Z. Investigating the role of glass and quartz substrates on the formation of interfacial droplets. J. Phys. Chem. C 2019, 123, 1151–1159. [Google Scholar] [CrossRef]
- Zhang, W.; Ang, W.T.; Xue, C.-Y.; Yang, K.-L. Minimizing nonspecific protein adsorption in liquid crystal immunoassays by using surfactants. ACS Appl. Mater. Interfaces 2011, 3, 3496–3500. [Google Scholar] [CrossRef] [PubMed]
- Hussain, Z.; Zafiu, C.; Küpcü, S.; Pivetta, L.; Hollfelder, N.; Masutani, A.; Kilickiran, P.; Sinner, E.-K. Liquid crystal based sensors monitoring lipase activity: A new rapid and sensitive method for cytotoxicity assays. Biosens. Bioelectron. 2014, 56, 210–216. [Google Scholar] [CrossRef]
- Tsuei, M.; Shivrayan, M.; Kim, Y.-K.; Thayumanavan, S.; Abbott, N.L. Optical “Blinking” triggered by collisions of single supramolecular assemblies of amphiphilic molecules with interfaces of liquid crystals. J. Am. Chem. Soc. 2020, 142, 6139–6148. [Google Scholar] [CrossRef] [PubMed]
- He, W.; Luo, L.; Liu, Q.; Chen, Z. Colorimetric sensor array for discrimination of heavy metal ions in aqueous solution based on three kinds of thiols as receptors. Anal. Chem. 2018, 90, 4770–4775. [Google Scholar] [CrossRef]
- Lei, C.; Dai, H.; Fu, Y.; Ying, Y.; Li, Y. Colorimetric sensor array for thiols discrimination based on urease-metal ion pairs. Anal. Chem. 2016, 88, 8542–8547. [Google Scholar] [CrossRef]
- Yang, W.; Peng, Z.; Wang, G. An overview: Metal-based inhibitors of urease. J. Enzym. Inhib. Med. Chem. 2023, 38, 361–375. [Google Scholar] [CrossRef] [PubMed]
- Xing, Y.; He, P.; Wang, D.; Liang, Y.; Gao, X.; Hou, X. Bimetallic Fe3O4@Co3O4/CN as a Nanozyme with Dual Enzyme-Mimic Activities for the Colorimetric Determination of Mercury(II). Chemosensors 2024, 123, 104. [Google Scholar] [CrossRef]
- Shaw, W.H.R. The inhibition of urease by various metal ions. J. Am. Chem. Soc. 1954, 76, 2160–2163. [Google Scholar] [CrossRef]
- Habala, L.; Devínsky, F.; Egger, A.E. Review: Metal complexes as urease inhibitors. J. Coord. Chem. 2018, 71, 907–940. [Google Scholar] [CrossRef]
- Huang, M.; Cui, P.; Zhou, J.; Liu, C.; Wang, Y. Theoretical study on the inhibition mechanisms of heavy metal ions on urease activity. Chemosphere 2023, 345, 140416. [Google Scholar] [CrossRef]
- Huang, Y.-K.; Qiu, X.-H. Development and application of the concept of Hard-Soft-Acid-Base (HSAB). Univ. Chem. 2016, 31, 45–50. [Google Scholar] [CrossRef]
- Qi, X.; Xie, Y.-L.; Niu, J.-Y.; Zhao, J.-W.; Li, Y.-M.; Fang, W.-H.; Zhang, J. Application of hard and soft acid-base theory to construct heterometallic materials with metal-oxo clusters. Angew. Chem. Int. Ed. 2025, 64, e202417548. [Google Scholar] [CrossRef]
- Wang, Y.; Hu, Q.; Tian, T.; Gao, Y.; Yu, L. A liquid crystal-based sensor for the simple and sensitive detection of cellulase and cysteine. Colloids Surf. B Biointerfaces 2016, 147, 100–105. [Google Scholar] [CrossRef] [PubMed]
- Kirtika, M.; Bachcha, S. Liquid crystal-based optical sensor for the detection of cysteine through competitive host-guest inclusion. Liq. Cryst. 2020, 48, 980–990. [Google Scholar]
- Zhu, D.; Ren, A.; Xue, L. A mitochondria-targeted colorimetric and NIR ratiometric fluorescent probe for biothiols with large Stokes shift based on thiol–chromene click reaction. Org. Biomol. Chem. 2024, 22, 9113–9120. [Google Scholar] [CrossRef] [PubMed]
- Ren, A.; Qiao, L.; Li, K.; Zhu, D.; Zhang, Y. Mitochondria-Targeted NIR ratiometric and colorimetric fluorescent probe for biothiols based on a thiol-chromene click reaction. Anal. Chem. 2024, 96, 17773–17780. [Google Scholar] [CrossRef]
- Li, X.; Yuan, R.; Ma, Y.; Li, G.; Ma, S. A highly selective and sensitive fluorescent probe with a large Stokes shift for Near-Infrared visualization of endogenous and exogenous biothiols in living cells. Front. Biosci.-Landmark. 2025, 30, 37240. [Google Scholar] [CrossRef]
- Yu, T.; Li, Y.; Li, J.; Gan, Y.; Long, Z.; Deng, Y.; Zhang, Y.; Li, H.; Yin, P.; Yao, S. Multifunctional fluorescent probe for simultaneous detection of ATP, Cys, Hcy, and GSH: Advancing insights into epilepsy and liver injury. Adv. Sci. 2025, 12, 2415882. [Google Scholar] [CrossRef]
- Yuan, D.; Liu, J.; Yan, H.; Li, M.; Huang, C.; Wang, J. Label-free gold nanorods sensor array for colorimetric detection and discrimination of biothiols in human urine samples. Talanta 2019, 203, 220–226. [Google Scholar] [CrossRef]
- Hou, W.; Liu, X.; Lu, Q.; Liu, M.; Zhang, Y.; Yao, S. Etching and anti-etching strategy for sensitive colorimetric sensing of H2O2 and biothiols based on silver/carbon nanomaterial. Colloids Surf. B 2018, 162, 118–125. [Google Scholar] [CrossRef]
- Yuan, C.; Qin, X.; Xu, Y.; Li, X.; Chen, Y.; Shi, R.; Wang, Y. Carbon quantum dots originated from chicken blood as peroxidase mimics for colorimetric detection of biothiols. J. Photochem. Photobiol. A 2020, 396, 112529. [Google Scholar] [CrossRef]
Disclaimer/Publisher’s Note: The statements, opinions and data contained in all publications are solely those of the individual author(s) and contributor(s) and not of MDPI and/or the editor(s). MDPI and/or the editor(s) disclaim responsibility for any injury to people or property resulting from any ideas, methods, instructions or products referred to in the content. |
© 2025 by the authors. Licensee MDPI, Basel, Switzerland. This article is an open access article distributed under the terms and conditions of the Creative Commons Attribution (CC BY) license (https://creativecommons.org/licenses/by/4.0/).


