Article

Trimethylamine Gas Sensor Based on Electrospun In2O3 Nanowires with Different Grain Sizes for Fish Freshness Monitoring

1
Engineering Research Center of IoT Technology Applications (Ministry of Education), School of Integrated Circuits, Jiangnan University, Wuxi 214122, China
2
Shanghai Artificial Intelligence Research Institute Co., Ltd., Shanghai 200240, China
3
Artificial Intelligence Technology Center, Institute of Translational Medicine, Shanghai Jiao Tong University, Shanghai 200240, China
*
Authors to whom correspondence should be addressed.
Chemosensors 2025, 13(6), 218; https://doi.org/10.3390/chemosensors13060218
Submission received: 30 April 2025 / Revised: 11 June 2025 / Accepted: 12 June 2025 / Published: 14 June 2025

Abstract

:
Seafood, especially marine fish, is highly prone to spoilage during processing, transportation, and storage. It releases pungent trimethylamine (TMA) gas, which severely affects food quality and safety. Metal–oxide–semiconductor (MOS) gas sensors for TMA detection offer a rapid, convenient, and accurate method for assessing fish freshness. Indium oxide (In2O3) has shown potential as an effective sensing material for the detection of TMA. In this work, one-dimensional In2O3 nanowires with different grain sizes and levels of crystallinity were synthetized using the electrospinning technique and underwent different thermal calcination processes. Gas-sensing tests showed that the In2O3−3 °C/min−500 °C gas sensor exhibited an outstanding performance, including a high response (Ra/Rg = 47.0) to 100 ppm TMA, a short response time (6 s), a low limit of detection (LOD, 0.0392 ppm), and an excellent long-term stability. Furthermore, the sensor showed promising experimental results in monitoring the freshness of Larimichthys crocea (L. crocea). By analyzing the relationship between the grain size and crystallinity of the In2O3 samples, a mechanism for the enhanced gas-sensing performance was proposed. This work provides a novel strategy for designing and fabricating gas sensors for TMA detection and highlights their potential for broad applications in real-time fish freshness monitoring.

1. Introduction

With the rapid development of the economy and improvements in living standards, people’s dietary habits and food varieties have become increasingly diversified. A rich variety of marine and aquatic products has entered public consumption, among which marine fish are particularly favored by consumers due to their high contents of protein, amino acids, vitamins, and minerals [1]. Meanwhile, consumers are placing higher demands on food freshness and safety. However, marine fish are highly susceptible to spoilage during processing, transportation, and storage, which significantly compromises their quality and poses risks to consumer health [2,3]. Therefore, there is an urgent need for rapid and effective methods to detect and evaluate the freshness of marine fish [4,5].
Generally, fish undergo physical and chemical changes during the spoilage process, which involve changes in appearance, color, odor, and microbial colonies. Therefore, the freshness of fish can be assessed through various techniques, including sensory characteristic analysis (color and texture) [6], physical and chemical experimental analysis (pH level, K value, and total volatile basic nitrogen (TVB-N)) [7,8], and gas analysis (volatile organic compounds, VOCs) [9,10]. Among these, sensory characteristic analysis is a traditional detection method, with the quality index method (QIM) being the most widely used [11,12]. This method evaluates the color, taste, and tissue morphology of the fish surface and summarizes the results to ultimately determine the quality level. Physical and chemical experimental analyses linked to chemical composition changes in fish are essential and indispensable methods for evaluating fish freshness. Common physical and chemical experimental analyses include moisture content analysis [13,14], TVB-N determination [15,16], protein degradation assessment [17,18], lipid oxidation evaluation [19,20], and K-value measurement based on adenosine triphosphate (ATP) degradation [21,22]. These indicators collectively provide a comprehensive framework for assessing freshness in fish products. Although the previously mentioned freshness detection techniques are relatively accurate, they have limitations such as being destructive, expensive, and time-consuming [23]. Therefore, there is a need for a convenient, rapid, and accurate method to assess fish freshness.
It is important to mention that trimethylamine oxide (TMAO), an abundant compound in marine fish, is converted into TMA under the action of bacterial enzymes, which is the primary cause of fishy odors [24]. Therefore, the measurement of TMA in seafood products is an indicator for assessing the freshness of fish (fresh: 0–1 mg/100 g, < 10 ppm; beginning to spoil: 1–5 mg/100 g, 10–50 ppm; and severely spoiled: > 6 mg/100 g, > 60 ppm) [5,25]. In recent years, various methods for detecting TMA have been extensively developed and applied, such as high-performance liquid chromatography (HPLC), gas chromatography–mass spectrometry (GC-MS), and ion mobility spectrometry [26,27]. However, these detection methods usually require expensive precision instruments and complex operating procedures, making them unsuitable for on-site assessments of fish freshness. The MOS gas sensor is a novel method for detecting TMA, which can simply analyze the concentration of the gas with a high sensitivity and low cost [28,29].
MOSs have attracted widespread attention due to their low cost, good stability, and excellent electrochemical performance, and are widely used in fields such as gas sensors [30] and electrode materials [31]. Researchers have developed various MOS gas sensors for TMA detection, including materials such as WO3, ZnO, MoO3, α-Fe2O3, SnO2, and In2O3. Shen et al. [32] designed a TMA gas sensor based on oxygen-vacancy-rich and porous α-MoO3 nanosheets, which demonstrated a good linear response to 0.02–50 ppm TMA at 133 °C and an LOD of as low as 20 ppb. At its optimal operating temperature, the sensor exhibited a response value of 51.47 to 10 ppm TMA, with response/recovery times of 15 s and 300 s, respectively, highlighting its potential for practical applications. Liu et al. [33] synthesized α-Fe2O3 nanoparticles (~500 nm in diameter) via a solvothermal method and tested their gas-sensing performance as thick-film sensors. At 250 °C, the α-Fe2O3 nanoparticles showed an excellent selectivity and high sensitivity to TMA, with a minimum detectable concentration of 1 ppm. The sensor achieved a response value of 27.8 to 100 ppm TMA within 1 min, with a recovery period of less than 4 min. Wang et al. [34] prepared ordered mesoporous WO3 and Au-loaded WO3 (Au−WO3) sensors using KIT-6 as a template. The Au−WO3 sensor exhibited an exceptional sensing performance at 268 °C, including a high response (Ra/Rg = 41.56) to 100 ppm TMA, an ultrafast response speed (1 s), and an excellent selectivity, though its recovery time was 323 s.
According to the above review, MOS gas sensors have advantages such as portability, cost-effectiveness, and a high sensitivity, making them a promising method for assessing the freshness of fish. However, MOS gas sensors still have issues such as a low sensitivity to TMA and long response/recovery times during the detection process. In2O3 material is a typical n-type MOS material. Compared with other MOSs, it has the advantages of a good thermal stability and low resistivity. It also has the advantages of safety, non-toxicity, low cost, and a good gas sensitivity to various oxidizing and reducing gases. These properties have enabled its widespread application in optoelectronics, gas sensing, and catalysis [35,36,37]. The short response/recovery time and long-term stability of In2O3 make it a leading candidate for advancing TMA-sensing technologies in practical applications. Researchers exploring In2O3-based gas sensors have identified significant improvements. For instance, Lu et al. [38] synthesized flower-shaped In2O3 nanostructures using a hydrothermal method. The sensor achieved its maximum TMA sensitivity at an optimal operating temperature of 340 °C, with short response/recovery times of 5 s and 10 s. These results indicate that the sensor is highly sensitive to TMA and can effectively be utilized to assess the freshness of fish. Li et al. [39] developed a novel flexible TMA gas sensor using In2O3 nanofibers. At 80 °C, the sensor exhibited a high response (3.8 to 1 ppm TMA), short response/recovery time (6 s and 10 s), and excellent reliability and flexibility, further confirming the suitability of In2O3 for high-performance TMA detection.
In recent years, researchers have investigated various synthesis methods to create In2O3-based nanomaterials with different microstructures to improve gas sensor performance. Wang et al. [40] prepared one-dimensional In2O3 nanofibers via electrospinning, further increasing the specific surface area. Gas-sensing tests revealed that these In2O3 nanowires exhibited a high sensitivity, selectivity, and rapid response/recovery speed when exposed to ethanol vapor. Santucci et al. [41] synthetized In2O3 thin films through high-vacuum thermal evaporation and sol–gel techniques, showing their superior gas-sensing response to NO2 at 250 °C. Building on this, Arbiol et al. [42] investigated the impact of structural parameters (e.g., film thickness and grain size) on gas-sensing performance, concluding that reducing film thickness and grain size significantly enhanced the sensitivity of In2O3-based gas sensors. These studies highlight the critical role of tailored nanostructures in advancing the application of In2O3 for gas detection technologies.
In this study, a simple electrospinning method was employed to synthesize one-dimensional In2O3 nanowires. The microstructure of the In2O3 nanowires was adjusted by changing the heating rates and annealing temperatures during the thermal treatment process, which affected their surface and grain sizes. Among the samples compared, the one heated to 500 °C at a rate of 3 °C/min exhibited a higher response (47.0), faster response speed (6 s), and lower LOD (0.0392 ppm). Based on an analysis of characterization results and gas sensitivity tests, the observed enhancement in TMA gas-sensing performance can be attributed to the alterations in the surface and grain size of the In2O3 nanowires induced by the changes in heating rate and annealing temperature. This work provides a novel approach for the development of high-performance TMA gas sensors.

2. Experimental Section

This section provides a detailed introduction to the materials required for the preparation of In2O3 nanowires and outlines the process for their synthesis. It also describes the techniques employed to investigate the morphology and composition of the gas-sensitive materials, as well as to test their gas-sensing characters.

2.1. Materials

Indium nitrate hydrate (In(NO3)3·4.5H2O) and N,N−dimethylformamide (DMF) were purchased from Sinopharm Chemical Reagent Co., Ltd., Beijing, China. PVP (Mw = 1,300,000) was purchased from Aladdin Biochemical Technology Co., Ltd., Shanghai, China.

2.2. Synthesis of In2O3 Nanowires

A total of five types of In2O3 nanowires were prepared as sensing materials in this work, all of which were synthetized by the electrospinning method. The synthesis process of each sample is described as follows.
First, in the preparation of the precursor solution for electrospinning, 0.3 g of In(NO3)3·4.5H2O was added to 3 mL of DMF and stirred thoroughly until a transparent solution was formed. Then, 0.8 g of PVP was gradually introduced into the solution under continuous stirring. After 10 h of stirring, the PVP was completely dissolved, resulting in a colorless, viscous, and transparent precursor solution, which was used for the subsequent synthesis of In2O3 nanowires. The obtained transparent precursor solution was then loaded into a 10 mL disposable syringe equipped with a specialized electrospinning needle. Following that, the syringe was securely mounted onto the electrospinning machine. The needle was connected to a DC power supply set at 11 kV, and the feed rate of the syringe was adjusted to 0.3 mL/h. The distance between the needle tip and the drum collector was fixed at 14 cm. Under controlled environmental conditions (humidity: 30–40% and temperature: 30 °C), electrospinning was carried out for 3–4 h, and a uniform white film was covered on the tin foil. Finally, the film was carefully peeled off using tweezers and transferred to a square ceramic boat for further processing.
Finally, the rectangular ceramic boat was placed into a muffle furnace for calcination. This study primarily investigated the effects of different calcination conditions on In2O3 materials. During this process, various In2O3 nanowires were obtained by altering the heating rate and annealing temperature. For instance, the muffle furnace was set to heat at a rate of 3 °C/min, reaching a temperature of 500 °C, and calcined for 2 h to obtain a pale yellow In2O3 powder sample, labeled as In2O3−3 °C/min−500 °C. Following this method, four other samples were prepared and labeled as In2O3−1 °C/min−500 °C, In2O3−5 °C/min−500 °C, In2O3−3 °C/min−400 °C, and In2O3−3 °C/min−600 °C, respectively.

2.3. Characterization

X-ray powder diffraction (XRD) data were obtained with the D2 PHASER X-ray diffractometer (AXS, Bruker, Karlsruhe, Germany) with high-intensity Cu K radiation in the range of 9–90°. Field emission scanning electron microscopy (FESEM) images were obtained on a ZEISS GX1669 microscope (Carl Zeiss AG, Oberkochen, Germany). X-ray photoelectron spectroscopy (XPS) data were recorded on a Escalab 250Xi system (Thermo Fisher Scientific, Waltham, MA, USA).

2.4. Gas Sensor Fabrication and Test

The fabrication and measurement of the gas sensor in this work are consistent with our previous studies [43,44]. A tubular device was employed to manufacture the gas sensor, the main structure of which was an alumina ceramic tube (4 mm in length, 1.2 mm in outer diameter, and 0.8 mm in inner diameter). This tube was symmetrically wound with a pair of annular Au electrodes on both sides. A Pt wire was drawn from each side of every Au electrode. Initially, approximately 3–4 mg of In2O3 sample was mixed with deionized water at a 3:1 mass ratio and ground into a paste using an agate mortar. Subsequently, the prepared paste was evenly applied many times in a small amount onto the Al2O3 ceramic tube, and the tube with sensing material on the surface was baked under infrared light for 20 min to form a uniform film on its surface. Following this, the ceramic tube coated with the sensing material film was sintered at 200 °C for 2 h to eliminate all traces of moisture and to further solidify the sensing material on the ceramic tube surface. After cooling to room temperature, a Ni−Cr alloy coil was placed into the cavity of the ceramic tube to serve as the heat source for the sensor. Finally, the ceramic tube and alloy coil were soldered to the sensor socket accordingly, completing the gas sensor fabrication process.
The gas-sensing performance of the fabricated gas sensors was evaluated in a laboratory environment (30% RH, 25 °C) using a commercial gas-sensing test platform (Weisheng Electronics Technology Co., Ltd., model WS−30A, Zhengzhou, China, test chamber volume: 18 L). The amount of liquid VOCs in the sample was calculated according to Equation (1), where C represents the concentration of the analyte (ppm), φ denotes the purity of the liquid (%), ρ is the density of the liquid (g/cm3), V1 is the volume of the liquid (μL), V2 is the volume of the test chamber (L), and M is the molecular weight of the liquid (g/mol) [45].
C = 22.4 × φ × ρ × V 1 M × V 2 × 1000
First, the electrical current flowing through the heating wire was adjusted to ensure that the device operated at the pre-determined temperature. Next, a micro-syringe was employed to precisely extract the calculated volume of TMA liquid, which was then injected into the evaporator. After sealing the lid and turning on the fan, a TMA gas atmosphere with a specific concentration was formed once the liquid had completely evaporated and uniformly dispersed. At the same time, the testing software automatically recorded the resistance changes of the device. Finally, after the resistance stabilized for a few minutes, the seal was opened to release any remaining gas. Throughout the test process, the ambient temperature and relative humidity were maintained at approximately 25 °C and 30%, respectively.
The response of the sensor is defined as S = Ra/Rg (Ra and Rg are the resistances of the sensor when it is stable in air and TMA, respectively) and the response time (τres.) and recovery time (τrec.) are defined as the time required for the resistance of the sensor to change by 90% in TMA and air, respectively.
As shown in Figure S1, the experimental device for detecting the spoilage of L. crocea was a manually built test system. Before the test began, the sensor was first connected to a multimeter (Fluke 8846a) to monitor its real-time resistance changes. The multimeter was connected to a computer to display and record the response/recovery curve of the sensor. The heating wire of the sensor was connected to the power supply (GPD-4303S), and the working temperature of the sensor was adjusted by controlling the current passing through the heating wire. In one test, the Ra of the sensor was first recorded, and the sensor was then placed in a sealed container storing L. crocea when Ra was stabilized for a period of time and its resistance changes had been recorded. After the test was completed, the sensor was removed from the container and it began to recover. The above steps were repeated and the TMA concentration of L. crocea was monitored every 24 h.

3. Results and Discussion

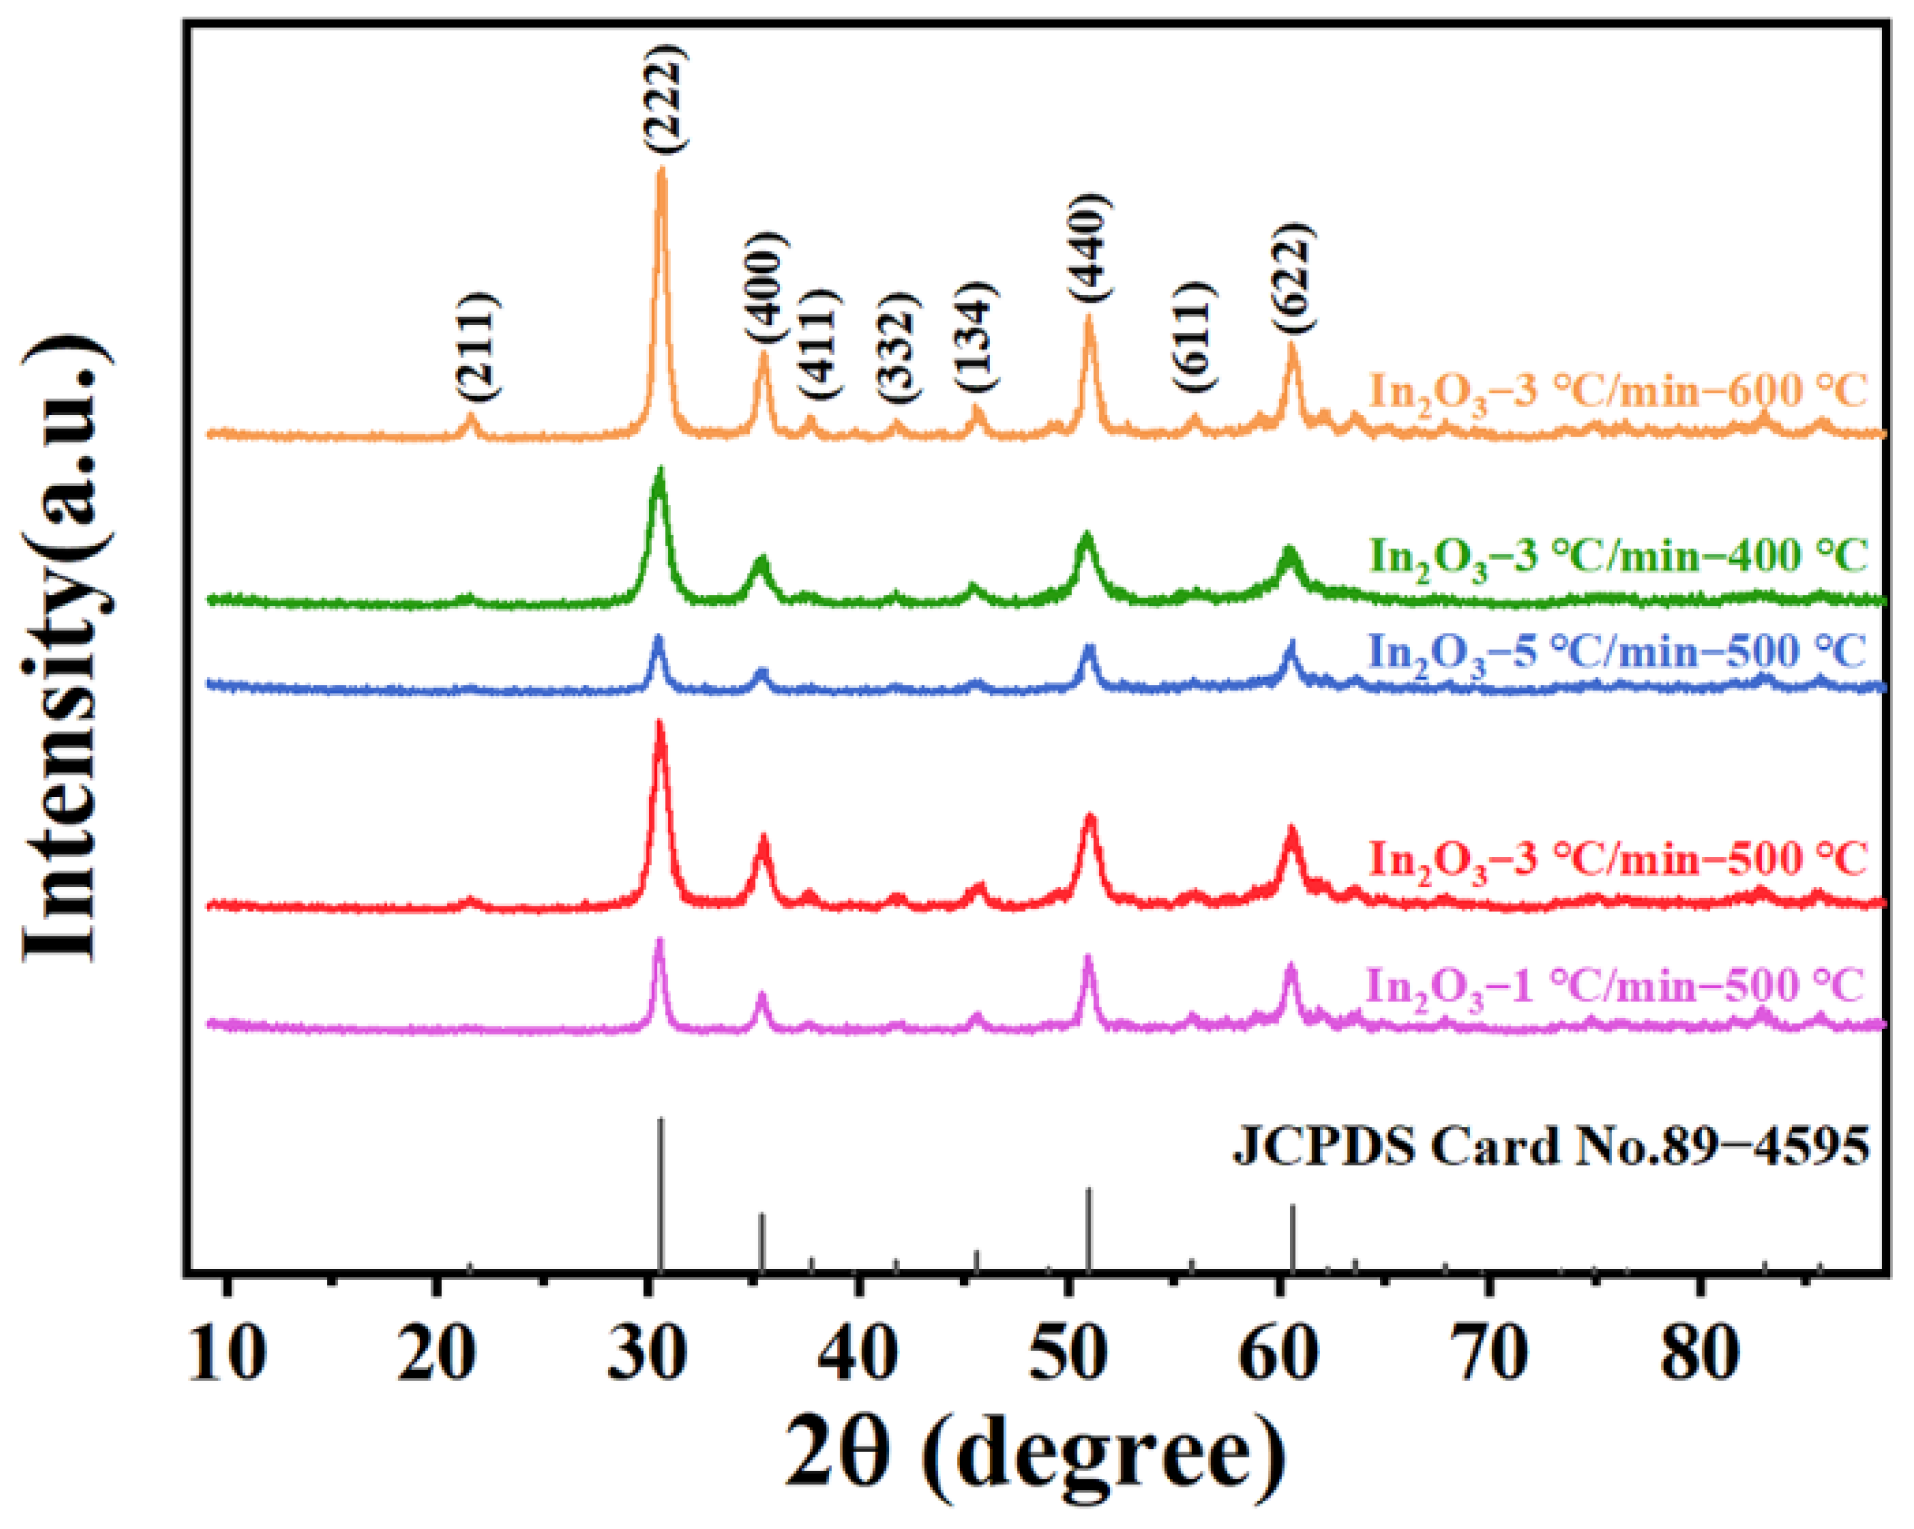
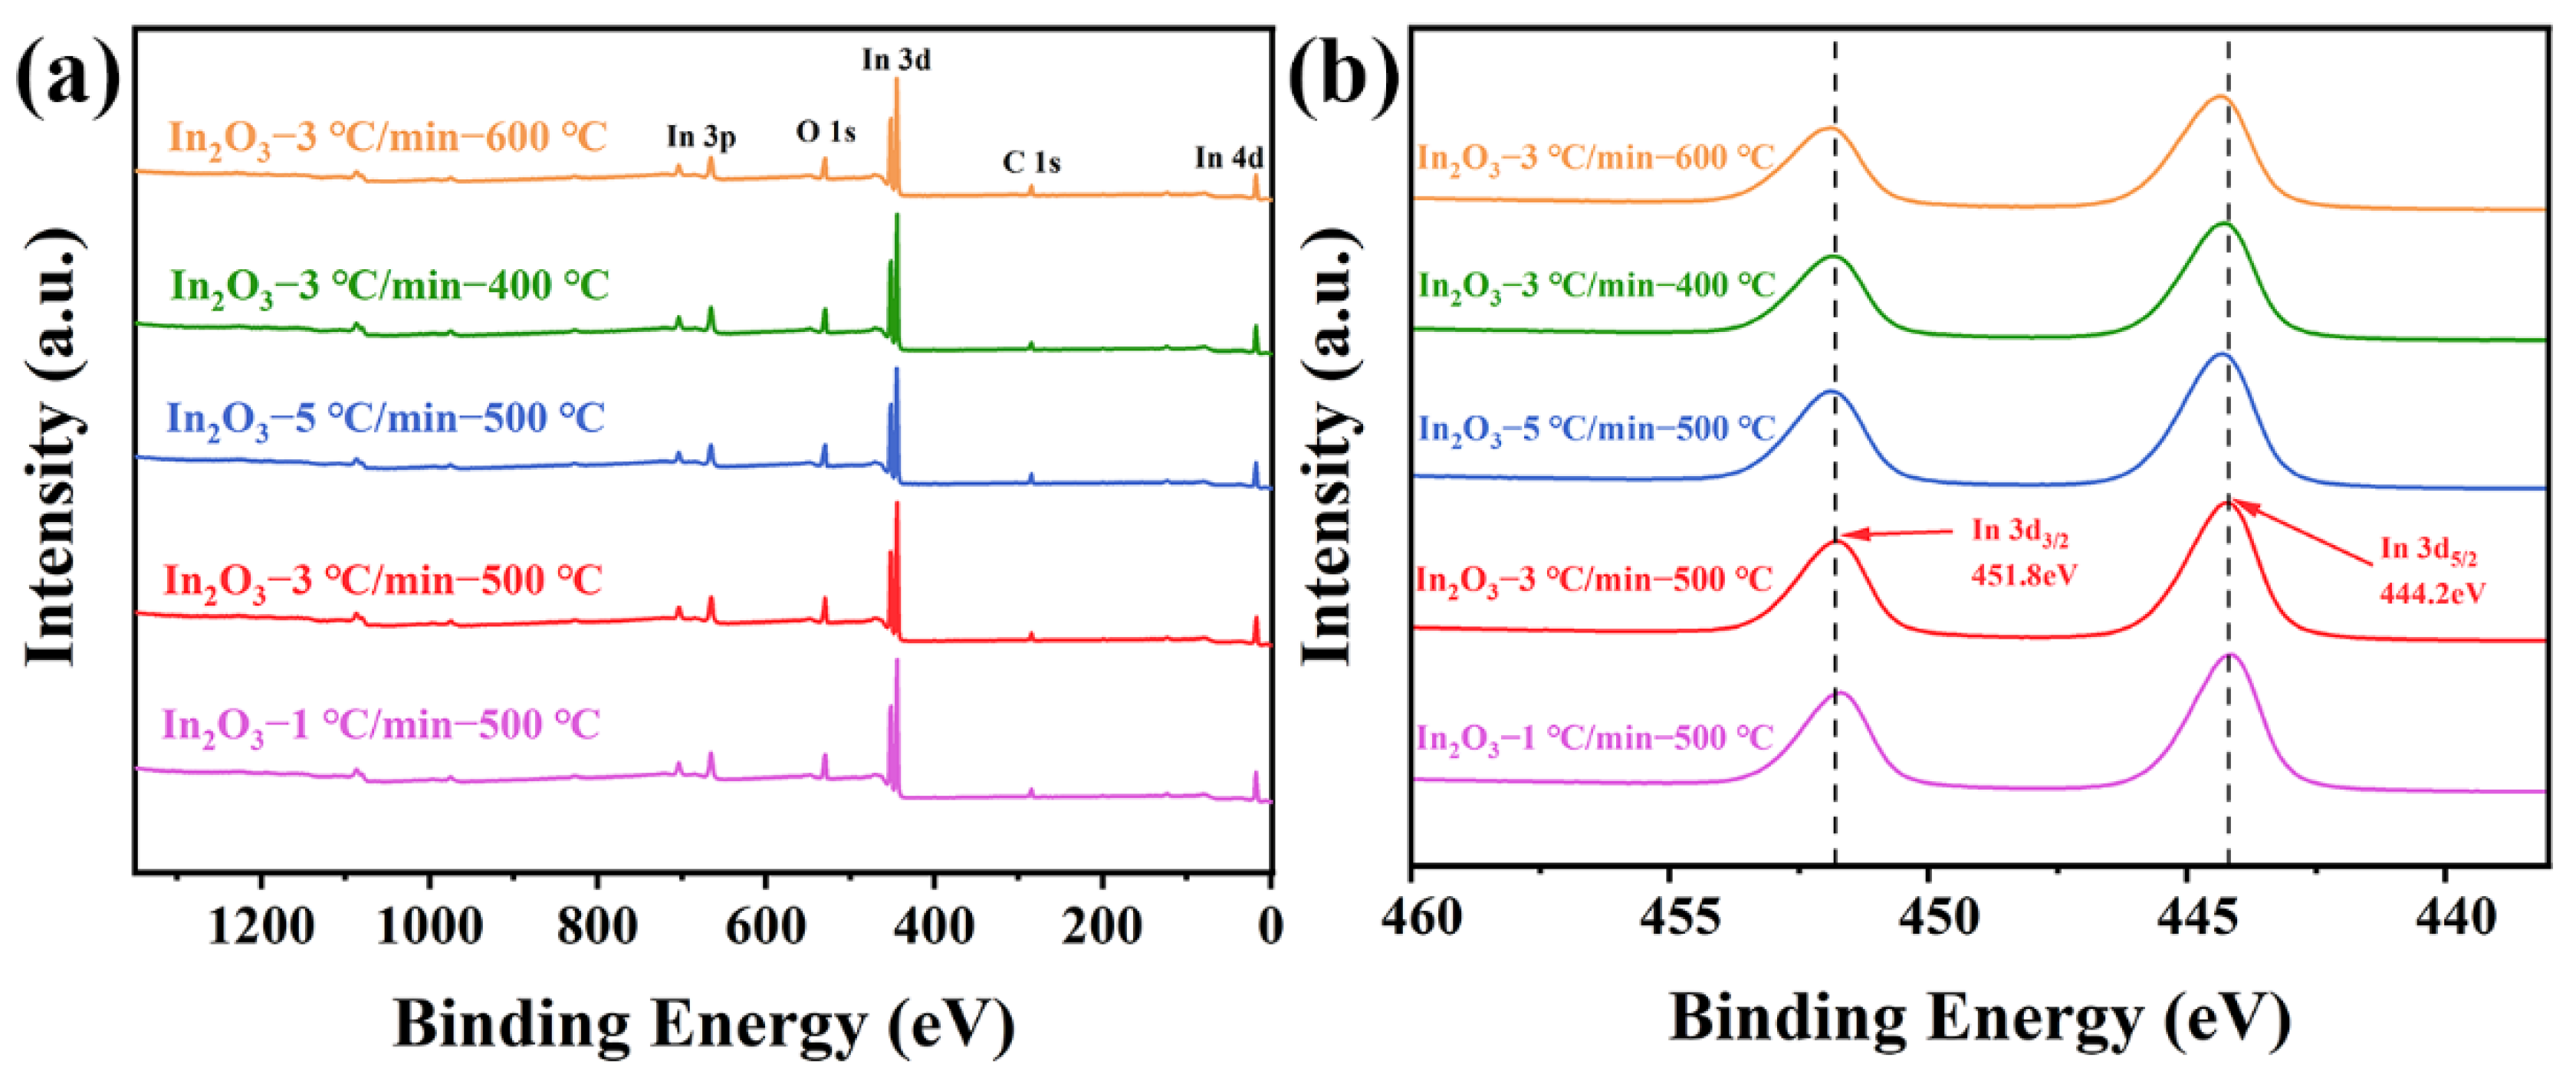
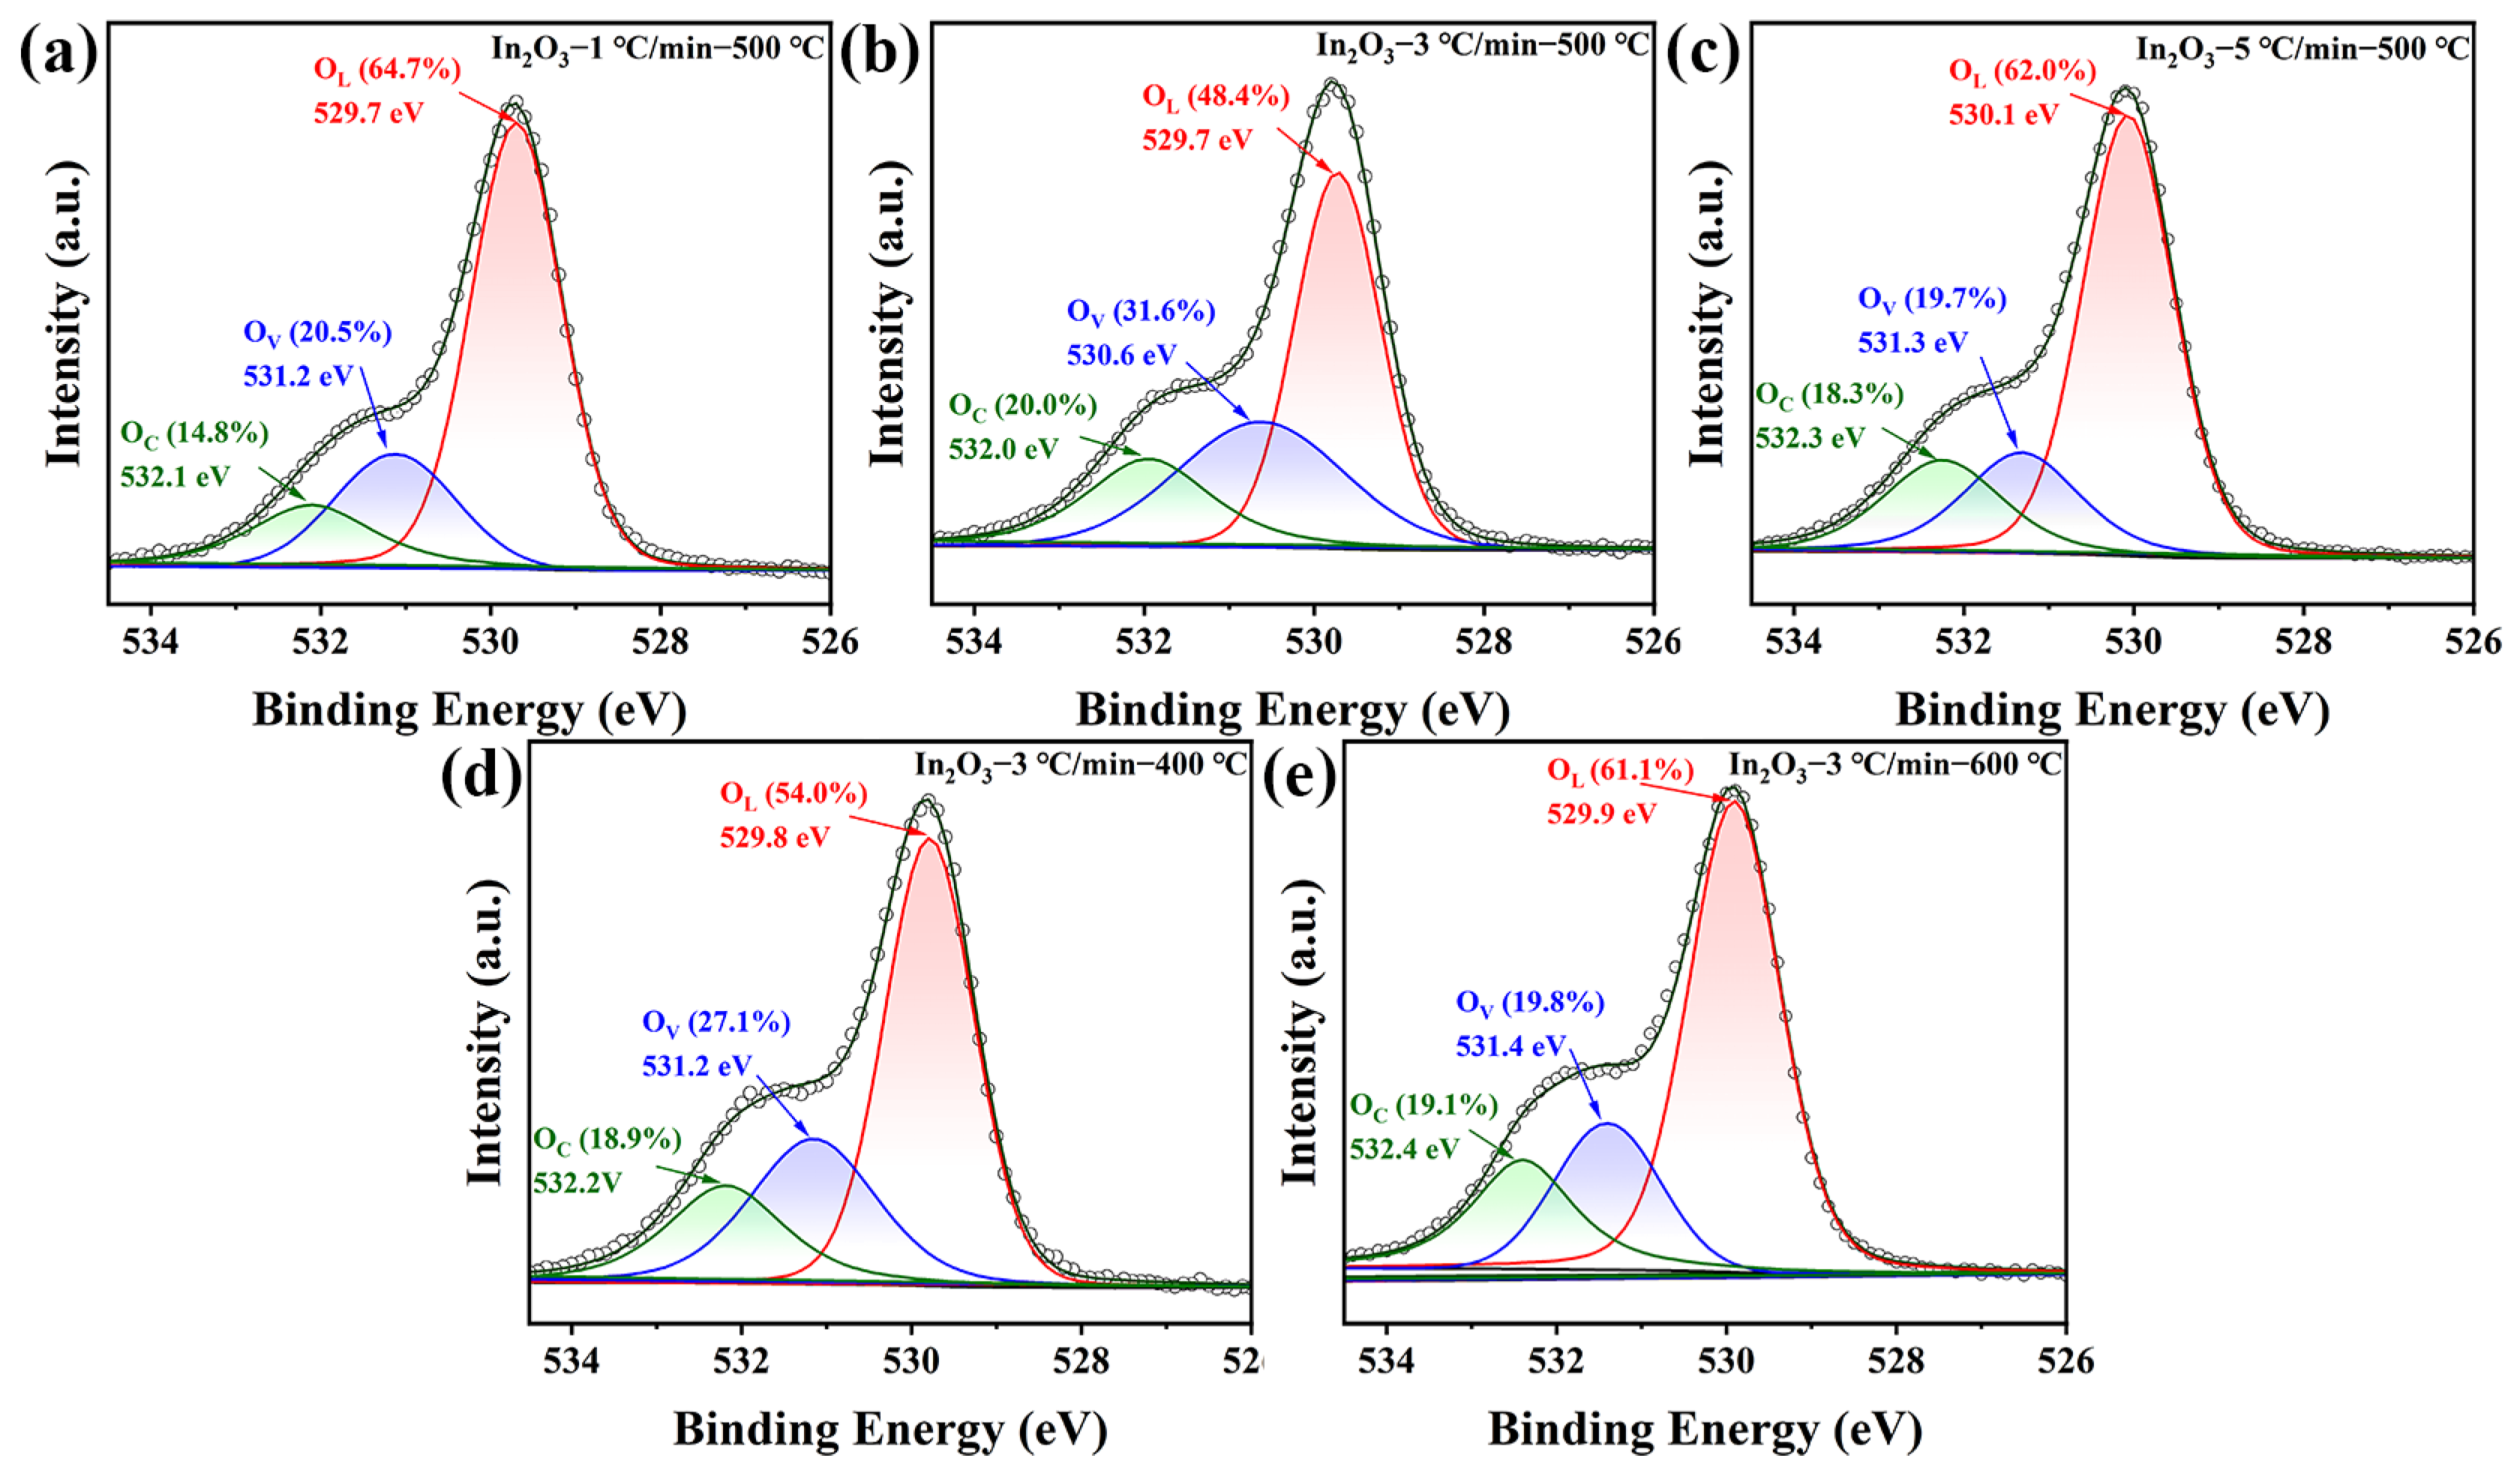
3.1. Structural and Morphological Features

To confirm the material composition and crystallinity of the synthesized In2O3 samples, XRD analysis is conducted on the samples. Figure 1 displays the XRD diffraction patterns of the samples at different heating rates and annealing temperatures. The diffraction peaks of all samples are generally consistent with those of In2O3 (JCPDS Card No. 89−4595), and no diffraction peaks related to other impurities are detected. This indicates that the synthesized samples are free of any impurities and consist of pure In2O3.
It has been reported that differences in heating rate and annealing temperature can affect the crystallinity and grain size of samples [46,47]. As shown in Figure 1, when the heating rate remains constant, the diffraction peak intensity of the samples gradually increases with a higher annealing temperature. When the annealing temperature remains constant, the diffraction peak intensity of the samples initially rises and then falls with an increase in the heating rate. Additionally, the average grain size of each sample is calculated using the Scherrer Equation, D = 0.9 λ / β cos θ , where λ is the X-ray wavelength of CuKα (1.5418 Å), θ is the Bragg angle, and β is the full width at the half maximum of a peak [48]. These results are summarized in Table 1, which shows that with a constant heating rate, the grain size increases with an increase in the annealing temperature, and when the annealing temperature remains constant, the grain size initially increases and then decreases as the heating rate increases.
The shape and structure of a sample can significantly influence its gas-sensing properties. Therefore, the microscopic structure of the samples is characterized using SEM. Figure 2 displays the SEM images of the five In2O3 nanowires under different heat treatment conditions. Overall, the In2O3 nanowires are radially uniform with axial lengths exceeding 10 μm, although there are slight variations in radial size among different nanowires. The formation of these In2O3 nanowires is mainly caused by the decomposition of polymers and the shrinkage of fibers during the calcination process. The precursor solution generates nanowires containing In3+/PVP through electrospinning. Under high-temperature calcination, PVP gradually decomposes and In3+ reacts with oxygen to crystallize and aggregate into In2O3 nanoparticles arranged along the fiber axis. Therefore, the sample ultimately forms a nanowire structure connected by In2O3 nanoparticles. As illustrated in Figure 2a–i, the In2O3 nanowires are subjected to sintering at different heating rates while being annealed at a temperature of 500 °C. When the heating rate is slow (1 °C/min), the extended sintering time allows the grains enough time to absorb nearby unstable phases, leading to significant grain coarsening and a gradual increase in grain size. Therefore, the nanowire surfaces are rough and the structure is dense. As the heating rate increases (3 °C/min), PVP begins to gradually decompose and metal ions in the nanowires form smaller nanocrystals, resulting in a rougher nanowire surface with uniformly distributed grains. When the heating rate is further increased (5 °C/min), PVP reaches its decomposition temperature more rapidly, reducing the template’s constraint on fiber morphology and grain size, which leads to nanowires with larger grain sizes and denser surfaces.
As shown in Figure 2d–f, j–o, the samples are sintered at different annealing temperatures with a heating rate of 3 °C/min to obtain In2O3 nanowires. When the annealing temperature is low (400 °C), the surface of the nanowires is smooth, with only a few grains present. Combined with XRD analysis, it is understood that, at 400 °C, the sintering process primarily involves the thermal decomposition of PVP, with only a small amount of In2O3 grains forming. This results in a lower crystallinity and smaller grain sizes in the nanowires. As the annealing temperature increases (500 °C), the crystallinity of the nanowires improves, the grain size further increases, and the surface becomes rougher. When the annealing temperature is further increased (600 °C), the nanowire surface appears denser with larger grain sizes. This demonstrates that different heat treatment methods have an impact on the microstructure of In2O3 nanowires. Structurally, the In2O3−3 °C/min−500 °C nanowires have a rougher surface and smaller grain sizes, which provide greater advantages and potential in gas-sensing applications. In addition, Figure S2 shows the surface morphology of the sensing device coated with In2O3−3 °C/min−500 °C nanowires after multiple gas-sensing tests. In Figure S2a, In2O3 nanowires uniformly cover the outer surface of the ceramic tube. Figure S2b–d show enlarged views of the In2O3 nanowires. It is noticed that there are many fractures among them, which may be due to external pressure on the long nanowires during the grinding process. However, most nanowires still maintain their one-dimensional structure and rough surface, demonstrating an excellent structural stability which is free from the influence of gas-sensing tests.
To delve deeper into the relationship between the internal characteristics of the materials and their gas-sensing properties, XPS is utilized to characterize the chemical states of the surface elements in the synthesized In2O3 nanowires. All peak positions are calibrated based on the standard C 1s peak (284.8 eV). Figure 3a displays the full-scan XPS spectra of the five samples, showing that the peaks and their positions are essentially the same across the samples, and all orbital peaks can be clearly identified. As shown in Figure 3b, two separate peaks are observed in the In 3d spectrum, corresponding to In3d3/2 and In3d5/2. Although the peak positions of each set of In 3d peaks vary due to differences in the internal chemical environments of the substances, the splitting energy between the two sets of peaks remains constant at 7.6 eV, which is consistent with the measured In 3d splitting energy of the samples.
Generally, the state of oxygen in nanowires affects the material’s ability to adsorb and ionize oxygen, thereby influencing gas detection performance. To analyze the state of oxygen in the In2O3 nanowires, the O 1s core level spectra of the samples are divided into three Gaussian components. As shown in Figure 4a–e, the rightmost peak (red) is identified as lattice oxygen (OL), which is a fundamental part of the crystal. Generally, OL oxygen ions within the lattice are very stable and do not contribute to the gas-sensing properties of the material. The middle peak (purple) and the leftmost peak (green) are referred to as defect oxygen (OV) and adsorbed oxygen (OC), respectively. It is generally believed that the more defects, active sites, and surface adsorbed oxygen there are, the more favorable this is for gas adsorption reactions on the surface of the gas-sensing material, leading to higher response values [49,50]. From the summary in Table 2, it is clear that the beneficial components for gas-sensing performance (OV and OC) in the In2O3−3 °C/min−500 °C nanowires account for 51.6% of all oxygen species, which enhances the potential of In2O3−3 °C/min−500 °C nanowires as high-performance gas-sensing materials.

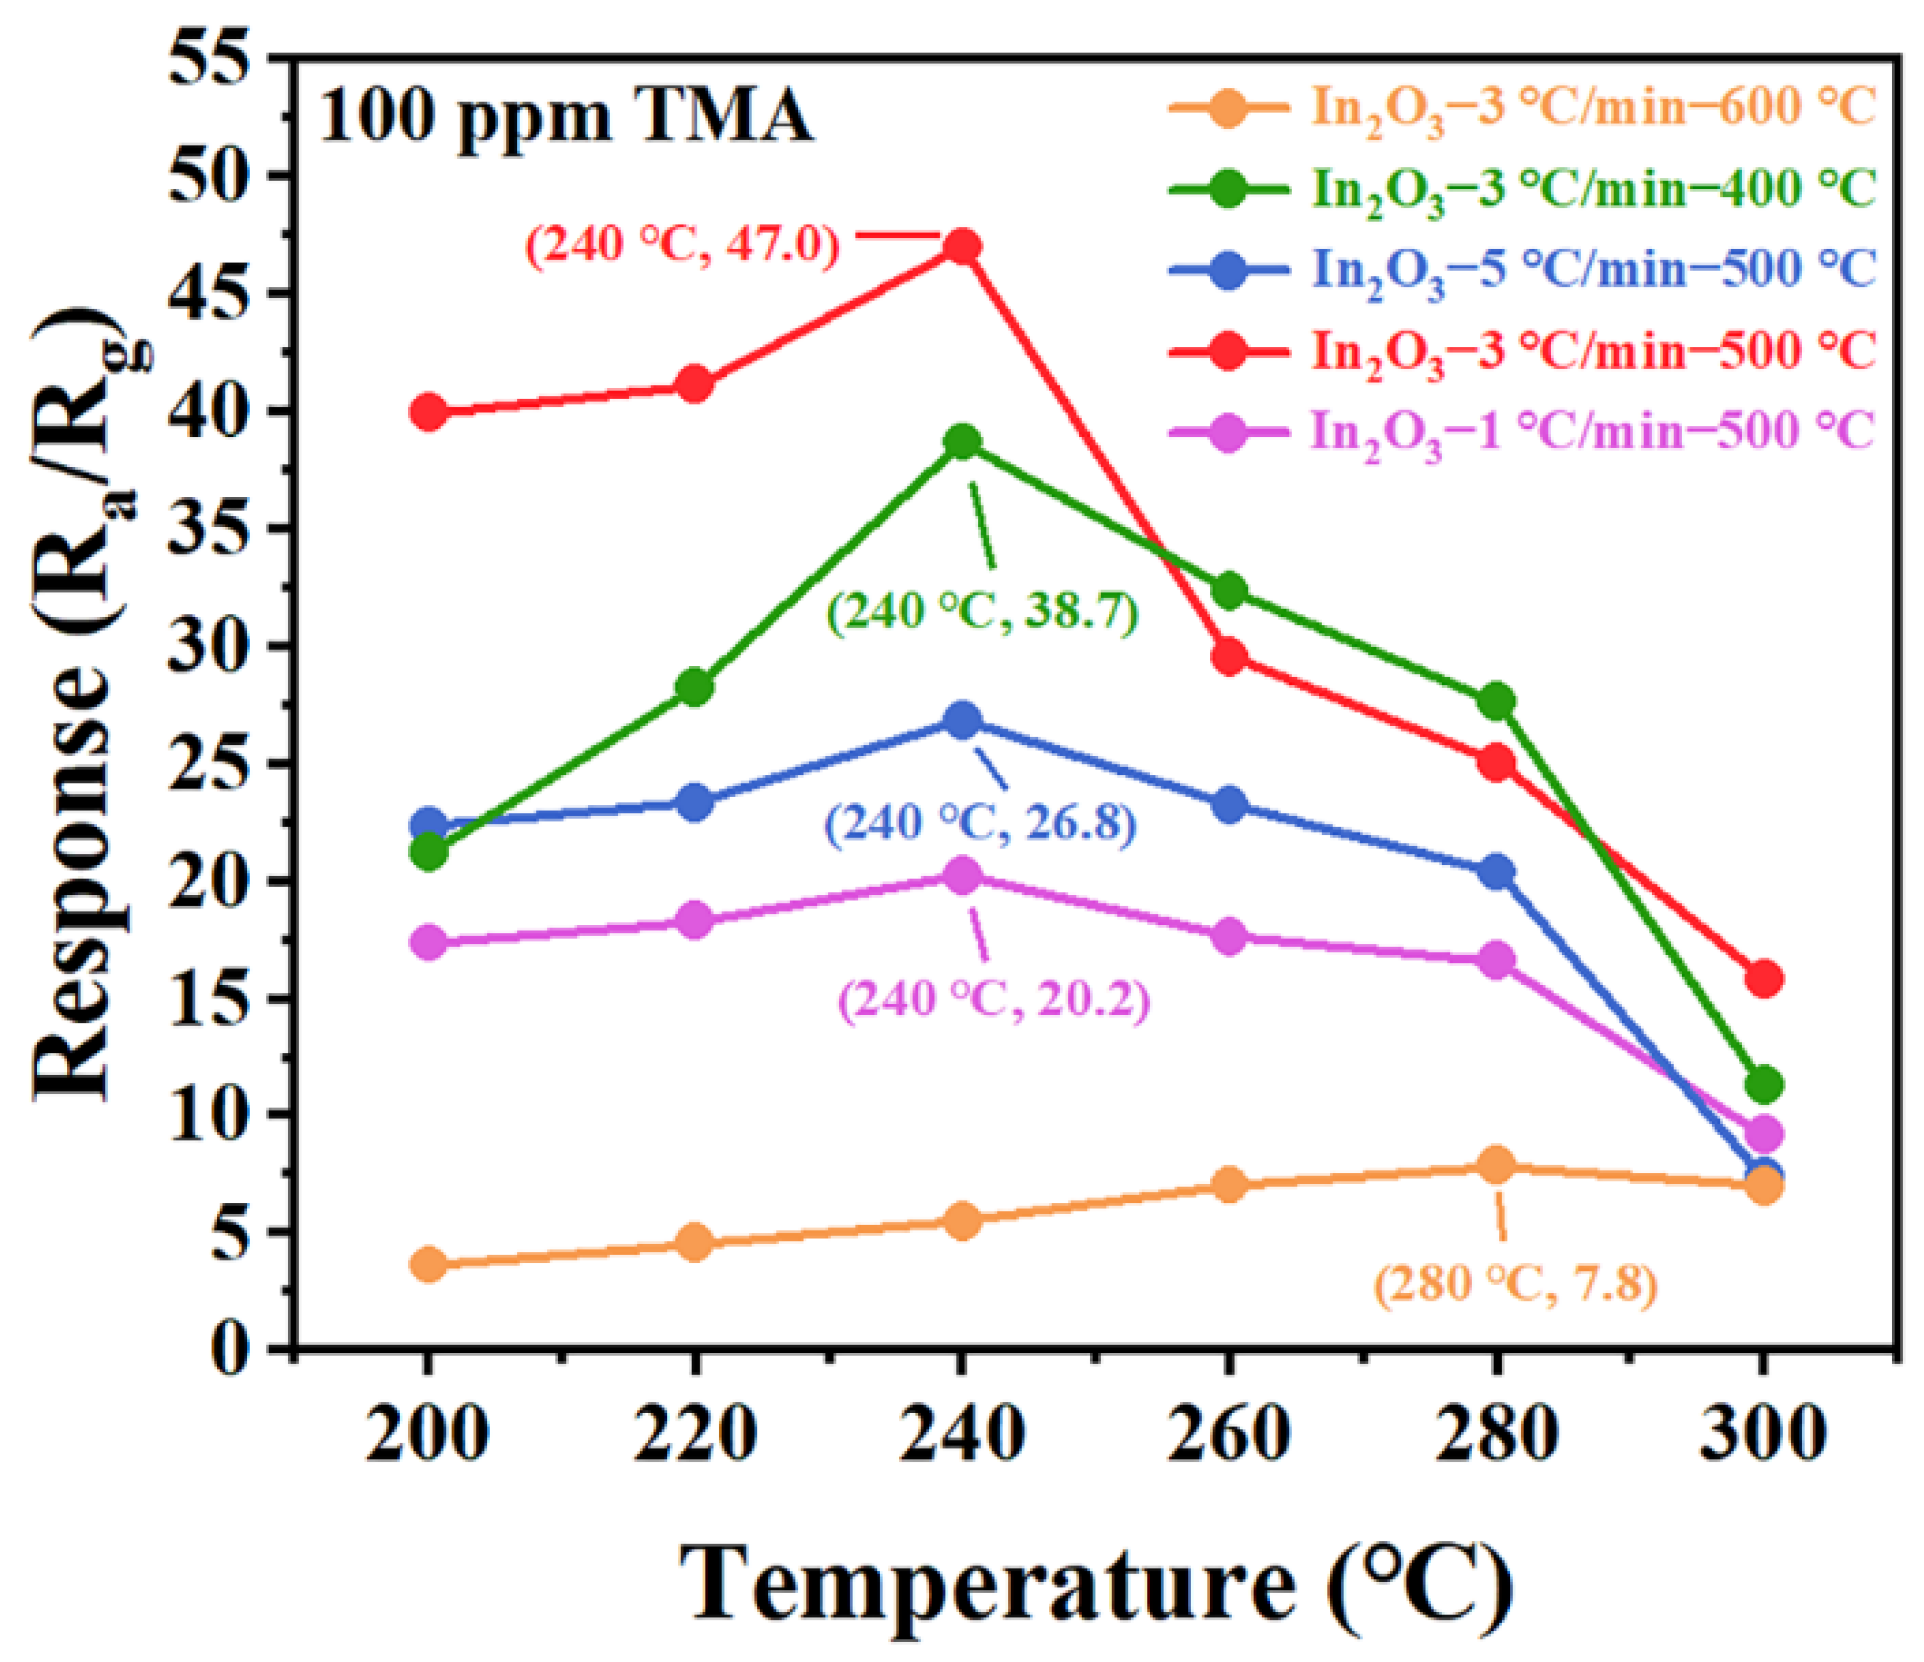
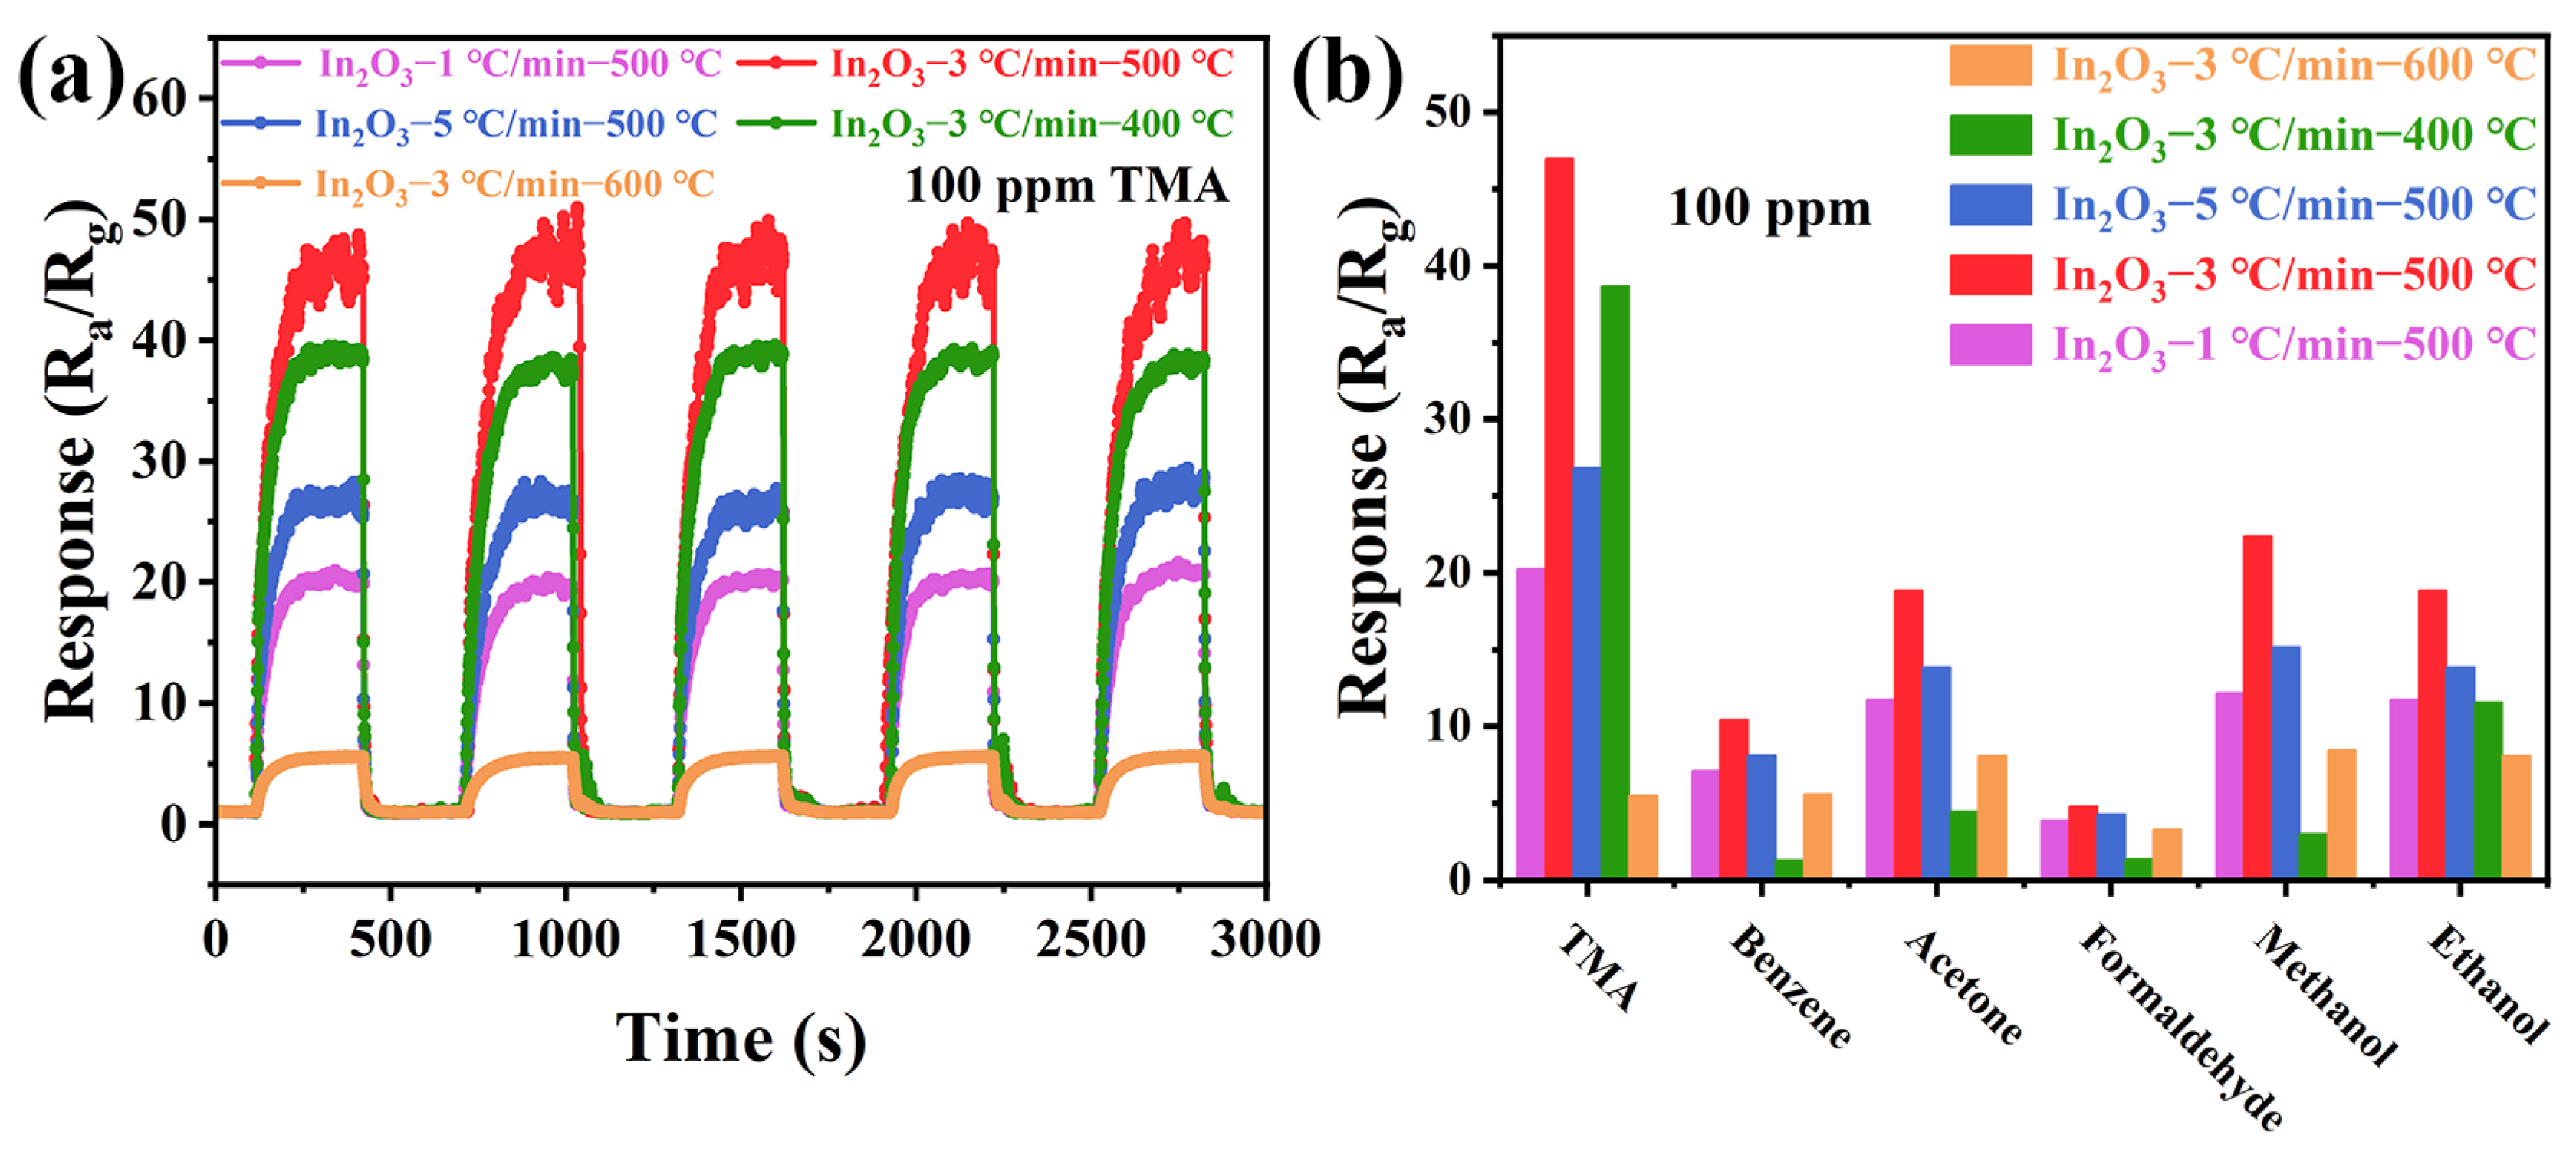
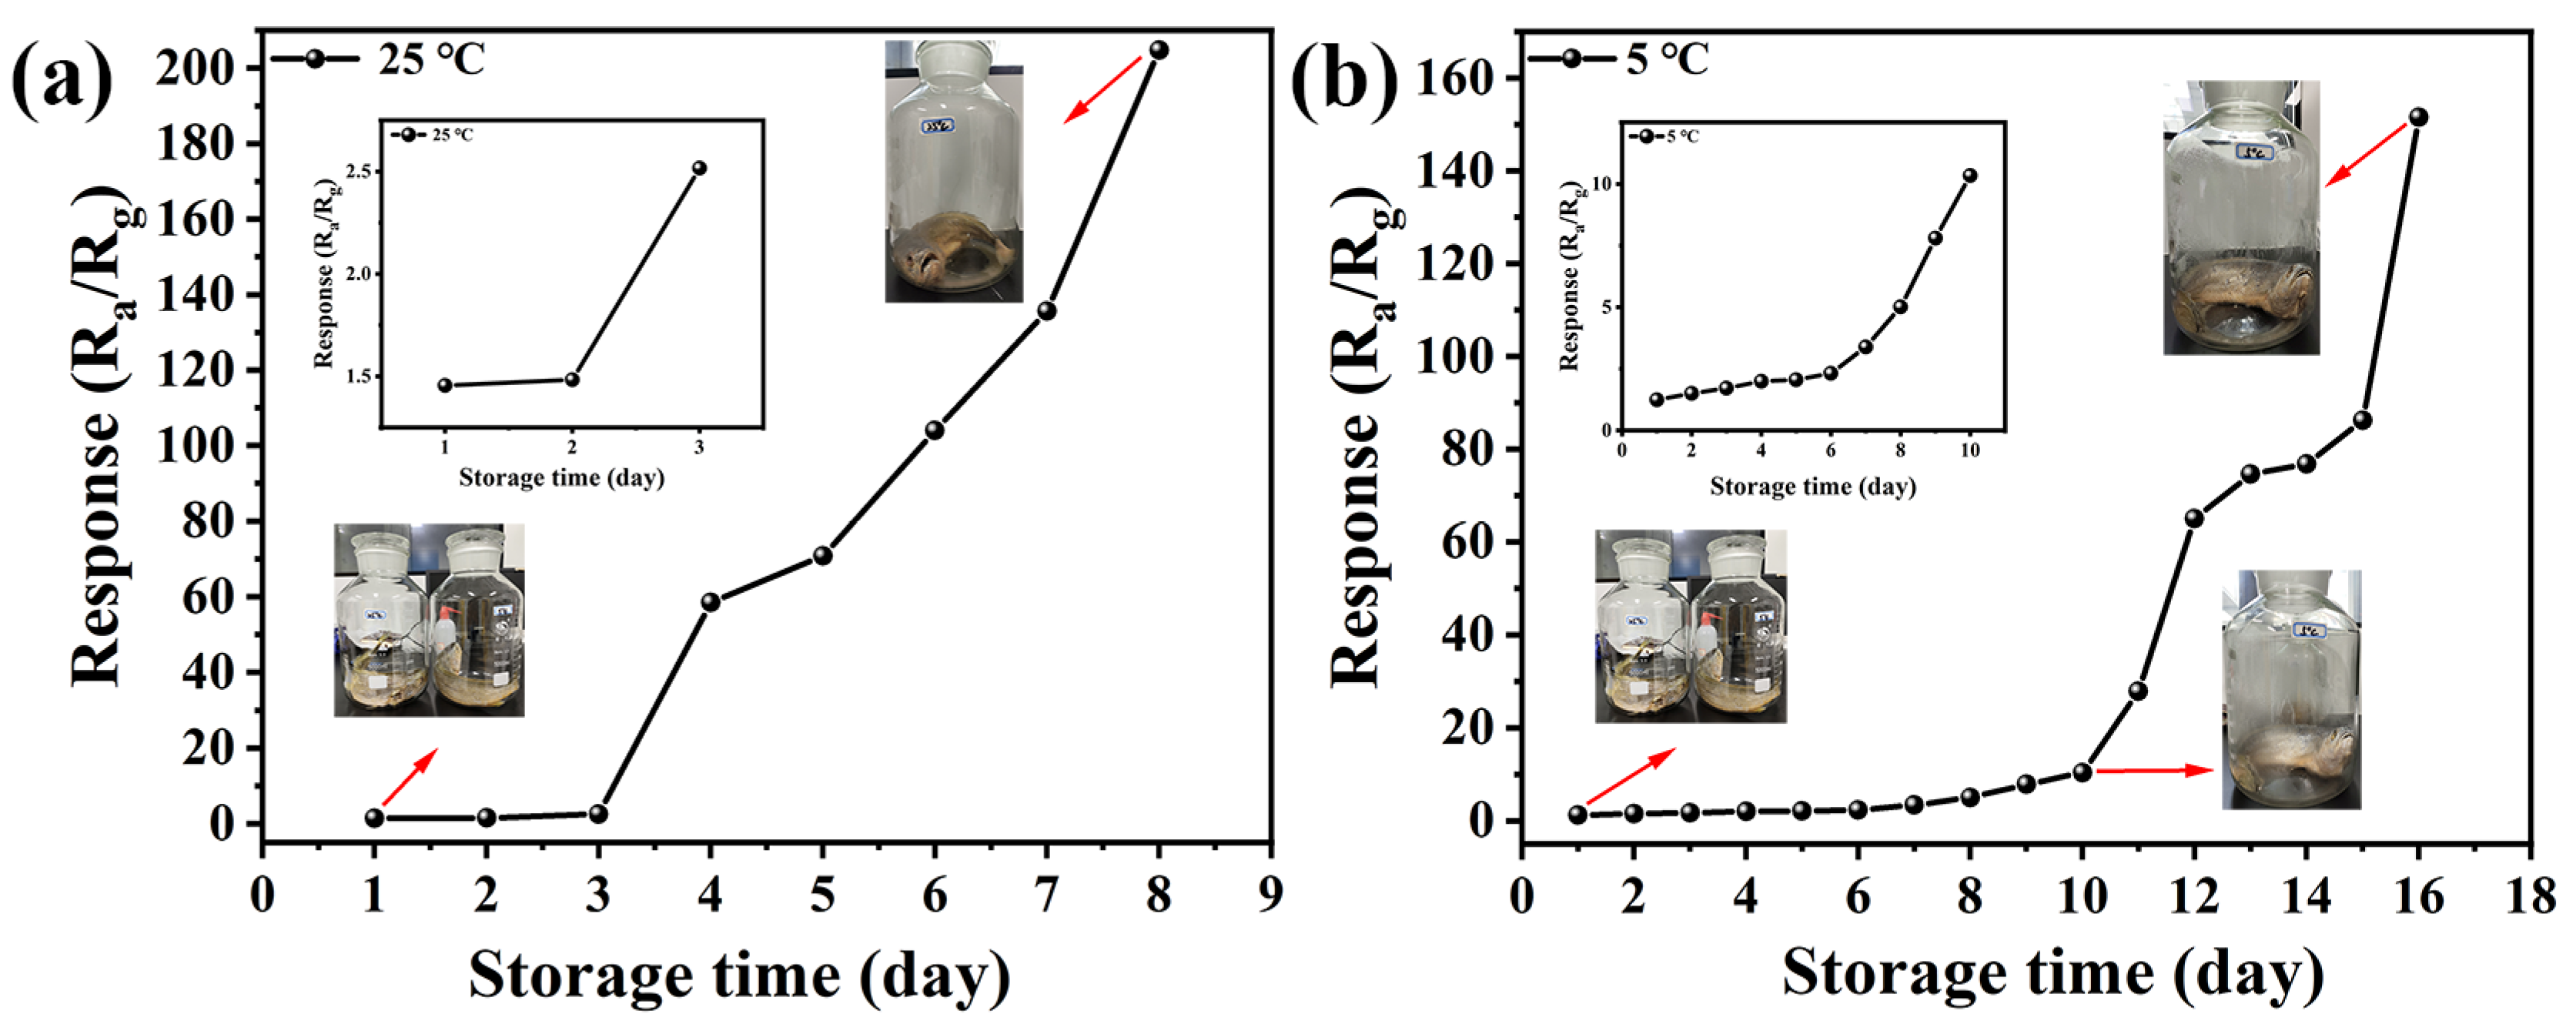
3.2. Gas-Sensing Properties

Generally, the sensing characteristics of MOS gas sensors are influenced by the operating temperature of the sensor. As the temperature increases, the gas molecules overcome the activation energy barrier of the surface reaction and react with the oxygen species on the surface of the material, and the sensor response increases. When the optimal operating temperature is reached, the gas resolution rate is greater than the adsorption rate, and the response of the gas sensor decreases. It is essential to first determine the optimal operating temperature for the sensor. Figure 5 illustrates the dynamic response of the sensor to 100 ppm TMA at different temperatures ranging from 200 °C to 300 °C. Overall, the responses of all five sensors initially increase and then decrease, which is consistent with the characteristics of MOS-type gas sensors. Evidently, the In2O3−3 °C/min−500 °C gas sensor achieves a response value of 47 at an operating temperature of 240 °C, which is higher than the responses of the other four sensors. This phenomenon indicates that a smaller grain size contributes to an improved response while reducing the optimal operating temperature of the sensor, which is generally consistent with the previous assumptions. The In2O3−3 °C/min−500 °C gas sensor exhibits a notably superior sensing performance for TMA.
Response/recovery characteristics are also crucial metrics for evaluating the performance of gas sensors, particularly in real-world applications where rapid detection is essential. Figure 6a–e show the response and recovery curves of the five different sensors when exposed to 100 ppm TMA at their optimal operating temperatures. Overall, the sensors exhibit a relatively fast response and recovery speed. Among them, the In2O3−3 °C/min−500 °C and In2O3−3 °C/min−400 °C gas sensors have the shortest response times, reaching 90% of the signal change within just 6 s. This rapid response can be attributed to the sensors’ optimized surface morphology and enhanced active sites, which promote the rapid adsorption of gases. The response time is the same for both sensors, but they have slightly different recovery times: the In2O3−3 °C/min−500 °C gas sensor recovers in 37 s, while the In2O3−3 °C/min−400 °C gas sensor takes 39 s. This difference suggests that a higher annealing temperature may promote more efficient desorption due to increased crystallinity and reduced defect-related capture sites. The test results indicate that different heat treatment methods can directly influence the adsorption and desorption rates of the sensing material to gas. These findings reveal the importance of precise heat treatment in improving the sensitivity of gas sensors.
Figure 7a–e illustrate the response/recovery characteristics of the sensors with different concentrations of TMA at their optimal operating temperatures. The responses of the five different sensors increase with a rising concentration of TMA, indicating that the sensors possess a good recognition capability for different concentrations of TMA. Among them, the five different sensors still exhibit a certain response to low concentrations of TMA (1 ppm). For instance, the In2O3−3 °C/min−500 °C sensor can achieve a response value of 2.64 to 1 ppm of TMA. Figure 7f displays the linear fitting of the response−concentration curves for the five sensors. According to the slope of the fitted curve, the In2O3−3 °C/min−500 °C gas sensor exhibits a better sensitivity. Additionally, the theoretical LOD of the sensor can be calculated using the following equation: RMSnoise (ppm−1) = (R2s/(N − 1))1/2, LOD = 3 × RMS noise / Slope , where R s 2 and RMS noise are the quadratic sum of the regular residual and the root mean squared deviation of the baseline, respectively [51,52]. The detailed calculation process and a comparison of the five sensors can be found in Tables S1–S6 in the Supporting Information. The results demonstrate that the theoretical LOD of the In2O3−3 °C/min−500 °C gas sensor is approximately 0.0392 ppm. This low detection capability makes it particularly suitable for applications requiring high-precision TMA detection, such as fish freshness monitoring systems.
Figure 8a illustrates the repeatability of the five sensors through five cycles of response to 100 ppm TMA at their optimal operating conditions. The response/recovery curves of the sensors show almost no variation over the five cycles, indicating that the five sensors possess an excellent repeatability. Complementing the repeatability tests, a long-term stability test is conducted on the In 2O3−3 °C/min−500 °C gas sensor. As shown in Figure S3, the sensor is tested against 100 ppm TMA at its optimal operating temperature for 32 days. The results indicate that the sensor’s response value fluctuates within a range of no more than 2.85%, demonstrating that the In2O3−3 °C/min−500 °C gas sensor exhibits an excellent long-term stability. Selectivity is a decisive factor in determining whether a gas sensor can distinguish target analytes from complex environmental mixtures. Five different VOC gases (benzene, acetone, xylene, methanol, and ethanol) are selected as interfering gases to test the selectivity of the sensors. As shown in Figure 8b, the In2O3−3 °C/min−500 °C gas sensor exhibits the highest response to TMA, demonstrating significant selectivity. Therefore, the In2O3−3 °C/min−500 °C gas sensor has a good repeatability and selectivity, suggesting that it has significant potential for practical applications.
In addition, changes in humidity can have an impact on sensor performance. The dynamic resistance curve of the In2O3−3 °C/min−500 °C sensor under humidity is shown in Figure S4a–d. The sensor’s initial resistance in air (Ra) and response to TMA decrease as humidity increases (Figure S4e). Water molecules are physically adsorbed on the surface of the sensing material and react with oxygen ions on the surface of the material, reducing the thickness of the depletion layer and competing with the TMA for the adsorption site, resulting in a decrease in the resistance and response of the sensor.
In summary, the In2O3−3 °C/min−500 °C gas sensor exhibits an optimal performance in terms of sensing response, response/recovery characteristics, LOD, selectivity, and repeatability. As shown in Table 3, compared to other reported TMA gas sensors, the In2O3−3 °C/min−500 °C gas sensor demonstrates a higher response and faster response/recovery speed, indicating a greater potential for application in assessing fish freshness.
To assess the practical application potential of the In2O3−500 °C−3 °C/min nanowire-based gas sensor, response measurements are conducted on L. crocea (approximately 500 g) stored in hermetically sealed glass containers under different temperature conditions (5 °C refrigeration and 25 °C ambient storage). The results show that for L. crocea stored at both temperatures, the sensor response values show an increasing trend with storage duration, which corresponds well with the fish spoilage progression. It has been reported that the gas component released during the spoilage process of L. crocea is TMA molecules [3]. A TMA concentration exceeding 10 ppm is defined as the threshold for fish spoilage. Based on the concentration–response curve fitted in Figure 7f, the In2O3−500 °C−3 °C/min nanowire-based gas sensor exhibits the following concentration–response function: y = 0.84362x + 2.00512. Thus, at the TMA concentration of 10 ppm, the corresponding sensor response is calculated as 10.44. Figure 9a shows that when stored at a room temperature of 25 °C for 3 days, the response value of the sensor is much greater than 10.44, reaching 58.42. Combined with the appearance and pungent smell of the L. crocea, this indicates that the L. crocea has undergone significant spoilage. Figure 9b shows that when stored at 5 °C for 10 days, the response value of the sensor basically reaches 10.44. Based on the corresponding images, it can be seen that there is no obvious spoilage on the surface of the L. crocea at this time, but a fishy smell appears, indicating that the L. crocea is gradually deteriorating. When stored for 16 days, the response value of the sensor reaches as high as 151.58. According to the corresponding image, it can be seen that the L. crocea shows serious spoilage at this time. From the above experiments, it can be seen that gas sensors based on the In2O3−500 °C−3 °C/min gas sensor have good application prospects in detecting fish freshness.

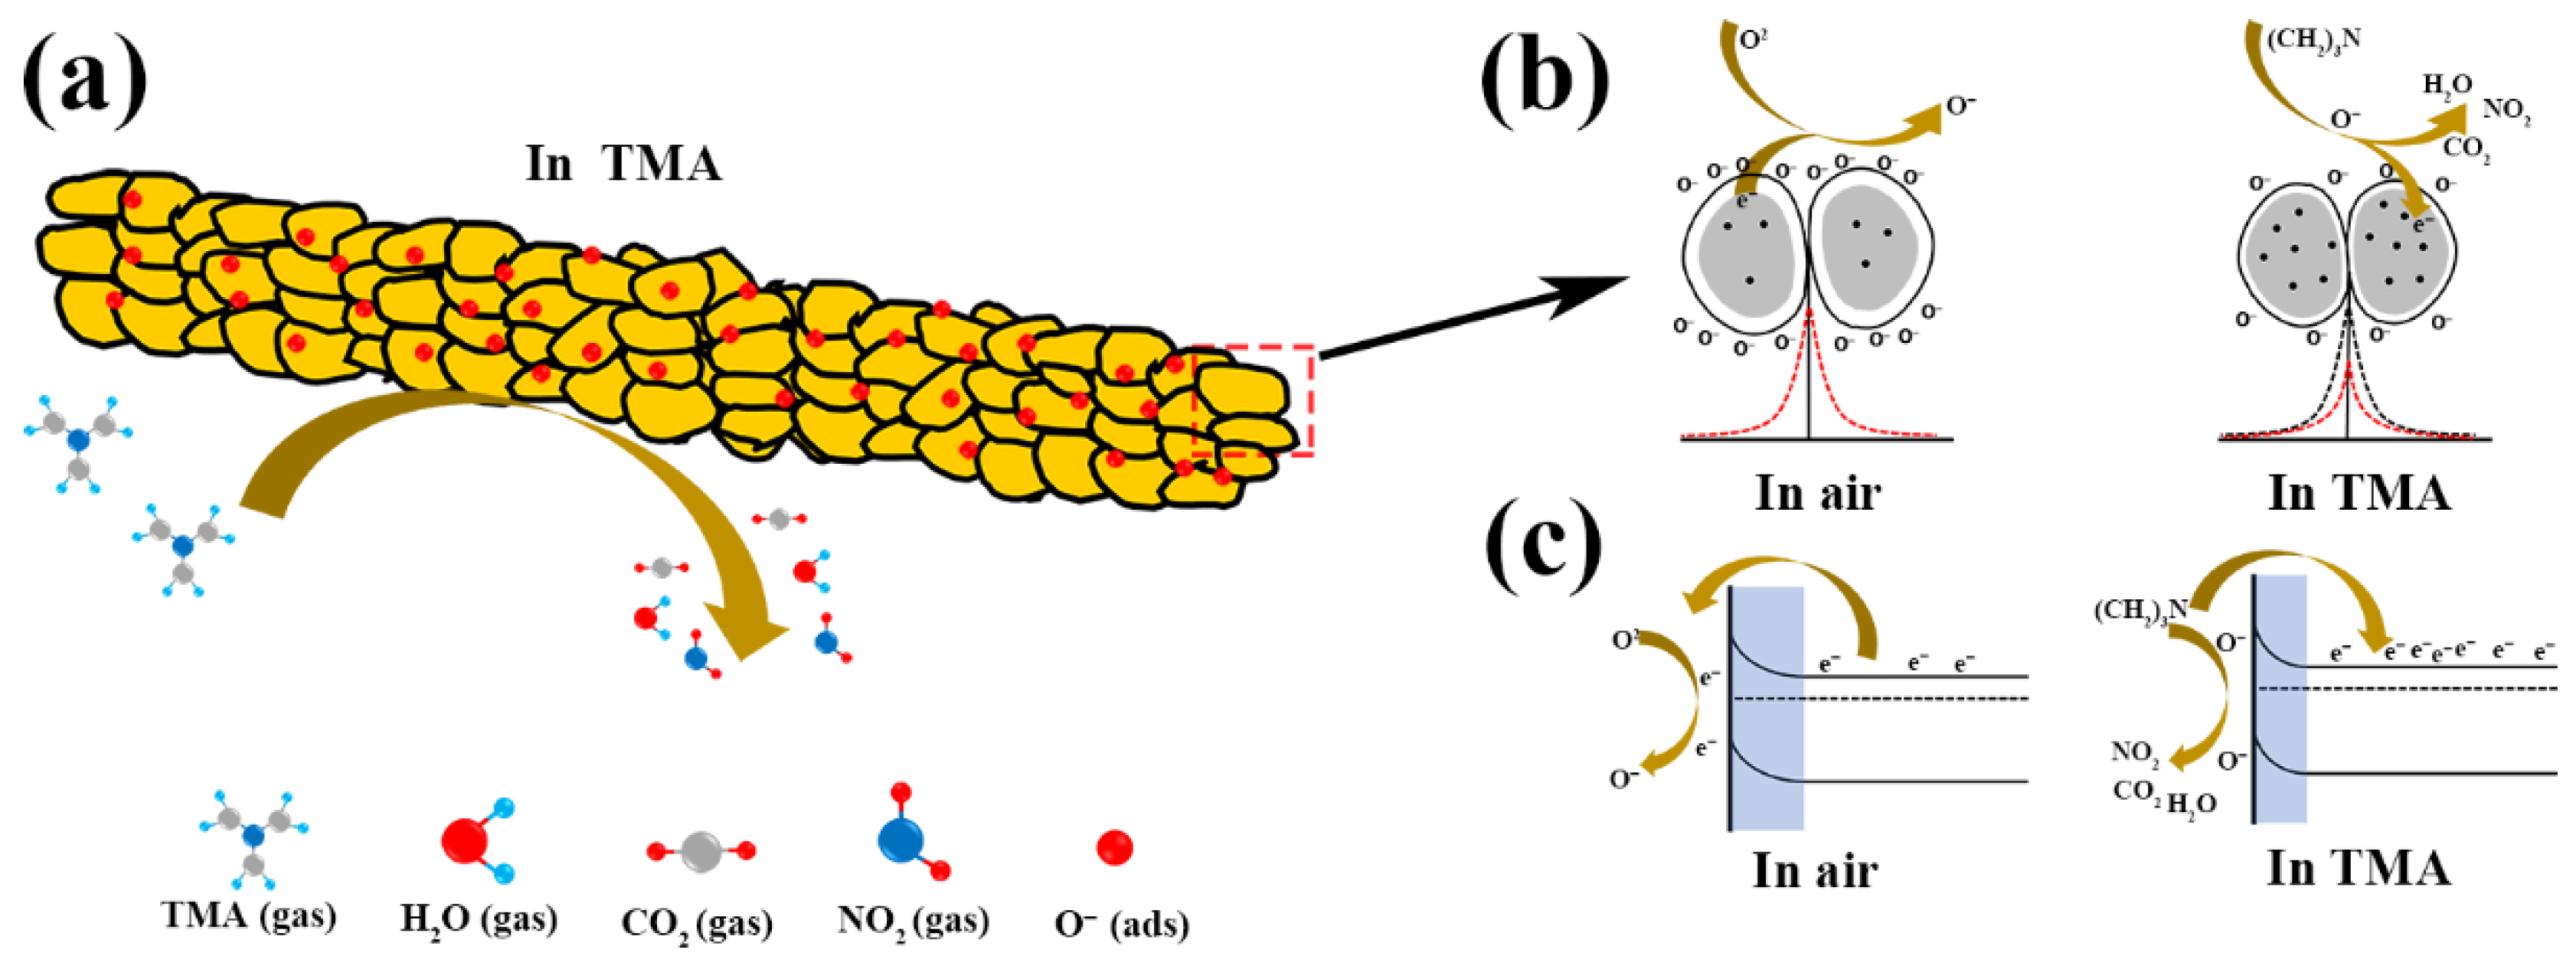
3.3. Gas-Sensing Mechanism

In2O3 is an n-type MOS material, and its mainstream gas-sensing mechanism is the electron depletion theory. This theory suggests that during the adsorption and desorption of gas molecules, the chemically adsorbed oxygen ions on the surface of the sensing material react with the gas molecules, causing a change in resistance [61,62]. When the sensor is exposed to air, oxygen molecules adsorb onto the material’s surface and capture electrons from the conduction band, forming different reactive oxygen species ( O 2 , O , and O 2 ) in different temperature ranges. The optimal operating temperature for the In2O3−3 °C/min−500 °C nanowires in this work is 240 °C, hence, the reaction is predominantly governed by Equation (4), as follows:
O 2 gas O 2 ads
O 2 ads + e O 2 ads   ( T < 150   ° C )
O 2 ads + e 2 O ads   ( 150   ° C < T < 400   ° C )
O ads + e O 2 ads   ( T > 400   ° C )
At this point, the process will lead to electron depletion in the space charge region and the formation of an electron depletion layer on the material’s surface, resulting in an increase in the material’s resistance. When the sensing material is exposed to a reducing gas (TMA) at its operating temperature, TMA molecules will undergo a redox reaction with the oxygen ions on the material, as shown in Equation (6). During this process, electrons will be released back into the conduction band of In2O3, which reduces the width of the electron depletion layer and lowers the resistance. The process described above is illustrated in Figure 10 a–c.
2 ( CH 3 ) 3 N +   25 O 9 H 2 O + 6 C O 2   + 2 N O 2   + 25 e
In2O3-based materials are widely used for NO2 detection, but low-temperature or even room-temperature detection is the mainstream. In addition, when the sensor is exposed to a TMA atmosphere for detection, only a very small proportion of TMA molecules actually participate in the reaction. Therefore, even if the product of TMA reaction contains NO2, the actual concentration of NO2 in the entire test atmosphere is extremely low, expected to be in the ppb range. Nevertheless, 100 ppm of NO2, which is much higher than its actual concentration, is still chosen as the interfering gas for selectivity tests. The results in Figure S5 show that the response of the In2O3−3 °C/min−500 °C gas sensor to 100 ppm NO2 gas at 240 °C is only 6.63, still much lower than the response to TMA. Therefore, NO2 as a product of TMA does not interfere with selectivity.
The high response of the In2O3−3 °C/min−500 °C nanowire-based sensor in this work can also be attributed to the following factors. Firstly, the one-dimensional structure of In2O3 nanowires is critical. This structure provides a high specific surface area, which allows TMA molecules greater opportunities to fully contact and react with chemisorbed oxygen on the exposed particle surfaces compared to other morphologies. Secondly, XPS analysis reveals an elevated concentration of OV and OC in the In2O3−3 °C/min−500 °C nanowires, indicating more active oxygen species and adsorption sites participating in the reaction. Additionally, SEM images demonstrate that the In2O3−3 °C/min−500 °C nanowires exhibit a rough surface and localized voids, which provide additional adsorption points and facilitate the rapid diffusion of TMA molecules.
For MOS-type sensors, the smaller grain size provides more active sites for gas molecules to interact with, enhancing the sensor’s gas-sensing capability [63], as confirmed by XRD analysis. Notably, both the In2O3−3 °C/min−500 °C and In2O3−3 °C/min−400 °C nanowires exhibit smaller grain sizes, contributing to their high responses to TMA. However, the In2O3−3 °C/min−400 °C nanowire does not achieve the highest response, suggesting that grain size is not the sole determining factor. Beyond size, the crystallinity of the nanowires also synergistically affects sensing performance [64,65]. Poorly crystallized oxide nanofibers possess more structural defects, leading to a higher concentration of charge carriers. This results in smaller resistance variations during the electron anchoring and release processes caused by gas interactions, thereby diminishing sensor response. In contrast, well-crystallized metal oxide nanofibers have fewer charge carriers, enabling significant resistance changes during gas adsorption/desorption and, thus, a superior sensor response. Comparing the crystallinity of the two samples, the In2O3−3 °C/min−500 °C nanowires exhibit a significantly higher crystallinity. Consequently, under the dual influence of optimal grain size and enhanced crystallinity, the In2O3−3 °C/min−500 °C nanowire-based sensor demonstrates the highest response.

4. Conclusions

In summary, this work employed a straightforward electrospinning method to synthesize one-dimensional In2O3 nanowires. By varying the heating rates and annealing temperatures during high-temperature calcination, five distinct In2O3 samples were obtained. Gas-sensing tests demonstrated that the In2O3−3 °C/min−500 °C gas sensor outperformed other samples, exhibiting a higher response (47.0), shorter response time (6 s), and lower LOD (0.0392 ppm), as well as an excellent reproducibility and long-term stability. Through comprehensive characterization, the enhanced gas-sensing performance was attributed to the smaller grain size and superior crystallinity of the In2O3−3 °C/min−500 °C nanowires. These microstructural features facilitated the adsorption and desorption of TMA gas, thereby improving the sensor performance. This study provides a novel approach for fabricating gas sensors tailored for TMA detection and offers practical insights for monitoring fish freshness. However, limitations remain, such as the sensor’s poor selectivity and susceptibility to interference from other VOCs. Addressing these challenges will be critical in future research.

Supplementary Materials

The following supporting information can be downloaded at: https://www.mdpi.com/article/10.3390/chemosensors13060218/s1. Figure S1. The test platform for the spoilage tests of sealed-stored L. crocea. Figure S2. (a) The surface morphology of the sensing device coated with In2O3−3 °C/min−500 °C nanowires after multiple gas-sensing tests.; (b–d) The enlarged sights of In2O3−3 °C/min−500 °C nanowires. Figure S3. The long-term stability of the sensor based on In2O3−3 °C/min−500 °C to 100 ppm TMA at an operating temperature of 240 °C. Figure S4. (a–d) Dynamic response curves of the In2O3−3 °C/min−500 °C to 100 ppm TMA in varying humidity conditions (30%, 50%, 70%, and 90% RH, 30 °C) at an operating temperature of 240 °C; (e) Changes of sensor initial resistance and response with increasing humidity. Figure S5. The comparision of responses of In2O3−3 °C/min−500 °C sensor to 100 ppm TMA and NO2. Table S1. 5th order polynomial fitting data of In2O3−1 °C/min−500 °C–based sensor. Table S2. 5th order polynomial fitting data of In2O3−3 °C/min−500 °C–based sensor. Table S3. 5th order polynomial fitting data of In2O3−5 °C/min−500 °C–based sensor. Table S4. 5th order polynomial fitting data of In2O3−3 °C/min−400 °C–based sensor. Table S5. 5th order polynomial fitting data of In2O3−3 °C/min−600 °C–based sensor. Table S6. Calculation of RMSnoise and LOD of five sensors.

Author Contributions

Conceptualization, B.Z., H.S. (Haitao Song) and X.D.; methodology, X.D., M.S. and Y.L.; software, Y.L. and X.D.; validation, B.Z., H.S. (Hao Shen) and Q.L.; formal analysis, X.D. and Q.L.; investigation, B.Z., H.S. (Haitao Song) and Y.N.; resources, Y.N. and H.S. (Haitao Song); data curation, Y.N., H.S. (Hao Shen) and M.S.; writing—original draft preparation, X.D. and B.Z.; writing—review and editing, B.Z., Q.L. and Y.L.; visualization, B.Z., M.S. and X.D.; supervision, Y.N. and H.S. (Hao Shen); project administration, B.Z. and H.S. (Haitao Song); funding acquisition, B.Z., H.S. (Haitao Song) and Q.L. All authors have read and agreed to the published version of the manuscript.

Funding

This work was supported by the Yangtze River Delta Innovation and Entrepreneurship Joint Carrier Demonstration Project (23002430100), the Wuxi Science and Technology Development Fund Project (K20241036), the National Natural Science Foundation of China (61903159), and the Natural Science Foundation of Jiangsu Province (BK20190617).

Institutional Review Board Statement

Not applicable.

Informed Consent Statement

Not applicable.

Data Availability Statement

The data that support the findings of this study are available from the first author or corresponding authors upon reasonable request.

Conflicts of Interest

Author Hao Shen and Haitao Song was employed by the company Shanghai Artificial Intelligence Research Institute Co., Ltd. The remaining authors declare that the research was conducted in the absence of any commercial or financial relationships that could be construed as a potential conflict of interest.

References

  1. Weichselbaum, E.; Coe, S.; Buttriss, J.; Stanner, S. Fish in the diet: A review. Nutr. Bull. 2013, 38, 128–177. [Google Scholar] [CrossRef]
  2. Ashie, I.N.A.; Smith, J.P.; Simpson, B.K.; Haard, N.F. Spoilage and shelf-life extension of fresh fish and shellfish. Crit. Rev. Food Sci. Nutr. 2009, 36, 87–121. [Google Scholar] [CrossRef]
  3. Shen, J.; Xu, S.; Zhao, C.; Qiao, X.; Liu, H.; Zhao, Y.; Wei, J.; Zhu, Y. Bimetallic Au@Pt nanocrystal sensitization mesoporous α−Fe2O3 hollow nanocubes for highly sensitive and rapid detection of fish freshness at low temperature. ACS Appl. Mater. Interfaces 2021, 13, 57597–57608. [Google Scholar] [CrossRef] [PubMed]
  4. Prabhakar, P.K.; Vatsa, S.; Srivastav, P.P.; Pathak, S.S. A comprehensive review on freshness of fish and assessment: Analytical methods and recent innovations. Food Res. Int. 2020, 133, 109157. [Google Scholar] [CrossRef] [PubMed]
  5. Wu, K.; Debliquy, M.; Zhang, C. Metal–oxide–semiconductor resistive gas sensors for fish freshness detection. Compr. Rev. Food Sci. Food Saf. 2022, 22, 913–945. [Google Scholar] [CrossRef]
  6. Bernardo, Y.A.A.; Rosario, D.K.A.; Delgado, I.F.; Conte-Junior, C.A. Fish quality index method: Principles, weaknesses, validation, and alternatives—A review. Compr. Rev. Food Sci. Food Saf. 2020, 19, 2657–2676. [Google Scholar] [CrossRef] [PubMed]
  7. Cheng, J.H.; Sun, D.W.; Zeng, X.A.; Liu, D. Recent advances in methods and techniques for freshness quality determination and evaluation of fish and fish fillets: A review. Crit. Rev. Food Sci. Nutr. 2015, 55, 1012–1225. [Google Scholar] [CrossRef]
  8. Hassoun, A.; Karoui, R. Quality evaluation of fish and other seafood by traditional and nondestructive instrumental methods: Advantages and limitations. Crit. Rev. Food Sci. Nutr. 2017, 57, 1976–1998. [Google Scholar] [CrossRef]
  9. Amari, A.; El Barbri, N.; Llobet, E.; El Bari, N.; Correig, X.; Bouchikhi, B. Monitoring the freshness of moroccan sardines with a neural−network based electronic nose. Sensors 2006, 6, 1209–1223. [Google Scholar] [CrossRef]
  10. Wu, D.; Zhang, M.; Chen, H.; Bhandari, B. Freshness monitoring technology of fish products in intelligent packaging. Crit. Rev. Food Sci. Nutr. 2020, 61, 1279–1292. [Google Scholar] [CrossRef]
  11. Freitas, J.; Vaz−Pires, P.; Câmara, J.S. Quality Index Method for fish quality control: Understanding the applications, the appointed limits and the upcoming trends. Trends Food Sci. 2021, 111, 333–345. [Google Scholar] [CrossRef]
  12. Ritter, D.O.; Lanzarin, M.; Novaes, S.F.; Monteiro, M.L.G.; Almeida, E.S.; Mársico, E.T.; Franco, R.M.; Conte, C.A.; Freitas, M.Q. Quality Index Method (QIM) for gutted ice−stored hybrid tambatinga (Colossoma macropomum x Piaractus brachypomum) and study of shelf life. LWT−Food Sci. Technol. 2016, 67, 55–61. [Google Scholar] [CrossRef]
  13. Khodabux, K.; Lomelette, M.; Jhaumeerlaulloo, S.; Ramasami, P.; Rondeau, P. Chemical and near-infrared determination of moisture, fat and protein in tuna fishes. Food Chem. 2007, 102, 669–675. [Google Scholar] [CrossRef]
  14. ElMasry, G.; Wold, J.P. High-speed assessment of fat and water content distribution in fish fillets using online imaging spectroscopy. J. Agric. Food Chem. 2008, 56, 7672–7677. [Google Scholar] [CrossRef]
  15. Ozogul, Y.; Ozyurt, G.; Ozogul, F.; Kuley, E.; Polat, A. Freshness assessment of European eel (Anguilla anguilla) by sensory, chemical and microbiological methods. Food Chem. 2005, 92, 745–751. [Google Scholar] [CrossRef]
  16. Heising, J.K.; Dekker, M.; Bartels, P.V.; van Boekel, M.A.J.S. A non-destructive ammonium detection method as indicator for freshness for packed fish: Application on cod. J. Food Eng. 2012, 110, 254–261. [Google Scholar] [CrossRef]
  17. Sivertsen, A.H.; Kimiya, T.; Heia, K. Automatic freshness assessment of cod (Gadus morhua) fillets by Vis/Nir spectroscopy. J. Food Eng. 2011, 103, 317–323. [Google Scholar] [CrossRef]
  18. Godiksen, H.; Morzel, M.; Hyldig, G.; Jessen, F. Contribution of cathepsins B, L and D to muscle protein profiles correlated with texture in rainbow trout (Oncorhynchus mykiss). Food Chem. 2009, 113, 889–896. [Google Scholar] [CrossRef]
  19. Herrero, A.M. Raman spectroscopy a promising technique for quality assessment of meat and fish: A review. Food Chem. 2008, 107, 1642–1651. [Google Scholar] [CrossRef]
  20. Folkestad, A.; Wold, J.P.; Rørvik, K. −A.; Tschudi, J.; Haugholt, K.H.; Kolstad, K.; Mørkøre, T. Rapid and non-invasive measurements of fat and pigment concentrations in live and slaughtered atlantic salmon (Salmo salar L.). Aquaculture 2008, 280, 129–135. [Google Scholar] [CrossRef]
  21. Shibata, M.; ElMasry, G.; Moriya, K.; Rahman, M.M.; Miyamoto, Y.; Ito, K.; Nakazawa, N.; Nakauchi, S.; Okazaki, E. Smart technique for accurate monitoring of ATP content in frozen fish fillets using fluorescence fingerprint. Lwt 2018, 92, 258–264. [Google Scholar] [CrossRef]
  22. Møretrø, T.; Normann, M.A.; Sæbø, H.R.; Langsrud, S. Evaluation of ATP bioluminescence-based methods for hygienic assessment in fish industry. J. Appl. Microbiol. 2019, 127, 186–195. [Google Scholar] [CrossRef]
  23. Wu, L.; Pu, H.; Sun, D. −W. Novel techniques for evaluating freshness quality attributes of fish: A review of recent developments. Trends Food Sci. Technol. 2019, 83, 259–273. [Google Scholar] [CrossRef]
  24. Summers, G.; Wibisono, R.D.; Hedderley, D.I.; Fletcher, G.C. Trimethylamine oxide content and spoilage potential of New Zealand commercial fish species. N. Z. J. Mar. Freshwater Res. 2016, 51, 393–405. [Google Scholar] [CrossRef]
  25. Zhu, K.; Zhu, Z.; Xu, S.; Zhao, C.; Ni, T. Controlled synthesis of α−Fe2O3 nanocubes for gas−sensing applications: Feasibility of assessing crucian carp (Carassius auratus) freshness via trimethylamine levels. Food Chem. 2024, 441, 138361. [Google Scholar] [CrossRef] [PubMed]
  26. Tewari, D.; Sah, A.N.; Tripathi, Y.C. Chemical composition of angelica glauca roots volatile oil from indian himalayan region by GC-MS. J. Essent. Oil Bear. Plants 2019, 21, 1636–1641. [Google Scholar] [CrossRef]
  27. Cheng, S.; Li, H.; Jiang, D.; Chen, C.; Zhang, T.; Li, Y.; Wang, H.; Zhou, Q.; Li, H.; Tan, M. Sensitive detection of trimethylamine based on dopant−assisted positive photoionization ion mobility spectrometry. Talanta 2017, 162, 398–402. [Google Scholar] [CrossRef]
  28. Yan, W.; Xu, H.; Ling, M.; Zhou, S.; Qiu, T.; Deng, Y.; Zhao, Z.; Zhang, E. MOF–derived porous hollow Co3O4@ZnO cages for high−performance mems trimethylamine sensors. ACS Sens. 2021, 6, 2613–2621. [Google Scholar] [CrossRef]
  29. Li, F.; Gao, X.; Wang, R.; Zhang, T.; Lu, G.; Barsan, N. Design of core–shell heterostructure nanofibers with different work function and their sensing properties to trimethylamine. ACS Appl. Mater. Interfaces 2016, 8, 19799–19806. [Google Scholar] [CrossRef]
  30. Hu, S.; Xiao, Y.; Zhang, A.; Lin, Z.; Li, F.; Zhang, B.; Wang, G.; Qu, F.; Yao, D.; Zhang, H. Ultrasensitive xylene sensor based on RuO2-modified BiVO4 nanosheets. Sens. Actuators B 2025, 422, 136623. [Google Scholar] [CrossRef]
  31. Kadam, S.A.; Kadam, K.P.; Maria, C.C.S.; Ma, Y.R.; Molane, A.C.; Lolage, S.A.; Patil, V.B.; More, P.D. Microporous α-Fe2O3@NiO heterostructures synthesized for enhanced supercapacitor performance. Chemistryselect 2024, 9, e202302376. [Google Scholar] [CrossRef]
  32. Shen, S.; Zhang, X.; Cheng, X.; Xu, Y.; Gao, S.; Zhao, H.; Zhou, X.; Huo, L. Oxygen−vacancy−enriched porous α−MoO3 nanosheets for trimethylamine sensing. ACS Appl. Nano Mater. 2019, 2, 8016–8026. [Google Scholar] [CrossRef]
  33. Liu, L.; Fu, S.; Lv, X.; Yue, L.; Fan, L.; Yu, H.; Gao, X.; Zhu, W.; Zhang, W.; Li, X.; et al. A gas sensor with Fe2O3 nanospheres based on trimethylamine detection for the rapid assessment of spoilage degree in fish. Front. Bioeng. Biotechnol. 2020, 8, 567584. [Google Scholar] [CrossRef] [PubMed]
  34. Wang, Y.; Zhang, S.; Huang, C.; Qu, F.; Yao, D.; Guo, H.; Xu, H.; Jiang, C.; Yang, M. Mesoporous WO3 modified by Au nanoparticles for enhanced trimethylamine gas sensing properties. Dalton Trans. 2021, 50, 970–978. [Google Scholar] [CrossRef]
  35. Shanmugasundaram, A.; Ramireddy, B.; Basak, P.; Manorama, S.V.; Srinath, S. Hierarchical In(OH)3 as a precursor to mesoporous In2O3 nanocubes: A facile synthesis route, mechanism of self-assembly, and enhanced sensing response toward hydrogen. J. Phys. Chem. C 2014, 118, 6909–6921. [Google Scholar] [CrossRef]
  36. Nomani, M.W.K.; Kersey, D.; James, J.; Diwan, D.; Vogt, T.; Webb, R.A.; Koley, G. Highly sensitive and multidimensional detection of NO2 using In2O3 thin films. Sens. Actuators B 2011, 160, 251–259. [Google Scholar] [CrossRef]
  37. Huang, F.; Yang, W.; He, F.; Liu, S. Controlled synthesis of flower-like In2O3 microrods and their highly improved selectivity toward ethanol. Sens. Actuators B 2016, 235, 86–93. [Google Scholar] [CrossRef]
  38. Lu, X.; Yu, Q.; Wang, K.; Shi, L.; Liu, X.; Qiu, A.; Wang, L.; Cui, D. Synthesis, characterization and gas sensing properties of flowerlike In2O3 composed of microrods. Cryst. Res. Technol. 2010, 45, 557–561. [Google Scholar] [CrossRef]
  39. Li, Y.; Liu, J.; Zhang, J.; Liang, X.; Zhang, X.; Qi, Q. Deposition of In2O3 nanofibers on polyimide substrates to construct high-performance and flexible trimethylamine sensor. Chin. Chem. Lett. 2020, 31, 2142–2144. [Google Scholar] [CrossRef]
  40. Zheng, W.; Lu, X.; Wang, W.; Li, Z.; Zhang, H.; Wang, Y.; Wang, Z.; Wang, C. A highly sensitive and fast−responding sensor based on electrospun In2O3 nanofibers. Sens. Actuators B 2009, 142, 61–65. [Google Scholar] [CrossRef]
  41. Cantalini, C.; Wlodarski, W.; Sun, H.T.; Atashbar, M.Z.; Passacantando, M.; Santucci, S. NO2 response of In2O3 thin film gas sensors prepared by sol-gel and vacuum thermal evaporation techniques. Sens. Actuators B 2000, 65, 101–104. [Google Scholar] [CrossRef]
  42. Korotcenkov, G.; Cerneavschi, A.; Brinzari, V.; Vasiliev, A.; Ivanov, M.; Cornet, A.; Morante, J.; Cabot, A.; Arbiol, J. In2O3 films deposited by spray pyrolysis as a material for ozone gas sensors. Sens. Actuators B 2004, 99, 297–303. [Google Scholar] [CrossRef]
  43. Zhang, B.; Wang, J.; Yu, P.; Guo, L.; Xu, Y.; Dong, Y.; Ni, Y.; Ao, J.; Wei, Q.; Xia, Y. In/Fe cospinning nanowires for triethylamine gas sensing. ACS Appl. Nano Mater. 2022, 5, 9554–9566. [Google Scholar] [CrossRef]
  44. Li, W.; Zhang, B.; Dong, X.; Lu, Q.; Shen, H.; Ni, Y.; Liu, Y.; Song, H. Electrospun WO3/TiO2 core–shell nanowires for triethylamine gas sensing. Chemosensors 2025, 13, 45. [Google Scholar] [CrossRef]
  45. Li, Z.; Guo, L.; Feng, Z.; Gao, S.; Zhang, H.; Yang, X.; Liu, H.; Shao, J.; Sun, C.; Cheng, Y.; et al. Metal−organic framework−derived ZnO decorated with CuO for ultra−high response and selectivity H2S gas sensor. Sens. Actuators B 2022, 366, 131995. [Google Scholar] [CrossRef]
  46. Wang, L.; Cao, J.; Qian, X.; Zhang, H. Facile synthesis and enhanced gas sensing properties of grain size−adjustable In2O3 micro/nanotubes. Mater. Lett. 2016, 171, 30–33. [Google Scholar] [CrossRef]
  47. Van Hoang, N.; Hung, C.M.; Hoa, N.D.; Van Duy, N.; Van Hieu, N. Facile on-chip electrospinning of ZnFe2O4 nanofiber sensors with excellent sensing performance to H2S down ppb level. J. Hazard. Mater. 2018, 360, 6–16. [Google Scholar] [CrossRef]
  48. He, K.; Chen, N.; Wang, C.; Wei, L.; Chen, J. Method for determining crystal grain size by x-ray diffraction. Cryst. Res. Technol. 2018, 53, 1700157. [Google Scholar] [CrossRef]
  49. Zhang, J.; Liu, L.; Tang, X.; Sun, D.; Tian, C.; Yang, Y. Nanoflake assembled hierarchical porous flower-like α−Fe2O3 with large specific surface area for enhanced acetone sensing. Func. Mater. Lett. 2020, 13, 2051038. [Google Scholar] [CrossRef]
  50. Wang, Y.; Sun, X.; Cao, J. Enhanced methane sensing performance of Ag modified In2O3 microspheres. J. Alloys Compd. 2022, 895, 162557. [Google Scholar] [CrossRef]
  51. Liu, W.; Gu, D.; Li, X. Detection of Ppb−level NO2 using mesoporous ZnSe/SnO2 core−shell microspheres based chemical sensors. Sens. Actuators B 2020, 320, 128365. [Google Scholar] [CrossRef]
  52. Wu, J.; Feng, S.; Li, Z.; Tao, K.; Chu, J.; Miao, J.; Norford, L.K. Boosted sensitivity of graphene gas sensor via nanoporous thin film structures. Sens. Actuators B 2018, 255, 1805–1813. [Google Scholar] [CrossRef]
  53. Ji, Y.; Zhang, N.; Xu, J.; Jin, Q.; San, X.; Wang, X. Co3O4/In2O3 p−n heterostructures based gas sensor for efficient structure−driven trimethylamine detection. Ceram Int. 2023, 49, 17354–17362. [Google Scholar] [CrossRef]
  54. Meng, D.; Qiao, T.; Ji, Y.; Wang, R.; Zhang, Y.; San, X.; Jin, Q.; Wang, X. Hydrangea-like In2O3@In2S3 n–n heterostructures for high-efficiency TMA measurement. IEEE Trans. Instrum. Meas. 2023, 72, 1–9. [Google Scholar] [CrossRef]
  55. Wang, W.; Zhang, L.; Liu, Z.; Kang, Y.; Chen, Q.; Wang, W.; Liu, M.; Ye, B. −C.; Yu, F.; Li, Y. Visible−light−activated TiO2–NiFe2O4 heterojunction for detecting sub−ppm trimethylamine. J. Alloys Compd. 2022, 898, 162990. [Google Scholar] [CrossRef]
  56. Mahata, B.; Giri, S.; Banerji, P.; Guha, P.K. Cactus-like NiO nanostructure−based ppb level trimethylamine gas sensor for monitoring saltwater fish freshness. ACS Food Sci. Technol. 2024, 5, 284–291. [Google Scholar] [CrossRef]
  57. Meng, D.; He, C.; Zhang, Y.; San, X.; Zhang, L.; Jin, Q.; Qi, J. Heterostructures constructed by NiMoO4 functionalized 2D MoO3 nanosheets for ultrasensitive trimethylamine detection with ppb level detection. Sens. Actuators B 2024, 421, 136442. [Google Scholar] [CrossRef]
  58. Chen, Y.; Li, Y.; Feng, B.; Wu, Y.; Zhu, Y.; Wei, J. Self-templated synthesis of mesoporous Au−ZnO nanospheres for seafood freshness detection. Sens. Actuators B 2022, 360, 131662. [Google Scholar] [CrossRef]
  59. Meng, D.; Qiao, T.; Wang, G.; Shen, Y.; San, X.; Pan, Y.; Meng, F. NiO-functionalized In2O3 flower like structures with enhanced trimethylamine gas sensing performance. Appl. Surf. Sci. 2022, 577, 151877. [Google Scholar] [CrossRef]
  60. Wang, L.; Gao, L.; Liu, H.; Zhang, Q.; Fu, H.; Liu, Z. Constructing of Bi2O3-In2O3 nanofibers for sensitive detection of freshness gas markers in aquatic products. J. Alloys Compd. 2025, 1017, 179019. [Google Scholar] [CrossRef]
  61. Zhang, K.; Shen, Y.; Lin, Z.; Dong, Z. Ultra-high ethanol sensitivity sensor based on porous In2O3 decorated with gold nanoparticles. Mater. Sci. Semicond. Process. 2021, 135, 106124. [Google Scholar] [CrossRef]
  62. Sun, Z.; Yan, X.; Huang, L.; Zhang, Y.; Hu, Z.; Sun, C.; Yang, X.; Pan, G.; Cheng, Y. AuPd bimetallic functionalized monodisperse In2O3 porous spheres for ultrasensitive trimethylamine detection. Sens. Actuators B 2023, 381, 133355. [Google Scholar] [CrossRef]
  63. He, J.; Meng, H.; Wang, X.; Xu, Y.; Feng, L. S−doped SnO2 nanoparticles with a smaller grain size for highly efficient detection of greenhouse gas hexafluoroethane. Sens. Actuators B 2024, 418, 136335. [Google Scholar] [CrossRef]
  64. Kong, D.; Wang, Y.; Han, J.; Gao, Y.; Liu, F.; Zhou, W.; Gao, Y.; Lu, G. Tailoring the triethylamine vapor sensing on Co−Fe bimetallic oxide nanosheets assemblies by crystal structure and doping sites. Sens. Actuators B 2024, 407, 135447. [Google Scholar] [CrossRef]
  65. Katoch, A.; Sun, G. −J.; Choi, S.−W.; Byun, J.−H.; Kim, S.S. Competitive influence of grain size and crystallinity on gas sensing performances of ZnO nanofibers. Sens. Actuators B 2013, 185, 411–416. [Google Scholar] [CrossRef]
Figure 1. XRD patterns of In2O3−1 °C/min−500 °C, In2O3−3 °C/min−500 °C, In2O3−5 °C/min−500 °C, In2O3−3 °C/min−400 °C, and In2O3−3 °C/min−600 °C.
Chemosensors 13 00218 g001
Figure 2. SEM images under different magnifications of (ac) In2O3−1 °C/min–500 °C, (df) In2O3−3 °C/min−500 °C, (gi) In2O3−5 °C/min−500 °C, (jl) In2O3−3 °C/min−400 °C, and (mo) In2O3−3 °C/min−600 °C.
Chemosensors 13 00218 g002
Figure 3. (a) XPS full spectra of five products and (b) In 3d XPS spectra of the five materials.
Chemosensors 13 00218 g003
Figure 4. O 1s XPS spectrum of (a) In2O3−1 °C/min−500 °C, (b) In2O3−3 °C/min−500 °C, (c) In2O3−5 °C/min−500 °C, (d) In2O3−3 °C/min−400 °C, and (e) In2O3−3 °C/min−600 °C.
Chemosensors 13 00218 g004
Figure 5. Response curves of sensors based on five samples to 100 ppm TMA at different temperatures.
Chemosensors 13 00218 g005
Figure 6. Dynamic response/recovery curves of sensors based on (a) In2O3−1 °C/min−500 °C, (b) In2O3−3 °C/min−500 °C, (c) In2O3−5 °C/min−500 °C, (d) In2O3−3 °C/min−400 °C, and (e) In2O3−3 °C/min−600 °C at their respective optimal working temperatures to 100 ppm TMA.
Chemosensors 13 00218 g006
Figure 7. (ae) Dynamic response/recovery curves of sensors based on five samples at their respective optimal working temperatures to different TMA concentrations and (f) linear response−concentration fitting curves of five samples to TMA at their respective optimal operating temperatures.
Chemosensors 13 00218 g007
Figure 8. (a) Continuous five groups of response/recovery curves of sensors based on five samples at their respective optimal working temperatures to 100 ppm TMA and (b) the responses of the five sensors to 100 ppm of different kinds of VOCs at their respective optimal operating temperatures.
Chemosensors 13 00218 g008
Figure 9. Responses of the In2O3−3 °C/min−500 °C gas sensor to the volatiles released from L. crocea at different storage temperatures: (a) stored at 5 °C and (b) stored at 25 °C.
Chemosensors 13 00218 g009
Figure 10. (a,b) Schematic illustration of the gas-sensing mechanism and (c) energy band diagram of In2O3−3 °C/min−500 °C in air and TMA.
Chemosensors 13 00218 g010
Table 1. Summary of the grain size in In2O3 nanowire samples with different annealing temperatures and heating rates.
SampleGrain Size (nm) a
In2O3−1 °C/min− 500 °C15.30
In2O3−3 °C/min− 500 °C9.06
In2O3−5 °C/min− 500 °C12.67
In2O3−3 °C/min− 400 °C7.66
In2O3−3 °C/min− 600 °C12.80
a Results calculated from XRD analysis.
Table 2. Holistic fitting results of O 1s XPS spectra of five as-synthesized samples.
SampleOL (%) aOV (%) aOC (%) a
In2O3−1 °C/min−500 °C64.720.514.8
In2O3−3 °C/min−500 °C48.431.620.0
In2O3−5 °C/min−500 °C62.019.718.3
In2O3−3 °C/min−400 °C54.027.118.9
In2O3−3 °C/min−600 °C61.119.819.1
a Results from XPS analysis.
Table 3. A comparison of the performance of the In2O3−3 °C/min−500 °C-based sensor in this work with other TMA gas sensors.
Mater.Temp. (°C)Conc. (ppm)Res.τres.rec. (s)Ref.
Co2O3/In2O32001011.6725/68[53]
In2O3@In2S3100105.528/48[54]
α-Fe2O3250207.1100/200[33] *
Au−WO326810042.561/323[34]
TiO2−NiFe2O43071011.250/45[55]
NiO26010013.5124/39[56] *
NiMoO4/MoO32001062.7913/78[57] *
Au/ZnO2501052.612/127[58] *
In2O3−NiO2001020.5139/43[59]
3 %Bi2O3−In2O3 NFs25010048.6320/58[60]
In2O324010047.06/37This work
Mater.: materials; Temp.: operating temperature; Conc.: gas concentration; Res.: response; τres.rec.: response/recovery time; Ref.: references; *: Literature related to freshness monitoring of seafood (fish, shrimp, etc.).
Disclaimer/Publisher’s Note: The statements, opinions and data contained in all publications are solely those of the individual author(s) and contributor(s) and not of MDPI and/or the editor(s). MDPI and/or the editor(s) disclaim responsibility for any injury to people or property resulting from any ideas, methods, instructions or products referred to in the content.

