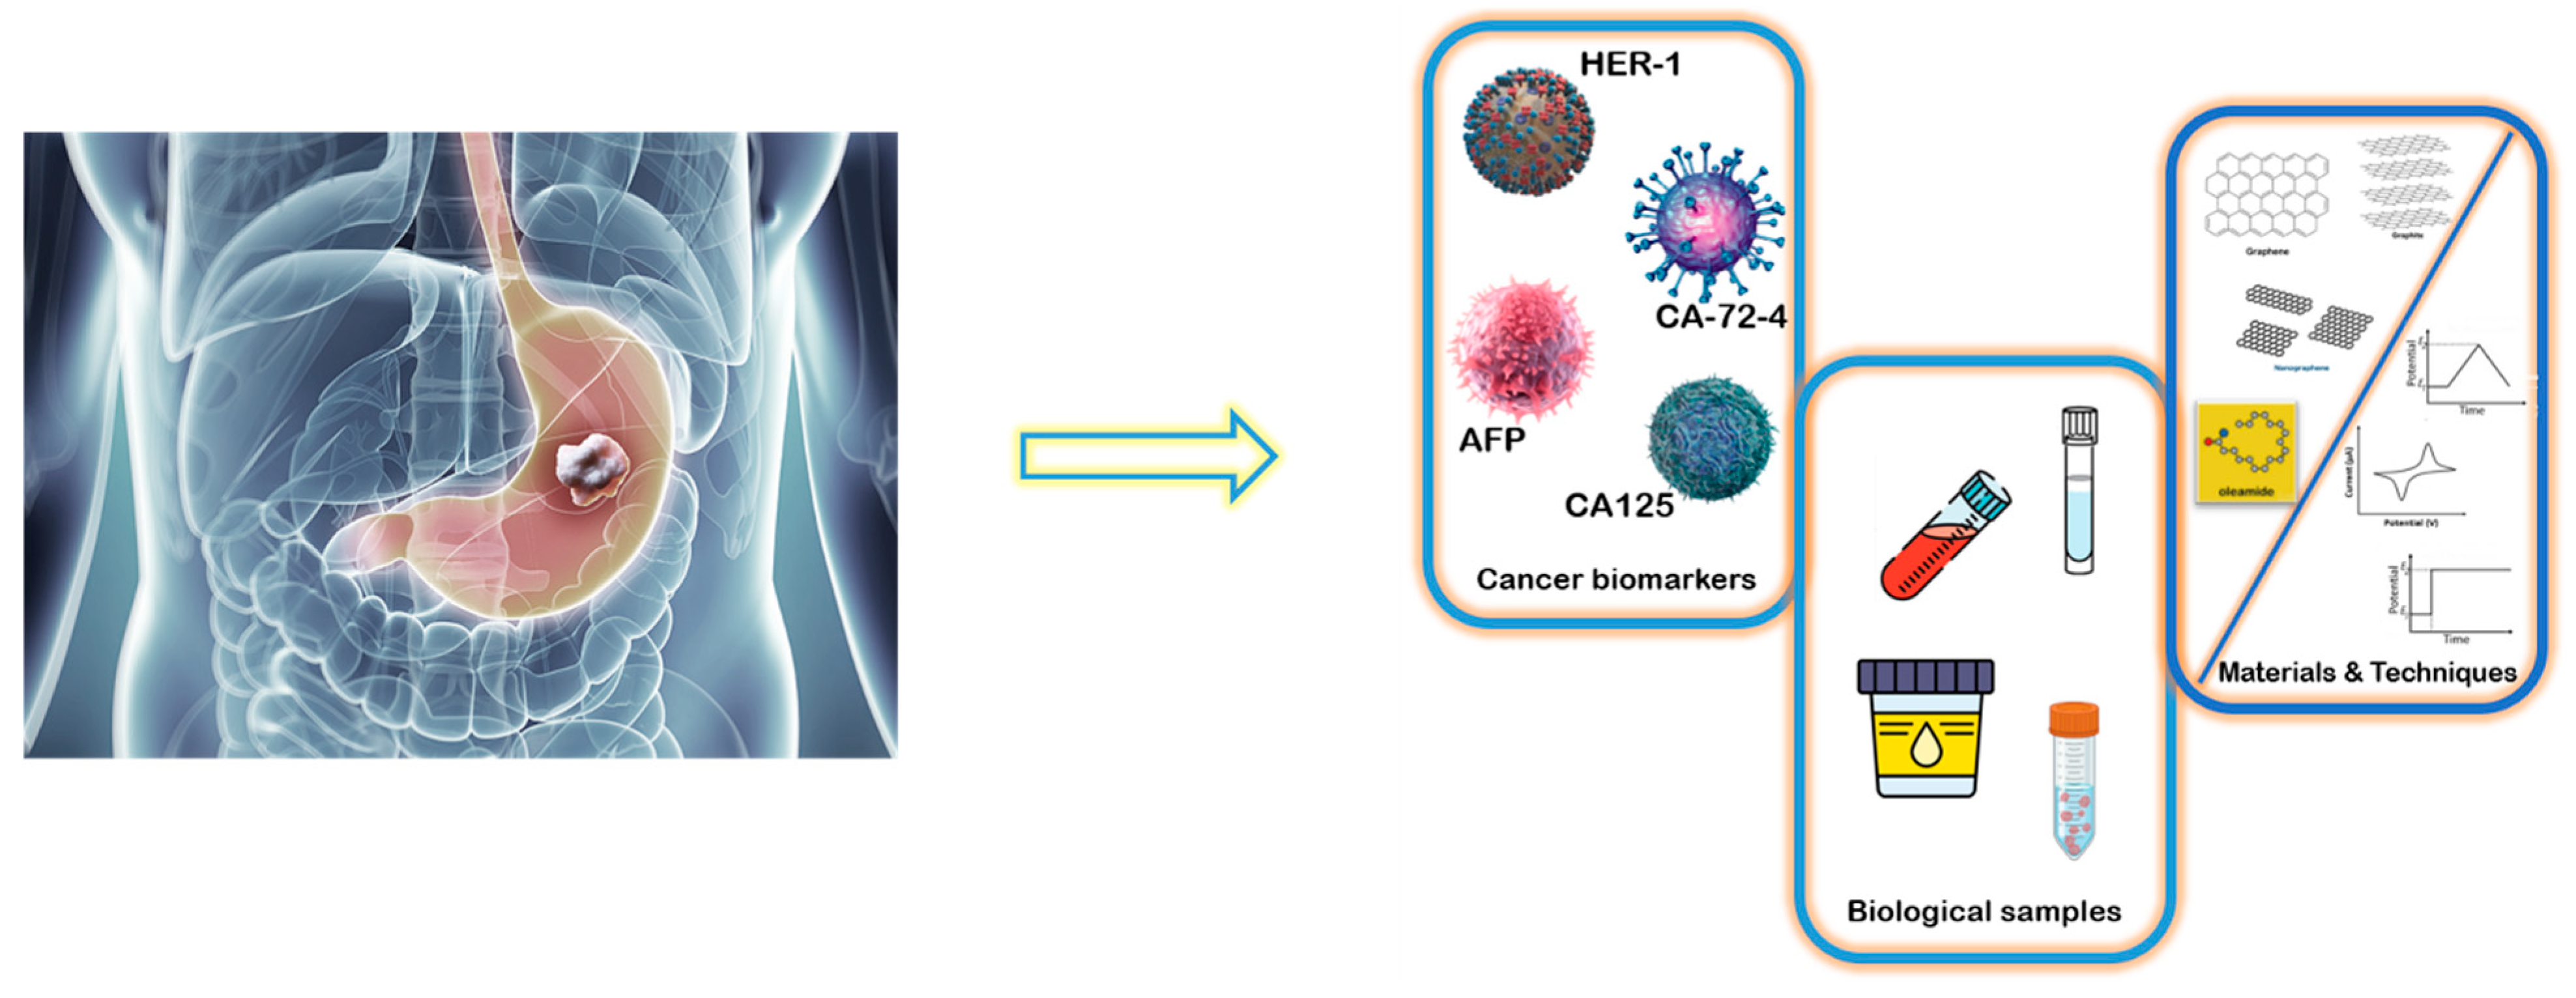
Ultrafast and Ultrasensitive Simultaneous Molecular Recognition and Quantification of CA12-5, CA72-4, HER1, and AFP in Biological Samples


Abstract
1. Introduction
2. Materials and Methods
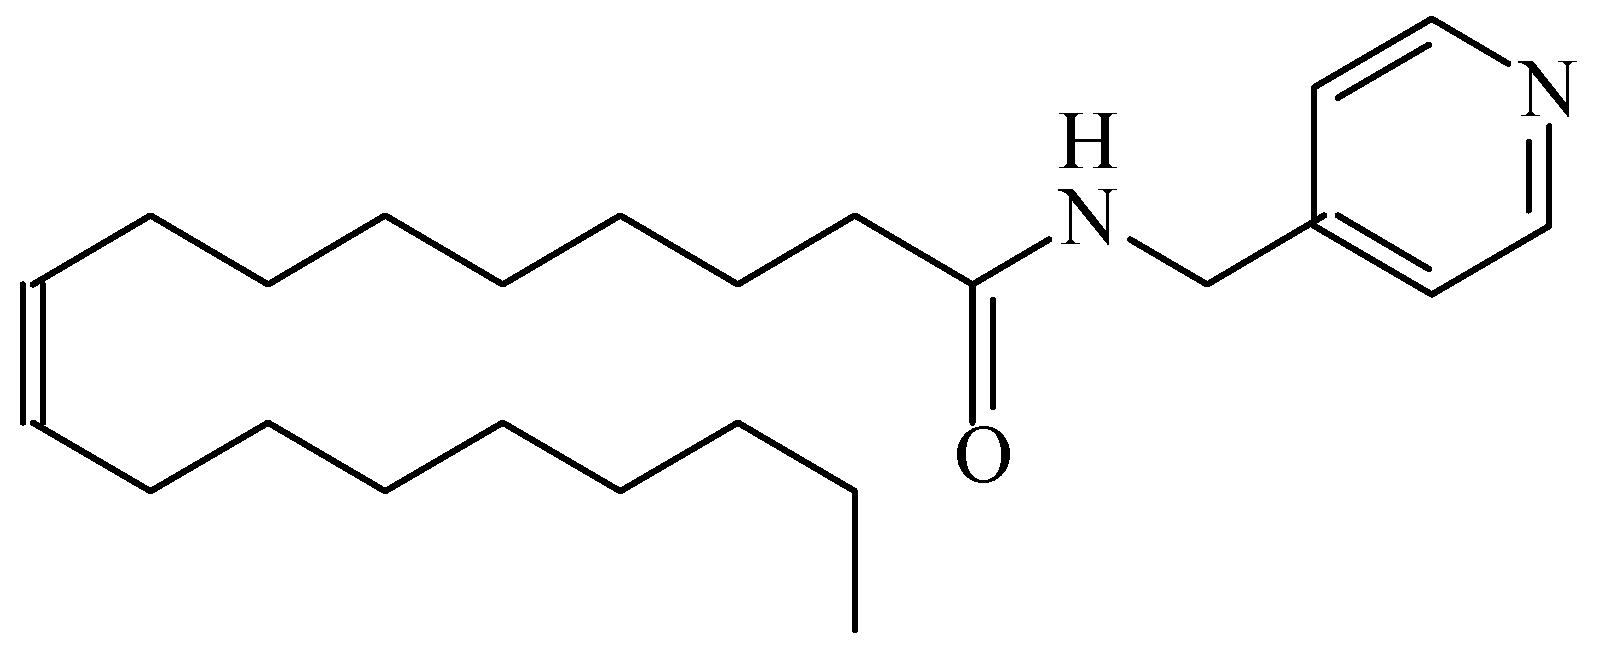
2.1. Materials and Reagents
2.2. Apparatus
2.3. Design of the Stochastic Sensors
2.4. Stochastic Method
2.5. Samples
3. Results
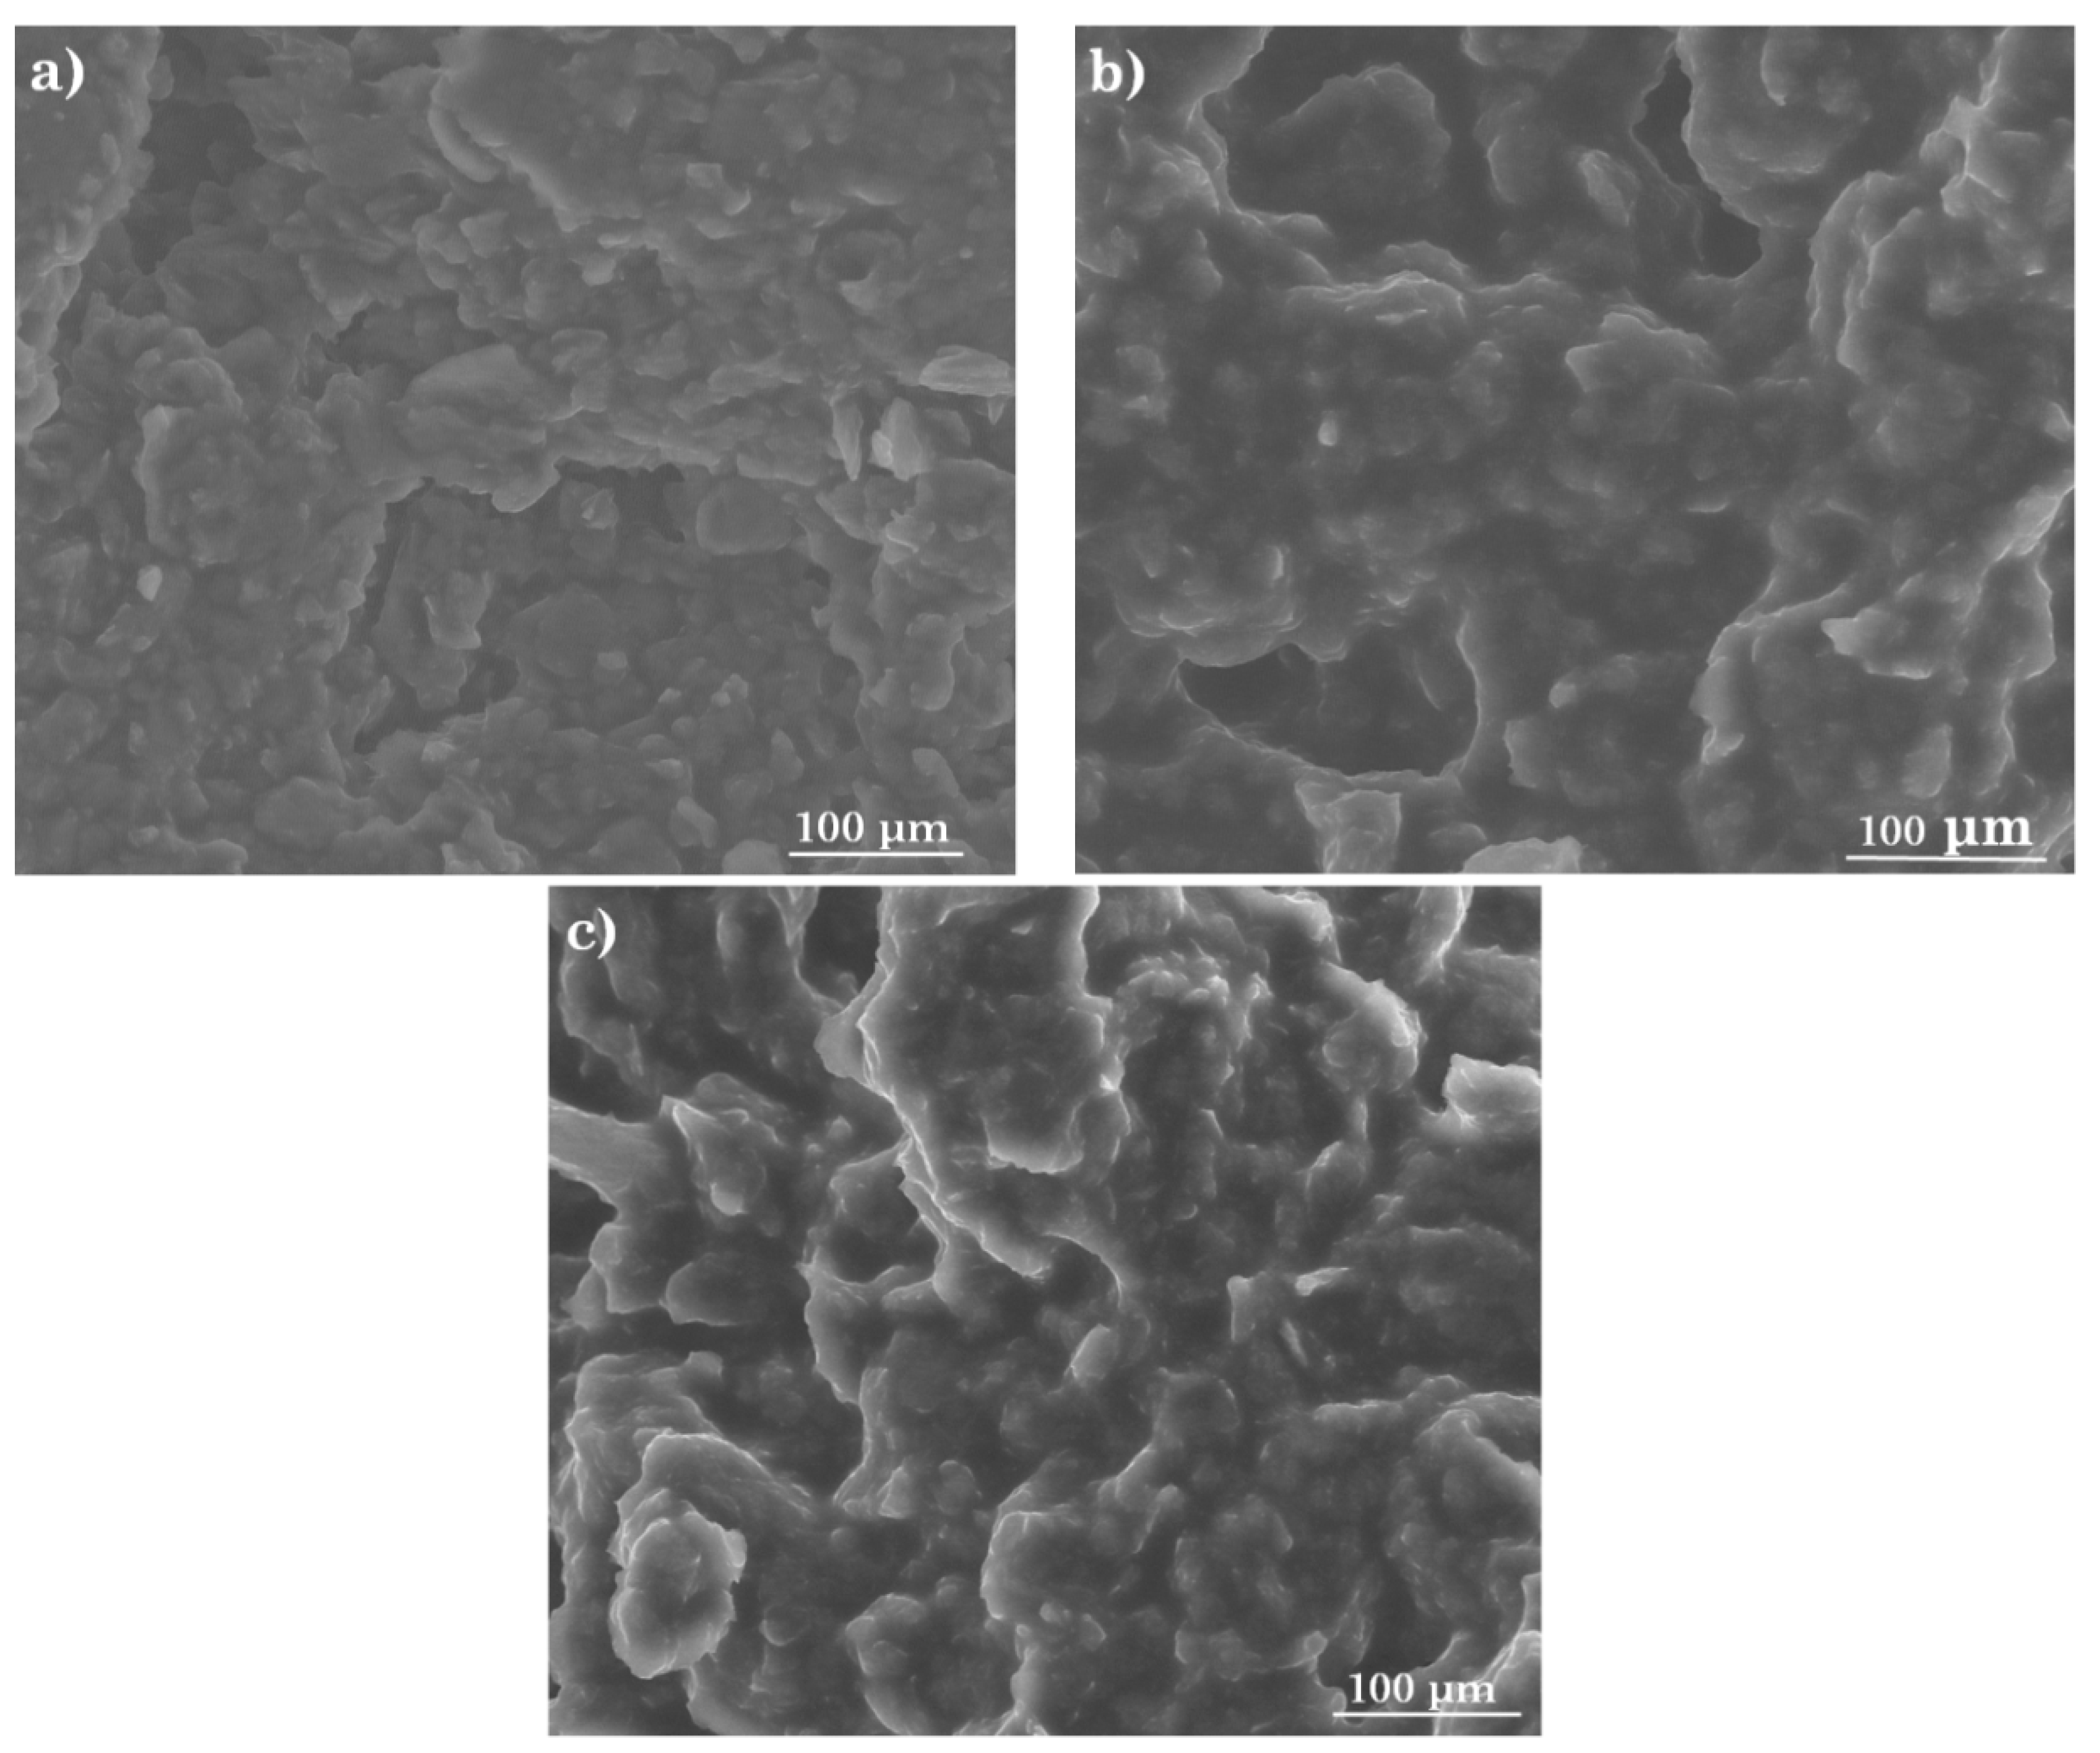
3.1. Morphology of the Active Surface of the Stochastic Sensors
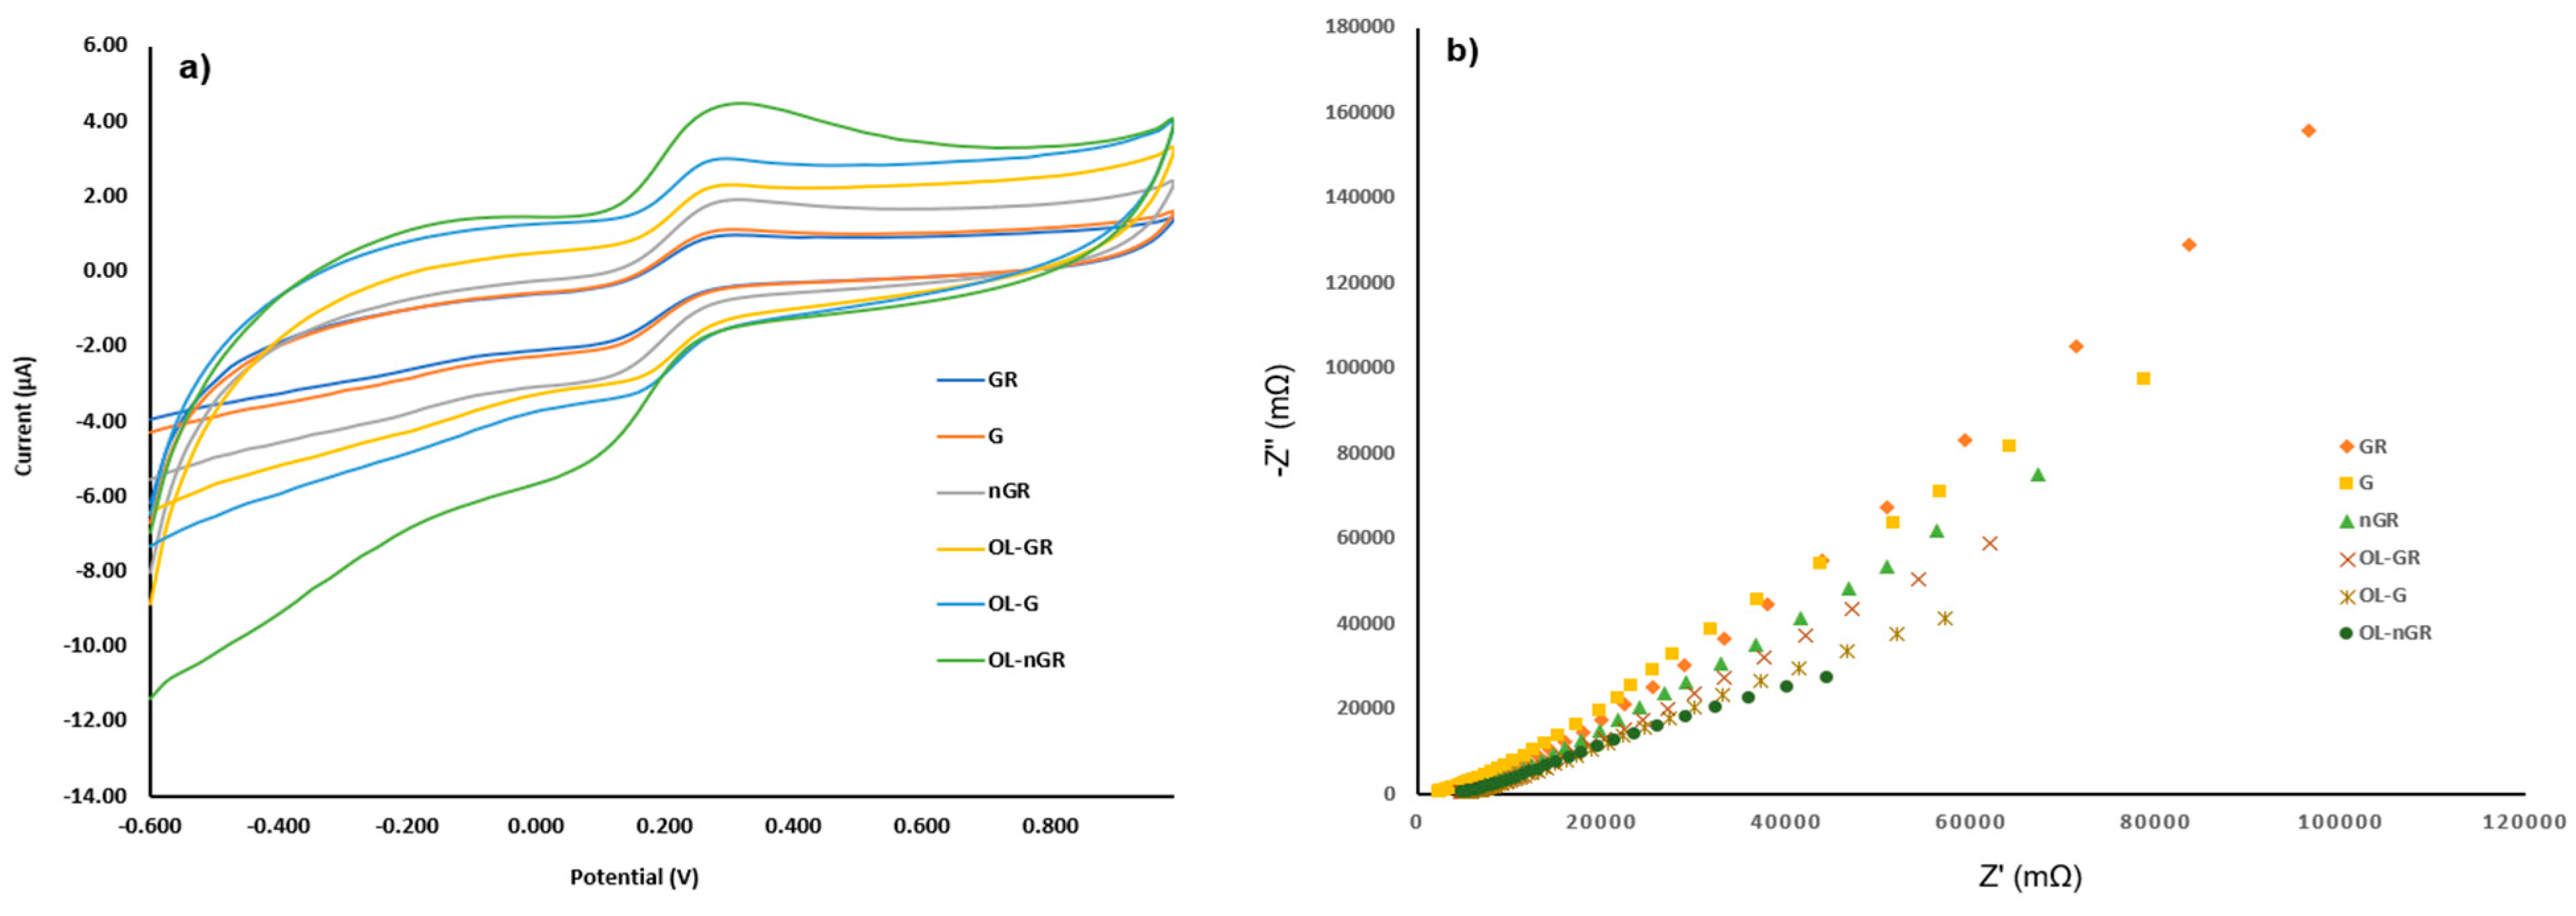
3.2. Electrochemical Characterization of the Stochastic Sensors
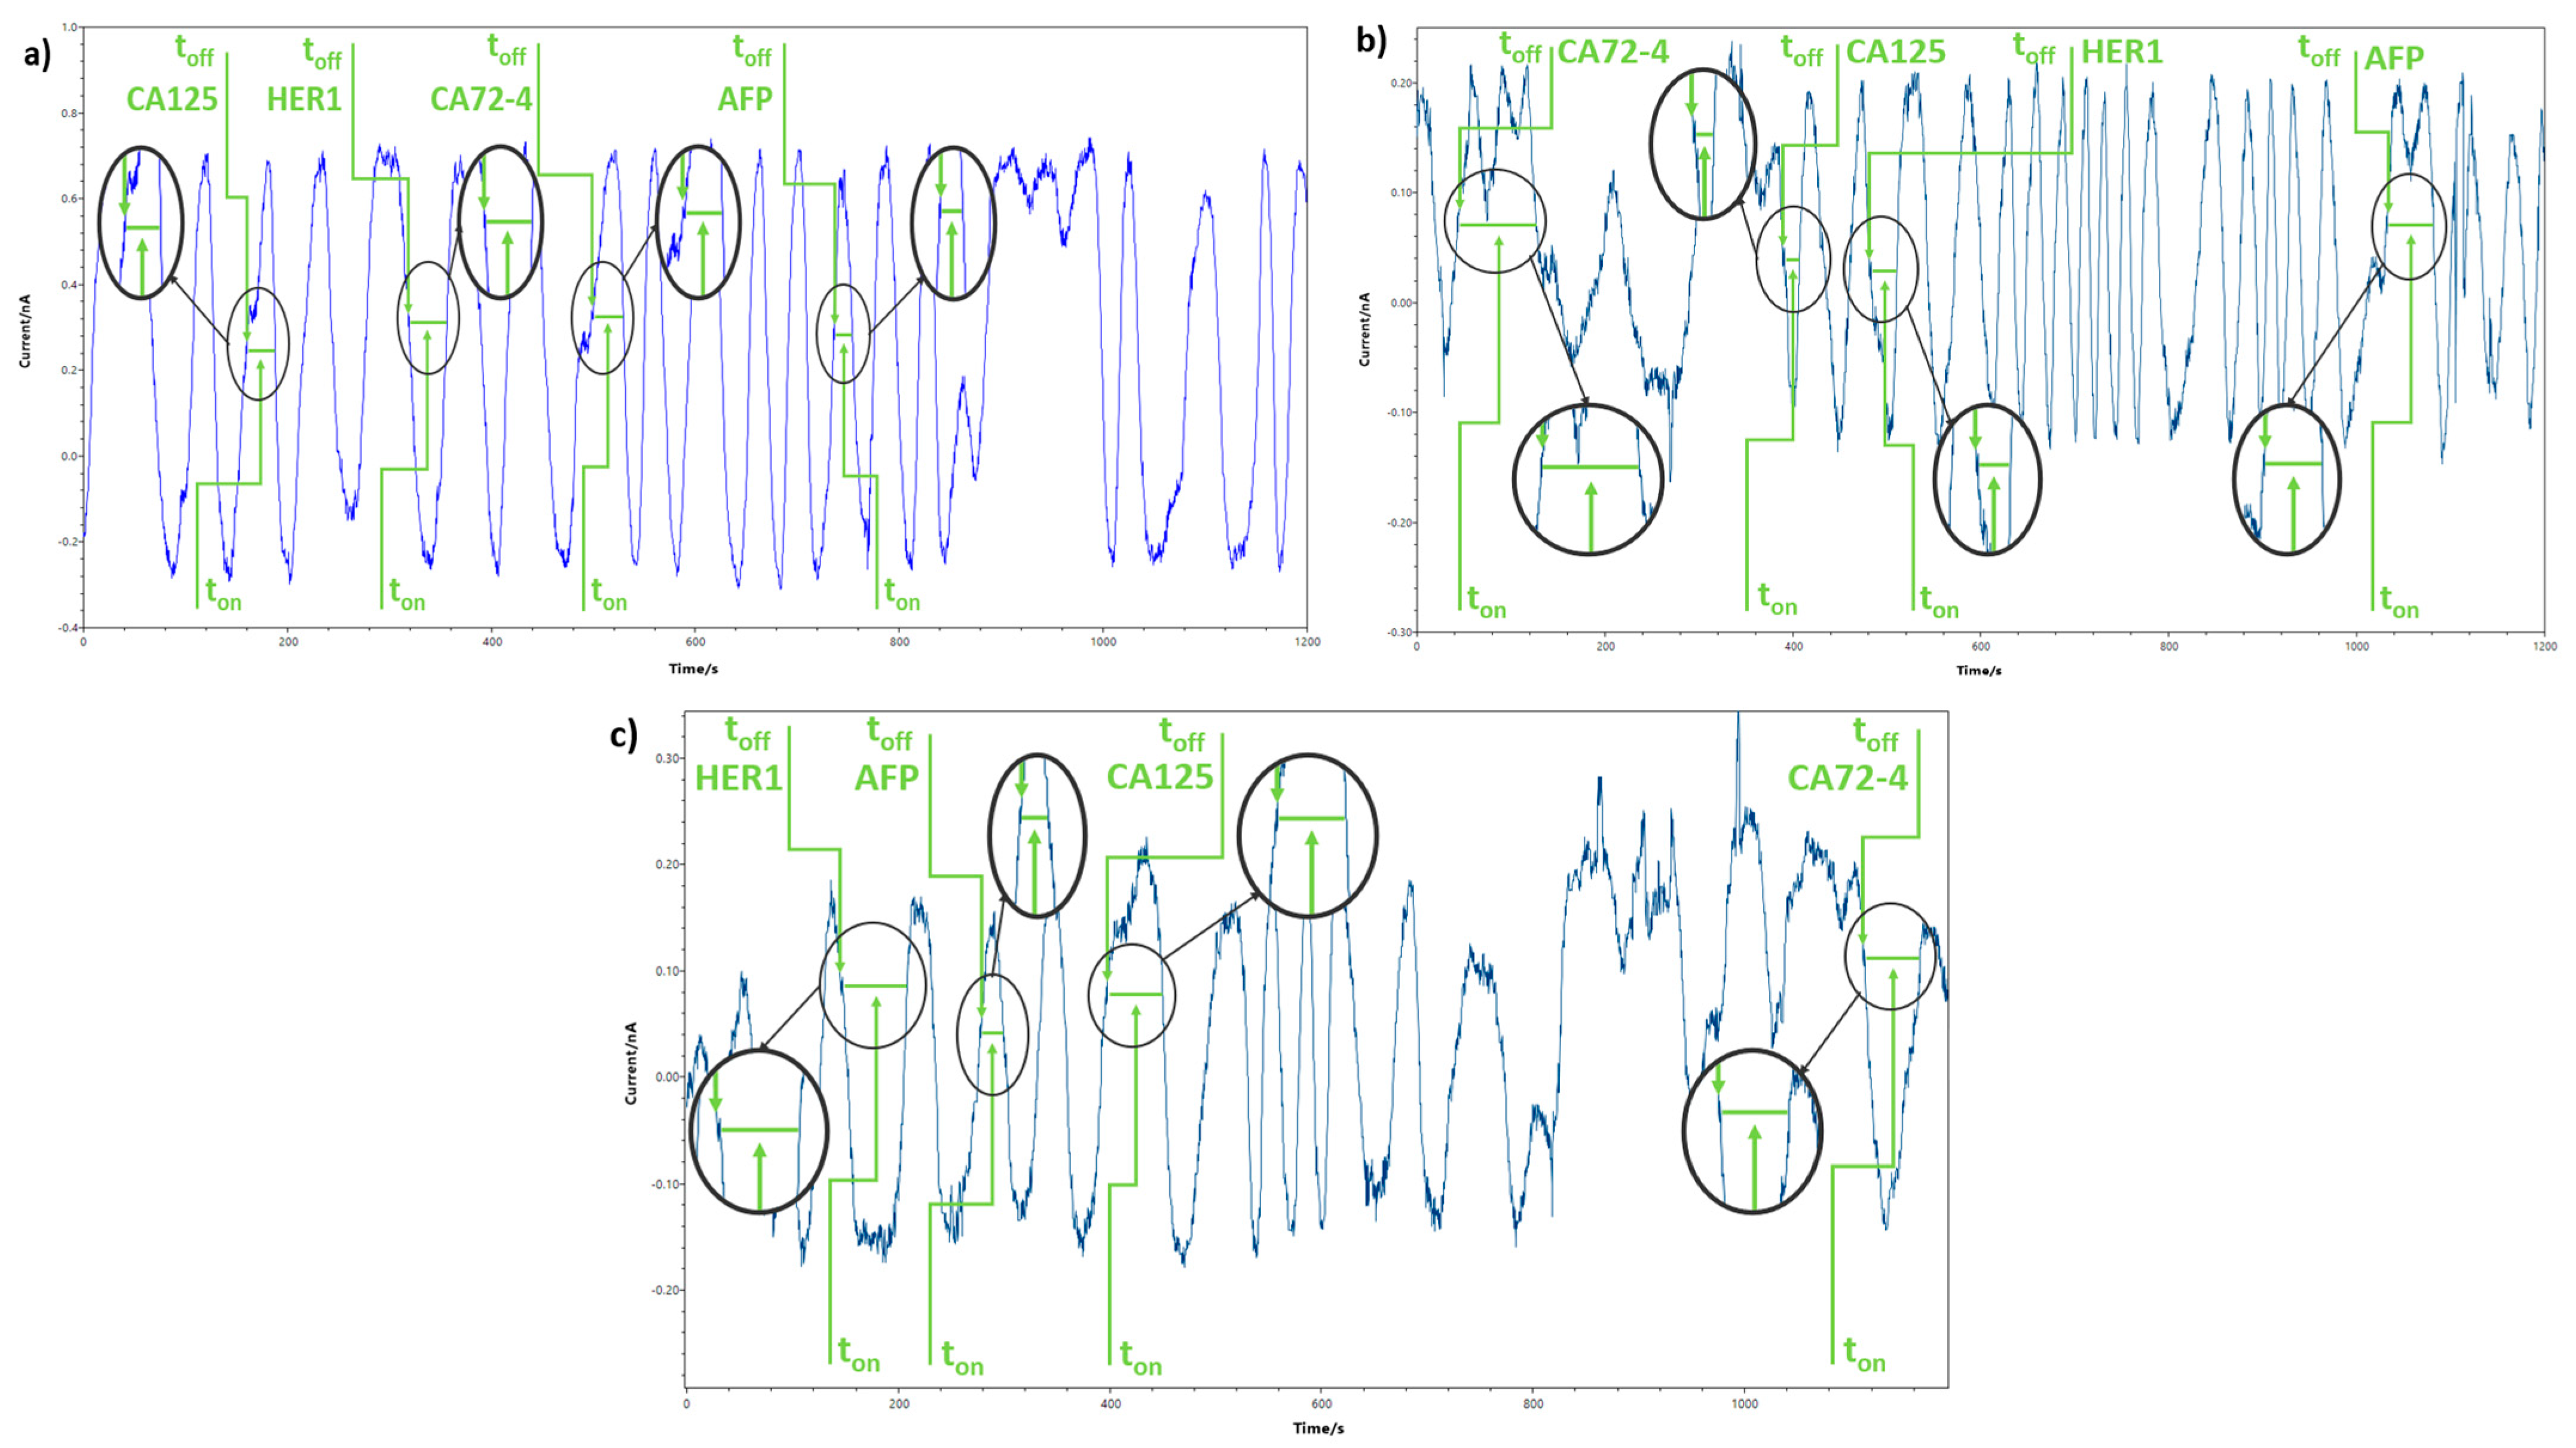
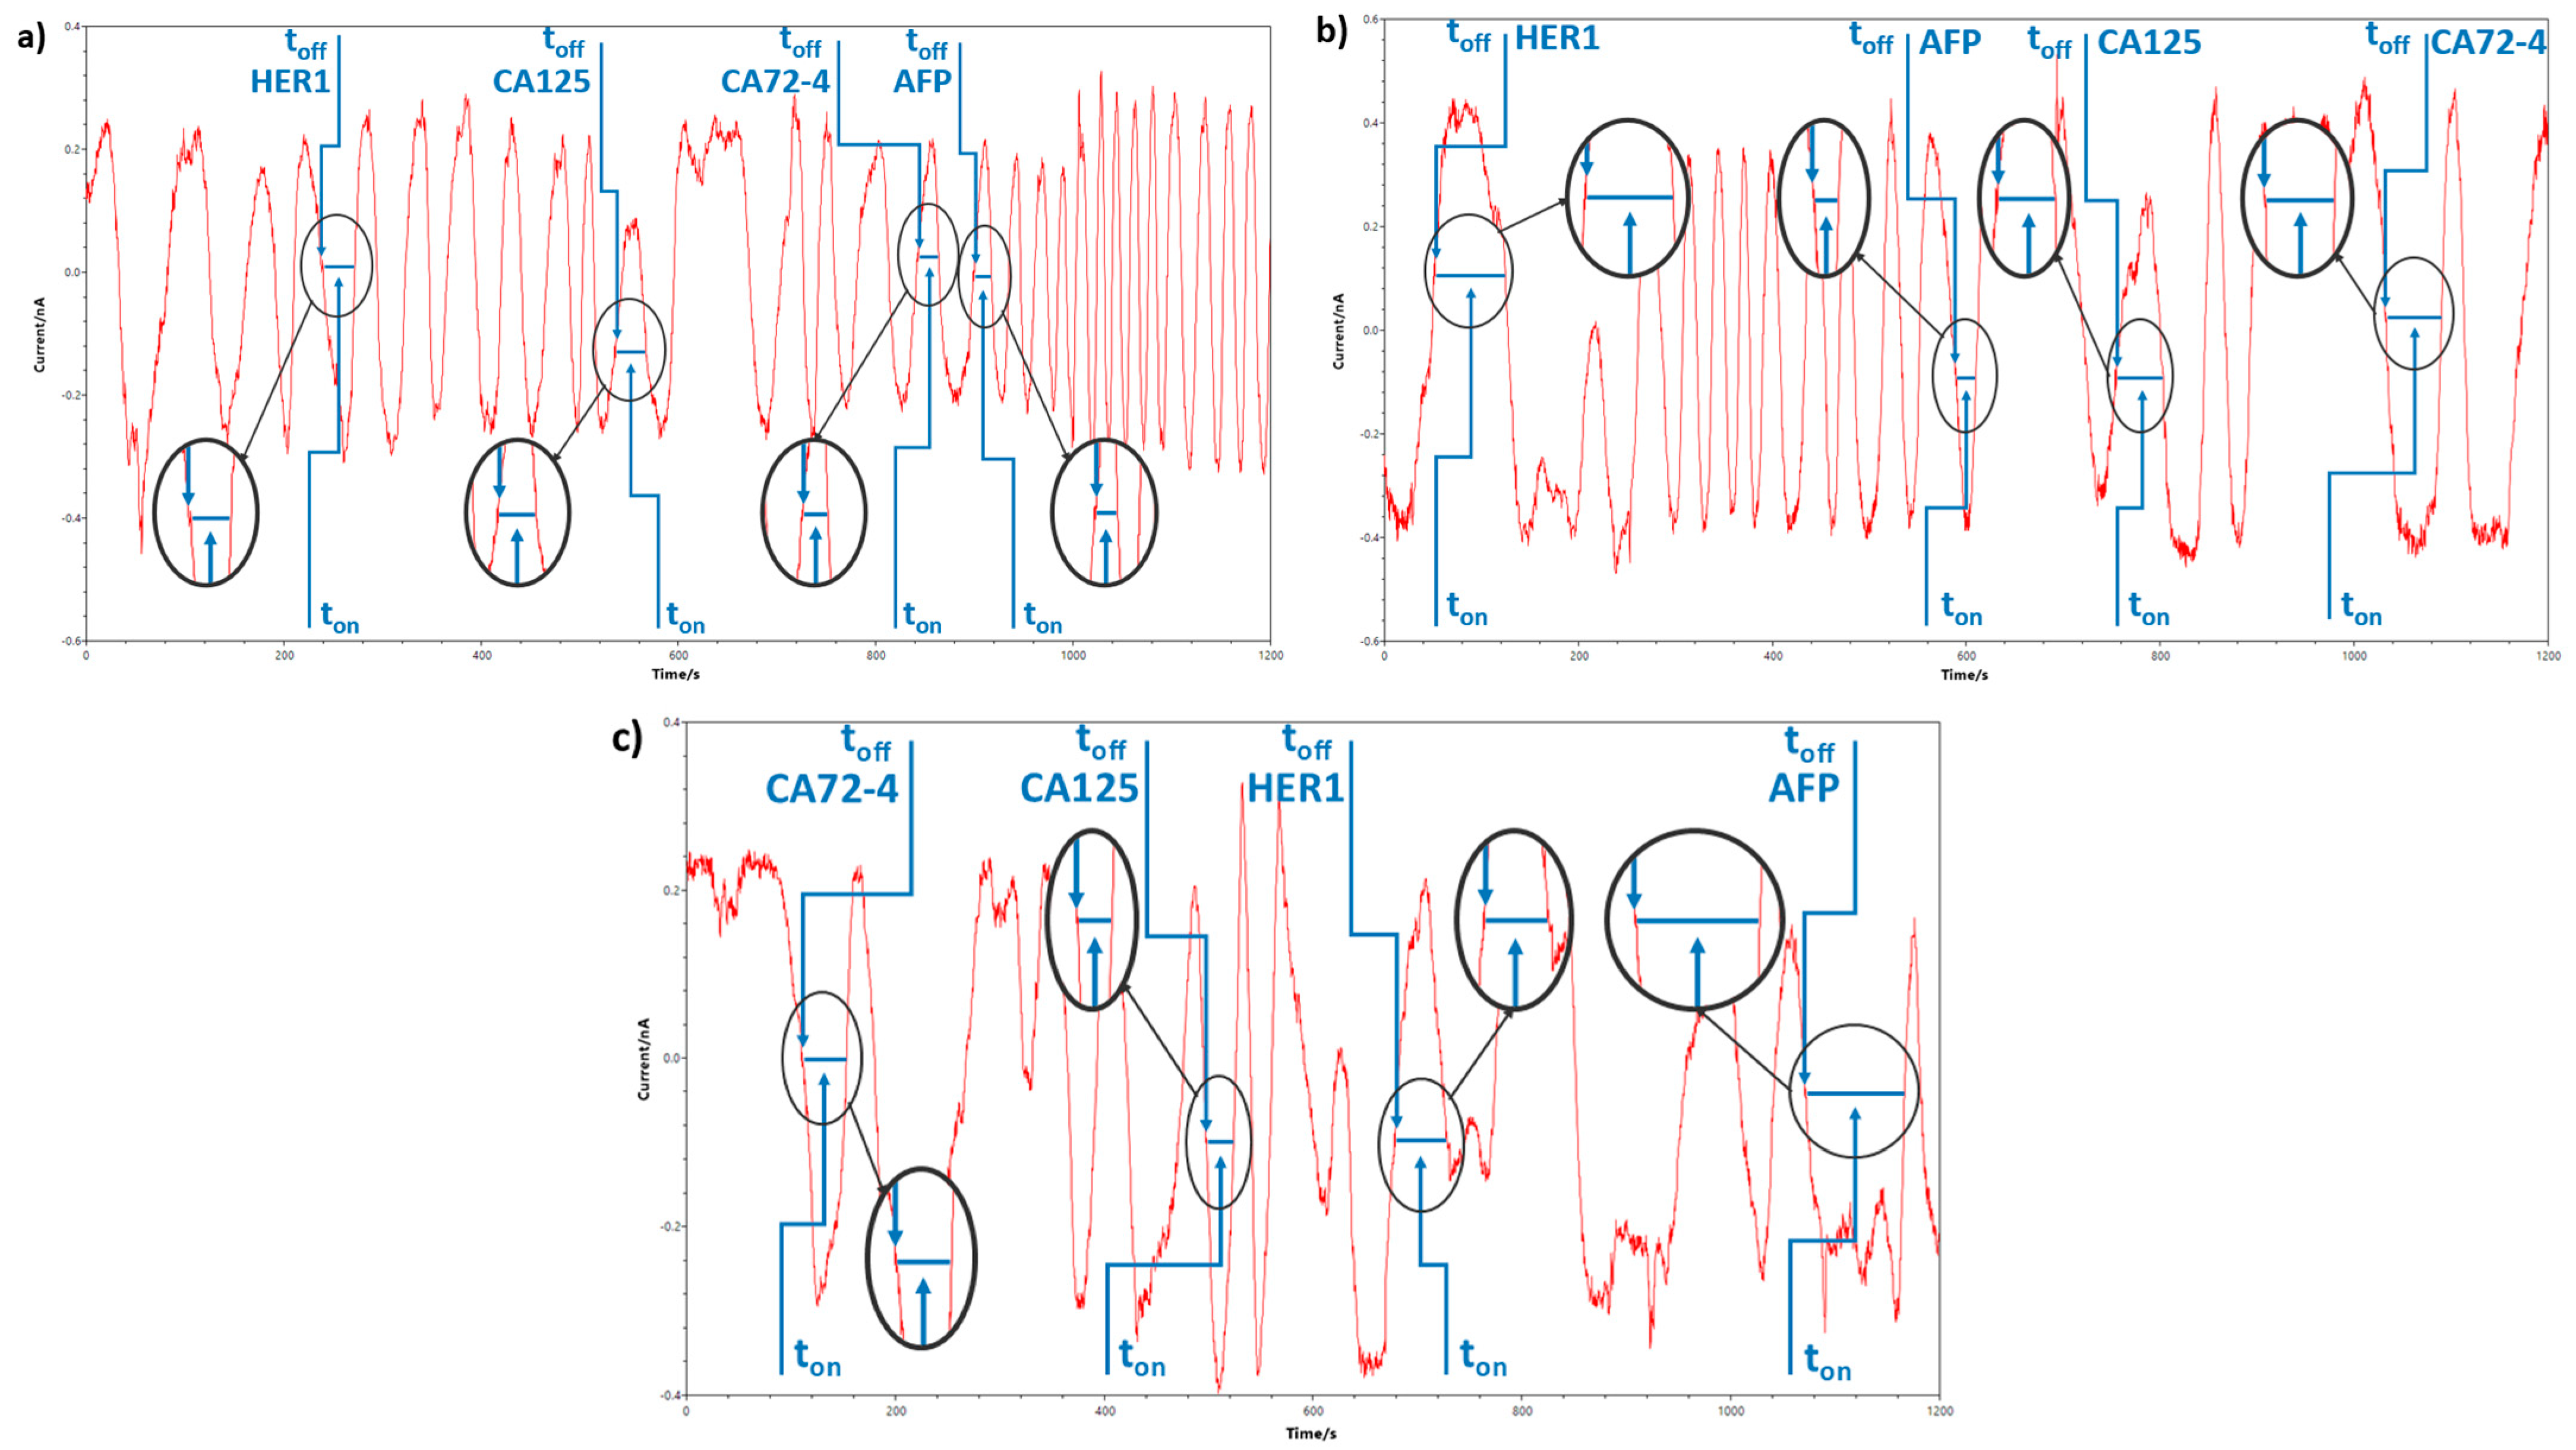
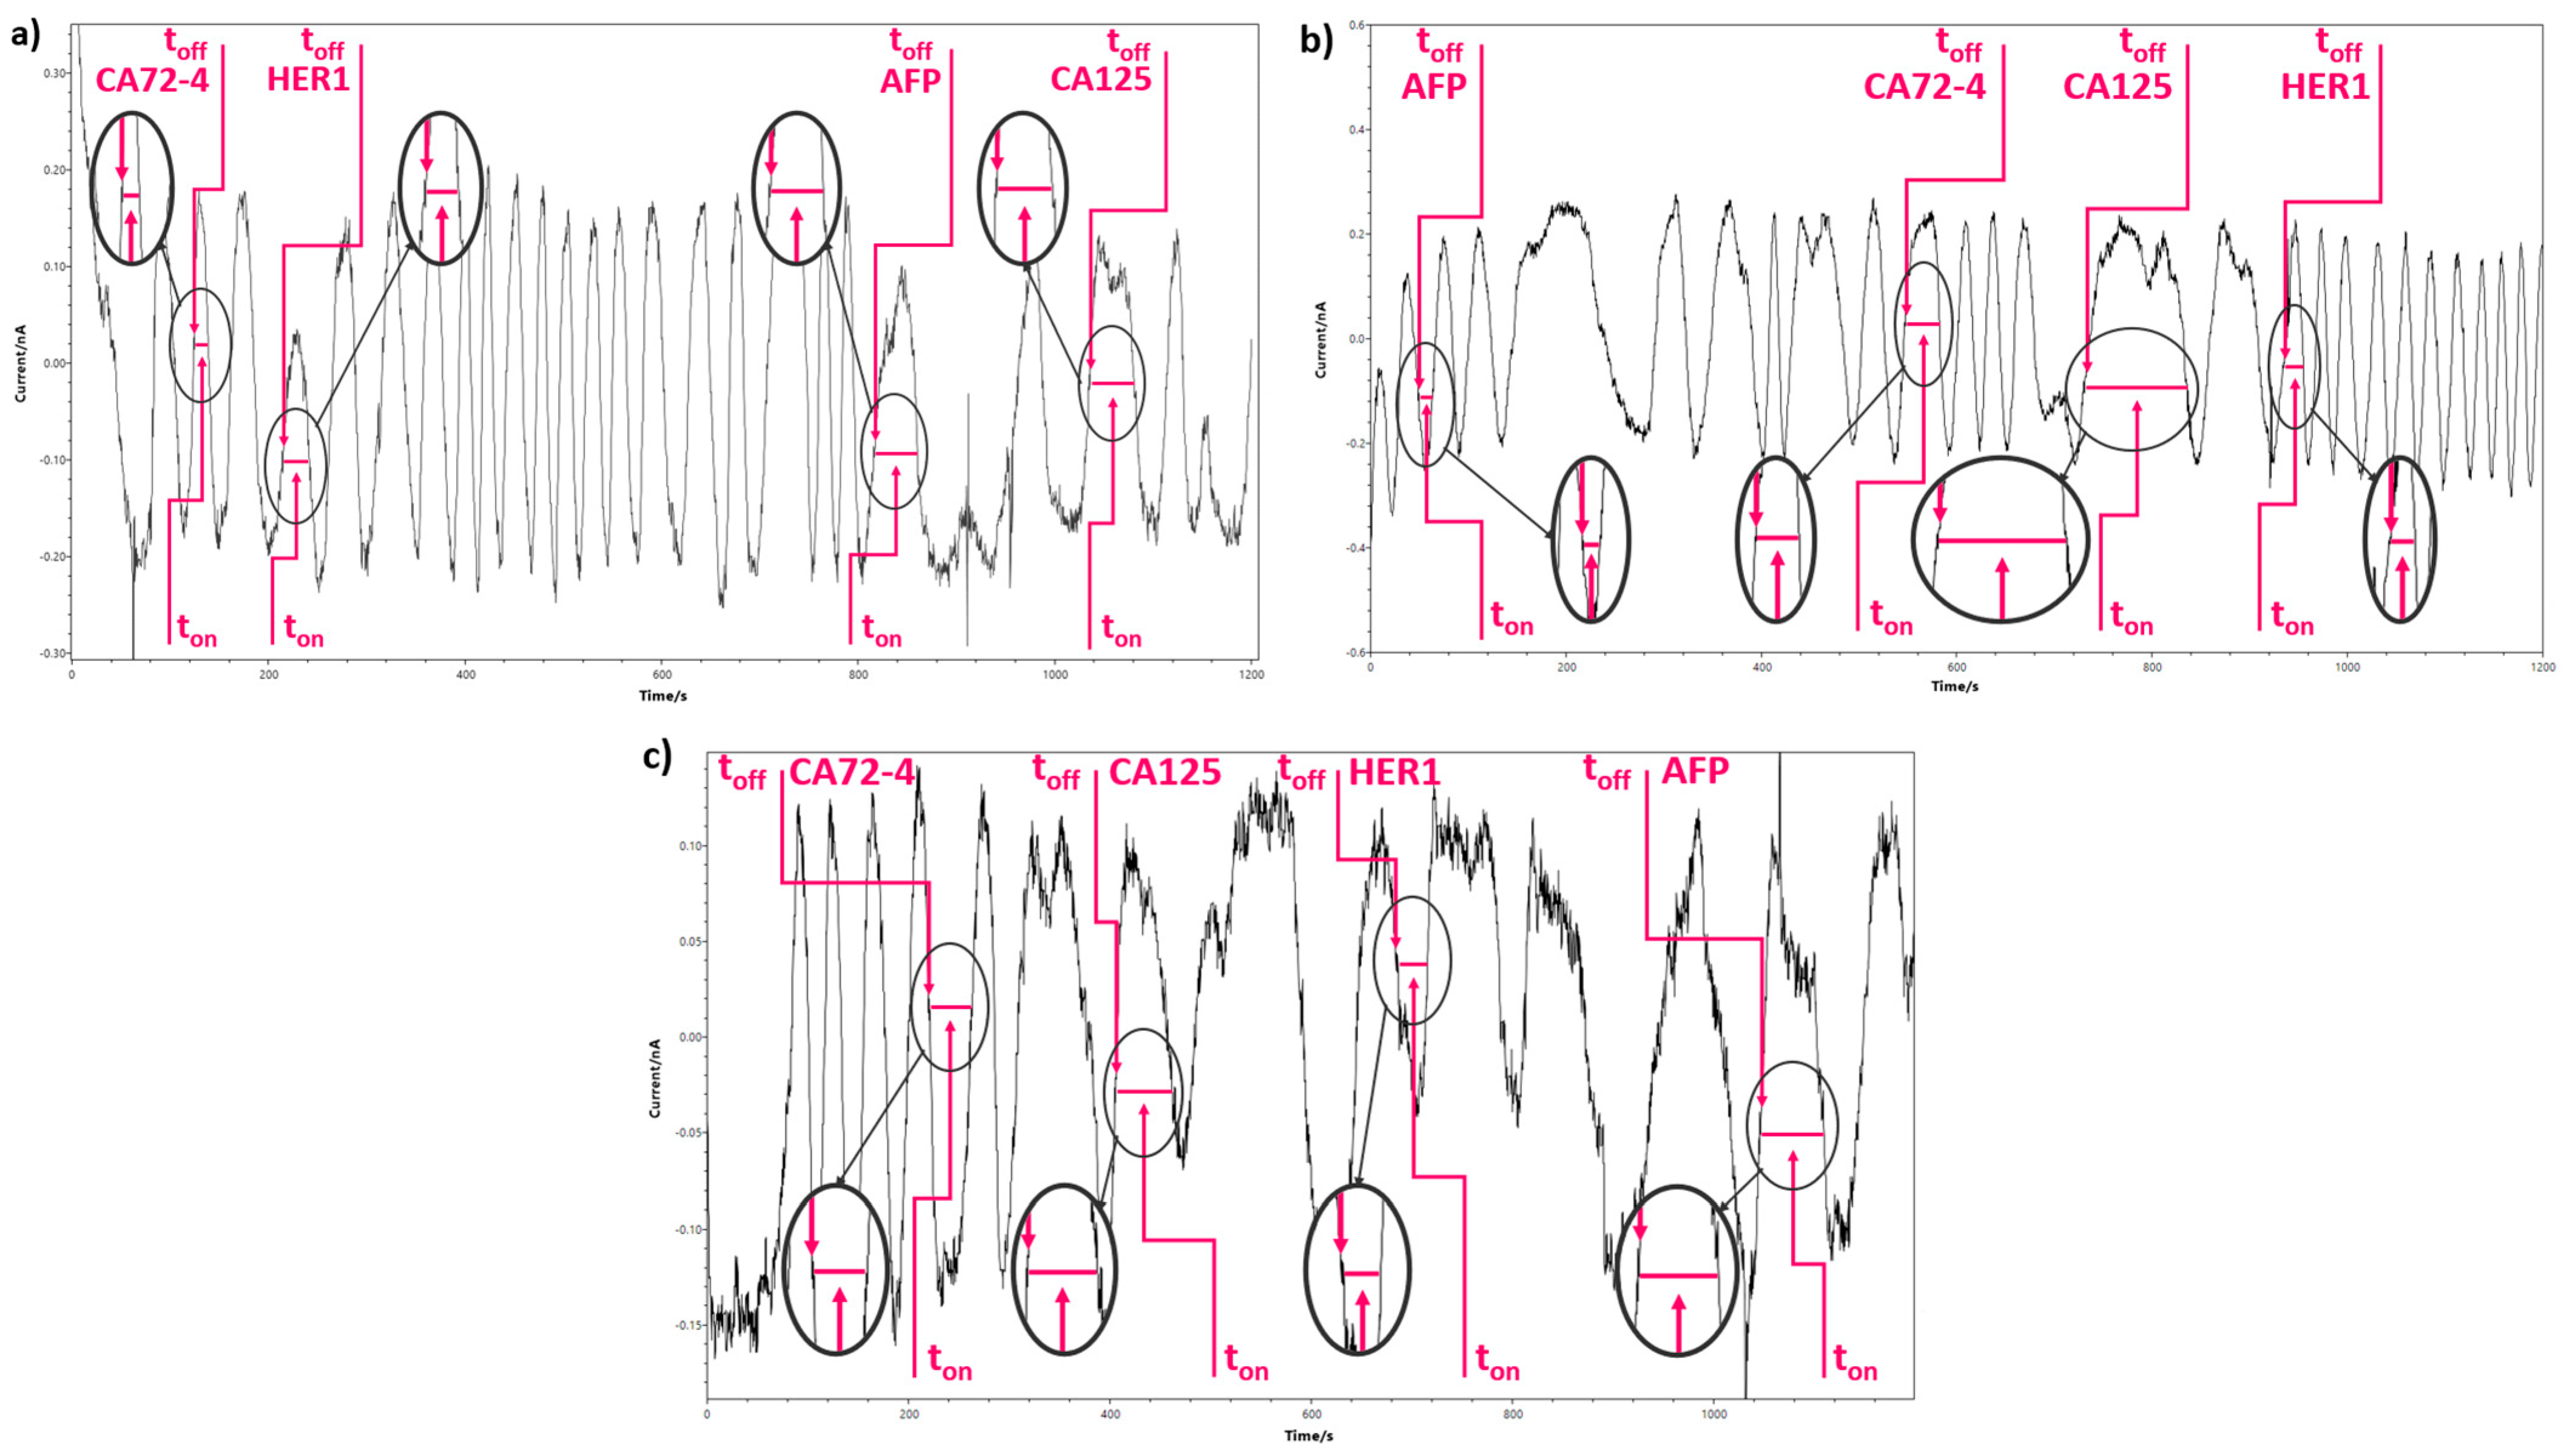
3.3. Response Characteristics of the Stochastic Sensors
3.4. Simultaneous Molecular Recognition and Determination of the Selected Biomarkers in Biological Samples
4. Conclusions
Author Contributions
Funding
Institutional Review Board Statement
Informed Consent Statement
Data Availability Statement
Acknowledgments
Conflicts of Interest
References
- Han, S.N.; Lotgerink, A.; Gziri, M.M.; Van Calsteren, K.; Hanssens, M.; Amant, F. Physiologic Variations of Serum Tumor Markers in Gynecological Malignancies during Pregnancy: A Systematic Review. BMC Med. 2012, 10, 86. [Google Scholar] [CrossRef] [PubMed]
- Chen, S.; Yu, Z.; Wang, Y.; Tang, J.; Zeng, Y.; Liu, X.; Tang, D. Block-Polymer-Restricted Sub-Nanometer Pt Nanoclusters Nanozyme-Enhanced Immunoassay for Monitoring of Cardiac Troponin I. Anal. Chem. 2023, 95, 14494–14501. [Google Scholar] [CrossRef] [PubMed]
- Yu, Z.; Tang, J.; Gong, H.; Gao, Y.; Zeng, Y.; Tang, D.; Liu, X. Enzyme-Encapsulated Protein Trap Engineered Metal–Organic Framework-Derived Biomineral Probes for Non-Invasive Prostate Cancer Surveillance. Adv. Funct. Mater. 2023, 33, 2301457. [Google Scholar] [CrossRef]
- Qiu, Z.; Shu, J.; Tang, D. Near-Infrared-to-Ultraviolet Light-Mediated Photoelectrochemical Aptasensing Platform for Cancer Biomarker Based on Core-Shell NaYF4:Yb,Tm@TiO2 Upconversion Microrods. Anal. Chem. 2018, 90, 1021–1028. [Google Scholar] [CrossRef]
- Chen, F.; Zhang, F.; Liu, Y.; Cai, C. Simply and Sensitively Simultaneous Detection Hepatocellular Carcinoma Markers AFP and MiRNA-122 by a Label-Free Resonance Light Scattering Sensor. Talanta 2018, 186, 473–480. [Google Scholar] [CrossRef]
- Sun, Z.-H.; Zhang, X.-X.; Xu, D.; Liu, J.; Yu, R.J.; Jing, C.; Han, H.X.; Ma, W. Silver-Amplified Fluorescence Immunoassay via Aggregation-Induced Emission for Detection of Disease Biomarker. Talanta 2021, 225, 121963. [Google Scholar] [CrossRef]
- Zhang, S.; Zhang, C.; Jia, Y.; Zhang, X.; Dong, Y.; Li, X.; Liu, Q.; Li, Y.; Zhao, Z. Sandwich-Type Electrochemical Immunosensor Based on Au@Pt DNRs/NH2-MoSe2 NSs Nanocomposite as Signal Amplifiers for the Sensitive Detection of Alpha-Fetoprotein. Bioelectrochemistry 2019, 128, 140–147. [Google Scholar] [CrossRef]
- Kal-Koshvandi, A.T. Recent Advances in Optical Biosensors for the Detection of Cancer Biomarker α-Fetoprotein (AFP). TrAC-Trends Anal. Chem. 2020, 128, 115920. [Google Scholar] [CrossRef]
- Wong, N.K.; Easton, R.L.; Panico, M.; Sutton-Smith, M.; Morrison, J.C.; Lattanzio, F.A.; Morris, H.R.; Clark, G.F.; Dell, A.; Patankar, M.S. Characterization of the Oligosaccharides Associated with the Human Ovarian Tumor Marker CA125. J. Biol. Chem. 2003, 278, 28619–28634. [Google Scholar] [CrossRef]
- Seelenmeyer, C.; Wegehingel, S.; Lechner, J.; Nickel, W. The Cancer Antigen CA125 Represents a Novel Counter Receptor for Galectin-1. J. Cell Sci. 2003, 116, 1305–1318. [Google Scholar] [CrossRef]
- Gong, X.; Zhang, H. Diagnostic and Prognostic Values of Anti-Helicobacter Pylori Antibody Combined with Serum CA724, CA19-9, and CEA for Young Patients with Early Gastric Cancer. J. Clin. Lab. Anal. 2020, 34, e23268. [Google Scholar] [CrossRef] [PubMed]
- Ding, J.; Zhang, H.; Wu, Z. Study on the Differential Value of Tumor Marker CA724 on Primary Gastric Cancer. J. Oncol. 2021, 2021, 2929233. [Google Scholar] [CrossRef] [PubMed]
- Chen, X.-Z.; Zhang, W.-K.; Yang, K.; Wang, L.-L.; Liu, J.; Wang, L.; Hu, J.-K.; Zhang, B.; Chen, Z.-X.; Chen, J.-P.; et al. Correlation between Serum CA724 and Gastric Cancer: Multiple Analyses Based on Chinese Population. Mol. Biol. Rep. 2012, 39, 9031–9039. [Google Scholar] [CrossRef]
- Ciardiello, F.; Tortora, G. EGFR Antagonists in Cancer Treatment. N. Engl. J. Med. 2008, 358, 1160–1174. [Google Scholar] [CrossRef]
- Elshafey, R.; Tavares, A.C.; Siaj, M.; Zourob, M. Electrochemical Impedance Immunosensor Based on Gold Nanoparticles-Protein G for the Detection of Cancer Marker Epidermal Growth Factor Receptor in Human Plasma and Brain Tissue. Biosens. Bioelectron. 2013, 50, 143–149. [Google Scholar] [CrossRef]
- Nicholson, R.I.; Gee, J.M.W.; Harper, M.E. EGFR and Cancer Prognosis. Eur. J. Cancer 2001, 37, S9–S15. [Google Scholar] [CrossRef]
- Ilkhani, H.; Sarparast, M.; Noori, A.; Bathaie, S.Z.; Mousavi, M.F. Electrochemical Aptamer/Antibody Based Sandwich Immunosensor for the Detection of EGFR, a Cancer Biomarker, Using Gold Nanoparticles as a Signaling Probe. Biosens. Bioelectron. 2015, 74, 491–497. [Google Scholar] [CrossRef] [PubMed]
- Ilyas, A.; Asghar, W.; Allen, P.B.; Duhon, H.; Ellington, A.D.; Iqbal, S.M. Electrical Detection of Cancer Biomarker Using Aptamers with Nanogap Break-Junctions. Nanotechnology 2012, 23, 275502. [Google Scholar] [CrossRef]
- Zhang, B.; Ding, H.; Chen, Q.; Wang, T.; Zhang, K. Prussian Blue Nanoparticle-Labeled Aptasensing Platform on Graphene Oxide for Voltammetric Detection of α-Fetoprotein in Hepatocellular Carcinoma with Target Recycling. Analyst 2019, 144, 4858–4864. [Google Scholar] [CrossRef]
- Wang, X.-W.; Xu, B. Stimulation of Tumor-Cell Growth by Alpha-Fetoprotein. Int. J. Cancer 1998, 75, 596–599. [Google Scholar] [CrossRef]
- Wilson, M.S.; Nie, W. Multiplex Measurement of Seven Tumor Markers Using an Electrochemical Protein Chip. Anal. Chem. 2006, 78, 6476–6483. [Google Scholar] [CrossRef]
- Faraggi, D.; Kramar, A. Methodological Issues Associated with Tumor Marker Development Biostatistical Aspects. Urol. Oncol. 2000, 5, 211–213. [Google Scholar] [CrossRef]
- Jiang, W.; Yuan, R.; Chai, Y.-Q.; Yin, B. Amperometric Immunosensor Based on Multiwalled Carbon Nanotubes/Prussian Blue/Nanogold-Modified Electrode for Determination of α-Fetoprotein. Anal. Biochem. 2010, 407, 65–71. [Google Scholar] [CrossRef]
- Kim, J.; Kim, J.; Rho, T.H.D.; Lee, J.H. Rapid Chemiluminescent Sandwich Enzyme Immunoassay Capable of Consecutively Quantifying Multiple Tumor Markers in a Sample. Talanta 2014, 129, 106–112. [Google Scholar] [CrossRef] [PubMed]
- Ambrosi, A.; Airò, F.; Merkoçi, A. Enhanced Gold Nanoparticle Based ELISA for a Breast Cancer Biomarker. Anal. Chem. 2010, 82, 1151–1156. [Google Scholar] [CrossRef] [PubMed]
- Terenghi, M.; Elviri, L.; Careri, M.; Mangia, A.; Lobinski, R. Multiplexed Determination of Protein Biomarkers Using Metal-Tagged Antibodies and Size Exclusion Chromatography-Inductively Coupled Plasma Mass Spectrometry. Anal. Chem. 2009, 81, 9440–9448. [Google Scholar] [CrossRef] [PubMed]
- Xu, X.; Ji, J.; Chen, P.; Wu, J.; Jin, Y.; Zhang, L.; Du, S. Salt-Induced Gold Nanoparticles Aggregation Lights up Fluorescence of DNA-Silver Nanoclusters to Monitor Dual Cancer Markers Carcinoembryonic Antigen and Carbohydrate Antigen 125. Anal. Chim. Acta 2020, 1125, 41–49. [Google Scholar] [CrossRef]
- Sallam, K.M.; El-Bayoumy, A.S.A.; Mehany, N.L. Development of Solid Phase Immunoradiometric Assay for Determination of Carcinoembryonic Antigen as a Tumor Marker. J. Radioanal. Nucl. Chem. 2016, 307, 1375–1383. [Google Scholar] [CrossRef]
- Stefan-Van Staden, R.I. Perspective—Challenges in Biomedical Analysis: From Classical Sensors to Stochastic Sensors. ECS Sens. Plus 2022, 1, 11603. [Google Scholar] [CrossRef]
- Chugh, V.; Basu, A.; Kaushik, A.; Basu, A.K. Progression in Quantum Sensing/Bio-Sensing Technologies for Healthcare. ECS Sens. Plus 2023, 2, 15001. [Google Scholar] [CrossRef]
- Wu, M.-Y.; Mo, R.-J.; Chen, S.; Rafique, S.; Bian, S.-J.; Tang, Y.-J.; Li, Z.-Q.; Xia, X.-H. Beta-Cyclodextrin-Modified Covalent Organic Framework Nanochannel for Electrochemical Chiral Recognition of Amino Acids. Anal. Chem. 2024, 96, 17665–17671. [Google Scholar] [CrossRef] [PubMed]
- Zhang, X.; Dai, Y.; Sun, J.; Shen, J.; Lin, M.; Xia, F. Solid-State Nanopore/Nanochannel Sensors with Enhanced Selectivity through Pore-in Modification. Anal. Chem. 2024, 96, 2277–2285. [Google Scholar] [CrossRef]
- Herrera-Pariente, C.; Montori, S.; Llach, J.; Bofill, A.; Albeniz, E.; Moreira, L. Biomarkers for Gastric Cancer Screening and Early Diagnosis. Biomedicines 2021, 9, 1448. [Google Scholar] [CrossRef] [PubMed]
- He, X.-P.; Hu, X.-L.; James, T.D.; Yoon, J.; Tian, H. Multiplexed photoluminescent sensors: Towards improved disease diagnostics. Chem. Soc. Rev. 2017, 46, 6687–6696. [Google Scholar] [CrossRef]
- Wang, H.; Li, S.; Lu, H.; Zhu, M.; Liang, H.; Wu, X.; Zhang, Y. Carbon-Based Flexible Devices for Comprehensive Health Monitoring. Small Methods 2023, 7, 2201340. [Google Scholar] [CrossRef]
- Negut, C.; Pintilie, L.; Tanase, C.; Udeanu, D.I.; Draghici, C.; Munteanu, C.; Morosan, E. Oleic Acid Amides With Potential Pharmacological Effects in the Overweight Treatment. Rev. Chim. 2018, 69, 790–794. [Google Scholar] [CrossRef]
- McClements, J.; Seumo Tchekwagep, P.M.; Vilela Strapazon, A.L.; Canfarotta, F.; Thomson, A.; Czulak, J.; Johnson, R.E.; Novakovic, K.; Losada-Pérez, P.; Zaman, A.; et al. Immobilization of Molecularly Imprinted Polymer Nanoparticles onto Surfaces Using Different Strategies: Evaluating the Influence of the Functionalized Interface on the Performance of a Thermal Assay for the Detection of the Cardiac Biomarker Troponin I. ACS Appl. Mater. Interfaces 2021, 13, 27868–27879. [Google Scholar] [CrossRef]
- Rebelo, T.S.C.R.; Costa, R.; Brandão, A.T.S.C.; Silva, A.F.; Sales, M.G.F.; Pereira, C.M. Molecularly imprinted polymer SPE sensor for analysis of CA-125 on serum. Anal. Chim. Acta 2019, 1082, 126–135. [Google Scholar] [CrossRef]
- Gao, J.; Zhang, S.; Xi, F. Homogeneous Aptasensor with Electrochemical and Electrochemiluminescence Dual Detection Channels Enabled by Nanochannel-Based Probe Enrichment and DNase I Cleavage for Tumor Biomarker Detection. Molecules 2025, 30, 746. [Google Scholar] [CrossRef]
- Attia, M.; Ali, K.; El-Kemary, M.; Darwish, W. Phthalocyanine-Doped Polystyrene Fluorescent Nanocomposite as a Highly Selective Biosensor for Quantitative Determination of Cancer Antigen 125. Talanta 2019, 201, 185–193. [Google Scholar] [CrossRef]
- Zong, C.; Kong, L.; Qiu, W.; Xv, H.; Li, C.; Li, C. Photoelectrochemical detection of dual biomarker based on AND logic gate for subtype identification of gastric cancer. Sens. Actuators B Chem. 2025, 424, 136930. [Google Scholar] [CrossRef]
- Shao, H.; Zhao, L.; Liu, Z.; Li, J. An epitope imprinted electrochemical sensor for highly sensitive and selective determination of prostate-specific antigen. Microchim. Acta 2024, 191, 660. [Google Scholar] [CrossRef] [PubMed]
- Chandio, I.; Cheung, S.; Wu, L.; Cui, M.; Ai, Y.; Liang, Q. Engineered rGO-AuNPs@MXene hybrid nanocomposites for highly efficient electrochemical aptasensing of alpha-fetoprotein. Microchem. J. 2025, 214, 113952. [Google Scholar] [CrossRef]
- Su, L.T.; Yang, Z.Q.; Peng, H.P.; Liu, A.L. A Dual Nano-Signal Probe-Based Electrochemical Immunosensor for the Simultaneous Detection of Two Biomarkers in Gastric Cancer. Biosensors 2025, 15, 80. [Google Scholar] [CrossRef]
- Yan, Q.; Wu, R.; Wang, J.; Zeng, T.; Yang, L. An ultrasensitive sandwich-type electrochemical immunosensor based on rGO-TEPA/ZIF67@ZIF8/Au and AuPdRu for the detection of tumor markers CA72-4. Bioelectrochemistry 2024, 160, 108755. [Google Scholar] [CrossRef]
- Luo, K.; Zhao, C.; Luo, Y.; Pan, C.; Li, J. Electrochemical sensor for the simultaneous detection of CA72-4 and CA19-9 tumor markers using dual recognition via glycosyl imprinting and lectin-specific binding for accurate diagnosis of gastric cancer. Biosens. Bioelectron. 2022, 216, 114672. [Google Scholar] [CrossRef]
- Wignarajah, S.; Chianella, I.; Tothill, I.E. Development of Electrochemical Immunosensors for HER-1 and HER-2 Analysis in Serum for Breast Cancer Patients. Biosensors 2023, 13, 355. [Google Scholar] [CrossRef] [PubMed]
- Ganbold, E.; Kim, N.Y.; Kim, Y.M.; Sharma, P.K.; Lee, D.N.; Oh, B.; Kim, H.S.; Song, J.; Lee, B.; Kim, E.S.; et al. Reagentless aptamer based on the ultrasensitive and fast response electrochemical capacitive biosensor for EGFR detection in non-small cell lung cancer. Biosens. Bioelectron. 2025, 278, 117319. [Google Scholar] [CrossRef]
- Wang, Y.; Sun, S.; Luo, J.; Xiong, Y.; Ming, T.; Liu, J.; Ma, Y.; Yan, S.; Yang, Y.; Yang, Z.; et al. Low sample volume origami-paper-based graphene-modified aptasensors for label-free electrochemical detection of cancer biomarker-EGFR. Microsyst. Nanoeng. 2020, 6, 32. [Google Scholar] [CrossRef]


| Sensor Based on Oleamide OL and | Biomarker | toff (s) | Calibration Equation; Correlation Coefficient (r) | Sensitivity | LOQ | Working Concentration Range |
|---|---|---|---|---|---|---|
| GR | CA125 * | 3.4 | 1/ton = 0.05 + 5.25 × 10⁶ × Cr = 0.9996 | 5.25 × 10⁶ | 8.37 × 10⁻¹³ | 8.37 × 10⁻¹³–8.37 |
| CA72-4 * | 2.0 | 1/ton = 0.03 + 1.37 × 10⁹ × Cr = 0.9995 | 1.37 × 10⁹ | 4.00 × 10⁻¹⁶ | 4.00 × 10⁻¹⁶–4.00 × 10⁻¹ | |
| HER1 ** | 2.9 | 1/ton = 0.02 + 5.48 × 10⁶ × Cr = 0.9999 | 5.48 × 10⁶ | 3.90 × 10⁻¹⁵ | 3.90 × 10⁻¹⁵–3.90 × 10⁻⁵ | |
| AFP ** | 2.7 | 1/ton = 0.02 + 1.98 × 10⁸ × Cr = 0.9999 | 1.98 × 10⁸ | 3.00 × 10⁻²⁰ | 3.00 × 10⁻²⁰–3.00 × 10⁻⁴ | |
| G | CA125 * | 2.3 | 1/ton = 0.06 + 8.95 × 10⁸ × Cr = 0.9993 | 8.95 × 10⁸ | 8.37 × 10⁻¹⁴ | 8.37 × 10⁻¹⁴–8.37 |
| CA72-4 * | 1.6 | 1/ton = 0.03 + 7.57 × 10⁶ × Cr = 0.9999 | 7.57 × 10⁶ | 4.00 × 10⁻¹¹ | 4.00 × 10⁻¹¹–4.00 × 10⁻³ | |
| HER1 ** | 3.4 | 1/ton = 0.01 + 1.65 × 10¹² × Cr = 0.9999 | 1.65 × 10¹² | 3.90 × 10⁻¹⁶ | 3.90 × 10⁻¹⁶–3.90 × 10⁻⁶ | |
| AFP ** | 1.9 | 1/ton = 0.13 + 2.77 × 10¹⁰ × Cr = 0.9999 | 2.77 × 10¹⁰ | 3.00 × 10⁻²⁰ | 3.00 × 10⁻²⁰–3.00 × 10⁻⁶ | |
| nGR | CA125 * | 2.2 | 1/ton = 0.08 + 3.71 × 10⁶ × Cr = 0.9995 | 3.71 × 10⁶ | 8.37 × 10⁻¹¹ | 8.37 × 10⁻¹¹–8.37 × 10⁻³ |
| CA72-4 * | 3.3 | 1/ton = 0.04 + 6.96 × 10⁹ × Cr = 0.9950 | 6.96 × 10⁹ | 4.00 × 10⁻¹⁴ | 4.00 × 10⁻¹⁴–4.00 × 10⁻² | |
| HER1 ** | 6.6 | 1/ton = 0.01 + 3.90 × 10¹⁰ × Cr = 0.9971 | 3.90 × 10¹⁰ | 3.90 × 10⁻¹⁵ | 3.90 × 10⁻¹⁵–3.90 × 10⁻⁶ | |
| AFP ** | 1.5 | 1/ton = 0.04 + 3.63 × 10⁹ × Cr = 0.9999 | 3.63 × 10⁹ | 3.00 × 10⁻²⁰ | 3.00 × 10⁻²⁰–3.00 × 10⁻³ |
| Sample | CA125 (nU mL−1) | CA72-4 (nU mL−1) | HER-1 (ng mL−1) | AFP (ng mL−1) |
|---|---|---|---|---|
| Whole blood | ||||
| 1 | 75.70 ± 0.04 | 47.36 ± 0.03 | 22.24 ± 0.01 | 26.03 ± 0.02 |
| 2 | 5.70 ± 0.01 | 2.37 ± 0.04 | 6.34 ± 0.02 | 6.71 ± 0.01 |
| 3 | 5.03 ± 0.02 | 8.69 ± 0.01 | 4.38 ± 0.02 | 2.03 ± 0.04 |
| 4 | 20.12 ± 0.01 | 1.78 ± 0.03 | 4.43 ± 0.03 | 217.79 ± 0.02 |
| 5 | 81.54 ± 0.02 | 8.99 ± 0.04 | 6.17 ± 0.02 | 4.99 ± 0.03 |
| 6 | 5.77 ± 0.01 | 6.68 ± 0.02 | 14.17 ± 0.01 | 29.6 ± 0.02 |
| 7 | 21.34 ± 0.02 | 6.06 ± 0.04 | 5.19 ± 0.01 | 2.91 ± 0.03 |
| 8 | 29.20 ± 0.01 | 9.99 ± 0.03 | 35.45 ± 0.02 | 4.67 ± 0.04 |
| 9 | 39.94 ± 0.02 | 67.38 ± 0.01 | 8.62 ± 0.01 | 714.69 ± 0.05 |
| 10 | 9.79 ± 0.01 | 41.99 ± 0.02 | 21.04 ± 0.03 | 2.15 ± 0.03 |
| Gastric tissue tumor | ||||
| 1 | 11.28 ± 0.04 | 1.47 ± 0.03 | 11.91 ± 0.03 | 9.33 ± 0.02 |
| 2 | 15.73 ± 0.02 | 5.40 ± 0.02 | 6.15 ± 0.02 | 27.05 ± 0.04 |
| 3 | 75.69 ± 0.04 | 2.40 ± 0.01 | 3.50 ± 0.01 | 55.56 ± 0.01 |
| 4 | 3.41 ± 0.01 | 8.58 ± 0.02 | 12.96 ± 0.02 | 4.15 ± 0.02 |
| 5 | 4.44 ± 0.02 | 12.85 ± 0.03 | 6.68 ± 0.01 | 26.46 ± 0.01 |
| 6 | 41.30 ± 0.02 | 10.65 ± 0.01 | 3.84 ± 0.02 | 2.65 ± 0.02 |
| 7 | 18.41 ± 0.03 | 1.38 ± 0.03 | 6.93 ± 0.01 | 2.30 ± 0.01 |
| 8 | 28.38 ± 0.01 | 3.13 ± 0.02 | 6.76 ± 0.02 | 755.95 ± 0.03 |
| 9 | 75.89 ± 0.02 | 21.03 ± 0.01 | 3.75 ± 0.01 | 179.50 ± 0.03 |
| 10 | 5.78 ± 0.03 | 3.04 ± 0.03 | 1.27 ± 0.03 | 15.13 ± 0.01 |
| Saliva | ||||
| 1 | 4.90 ± 0.03 | 13.22 ± 0.03 | 16.20 ± 0.03 | 6.85 ± 0.03 |
| 2 | 123.95 ± 0.02 | 4.30 ± 0.02 | 9.96 ± 0.02 | 2.60 ± 0.02 |
| 3 | 7.98 ± 0.03 | 7.48 ± 0.01 | 26.96 ± 0.01 | 0.96 ± 0.02 |
| 4 | 4.44 ± 0.02 | 6.51 ± 0.02 | 8.71 ± 0.01 | 64.68 ± 0.03 |
| 5 | 5.89 ± 0.01 | 5.94 ± 0.03 | 3.25 ± 0.01 | 723.04 ± 0.01 |
| 6 | 93.48 ± 0.01 | 22.40 ± 0.01 | 11.15 ± 0.02 | 17.17 ± 0.04 |
| 7 | 4.35 ± 0.02 | 9.40 ± 0.02 | 2.83 ± 0.04 | 68.67 ± 0.01 |
| 8 | 2.28 ± 0.03 | 22.93 ± 0.02 | 7.27 ± 0.03 | 1.48 ± 0.03 |
| 9 | 2.20 ± 0.01 | 3.73 ± 0.01 | 7.95 ± 0.01 | 318.15 ± 0.01 |
| 10 | 17.57 ± 0.02 | 10.30 ± 0.03 | 16.82 ± 0.02 | 1.04 ± 0.03 |
| Urine | ||||
| 1 | 9.79 ± 0.01 | 1.94 ± 0.02 | 6.58 ± 0.01 | 2.96 ± 0.03 |
| 2 | 3.31 ± 0.02 | 3.31 ± 0.03 | 3.06 ± 0.02 | 17.15 ± 0.02 |
| 3 | 11.67 ± 0.01 | 4.76 ± 0.02 | 5.95 ± 0.03 | 2.18 ± 0.02 |
| 4 | 14.15 ± 0.02 | 15.23 ± 0.01 | 8.77 ± 0.02 | 24.15 ± 0.01 |
| 5 | 10.19 ± 0.01 | 11.12 ± 0.02 | 18.91 ± 0.03 | 4.84 ± 0.03 |
| 6 | 1.65 ± 0.02 | 6.29 ± 0.01 | 2.38 ± 0.02 | 20.46 ± 0.01 |
| 7 | 4.54 ± 0.02 | 22.40 ± 0.02 | 18.04 ± 0.01 | 29.65 ± 0.03 |
| 8 | 4.70 ± 0.03 | 26.56 ± 0.03 | 9.28 ± 0.03 | 4.32 ± 0.02 |
| 9 | 9.44 ± 0.02 | 15.31 ± 0.02 | 1.27 ± 0.02 | 39.40 ± 0.01 |
| 10 | 4.54 ± 0.01 | 81.26 ± 0.02 | 28.01 ± 0.01 | 73.81 ± 0.02 |
| Sample | CA125 (nU mL−1) | CA72-4 (nU mL−1) | HER-1 (ng mL−1) | AFP (ng mL−1) |
|---|---|---|---|---|
| Whole blood | ||||
| 1 | 75.02 ± 0.03 | 46.54 ± 0.01 | 22.35 ± 0.02 | 26.24 ± 0.03 |
| 2 | 5.80 ± 0.02 | 2.89 ± 0.01 | 6.69 ± 0.01 | 6.72 ± 0.01 |
| 3 | 6.00 ± 0.01 | 8.52 ± 0.03 | 4.99 ± 0.01 | 2.52 ± 0.02 |
| 4 | 22.94 ± 0.03 | 1.40 ± 0.01 | 4.86 ± 0.01 | 216.97 ± 0.02 |
| 5 | 81.74 ± 0.02 | 8.77 ± 0.01 | 6.18 ± 0.03 | 4.91 ± 0.01 |
| 6 | 5.68 ± 0.01 | 6.02 ± 0.01 | 14.53 ± 0.01 | 29.63 ± 0.02 |
| 7 | 21.02 ± 0.03 | 6.17 ± 0.03 | 5.78 ± 0.03 | 2.90 ± 0.01 |
| 8 | 29.47 ± 0.02 | 10.15 ± 0.02 | 35.76 ± 0.02 | 4.08 ± 0.02 |
| 9 | 39.46 ± 0.03 | 67.44 ± 0.01 | 8.01 ± 0.03 | 716.21 ± 0.01 |
| 10 | 10.04 ± 0.02 | 41.63 ± 0.02 | 21.83 ± 0.01 | 2.20 ± 0.01 |
| Gastric tissue tumor | ||||
| 1 | 11.92 ± 0.01 | 1.40 ± 0.02 | 12.21 ± 0.01 | 9.40 ± 0.01 |
| 2 | 15.17 ± 0.03 | 5.29 ± 0.01 | 6.10 ± 0.03 | 27.51 ± 0.01 |
| 3 | 75.78 ± 0.02 | 2.29 ± 0.03 | 3.48 ± 0.01 | 55.89 ± 0.02 |
| 4 | 3.47 ± 0.02 | 8.65 ± 0.01 | 12.45 ± 0.01 | 4.51 ± 0.01 |
| 5 | 4.24 ± 0.01 | 12.88 ± 0.02 | 6.60 ± 0.03 | 27.51 ± 0.01 |
| 6 | 41.01 ± 0.03 | 10.62 ± 0.01 | 3.60 ± 0.04 | 2.60 ± 0.01 |
| 7 | 18.57 ± 0.01 | 1.59 ± 0.01 | 6.39 ± 0.01 | 2.47 ± 0.03 |
| 8 | 28.86 ± 0.02 | 3.20 ± 0.02 | 6.80 ± 0.02 | 756.52 ± 0.01 |
| 9 | 75.78 ± 0.01 | 21.35 ± 0.01 | 3.79 ± 0.03 | 180.01 ± 0.03 |
| 10 | 5.74 ± 0.02 | 3.87 ± 0.02 | 1.95 ± 0.02 | 15.89 ± 0.04 |
| Saliva | ||||
| 1 | 4.78 ± 0.02 | 13.10 ± 0.01 | 16.22 ± 0.02 | 6.88 ± 0.01 |
| 2 | 123.00 ± 0.03 | 4.69 ± 0.02 | 9.50 ± 0.01 | 2.64 ± 0.02 |
| 3 | 7.90 ± 0.01 | 7.53 ± 0.03 | 26.56 ± 0.01 | 1.01 ± 0.03 |
| 4 | 4.26 ± 0.01 | 6.19 ± 0.01 | 8.32 ± 0.03 | 64.20 ± 0.02 |
| 5 | 5.64 ± 0.03 | 5.06 ± 0.01 | 3.30 ± 0.02 | 722.93 ± 0.01 |
| 6 | 93.70 ± 0.02 | 22.37 ± 0.02 | 11.69 ± 0.01 | 17.92 ± 0.02 |
| 7 | 4.39 ± 0.03 | 9.43 ± 0.03 | 1.94 ± 0.03 | 68.50 ± 0.01 |
| 8 | 2.38 ± 0.01 | 22.37 ± 0.01 | 7.20 ± 0.01 | 1.24 ± 0.02 |
| 9 | 1.92 ± 0.03 | 3.08 ± 0.02 | 7.60 ± 0.02 | 319.47 ± 0.01 |
| 10 | 17.15 ± 0.01 | 10.15 ± 0.01 | 15.12 ± 0.03 | 1.01 ± 0.02 |
| Urine | ||||
| 1 | 9.23 ± 0.03 | 1.95 ± 0.01 | 6.48 ± 0.02 | 2.69 ± 0.03 |
| 2 | 3.91 ± 0.02 | 3.08 ± 0.02 | 3.48 ± 0.01 | 17.42 ± 0.01 |
| 3 | 11.67 ± 0.03 | 4.41 ± 0.01 | 5.01 ± 0.03 | 2.69 ± 0.03 |
| 4 | 15.03 ± 0.04 | 15.95 ± 0.03 | 8.81 ± 0.02 | 24.21 ± 0.02 |
| 5 | 10.13 ± 0.01 | 11.30 ± 0.02 | 17.99 ± 0.02 | 4.72 ± 0.01 |
| 6 | 1.85 ± 0.02 | 6.18 ± 0.02 | 2.16 ± 0.01 | 20.15 ± 0.02 |
| 7 | 4.50 ± 0.03 | 22.37 ± 0.01 | 17.34 ± 0.02 | 29.45 ± 0.01 |
| 8 | 4.60 ± 0.01 | 26.67 ± 0.02 | 9.17 ± 0.01 | 4.70 ± 0.02 |
| 9 | 9.40 ± 0.01 | 15.12 ± 0.01 | 1.50 ± 0.02 | 40.02 ± 0.01 |
| 10 | 4.90 ± 0.02 | 81.58 ± 0.02 | 28.03 ± 0.01 | 73.19 ± 0.02 |
| Sample | CA12-5 (nU mL−1) | CA72-4 (nU mL−1) | HER-1 (ng mL−1) | AFP (ng mL−1) |
|---|---|---|---|---|
| Whole blood | ||||
| 1 | 74.98 ± 0.01 | 46.60 ± 0.02 | 22.20 ± 0.01 | 26.95 ± 0.04 |
| 2 | 5.78 ± 0.02 | 2.60 ± 0.04 | 6.63 ± 0.04 | 7.20 ± 0.03 |
| 3 | 5.45 ± 0.04 | 8.34 ± 0.01 | 4.34 ± 0.03 | 2.64 ± 0.02 |
| 4 | 22.36 ± 0.03 | 1.44 ± 0.02 | 4.88 ± 0.02 | 217.05 ± 0.03 |
| 5 | 81.61 ± 0.03 | 8.91 ± 0.03 | 6.26 ± 0.01 | 4.18 ± 0.02 |
| 6 | 5.20 ± 0.02 | 6.40 ± 0.02 | 14.51 ± 0.03 | 30.62 ± 0.01 |
| 7 | 21.27 ± 0.04 | 6.26 ± 0.04 | 5.30 ± 0.02 | 2.31 ± 0.02 |
| 8 | 28.59 ± 0.03 | 10.19 ± 0.02 | 35.95 ± 0.03 | 4.11 ± 0.03 |
| 9 | 39.38 ± 0.02 | 67.40 ± 0.01 | 8.85 ± 0.02 | 714.00 ± 0.04 |
| 10 | 9.18 ± 0.03 | 42.82 ± 0.02 | 21.70 ± 0.01 | 2.36 ± 0.03 |
| Gastric tissue tumor | ||||
| 1 | 11.88 ± 0.04 | 1.48 ± 0.01 | 11.48 ± 0.03 | 9.43 ± 0.02 |
| 2 | 15.97 ± 0.02 | 5.30 ± 0.02 | 6.23 ± 0.01 | 27.48 ± 0.03 |
| 3 | 75.00 ± 0.04 | 2.37 ± 0.04 | 3.07 ± 0.02 | 56.01 ± 0.04 |
| 4 | 3.31 ± 0.03 | 8.93 ± 0.03 | 12.35 ± 0.02 | 4.87 ± 0.02 |
| 5 | 4.94 ± 0.04 | 12.89 ± 0.01 | 6.93 ± 0.01 | 26.14 ± 0.03 |
| 6 | 41.40 ± 0.02 | 10.39 ± 0.04 | 3.56 ± 0.02 | 2.53 ± 0.02 |
| 7 | 18.48 ± 0.03 | 1.24 ± 0.03 | 6.26 ± 0.03 | 2.42 ± 0.01 |
| 8 | 28.25 ± 0.01 | 3.01 ± 0.04 | 6.82 ± 0.02 | 756.00 ± 0.03 |
| 9 | 75.15 ± 0.03 | 21.50 ± 0.03 | 3.70 ± 0.02 | 179.32 ± 0.02 |
| 10 | 5.70 ± 0.02 | 3.36 ± 0.01 | 1.75 ± 0.02 | 15.21 ± 0.01 |
| Saliva | ||||
| 1 | 4.70 ± 0.01 | 13.15 ± 0.04 | 16.33 ± 0.04 | 6.80 ± 0.02 |
| 2 | 123.58 ± 0.02 | 4.90 ± 0.03 | 9.80 ± 0.01 | 2.57 ± 0.03 |
| 3 | 8.02 ± 0.01 | 6.73 ± 0.05 | 26.49 ± 0.03 | 1.12 ± 0.03 |
| 4 | 4.94 ± 0.03 | 6.64 ± 0.01 | 8.54 ± 0.04 | 64.58 ± 0.01 |
| 5 | 5.18 ± 0.02 | 5.28 ± 0.03 | 3.28 ± 0.02 | 723.15 ± 0.04 |
| 6 | 93.95 ± 0.04 | 22.31 ± 0.04 | 11.23 ± 0.03 | 17.87 ± 0.03 |
| 7 | 4.47 ± 0.01 | 9.57 ± 0.01 | 2.11 ± 0.03 | 69.59 ± 0.04 |
| 8 | 2.47 ± 0.02 | 22.94 ± 0.03 | 7.11 ± 0.02 | 1.59 ± 0.01 |
| 9 | 2.68 ± 0.01 | 3.85 ± 0.01 | 7.73 ± 0.02 | 318.20 ± 0.02 |
| 10 | 17.03 ± 0.02 | 10.66 ± 0.02 | 16.49 ± 0.01 | 1.00 ± 0.01 |
| Urine | ||||
| 1 | 9.89 ± 0.03 | 1.93 ± 0.02 | 6.49 ± 0.01 | 2.90 ± 0.02 |
| 2 | 3.35 ± 0.01 | 3.65 ± 0.02 | 3.66 ± 0.02 | 17.13 ± 0.03 |
| 3 | 11.70 ± 0.02 | 4.66 ± 0.01 | 5.27 ± 0.01 | 2.73 ± 0.01 |
| 4 | 14.49 ± 0.01 | 16.56 ± 0.02 | 8.65 ± 0.02 | 24.03 ± 0.02 |
| 5 | 10.53 ± 0.01 | 10.91 ± 0.03 | 18.47 ± 0.01 | 4.73 ± 0.01 |
| 6 | 1.70 ± 0.03 | 6.17 ± 0.02 | 2.40 ± 0.03 | 20.19 ± 0.03 |
| 7 | 4.20 ± 0.01 | 22.68 ± 0.01 | 17.34 ± 0.02 | 29.10 ± 0.01 |
| 8 | 4.49 ± 0.02 | 26.98 ± 0.03 | 9.27 ± 0.01 | 4.20 ± 0.02 |
| 9 | 9.81 ± 0.01 | 15.07 ± 0.01 | 1.69 ± 0.03 | 39.74 ± 0.03 |
| 10 | 4.96 ± 0.02 | 81.40 ± 0.03 | 28.73 ± 0.01 | 73.73 ± 0.01 |
| Sensor | Sample | % Recovery | |||
|---|---|---|---|---|---|
| CA12-5 | CA72-4 | AFP | HER-1 | ||
| OL/nGR | Whole blood | 99.85 ± 0.01 | 99.99 ± 0.02 | 99.76 ± 0.02 | 99.83 ± 0.04 |
| OL/GR | 99.90 ± 0.01 | 99.97 ± 0.01 | 99.95 ± 0.02 | 99.90 ± 0.02 | |
| OL/G | 99.81 ± 0.02 | 99.80 ± 0.01 | 99.91 ± 0.01 | 99.87 ± 0.03 | |
| OL/nGR | Urine | 99.80 ± 0.01 | 99.76 ± 0.02 | 99.83 ± 0.03 | 99.76 ± 0.01 |
| OL/GR | 99.91 ± 0.01 | 99.93 ± 0.03 | 99.90 ± 0.02 | 99.95 ± 0.01 | |
| OL/G | 99.87 ± 0.02 | 99.90 ± 0.01 | 99.15 ± 0.02 | 99.07 ± 0.01 | |
| OL/nGR | Saliva | 99.23 ± 0.01 | 99.03 ± 0.02 | 99.14 ± 0.01 | 99.27 ± 0.02 |
| OL/GR | 99.15 ± 0.02 | 99.81 ± 0.01 | 99.03 ± 0.04 | 99.02 ± 0.03 | |
| OL/G | 98.98 ± 0.01 | 98.17 ± 0.03 | 98.75 ± 0.03 | 99.13 ± 0.01 | |
| OL/nGR | Tumoral tissue | 99.19 ± 0.02 | 98.97 ± 0.01 | 99.00 ± 0.03 | 98.95 ± 0.01 |
| OL/GR | 99.03 ± 0.01 | 99.85 ± 0.02 | 99.37 ± 0.02 | 99.40 ± 0.01 | |
| OL/G | 99.03 ± 0.01 | 99.90 ± 0.02 | 98.99 ± 0.02 | 99.13 ± 0.02 | |
| Sensor | Analyte | Methode | LOD | Reference |
|---|---|---|---|---|
| nanoMIPs/SPEs | cTnI | HTM | 1.0 × 10⁻¹¹ g L−1 | [37] |
| MIP@AuSPE | CA12-5 | SWV | 0.1 U mL−1 | [38] |
| Ru(bpy)32+/Apt@GO | CA12-5 | EC | 9.1 × 10⁻² U mL−1 | [39] |
| NiPc@PS | CA12-5 | (FS) | 1.0 × 10⁻⁴ U mL−1 | [40] |
| PEC biosensor | AFP | PEC | 6.22 × 10⁻¹² g mL−1 | [41] |
| EMIP | AFP | - | 7.5 × 10⁻¹⁴ g mL−1 | [42] |
| rGO-AuNPs@MXene | AFP | DPV | 1.391 × 10⁻¹⁴ g mL−1 | [43] |
| ATG-CEA-Ab2&AFW-CA72-4- Ab2/CEA-Ag&CA72-4-Ag/CEA-Ab1&CA72-4-Ab1/IMBs/MGCE | CA72-4 | DPV | 1.6 × 10⁻² U mL−1 | [44] |
| rGO-TEPA/ZIF67@ZIF8/Au and the AuPdRu | CA72-4 | Chronoamperometry (I-T) | 1.8 × 10⁻⁵ U mL−1 | [45] |
| GIP | CA72-4 | DPV | 4.1 × 10⁻³ U mL−1 | [46] |
| AuNP-Ab-HRP/SPGE | HER1 | Amperometry | 3.00 × 10⁻¹¹ g mL−1 | [47] |
| IDCE | HER1 | immunofluorescence | 5.00 × 10⁻¹² g mL−1 | [48] |
| NH2-GO/THI/AuNP/SPE | HER1 | DPV | 5.00 × 10⁻¹² g mL−1 | [49] |
| OL/GR | CA12-5 | Chronoamperometry | 2.79 × 10⁻¹³ U mL−1 | This work |
| OL/G | CA12-5 | Chronoamperometry | 2.79 × 10⁻¹⁴ U mL−1 | This work |
| OL/nGR | CA12-5 | Chronoamperometry | 2.79 × 10⁻¹¹ U mL−1 | This work |
| OL/GR | AFP | Chronoamperometry | 1.00 × 10⁻²⁰ g mL−1 | This work |
| OL/G | AFP | Chronoamperometry | 1.00 × 10⁻²⁰ g mL−1 | This work |
| OL/nGR | AFP | Chronoamperometry | 1.00 × 10⁻²⁰ g mL−1 | This work |
| OL/GR | CA72-4 | Chronoamperometry | 1.33 × 10⁻¹⁶ U mL−1 | This work |
| OL/G | CA72-4 | Chronoamperometry | 1.33 × 10⁻¹¹ U mL−1 | This work |
| OL/nGR | CA72-4 | Chronoamperometry | 1.33 × 10⁻¹⁴ U mL−1 | This work |
| OL/GR | HER1 | Chronoamperometry | 1.30 × 10⁻¹⁵ g mL−1 | This work |
| OL/G | HER1 | Chronoamperometry | 1.30 × 10⁻¹⁶ g mL−1 | This work |
| OL/nGR | HER1 | Chronoamperometry | 1.30 × 10⁻¹⁵ g mL−1 | This work |
Disclaimer/Publisher’s Note: The statements, opinions and data contained in all publications are solely those of the individual author(s) and contributor(s) and not of MDPI and/or the editor(s). MDPI and/or the editor(s) disclaim responsibility for any injury to people or property resulting from any ideas, methods, instructions or products referred to in the content. |
© 2025 by the authors. Licensee MDPI, Basel, Switzerland. This article is an open access article distributed under the terms and conditions of the Creative Commons Attribution (CC BY) license (https://creativecommons.org/licenses/by/4.0/).
Share and Cite
Ilie-Mihai, R.-M.; Stefan-van Staden, R.-I.; Tuchiu-Stanca, B.-M. Ultrafast and Ultrasensitive Simultaneous Molecular Recognition and Quantification of CA12-5, CA72-4, HER1, and AFP in Biological Samples. Chemosensors 2025, 13, 210. https://doi.org/10.3390/chemosensors13060210
Ilie-Mihai R-M, Stefan-van Staden R-I, Tuchiu-Stanca B-M. Ultrafast and Ultrasensitive Simultaneous Molecular Recognition and Quantification of CA12-5, CA72-4, HER1, and AFP in Biological Samples. Chemosensors. 2025; 13(6):210. https://doi.org/10.3390/chemosensors13060210
Chicago/Turabian StyleIlie-Mihai, Ruxandra-Maria, Raluca-Ioana Stefan-van Staden, and Bianca-Maria Tuchiu-Stanca. 2025. "Ultrafast and Ultrasensitive Simultaneous Molecular Recognition and Quantification of CA12-5, CA72-4, HER1, and AFP in Biological Samples" Chemosensors 13, no. 6: 210. https://doi.org/10.3390/chemosensors13060210
APA StyleIlie-Mihai, R.-M., Stefan-van Staden, R.-I., & Tuchiu-Stanca, B.-M. (2025). Ultrafast and Ultrasensitive Simultaneous Molecular Recognition and Quantification of CA12-5, CA72-4, HER1, and AFP in Biological Samples. Chemosensors, 13(6), 210. https://doi.org/10.3390/chemosensors13060210