Article

Electrochemical Sensors for the Detection of TiO2 Nanoparticles Genotoxicity at Different pH Values Simulating the Gastrointestinal Tract

by
Jana Blaškovičová
* and
Dominika Bartánusová
Department of Microbiology and Virology, Faculty of Natural Sciences, Comenius University, 842 15 Bratislava, Slovakia
*
Author to whom correspondence should be addressed.
Chemosensors 2025, 13(6), 194; https://doi.org/10.3390/chemosensors13060194
Submission received: 18 March 2025 / Revised: 16 May 2025 / Accepted: 20 May 2025 / Published: 22 May 2025

Abstract

:
Titanium dioxide (TiO2) is one of the most widely produced nanomaterials. Many products contain nanoparticles because they have various technological, medical, and economic benefits. However, the presence of nanoparticles in the environment has a negative impact on public health. Due to the presence of TiO2 NPs in food, food packaging, and drinking water, they can easily enter the human gastrointestinal tract (GIT), which includes environments with different pH values. These pH changes can affect the stability, dispersion, and toxicity of nanomaterials. Our experiments aimed to monitor the effect of TiO2 NPs incubated at a pH similar to the GIT values on DNA structure. DNA damage was monitored using a DNA biosensor and a biosensing approach with electrochemical voltammetric detection. Cyclic voltammetry (CV) detected damage to DNA/GCE biosensors of up to 10%. The best way to monitor the genotoxicity of TiO2 NPs on DNA structure was the biosensing approach, which changes in the redox indicator current response detected by differential pulse voltammetry (DPV) up to 47.6%. The highest effect of TiO2 was observed for guanine residues at pH 8.0. The results were confirmed by UV–vis spectrophotometry and hyperchromic and bathochromic spectral shifts.

1. Introduction

Nanosized particles, with dimensions of 1–100 nm, are increasingly used due to their unique properties worldwide in many consumer products. In the last years, titanium dioxide nanoparticles (TiO2 NPs) have captured increased attention because of their intensive use in the food industry [1] as well as in pharmacy, cosmetics, and others, with over 1 million metric tons in the global market [2], raising concerns for public health and environmental safety, including marine ecosystems [3].
Due to its catalytic and photocatalytic properties, titanium dioxide (TiO2) is the most widely used white pigment in the plastics and food packaging industry [4]. In the field of food packaging, it has antimicrobial [5], antibacterial [6,7,8], and antiviral effects [9]. TiO2 can catalyze air and water purification [10]. Titanium is extensively used as a whitening agent enabling a smooth texture, opacity, and UV protection in drug and food products—coffee cream, white chocolate concentrate, frosting, gum, candy, jelly, and chewing gum [11].
Nanomaterials that enter the body via the oral route are exposed to different conditions than those entering the body by other routes. TiO2 NPs that enter the gastrointestinal tract (GIT) are exposed to conditions with distinctive pH values. The pH in the gastrointestinal tract of humans can vary significantly along its different sections, from 1.5–3.2 in the stomach and 4–8 in the small intestine to 5.5–7 in the large intestine. Marucco et al. reported a pH of 6.5 for saliva, pH 1.4 for the stomach, and pH 8.1 in gastric and duodenal fluid under their simulative experimental conditions [12]. These pH changes can affect the stability, dispersion, and toxicity of nanomaterials. In recent years, the interaction of TiO2 NPs with the GIT has been a topic of intensive scientific research and study. Progress has been made in understanding the behavior and interaction of nanomaterials and the GIT.
TiO2 particles, which are only tens of nanometers in size, much smaller than cells or most viruses, raise many questions concerning their negative impact on human health. Numerous studies have shown that they are capable of disrupting the intestinal barrier [13,14], violating the structural and functional integrity of the intestinal mucosa [15], or entering the bloodstream. Long-term exposure changes the active ion transport systems in the cell plasma membranes, alters the enzymatic activity, and disturbs the blood plasma lipid profile [16]. Peyer’s patches accumulate pigmentary material, including TiO2, from the intestine, causing inflammatory disease. TiO2 NPs have also been shown to induce inflammation in the colon when administered to rodents. They increase the production of tumor cells that cause colitis and cause inflammation [17]. TiO2 NPs can cause lung damage, inflammation, and fibrosis, and they are possibly carcinogenic to humans.
To ensure consumer safety, regulatory agencies, such as the FDA (in the US) and EFSA (in the EU) provide guidelines and restrictions on TiO2’s use in food products. The potential health risk coupled with TiO2 ingestion led France to suspend its use in food from 2020, and EU banned its use in 2022 [18]. As it is still present in stock products and permitted in other countries [19], imported food products contain TiO2 [18].
Despite the increasing use of TiO2 and its classification as probably carcinogenic to humans by the IARC, the possible genotoxicity of TiO2 is still controversial. The EFSA experts, in evaluating the safety of TiO2 as a food additive, concluded that concerns over genotoxicity could not be ruled out. A group of experts has recently looked at the genotoxicity of TiO2 but no direct DNA-damaging mechanism of TiO2 nanoparticles was found [20]. The genotoxicity of TiO2 NPs is being intensively studied due to their carcinogenicity [21]. The results of published in vitro genotoxicity studies are predominantly positive. However, a number of negative results have been reported. In these studies, the negative effect of TiO2 NPs was demonstrated in 24 (30%) comet assays and 7 out of 15 (16%) micronucleus assays [22]. The presence of DNA damage has been monitored in hepatopancreatic cells by means of an alkaline comet assay conducted directly on freshly isolated samples. This approach has been adopted due to the established association between DNA damage and cell death [23,24].
The field of research on TiO2 and its function in cells is expanding rapidly. Their small size enables cellular penetration. The efficiency of particle uptake is contingent on the surface properties of the particles themselves [25], as well as the specific characteristics of the cell type concerned. Following internalization within the cell, these particles have the capacity to accumulate within the cytoplasm and the nucleus, or alternatively, to enter the mitochondria. However, further research is required to determine which cell types exhibit higher efficiency in the uptake of TiO2 NPs and which cell types are more susceptible to DNA damage [22]. Some studies even show that some NPs can penetrate cell nuclei and directly interfere with the structure and function of genomic DNA [26]. Other studies demonstrated that TiO2 NPs interact directly with DNA via the DNA phosphate group [27,28].
In contrast, other studies show that TiO2 NPs can cause DNA damage indirectly by generating reactive oxygen species (ROS) [29,30]. Furthermore, some studies have shown that TiO2 NPs induce DNA photodamage in human cells [31,32]. Available evidence suggests that the in vitro genotoxicity of TiO2 is mainly dependent on particle-induced oxidative stress. The production of reactive oxygen species (ROS) is a normal cellular process involved in cell signaling and cell defense mechanisms. However, excessive production of reactive oxygen species can lead to redox imbalance and damage to cellular macromolecules such as proteins, lipids, and DNA. In addition, oxidative stress has been assessed concerning particle uptake by flow cytometry [22]. In addition to UV radiation, ROS production can also be induced by pH changes [7].
One of the most important aspects of determining the toxicity of various compounds is their interaction with the DNA molecules [33,34]. The (bio)sensor is a fast, inexpensive, and specific analytical tool that can easily track the damage of biological components by various compounds. Electrochemical devices offer the possibility of quick and direct detection of specific DNA sequences, a detailed study of DNA damage and the behavior of surface-attached DNA [35], drug toxicity monitoring [36,37], nanoparticle toxicity monitoring [38,39], and antioxidant monitoring [40]. DNA/GCE biosensors and/or biosensing have been chosen as very effective bioanalytical tools in several studies [41,42]. The high sensitivity of electrochemical transducers combined with their compatibility with modern miniaturization technologies, low costs, and minimal energy requirements make them advantageous devices for DNA diagnostics [43]. The DNA/GCE biosensors provide new signal detection strategies to assess the genotoxic effects of different compounds on DNA structure, with a broad range of future applications.
Despite various scientific studies describing the toxicity of TIO2, there is a discrepancy in information about monitoring the genotoxicity of these nanoparticles, and there is no direct method at this time by which such studies could be carried out. This study monitored the DNA damage caused by TiO2 nanoparticles, which can easily enter the gastrointestinal tract, whether from food or drinking water, because they are the most widely used nanoparticles in the world today. The aim of this study was to find a way to monitor the genotoxicity of nanoparticles on DNA structure in an environment similar to the GIT. The growing presence of nanoparticles in the environment is alarming. It is important to monitor the health risks by simple, accurate, and cheap analytical methods that can rapidly detect their potential genotoxicity. The uniqueness of this study lies in the universality of its use for any nanoparticles combined with monitoring DNA damage caused by direct interaction or ROS formation.

2. Materials and Methods

2.1. Materials

Na2HPO4, NaH2PO4, K3[Fe(CN)6], and K4[Fe(CN)6]. 3H2O were purchased from Lachema Brno (Brno, Czech Republic). DNA was obtained from Sigma-Aldrich (Darmstadt, Germany). Other chemicals were from Mikrochem (Pezinok, Slovakia) or Lachema (Brno, Czech Republic). Nanopure water (resistivity above 18 MΩ·cm, Millipore Milli-Q system) was used for all experiments. Double-stranded DNA from salmon sperm (Sigma Aldrich, Darmstadt, Germany) was used in all experiments. TiO2 NPs were synthesized by the sol–gel synthesis method from titanium (IV) isopropoxide (TTIP) in absolute ethanol and distilled water at a molar ratio of Ti:H2O = 1:4. Nitric acid was used to adjust the pH and to restrain the hydrolysis process of the solution. The size of the nanoparticles was 38.11 nm. They were sonicated for 5 min before use.

2.2. Apparatus

A three-electrode system was used for the electrochemical experiments, consisting of a glassy carbon working electrode (GCE, Metrohm, The Netherlands), a Ag/AgCl/3 mol· L−1 KCl reference electrode, and a platinum wire counter electrode (L-CHEM, Brno, Czech Republic). An Autolab PGSTAT12 potentiostat/galvanostat electrochemical system (Metrohm, The Netherlands) was used for all voltammetric (CV, DPV) measurements. The system was controlled by NOVA software, version 1.10.23 (Metrohm, The Netherlands). A UV–vis spectrophotometer (Thermo Scientific Evolution 200 series, Thermo Fisher Sci., Waltham, MA, USA) and the Thermo Insight 2 software were used for the UV–vis experiment.

2.3. Preparation of the Biosensor

The GCE surface was cleaned mechanically with a polishing cloth (BUEHLER, UK) and 0.3 μm alumina slurry (Metrohm, Netherlands) and electrochemically (1.6 V for 300 s). The CV response of the working electrode was stabilized by 20 scans at a potential range from 1.0 to −0.8 V in a 1.10−3 mol·L−1 [Fe(CN)6]3−/4− redox indicator. The stock solution of 1 mg·mL−1 salmon sperm dsDNA was prepared by dissolving it in nanopure water. To prepare the DNA/GCE biosensor, the pretreated GCE surface was covered with 4 μL of the DNA stock solution and dried.

2.4. Incubation of TiO2 NPs in an Experimental Environment

For the CV measurements, TiO2 NPs (1 mg·mL−1) were incubated in PB (pH 2.6; 7.4 or 8.0) for 30 min at laboratory temperature representing experimental Environments 1, 2, or 3 respectively. After the incubation, TiO2 NPs were diluted with the [Fe(CN)6]3−/4− redox indicator to a final concentration of 0.1 mg·mL−1 and neutralized to pH 7.4.
For the DPV measurements, TiO2 NPs (1 mg·mL−1) were mixed with 1 mg·mL−1 of the salmon sperm dsDNA solution to a final concentration of 0.1 mg·mL−1 before the measurements.

2.5. Methods

All measurements were carried out at a room temperature of 21 °C in the laboratory. Cyclic voltammetry (CV) scans were recorded at a scan rate of 100 mV·s−1 and a potential step of 2 mV in a 1 mmol·L−1 [Fe(CN)6]3−/4− redox indicator over a potential range from 0.7 to −0.2 V at. Differential pulse voltammetry (DPV) was performed in 0.1 mg·mL−1 DNA in PB (pH 7.4) and a 0.1 mg·mL−1 DNA and 0.1 mg·mL−1 TiO2 NP mixture at a potential range from 0 to +1.5 V, a scan rate of 100 mV·s−1, and a potential step of 5 mV. UV–vis spectrometry was carried out in an interval ranging from 200 nm to 500 nm and a scan rate of 200 nm.min−1 in a 1 cm cuvette.

2.6. Data Treatment

Surviving DNA was expressed as the normalized biosensor response using the equation
I r e l =   I s u r v   D N A I G C E   I D N A I G C E   × 100 %  
where Isurv DNA represents the value of the anodic peak current after the DNA biosensor incubation with the NPs, IDNA is the value of the anodic peak current before the DNA biosensor incubation, and IGCE is the value of the anodic peak current of the bare GCE.

3. Results and Discussion

Titanium dioxide nanoparticles are widely used in food and food packaging worldwide due to their unique properties, which have raised concerns about possible adverse effects on human health. Therefore, evaluation of their toxicity, especially genotoxicity, is an important part of biosafety assessment. This work aimed to monitor the effects of TiO2 NPs on DNA molecules under experimental conditions mimicking the environment of the GIT. For our experiments, an environment with pH values similar to those in the GIT was used, in which TiO2 NPs were incubated. Subsequently, the effect of these nanoparticles on DNA was monitored using a DNA biosensor and biosensing.

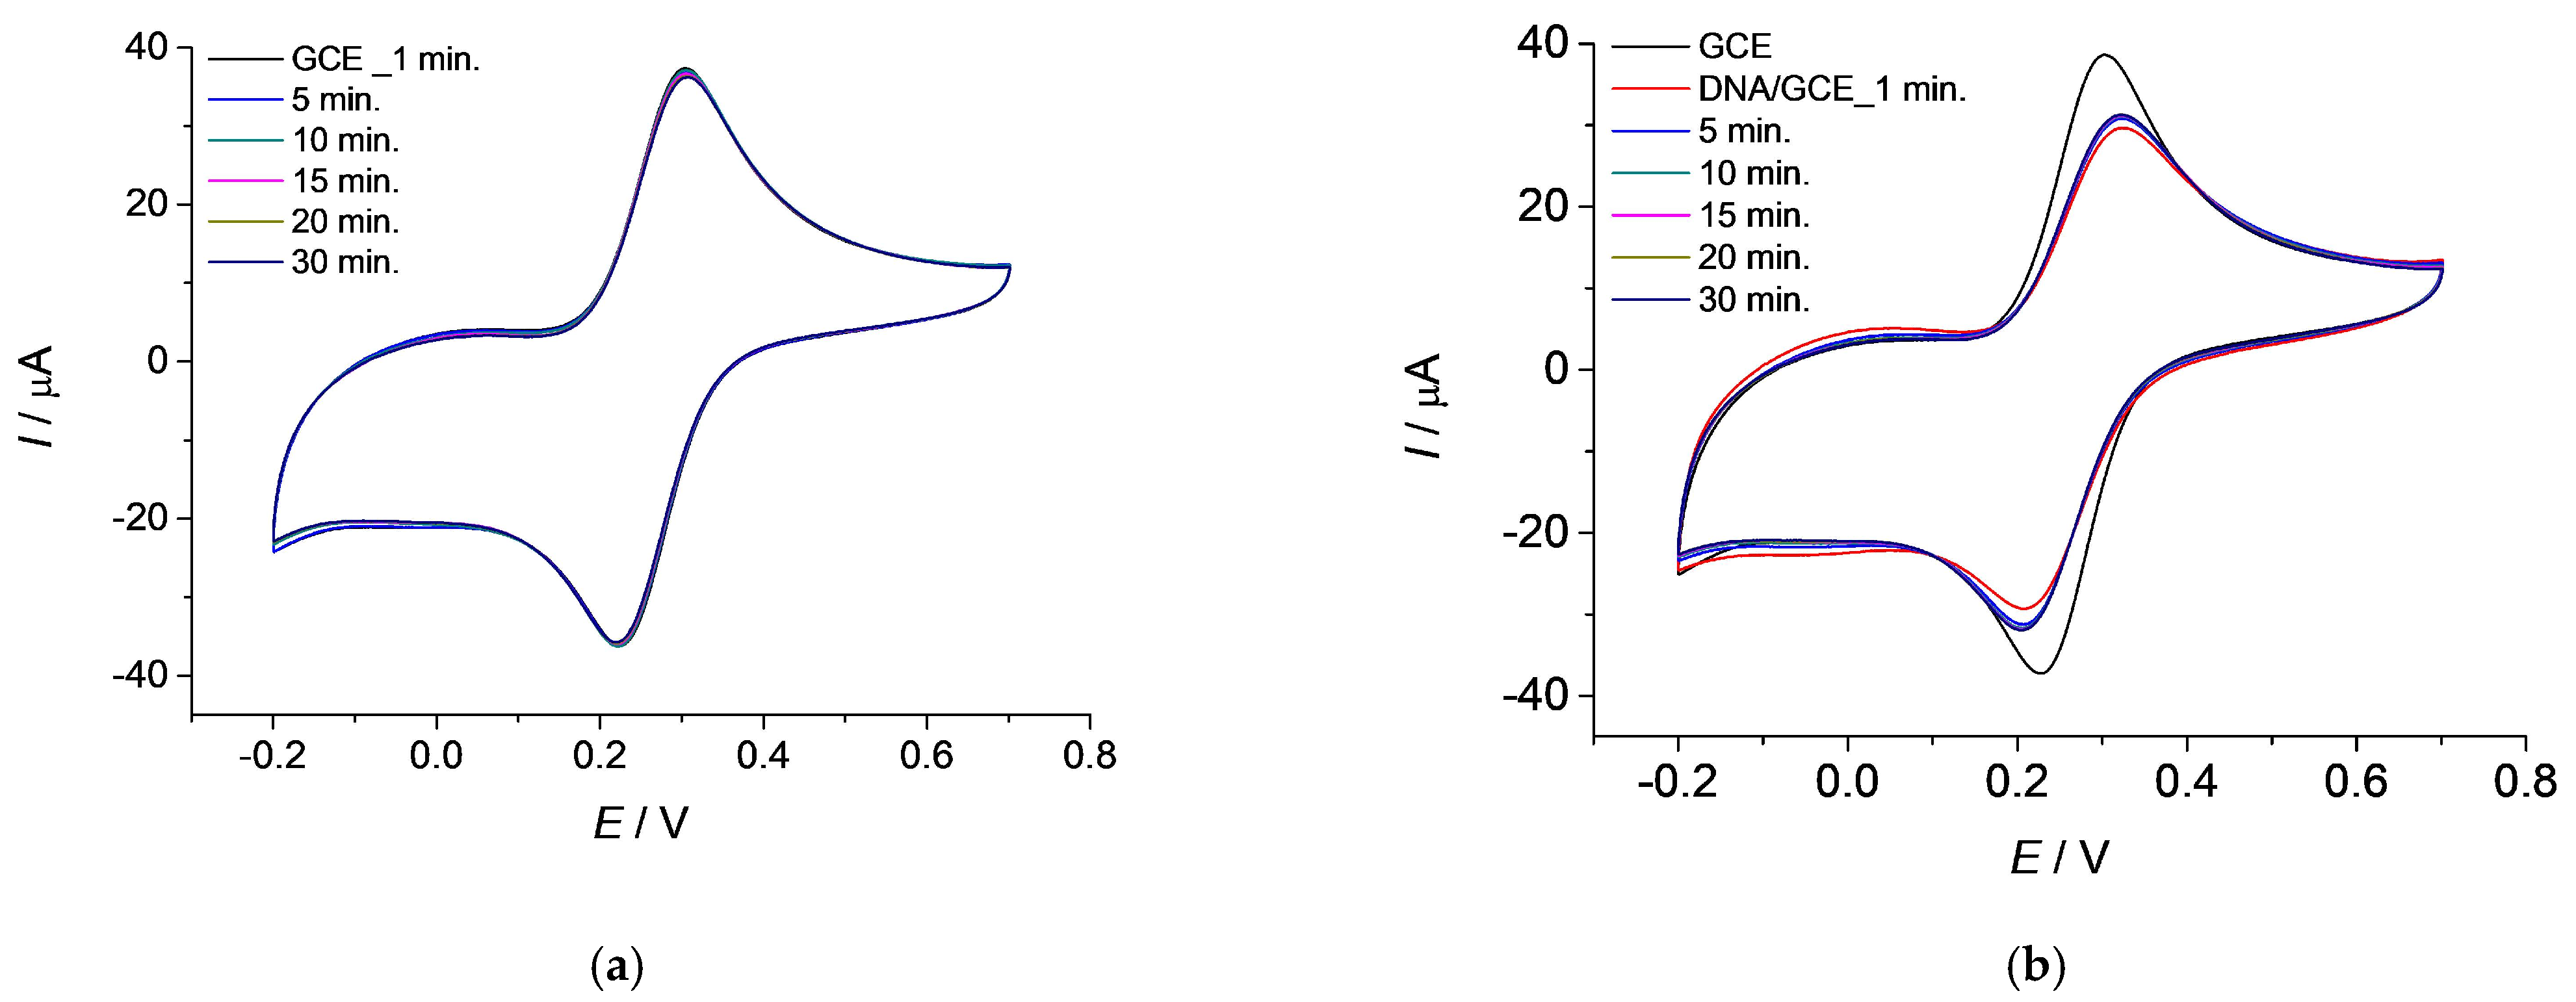
3.1. Monitoring the Stability of the GCE Sensor and the DNA/GCE Biosensor

Initially, it was necessary to determine the effect of the redox indicator [Fe (CN)6]3−/4− on the signal of a pure working GCE, optimize the experimental conditions, characterize the biosensor, and monitor its stability in the solution for 1, 5, 10, 15, 20, and 30 min. In Figure 1a, the signal of the redox indicator’s current response measured by cyclic voltammetry under the conditions specified in Section 2.5 is sufficiently stable over time. We can conclude that the redox indicator itself does not have a significant effect on the surface of the working GCE, and its passivation does not occur.
A drop of DNA with a concentration of 0.1 mg·mL−1 and a volume of 4 µL was applied to the active surface of the GCE. After drying, the redox indicator current response of the DNA/GCE biosensor was measured under the conditions specified in Section 2.5 at biosensor incubation times of 1, 5, 10, 15, 20, and 30 min. After applying DNA to the working GCE electrode, the redox indicator signal drops significantly: the anodic peak current value decreased (Figure 1b, red line), due to the formation of a barrier on the surface of the working electrode’s active area and the reduction in electron transfer of the electrode–solution interface. The maximum values of the anodic peaks do not visibly differ during the incubation period at selected time intervals, so we can conclude that the biosensor is sufficiently stable during the incubation of the electrode in the redox indicator for up to 30 min.

3.2. Effect of TiO2 Nanoparticles on the Surface of the GCE Sensor and the DNA/GCE Biosensor

In the next step, we examined the effect of TiO2 NPs on the surface of the GCE to avoid side effects like the adsorption of NPs at the active area of the working electrode on the experimental results.

3.2.1. Effect of TiO2 Concentration on the GCE Biosensor

To investigate the effect of TiO2 NPs on the surface of the working GCE, i.e., on the stability of the [Fe (CN)6]3−/4− redox indicator current response, a set of solutions (in PB at pH 7.4) was prepared with a final concentration of 2.5, 5, 10, 20, 50, and 100 µg·mL−1 of TiO2 NPs. To determine any possible adsorption of nanoparticles on the electrode’s surface, 4 µL of the given solution was dropped onto the cleaned active surface area of the working GCE and incubated at room temperature for 5 min. After the specified time, the electrode was rinsed, and the CV was recorded. Figure 1c shows that TiO2 NPs in different concentrations do not have a significant effect on the maximum value of the redox indicator’s anodic peak current response. No significant absorption of nanoparticles nor passivation of the electrode surface was present.

3.2.2. Effect of TiO2 Concentration on the DNA/GCE Biosensor

The same procedure as in the previous section (Section 3.2.1) was chosen to monitor the change in the [Fe (CN)6]3−/4− redox indicator’s current response signal on the DNA/GCE biosensor by CV. For this, 4 µL of a DNA solution with a concentration of 0.1 mg·mL−1 was applied to the cleaned electrode and allowed to dry for 20 min. TiO2 NPs (in PB, pH 7.4) at different concentrations were dropped onto the prepared DNA/GCE biosensor, incubated for 5 min, and rinsed with ultrapure water, and the CV signal was recorded. The voltammogram (Figure 1d) shows the effect of TiO2 NPs at different concentrations on the surface-attached DNA at the biosensor. Since we did not determine a significant change in the signal, we can assume that incubation of the biosensor in TiO2 solutions with different NP concentrations does not significantly affect the response of the redox indicator. Nevertheless, no significant damage to the DNA layer attached to the electrode’s surface was detected. After evaluating the measured data of the effect of nanoparticles on the DNA/GCE biosensor, the proportion of surviving DNA was calculated according to Equation (1) (see Section 2), from which we can conclude that the amount of surviving DNA varies within 10% (Figure 2a). On the basis of this finding, a nanoparticle concentration of 100 µg·mL−1 was chosen for further experiments.

3.3. Influence of pH on TiO2 NPs and Their Effect on the DNA/GCE Biosensor

The physicochemical properties of nanomaterials are influenced by extreme pH values and ionic changes that nanoparticles encounter during passage through the gastrointestinal tract. Bouwmeester et al. [17] showed that the GIT affects the properties of nanomaterials during passage through its environment. Therefore, it was of interest whether the incubation of TiO2 NPs under different pH conditions simulating various parts of the GIT environment would have an impact on the DNA/GCE biosensor’s [Fe (CN)6]3−/4− redox indicator current response.

3.3.1. Influence of pH on the DNA/GCE Biosensor

The pH changes that occur in the GIT (mouth, stomach, intestine) affect not only the stability and dispersion of nanomaterials but also local toxicity. Since saliva with pH 7–8 is found in the mouth, gastric juice has a pH of around 2, and, in the intestine, the pH ranges from 7–8 [44], PB solutions with pH 2.6, 7.4, and 8.0 (Environment 1, Environment 2, and Environment 3), prepared according to the procedure described in Section 2, were chosen as our simulated experimental GIT environment. To optimize the experimental conditions and to exclude the influence of the environment on future experiments, these solutions were incubated for 30 min at laboratory temperature and, after incubation, diluted with the redox indicator solution. The pH was adjusted to 7.4 before incubation with the DNA/GCE biosensor and measurement of the current response by CV. Figure 3a shows that the buffer solutions that were used as our experimental environment do not affect the values of the anodic peak current of the redox indicator.

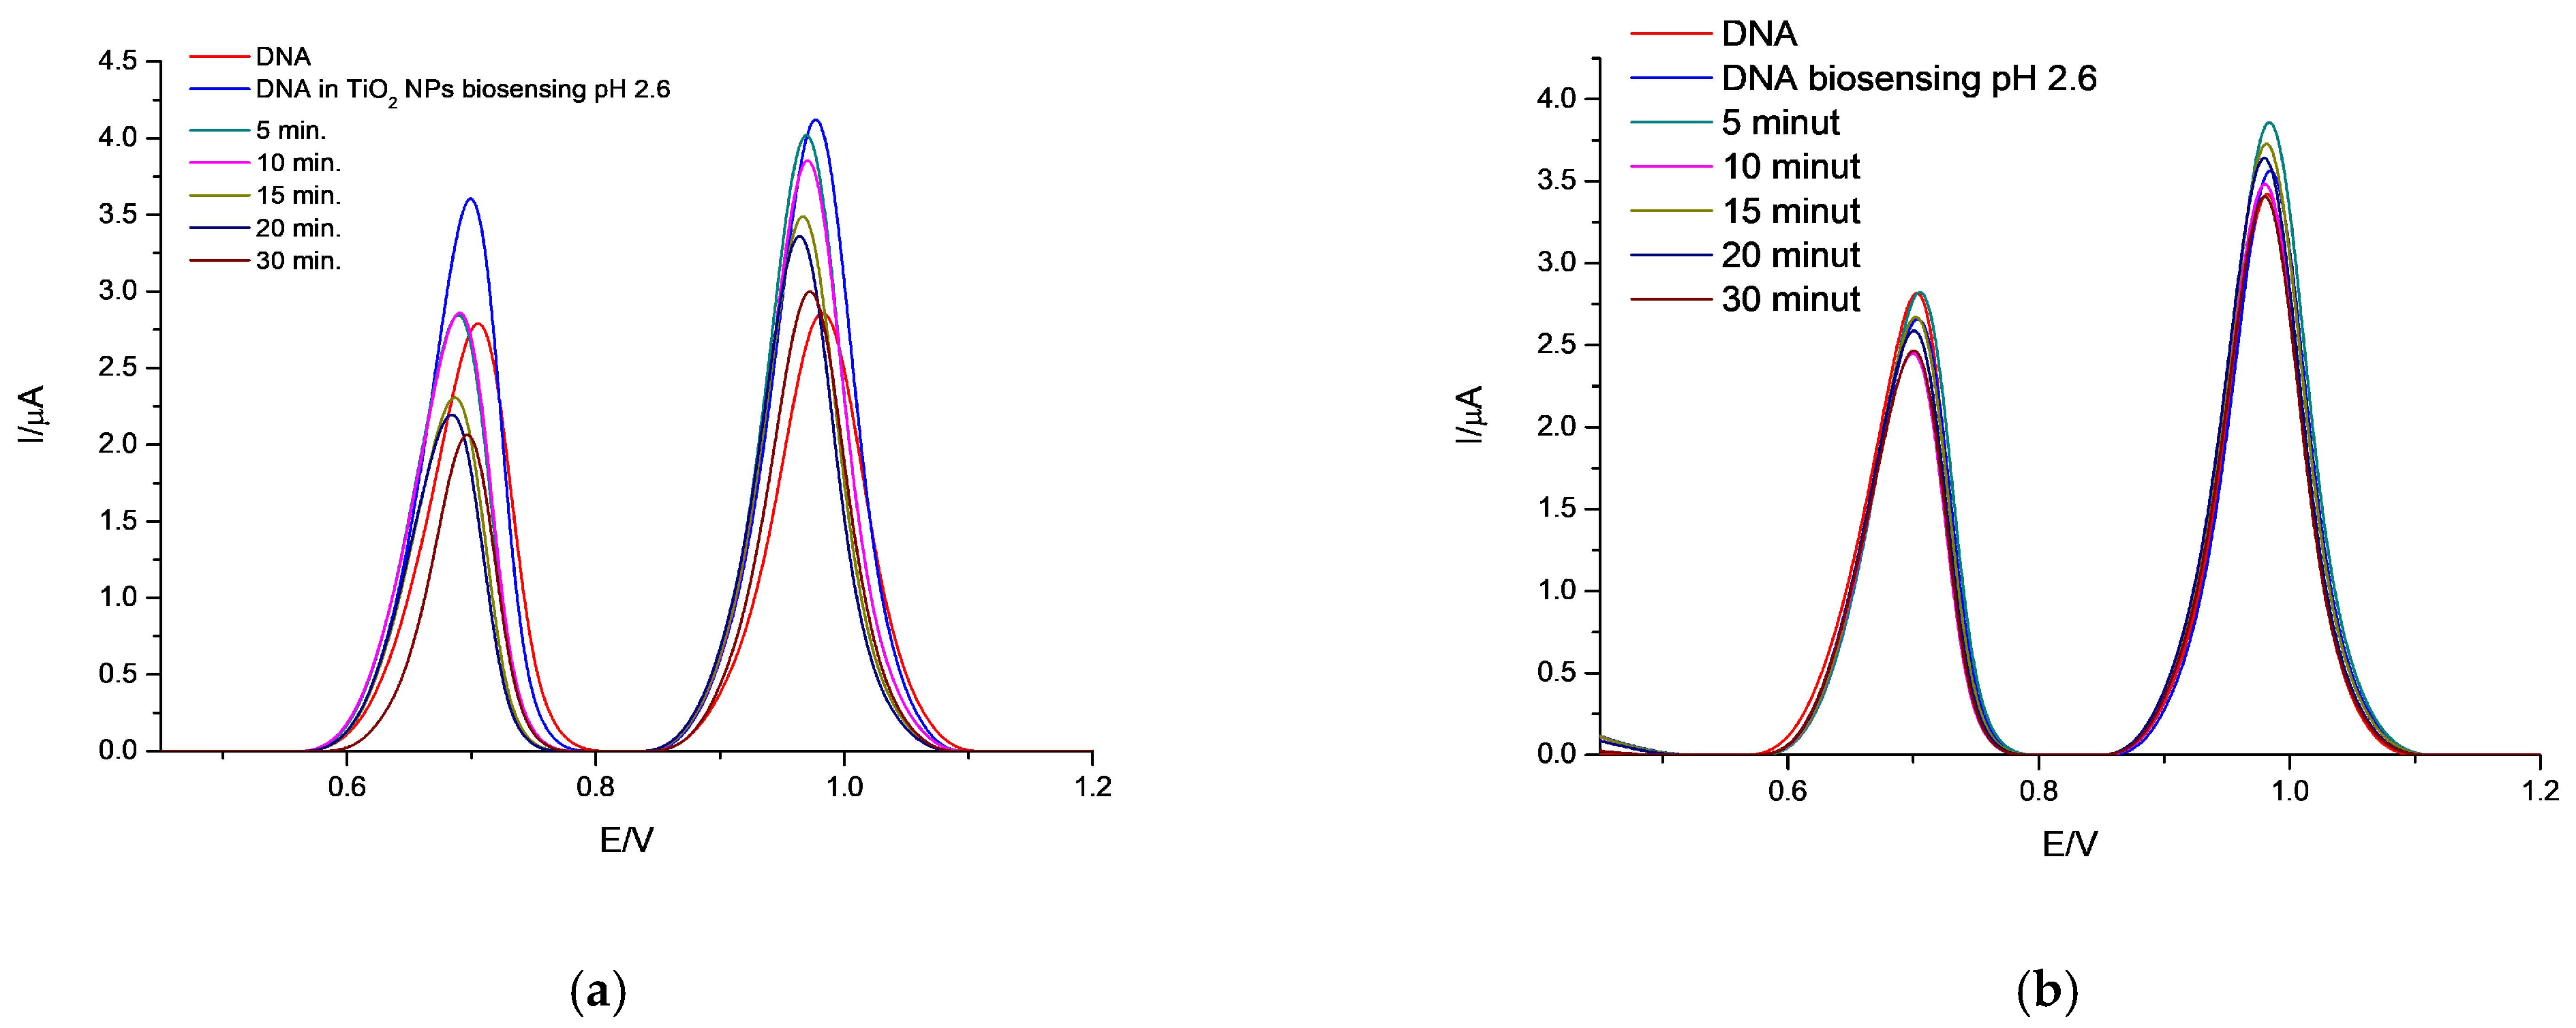
3.3.2. Influence of TiO2 Exposed to pH Values Simulating the GIT Environment on the DNA/GCE Biosensor

In the next step, we incubated TiO2 NPs in Environments 1–3 that simulate the GIT. After 30 min of incubation, the nanoparticles were diluted to a concentration of 0.1 mg·mL−1 with a PB solution (pH 7.4) including the redox indicator, thereby adjusting the resulting pH to neutral. The biosensor was immersed in the nanoparticle solution and the CV was recorded at time intervals of 1, 5, 10, 15, 20, and 30 min.
Figure 3b–d represent the current response of the redox indicator in Environments 1 (pH 2.6), 2 (pH 7.4), and 3 (pH 8.00) respectively. As can be seen from the bar graph representing the surviving portion of DNA on the surface of the DNA/GCE biosensor (Figure 2b), we do not observe a significant change in the values of the maximum anodic peaks in Environments 1, 2, or 3, and, therefore, the change in the DNA damage was negligible. The slight decrease in the signal could have occurred due to the accumulation of nanoparticles near the electrode’s surface, thereby creating a barrier and decreasing the signal. Figure 2b confirms that the proportion of surviving DNA on the surface of the biosensor incubated in a TiO2 NP solution with a concentration of 0.1 mg·mL−1 is within 10%.

3.4. Monitoring the Genotoxicity of TiO2 NPs on DNA Structure by Biosensing

Environmental exposure to TiO2 NPs has been considered harmless because TiO2 is a biologically inert compound [45]. Despite several studies aimed at addressing the safety issues of TiO2, there is still a lack of understanding regarding the biological effects and potential risks of these nanoparticles, especially those with a size of <100 nm diameter, which is in no way in step with the rapid increase in the nanomaterial exposure of humans and the environment. Monitoring the potential to cause genetic damage is essential for identifying a cancer-causing agent and is therefore critical for cancer risk assessment. In vitro genotoxicity assays are the key to monitoring different types of genetic damage (e.g., chromosomal structural damage and DNA double-strand breaks) induced by a test compound [46].
As the monitoring of the TiO2 NPs effect incubated in Environments 1–3 with different pH values on the DNA/GCE biosensor in a redox indicator solution using CV did not show any change in the DNA layer on the electrode’s surface, a biosensing approach with more sensitive DPV detection was selected to further characterize the genotoxicity of TiO2 NPs on DNA structure. For this determination, the DPV method was selected, with the conditions specified in Section 2.5. TiO2 NPs were incubated in the environment of solutions with pH 2.6, 7.4, and 8.0 for 30 min at room temperature. After incubation, the thus prepared TiO2 NP solution was mixed with DNA to a final concentration of 0.1 mg·mL−1 for both substances present. The pH of the resulting solution, where DNA interacted with TiO2 NPs, was afterward adjusted to neutral because the pH of the cells in which DNA is stored is physiological. The cleaned electrode was immersed in the solution, and the signal of the DNA base residues was recorded using DPV. The measurements were performed at time intervals of 1, 5, 10, 15, 20, and 30 min of the DNA interaction with TiO2 NPs. The electrode was cleaned between each measurement to avoid accumulation of DNA residues on the electrode’s surface.
Figure 4 shows a current response for guanine residues at the position of 0.7 V and adenine residues at the position of 1.0 V for all tested environments (Figure 4). Figure 4b,d,f show the DNA biosensing controls without added TiO2 NPS in Environments 1 (pH 2.6), 2 (pH 7.4), and 3 (pH 8), respectively. Figure 4a,c,d show the biosensing of TiO2 NPs with DNA in Environment 1 (pH 2.6), 2 (pH 7.4), and 3 (pH 8), respectively.
After the addition of nanoparticles (incubated in an environment with pH 2.6) to the DNA solution, the current values corresponding to the DNA base residues G and A increased (Figure 4a), which may be due to the opening of the DNA structure and the increased availability of base residues for oxidation [39]. Over time, the signal for G and A residues decreases by approximately 44%, which may indicate damage to the DNA structure [47]. The second graph (Figure 4b) shows a control measurement without nanoparticles to determine the possible influence of the experimental environment on the guanine and adenine signals. In this measurement, the current does not change as much as in the environment with nanoparticles, so we can say that the environment itself does not affect the current response values. Further, TiO2 NPs were incubated for 30 min in an environment with pH 7.4 at laboratory temperature. The nanoparticles were then mixed with DNA, and the signal was measured by the DPV method using the same procedure as in the previous section (Figure 4c). In this case, a control measurement was also performed without the presence of nanoparticles (Figure 4d) to determine the influence of the environment on DNA. In Figure 4c, the current value for guanine increased after mixing TiO2 NPs with DNA indicates the opening of the DNA structure. Over time, the signal decreased from 3.86 µA to 2.50 µA, i.e., it decreased by 36%. After 5 min of contact between the DNA and the nanoparticles, there was no significant change in the signal. The third experimental environment had pH 8.0, where TiO2 NPs were also incubated for 30 min at laboratory temperature. The time dependence of DNA’s contact with the nanoparticles incubated in this way is shown in Figure 4e, as well as with a control measurement without nanoparticles in Figure 4f. The biggest signal changes in current response of G and A residues occurred in this case, where the signal for guanine decreased to a current value of 1.85 µA from the original 3.55 µA (a decrease of 47.6%). There were also slight potential shifts, indicating possible chemical interactions. The control measurement confirmed the negative effect of the experimental environment on the DNA structure by itself.
Trouiller et al. [47], in a 2009 publication, demonstrated, on the basis of in vivo studies of DNA interactions with TiO2 NPs, that oxidative damage and DNA strand breaks occur. Also, El-Said et al. [48], in 2014, confirmed that ROS generation by TiO2 nanoparticles leads to DNA damage. It follows from the above that during the interaction of DNA with the tested TiO2 NPs, ROS generation may have occurred after the incubation of TiO2 at different pH values, and the resulting oxidative stress may have caused DNA damage and fragmentation, resulting in a decreased signal for guanine and adenine base residues [35].
From the methods tested, biosensing via the GCE with DPV detection represents the most sensitive method for the detection of the potential genotoxic effect of TiO2 NPs on DNA. This approach also has huge potential for toxicity detection of other nanomaterials.

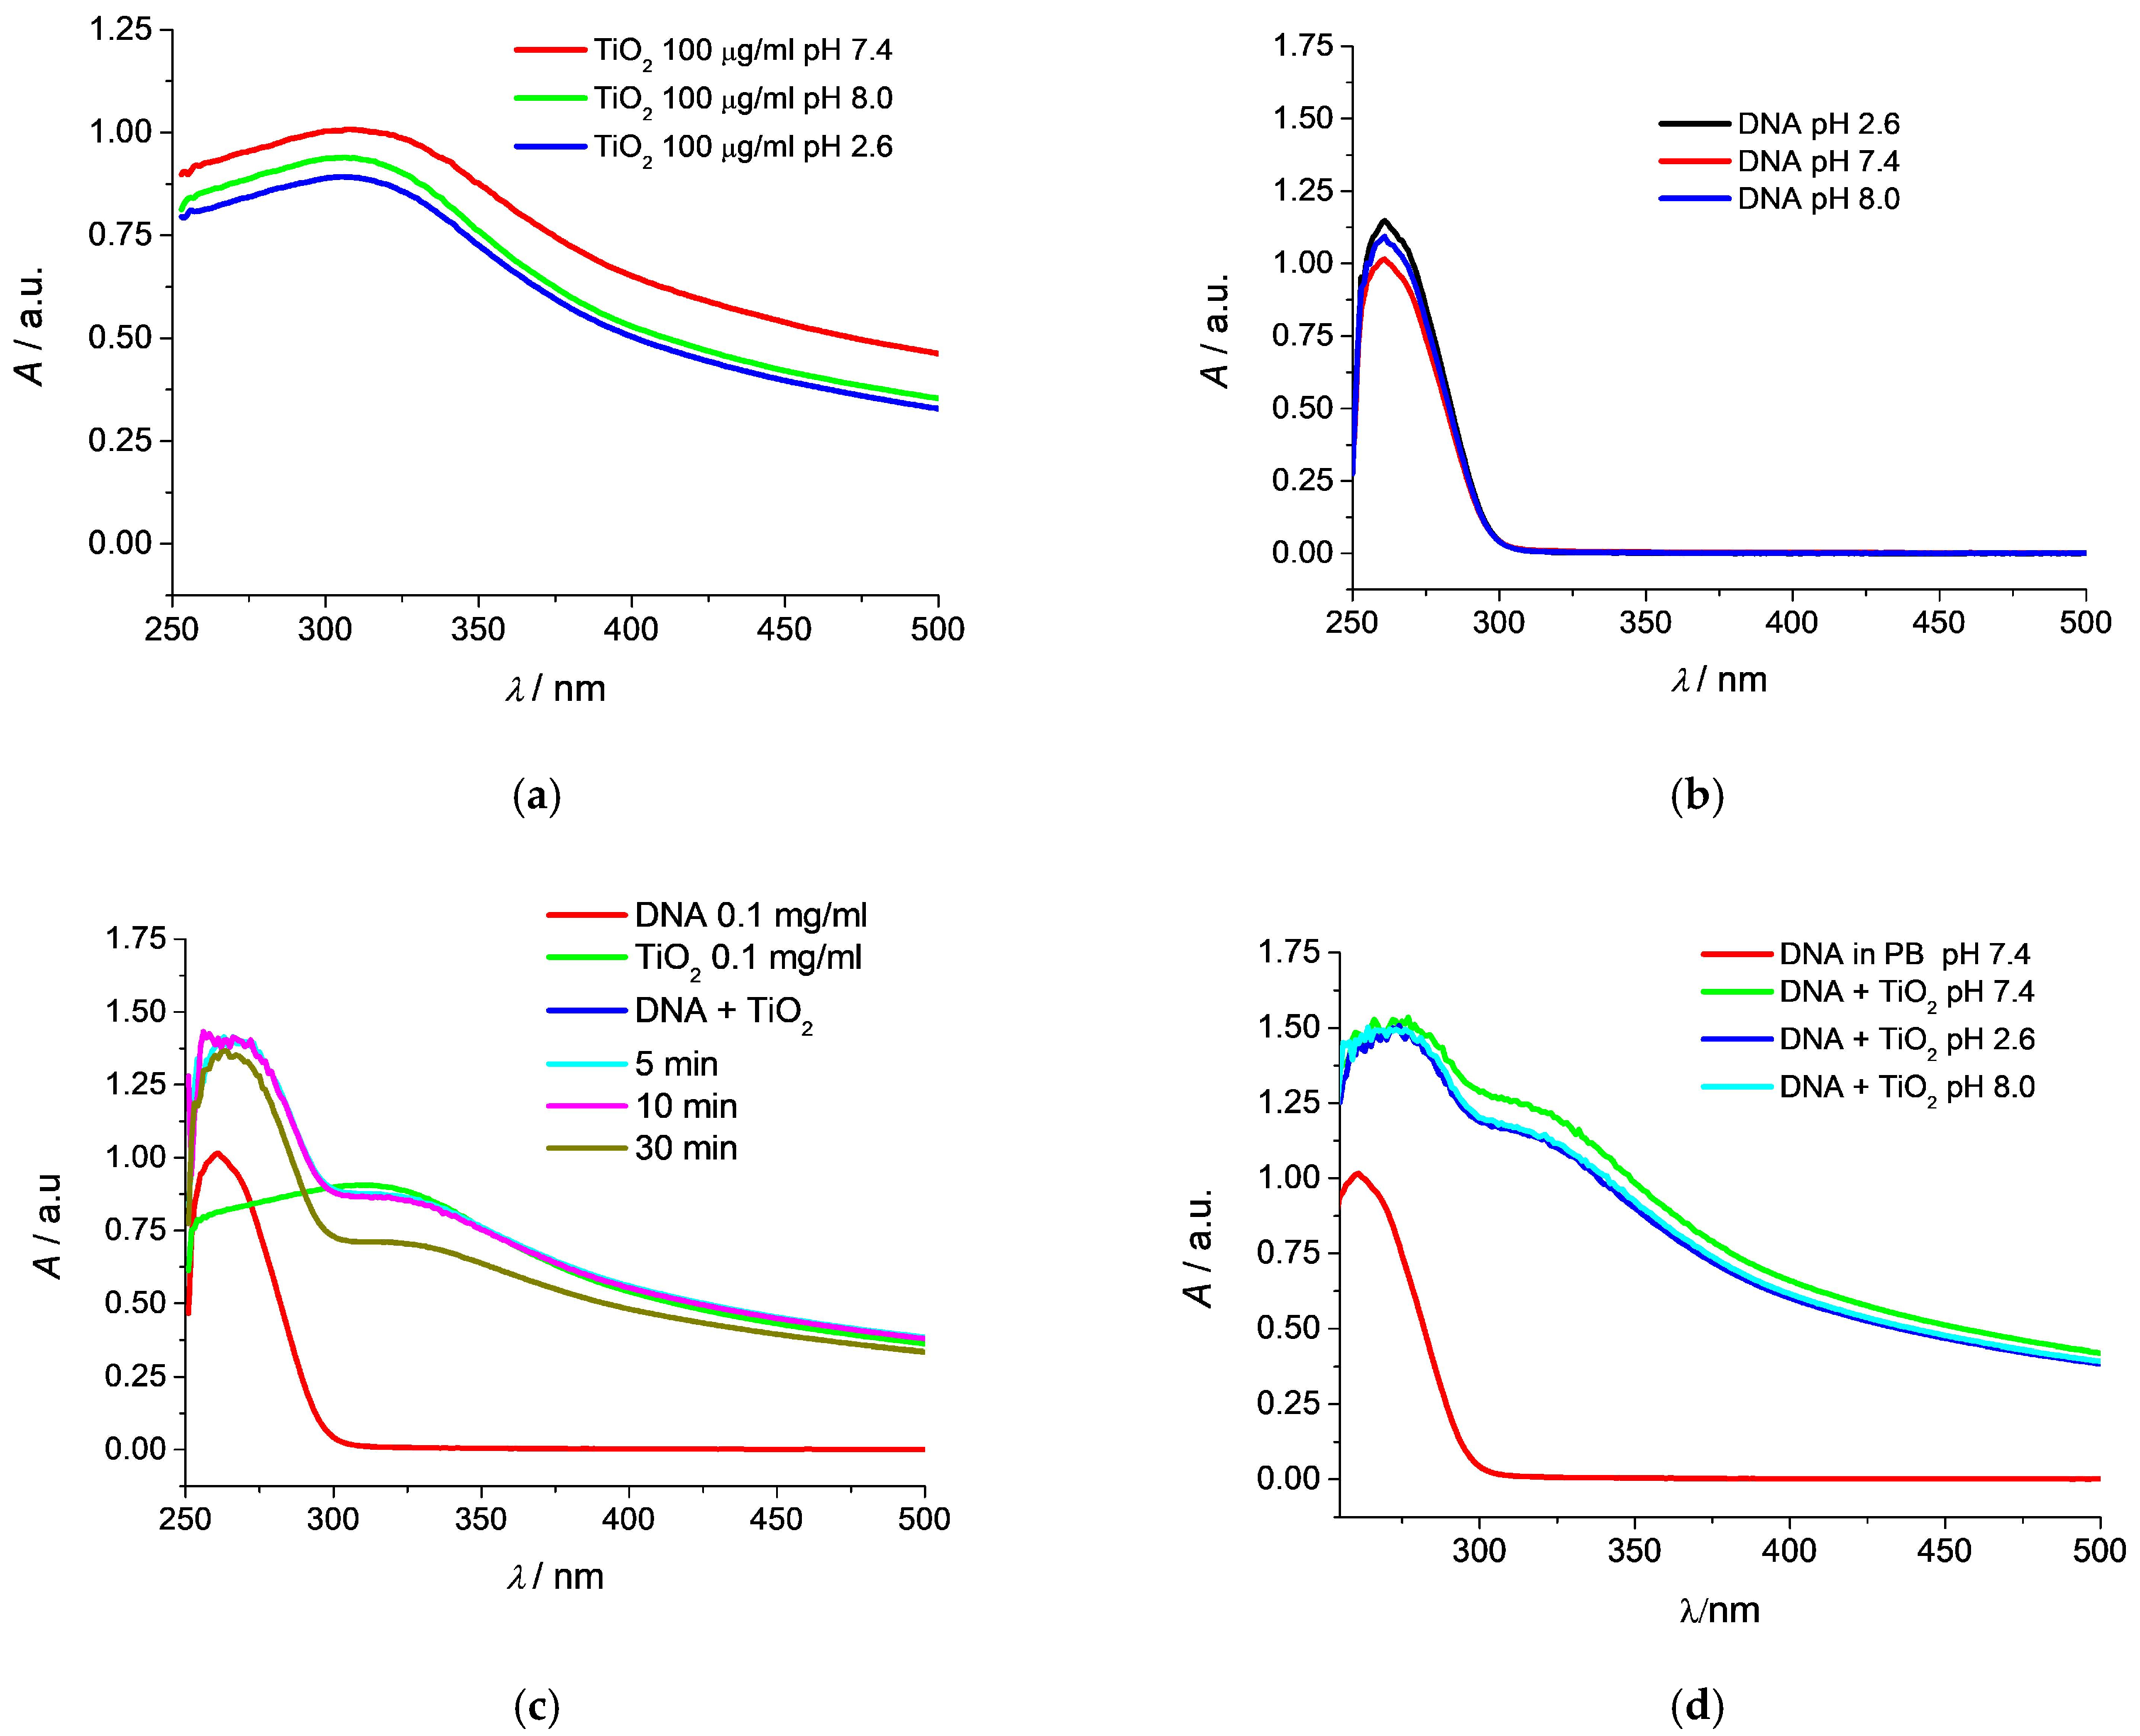
3.5. Monitoring the Genotoxicity of TiO2 NPs Toward DNA by UV–Vis Spectrophotometry

UV–vis spectrophotometry is a commonly used technique in the characterization of nanoparticles, as well as for studying the interaction with DNA. Wavelengths of 300–800 nm are generally used to characterize various metal nanoparticles with sizes ranging from 2 to 100 nm [49]. In our case, the optical property of TiO2 NPs was analyzed by UV–vis spectrophotometry in the wavelength range of 250–500 nm to monitor their interaction with DNA, which gave an easily readable absorbance band at 260 nm. The sample’s preparation was the same as in the biosensing experiment.
First, the concentration-dependence of the absorbance of TiO2 NPs was determined. TiO2 NPs exhibit an absorption peak (λmax) at a wavelength of approximately 300 nm, and the absorbance increases linearly with increasing nanoparticle concentrations. For TiO2 NPs at a concentration of 0.1 µg·mL−1 in environments with different pH values (Figure 5a), the λmax is lower for Environments 1 (0.779 a.u.) and 3 (0.875 a.u.), which indicates the slight instability of TiO2 NPs under pH 2.6 and 8.00. At a neutral pH, the signal is highest (λmax = 1.008 a.u.), while in acidic and alkaline environments, it decreases. To monitor the effect of nanoparticles on DNA, first, the impact of experimental Environments 1–3 on DNA was studied. In Figure 5b, we observe a characteristic absorption peak for DNA base pairs around the wavelength value of 260 nm (λmax = 1.01 a.u.) with slightly increasing values of λmax in Environments 1 (1.14 a.u.) and 3 (1.084 a.u.), indicating structural changes (double helix structure opening). In Figure 5c, we observe the absorption spectra for DNA, TiO2 NPs, and their mixtures at a 1:1 ratio. After mixing DNA with nanoparticles, the absorbance increases after 5 min of incubation. Due to the hyperchromic shift from 1.01 a.u. to 1.38 a.u., we can conclude that TiO2 NPs interact with the DNA structure, thus destabilizing the double helix. No other significant change in the signal was recorded during the prolonged time of exposure for up to 30 min of interaction of DNA with TiO2 NPs. The bathochromic (red) shift of λmax from 260 nm to 275 nm confirms the interaction of TiO2 NPs with the DNA structure.
To verify the results from the electrochemical part of the experiment, nanoparticles were incubated in the same way in the experimental environments for 30 min, then the signals were recorded for mixtures of DNA with TiO2 NPs from all experimental environments. Th absorption spectra of DNA in the presence and absence of TiO2 NPs are shown in Figure 5d. With the addition of TiO2 NPs to the DNA solution, an increase in the observed absorbance occurs from 1.01 a.u. to 1.5 a.u. The hyperchromic shift indicates disruption of the DNA double helix structure and interaction with TiO2 NPs [50]. The influence of environments with different pH is due to the higher value of absorbance in comparison with Figure 4c (1.38 a.u.), probably due to the pH-induced ROS formation [7]. The bathochromic (red) shift of λmax from 260 nm to 275 nm confirms the interaction of TiO2 NPs with the DNA structure. The decrease in the absorption spectra after the incubation of TiO2 NPs in Environments 1 and 3 in comparison with the incubation of TiO2 NPs in Environment 2 confirmed our results from the biosensing experiment.

4. Conclusions

The main goal of the work was to monitor the effect of the created experimental environments, which served as a simulation of the GIT, on TiO2 NPs and DNA’s interactions with the tested nanoparticles. In the first step, monitoring the effect of TiO2 NPs incubated in environments with different pH values on the DNA/GCE biosensor using CV did not show a change in the DNA layer on the electrode’s surface, so biosensing in a DNA solution with TiO2 NPs was chosen to further characterize their interaction. From the DPV measurements, it was found that during the interaction of DNA with TiO2 NPs, ROS could be formed, and the resulting oxidative stress could cause DNA damage and fragmentation, because of which, the signal for guanine and adenine base residues decreased. Changing the pH of the environment affects the TiO2 NP-induced genotoxic DNA damage in the biosensing experiment by up to 44%. To confirm the findings from the electrochemical measurements, UV–vis spectrophotometry was used, which demonstrated the interaction of DNA with TiO2 NPs by increasing the absorbance for the solution of the mixture of DNA with nanoparticles. The elevated hyperchromic shift of the DNA and TiO2 mixture in experimental Environments 1, 2, and 3 was probably due to the pH-stimulated ROS formation. Specification of the ROS produced will be carried out in future experiments. In the future, in vivo validation experiments in GIT fluids and with other nanoparticles are planned.

Author Contributions

Conceptualization, J.B.; methodology, J.B. and D.B.; software, J.B.; validation, J.B. and D.B.; investigation, J.B. and D.B.; resources, J.B.; data curation, J.B.; writing—original draft preparation, J.B.; writing—review and editing, J.B.; visualization, J.B.; supervision, J.B.; project administration, J.B.; funding acquisition, J.B. All authors have read and agreed to the published version of the manuscript.

Funding

This research received no external funding.

Institutional Review Board Statement

Not applicable.

Informed Consent Statement

Not applicable.

Data Availability Statement

The original contributions presented in this study are included in the article. Further inquiries can be directed to the corresponding author(s).

Conflicts of Interest

The authors declare no conflicts of interest.

Abbreviations

The following abbreviations are used in this manuscript.
CVCyclic voltammetry
DPVDifferential pulse voltammetry
EFSAEuropean Food Safety Authority
FDAUS Food and Drug Administration
GCEGlassy carbon electrode
GITGastrointestinal tract
IARCInternational Agency for Research on Cancer
ROSReactive oxygen species
TiO2Titanium dioxide
TiO2 NPsTitanium dioxide nanoparticles

References

  1. Mao, X.X.; Hao, C.L. Recent advances in the use of composite titanium dioxide nanomaterials in the food industry. J. Food Sci. 2024, 89, 1310–1323. [Google Scholar] [CrossRef] [PubMed]
  2. Heckman, M.M.; Albright, M.C.; Poulsen, K.M.; Tighe, R.M.; Payne, C.K. Cellular and In Vivo Response to Industrial, Food Grade, and Photocatalytic TiO2 Nanoparticles. J. Phys. Chem B 2024, 128, 8878–8885. [Google Scholar] [CrossRef]
  3. Inagaki, Y.; Ishitani, Y.; Tame, A.; Uematsu, K.; Tomioka, N.; Ushikubo, T.; Ujiié, Y. Foraminiferal detoxification breakdown induced by fatal levels of TiO2 nanoparticles. Front. Mar. Sci. 2024, 11, 1381247. [Google Scholar] [CrossRef]
  4. Bastardo-Fernández, I.; Chekri, R.; Oster, C.; Thoury, V.; Fisicaro, P.; Jitaru, P.; Noireaux, J. Assessment of TiO2 (nano)particles migration from food packaging materials to food simulants by single particle ICP-MS/MS using a high efficiency sample introduction system. Nanoimpact 2024, 34, 100503. [Google Scholar] [CrossRef]
  5. Singha, S.K.; Hoque, S.M.; Das, H.; Alim, M.A. Evaluation of chitosan-Ag/TiO2 nanocomposite for the enhancement of shelf life of chili and banana fruits. Heliyon 2023, 9, e21752. [Google Scholar] [CrossRef]
  6. Abdulagatov, I.M.; Maksumova, A.M.; Magomedov, M.Z.; Tsakhaeva, R.O.; Khidirova, S.M.; Salikhov, A.M. Antibacterial Food Packaging Nanomaterial Based on Atomic Layer Deposition for Long-Term Food Storage. J. Food Sci. Technol.-Mysore 2024, 61, 596–606. [Google Scholar] [CrossRef]
  7. Li, J.R.; Zhang, D.Q.; Hou, C.L. Application of Nano-Titanium Dioxide in Food Antibacterial Packaging Materials. Bioengineering 2025, 12, 19. [Google Scholar] [CrossRef]
  8. Phuinthiang, P.; Channei, D.; Ratananikom, K.; Nakaruk, A.; Khanitchaidecha, W. Antibacterial properties of TiO2 nano coating on food packaging surfaces against Escherichia coli and Salmonella typhimurium. Surf. Eng. 2023, 39, 433–444. [Google Scholar] [CrossRef]
  9. Raymond, P.; St-Germain, F.; Paul, S.; Chabot, D.; Deschênes, L. Impact of Nanoparticle-Based TiO2 Surfaces on Norovirus Capsids and Genome Integrity. Foods 2024, 13, 1527. [Google Scholar] [CrossRef]
  10. Gea, M.; Bonetta, S.; Iannarelli, L.; Giovannozz, A.M.; Maurino, V.; Bonetta, S.; Hodoroaba, V.-D.; Armato, C.; Rossi, A.M.; Schilirò, T. Shape-engineered titanium dioxide nanoparticles (TiO2 NP): Cytotoxicity and genotoxicity in bronchial epithelial cells. Food Chem. Toxicol. 2019, 127, 89–100. [Google Scholar] [CrossRef]
  11. Al Mutairi, M.A.; BinSaeedan, N.M.; Alnabati, K.K.; Alotaibi, A.; Al-Mayouf, A.M.; Ali, R.; Alowaifeer, A.M. Characterisation of engineered titanium dioxide nanoparticles in selected food. Food Addit. Contam. Part B-Surveill. 2023, 16, 266–273. [Google Scholar] [CrossRef] [PubMed]
  12. Marucco, A.; Prono, M.; Beal, D.; Alasonati, E.; Fisicaro, P.; Bergamaschi, E.; Carriere, M.; Fenoglio, I. Biotransformation of food-grade and nanometric TiO2 in the oral-gastro-intestial tract: Driving forces and Effect on the toxicity toward intestinal epithelial cells. Nanomaterials 2020, 10, 2132. [Google Scholar] [CrossRef] [PubMed]
  13. Baranowska-Wójcik, E.; Rymuszka, A.; Sieroslawska, A.; Szwajgier, D. Effect of Food Additive E171 and Titanium Dioxide Nanoparticles (TiO2-NPs) on Caco-2 Colon Cancer Cells. Appl. Sci. 2024, 14, 9387. [Google Scholar] [CrossRef]
  14. Baranowska-Wójcik, E.; Welc-Stanowska, R.; Acek, D.W.; Nawrocka, A.; Szwajgier, D. The interactions of pectin with TiO2 nanoparticles measured by FT-IR are confirmed in a model of the gastrointestinal tract. Food Res. Int. 2024, 189, 114509. [Google Scholar] [CrossRef]
  15. Ryabtseva, M.S.; Umanskaya, S.F.; Shevchenko, M.A.; Krivobok, V.S.; Kolobov, A.V.; Nastulyavichus, A.A.; Chentsov, S.I.; Sibirtsev, V.D. Transformation of Nano-Size Titanium Dioxide Particles in the Gastrointestinal Tract and Its Role in the Transfer of Nanoparticles through the Intestinal Barrier. Int. J. Mol. Sci. 2023, 24, 14911. [Google Scholar] [CrossRef]
  16. Tsymbalyuk, O.V.; Davydovska, T.L.; Naumenko, A.M.; Voiteshenko, I.S.; Veselsky, S.P.; Nyporko, A.Y.; Pidhaietska, A.Y.; Kozolup, M.S.; Skryshevsky, V.A. Mechanisms of regulation of motility of the gastrointestinal tract and the hepatobiliary system under the chronic action of nanocolloids. Sci. Rep. 2023, 13, 3823. [Google Scholar] [CrossRef]
  17. Buowmeester, H.; Van Der Zande, M.; Jepson, M.A. Effects of food-borne nanomaterials on gastrointestinal tissues and microbiota. WIREs Nanomed. Nanobiotechnol. 2018, 10, 1481. [Google Scholar] [CrossRef]
  18. Bucher, G.; El Hadri, H.; Asensio, O.; Auger, F.; Barrero, J.; Rosec, J.P. Large-scale screening of E171 food additive (TiO2) on the French market from 2018 to 2022: Occurrence and particle size distribution in various food categories. Food Control 2024, 155, 110102. [Google Scholar] [CrossRef]
  19. Espada-Bernabé, E.; Moreno-Martín, G.; Gómez-Gómez, B.; Madrid, Y. Assesing the behaviour of particulate/nanoparticulate form of E171 (TiO2) food additive in colored chocolate candies before and after in vitro oral ingestion by spICP-MS, TEM and cellular in vitro models. Food Chem. 2024, 432, 137201. [Google Scholar] [CrossRef]
  20. Warheit, D.B. Safety of titanium dioxide (E171) as a food additive for humans. Front. Toxicol. 2024, 6, 1333746. [Google Scholar] [CrossRef]
  21. Chen, T.; Yan, J.; Li, Y. Genotoxicity of titanium dioxide nanoparticles. J. Food Drug Anal. 2014, 22, 95–104. [Google Scholar] [CrossRef] [PubMed]
  22. Andreoli, C.; Leter, G.; De Berardis, B.; Degan, P.; De Angelis, I.; Pacchierotti, F.; Crebelli, R.; Barone, F.; Zijno, A. Critical issues in genotoxicity assessment of TiO2 nanoparticles by human peripheral blood mononuclear cells. J. Appl. Toxicol. 2018, 38, 1471–1482. [Google Scholar] [CrossRef]
  23. Ma, T.; Wang, M.; Gong, S.; Tian, B. Impact of Sediment Organic Matter Content and pH on Ecotoxicity of Coexposure of TiO2 Nanoparticles and Cadmium to Freshwater Snails Bellamya aeruginosa. Arch. Environ. Contam. Toxicol. 2017, 72, 153–165. [Google Scholar] [CrossRef]
  24. Tice, R.; Agurell, E.; Anderson, D.; Burlinson, B.; Hartmann, A.; Kobayashi, H.; Miyamae, Y.; Rojas, E.; Ryu, J.-C.; Sasaki, Y.F. Single cell gel/comet assay: Guidelines for in vitro and in vivo genetic toxicology testing. Environ. Mol. Mutagen. 2000, 35, 206–221. [Google Scholar] [CrossRef]
  25. Rejman, J.; Oberle, V.; Zuhorn, I.S.; Heokstra, D. Size-dependent internalization of particles via pathways of clathrin- and caveolae-mediated endocytosis. Biochem. J. 2004, 377, 159–169. [Google Scholar] [CrossRef]
  26. Chen, M.; Von Mikecz, A. Formation of nucleoplasmic protein aggregates impairs nuclear function in ressponse to SiO2 nanoparticles. Exp. Cell Res. 2005, 305, 51–62. [Google Scholar] [CrossRef]
  27. Li, S.; Zhu, H.; Zhu, R.; Sun, X.; Yao, S.; Wang, S. Impact and mechanism of TiO2 nanoparticles on DNA synthesis in vitro. Sci. China Ser. B Chem. 2008, 51, 367–372. [Google Scholar] [CrossRef]
  28. Zhu, R.R.; Wang, S.L.; Zhang, R.; Sun, X.Y.; Yao, S.D. A Novel Toxicological Evaluation of TiO2 Nanoparticles on DNA structure. Chin. J. Chem. 2007, 25, 958–961. [Google Scholar] [CrossRef]
  29. Federici, G.; Shaw, B.J.; Handy, R.D. Toxicity of titanium dioxide nanoparticles to rainbow trout (Oncorhynchus mykiss): Gill injury, oxidative stress, and other physiological effects. Aquat. Toxicol. 2007, 84, 415–430. [Google Scholar] [CrossRef]
  30. Veranth, J.M.; Kaser, E.G.; Veranth, M.M.; Koch, M.; Yost, G.S. Cytokine responses of human lung cells (BEAS-2B) treated with micron-sized and nanoparticles of metal oxides compared to soil dusts. Part. Fibre Toxicol. 2007, 4, 2. [Google Scholar] [CrossRef]
  31. Dunford, R.; Salinaro, A.; Cai, L.; Serpone, N.; Horikoshi, S.; Hidaka, H.; Knowland, J. Chemical oxidation and DNA damage catalyzed by inorganic sunscreen ingredients. FEBS Lett. 1997, 418, 87–90. [Google Scholar] [CrossRef] [PubMed]
  32. Kashige, N.; Kakita, Y.; Nakashima, Y.; Miake, F.; Watanabe, K. Mechanism of the photocatalytic inactivation of Lactobacillus casei PL-1 by titania thin film. Curr. Microbiol. 2001, 42, 184–189. [Google Scholar] [CrossRef]
  33. Alfhili, M.A.; Hindawi, M.-H.L. Review Article Triclosan: An Update on Biochemical and Molecular Mechanisms. Oxid. Med. Cell. Longev. 2019, 2019, 1607304. [Google Scholar] [CrossRef]
  34. Blaskovicova, J.; Augustin, M.; Vyskocil, V.; Purdesova, A. Ethanol and NaCl-induced gold nanoparticle aggregation toxicity toward DNA investigated with DNA/GCE biosensor. Sensors 2023, 23, 3425. [Google Scholar] [CrossRef]
  35. Svitkova, V.; Blaskovicova, J.; Tekelova, M.; Kallai, B.M.; Ignat, T.; Horackova, V.; Skladal, P.; Kopel, P.; Adam, V.; Farkasova, D.; et al. Assessment of CdS quantum dots effect on UV damage to DNA using a DNA/quantum dots structured electrochemical biosensor and DNA biosensing in solution. Sens. Acutators BChem. 2017, 243, 435–444. [Google Scholar] [CrossRef]
  36. Blaskovicova, J.; Labuda, J. Effect of Triclosan and Silver Nanoparticles on DNA Damage Investigated with DNA-Based Biosensor. Sensors 2022, 22, 4332. [Google Scholar] [CrossRef]
  37. Blaskovicova, J.; Purdesova, A. Simultaneous detection of purine metabolites by membrane modified electrochemical sensors. Acta Chim. Slov. 2022, 15, 54–60. [Google Scholar] [CrossRef]
  38. Blaskovicova, J.; Sochr, J.; Koutsogiannis, A.; Diamantidou, D.; Kopel, P.; Adam, V.; Labuda, J. Detection of ROS Generated by UV-C Irradiation of CdS Quantum Dots and their Effect on Damage to Chromosomal and Plasmid DNA. Electroanalysis 2018, 30, 698–704. [Google Scholar] [CrossRef]
  39. Hlavata, L.; Striesova, I.; Ignat, T.; Blaskovicova, J.; Ruttkay-Nedecky, B.; Kopel, P.; Adam, V.; Kizek, R.; Labuda, J. An electrochemical DNA-based biosensor to study the effects of CdTe quantum dots on UV-induced damage of DNA. Mikrochim. Acta 2015, 182, 1715–1722. [Google Scholar] [CrossRef]
  40. Svitkova, V.; Steffelova, L.; Blaškovičová, J.; Labuda, J. DNA-based biosensors with polyvinyl alcohol external membrane as a tool for the evaluation of antioxidant activity of white wines. Acta Chim. Slov. 2015, 8, 197–202. [Google Scholar] [CrossRef]
  41. Labuda, J.; Brett, A.M.O.; Evtugyn, G.; Fojta, M.; Mascini, M.; Ozsoz, M.; Palchetti, I.; Paleček, E.; Wang, J. Electrochemical nucleic acid-based biosensors: Concepts, terms and methodology. Pure Appl. Chem. 2010, 82, 1161–1187. [Google Scholar] [CrossRef]
  42. Labuda, J.; Vyskocil, V. DNA/Electrode Interface Detection of Damage to DNA Using DNA Modified Electrodes. In Encyclopedia of Applied Electrochemistry; Springer: New York, NY, USA, 2014; pp. 346–350. [Google Scholar]
  43. Wang, J. Towards Genoelectronics: Electrochemical Biosensing of DNA Hybridization. Chem. Eur. J. 1999, 5, 1681–1685. [Google Scholar] [CrossRef]
  44. Sadecka, J.; Netriova, J.; Majek, P. Analyticke Metody v Klinickej Chemii; STU: Bratislava, Slovakia, 2008; pp. 16–17. ISBN 8022728218. [Google Scholar]
  45. Ophus, E.M.; Rode, L.; Gylseth, B.; Nicholson, D.G.; Saeed, K. Analysis of titanium pigments in human lung tissue. J. Work. Environ. Health 1979, 5, 290–296. [Google Scholar] [CrossRef]
  46. Patel, S.; Patel, P.; Bakshi, S.R. Titanium dioxide nanoparticles: An in vitro study of DNA binding, chromosome aberration assay and comet assay. Cytotechnology 2017, 69, 245–263. [Google Scholar] [CrossRef]
  47. Trouiller, B.; Reliene, R.; Westbrook, A.; Solaimani, P.; Schiestl, R.H. Titanium dioxide nanoparticles induce DNA damage and genetic instability in vivo in mice. Cancer Res. 2009, 22, 69–84. [Google Scholar] [CrossRef]
  48. El-Said, K.S.; Ali, E.M.; Kanehira, K.; Taniguchi, A. Molecular mechanism of DNA damage induced by titanium dioxide nanoparticles in toll-like receptor 3 or 4 expressing human hepatocarcinoma cell lines. J. Nanotechnol. 2014, 48, 12–22. [Google Scholar] [CrossRef]
  49. Dobrucka, R. Synthesis of Titanium Dioxide Nanoparticles Using Echinacea purpurea Herba. J. Pharm. Res. 2017, 16, 756–762. [Google Scholar]
  50. Patel, S.; Patel, P.; Undre, S.B.; Pandya, S.R.; Singh, M.; Bakshi, S. DNA binding and dispersion activities of titanium dioxide nanoparticles with UV/vis spectrophotometry, fluorescence spectroscopy and physicochemical analysis at physiological temperature. J. Mol. Liq. 2016, 213, 304–311. [Google Scholar] [CrossRef]
Figure 1. The current CV response of the [Fe (CN)6]3−/4− redox indicator on the bare GCE (a) and the DNA/GCE (b) at selected time intervals from 1 min to 30 min. Effect of TiO2 NPs of various concentrations from 2.5 to 100 µg·mL−1 on the bare GCE (c) and at the surface-attached DNA of a DNA/GCE biosensor (d).
Chemosensors 13 00194 g001aChemosensors 13 00194 g001b
Figure 2. Plot diagrams showing the amount of surviving DNA after incubation of the DNA/GCE biosensor with TiO2, influenced by the concentration of TiO2 (a). Effect of pH of experimental Environments 1, 2, and 3 on TiO2’s genotoxicity toward the DNA/GCE biosensor, calculated as a proportion of surviving DNA from the CV voltammograms and anodic peak current response values of the redox indicator (b).
Chemosensors 13 00194 g002
Figure 3. The current CV response of the [Fe (CN)6]3−/4− redox indicator on the bare GCE in experimental Environments 1, 2, and 3 without the presence of TiO2 (a) and the current CV response of the [Fe (CN)6]3−/4− redox indicator on the DNA/GCE biosensor in the presence of TiO2 incubated in experimental Environments 1 (pH 2.6, (b)), 2 (pH 7.4, (c)) and 3 (pH 8.00, (d)) measured at selected time intervals from 1 min to 30 min.
Chemosensors 13 00194 g003
Figure 4. The figure shows the current DPV response of the adenine (A, +1.0 V) and guanine (G, +0.7 V) DNA residues in Environment 1 with pH 2.6 (a,b), Environment 2 with pH 7.4 (c,d), and Environment 3 with pH 8.00 (e,f) in the presence (a,c,e) and/or absence (b,d,f) of TiO2 NPs.
Chemosensors 13 00194 g004aChemosensors 13 00194 g004b
Figure 5. UV–vis spectra of TiO2 NPs (a), DNA (b), and the TiO2 NP–DNA mixture (d) under the influence of Environments 1, 2, and 3. Effect of incubation time on the TiO2 NP–DNA mixture (c) measured by UV–vis spectroscopy in the interval of 250–500 nm.
Chemosensors 13 00194 g005
Disclaimer/Publisher’s Note: The statements, opinions and data contained in all publications are solely those of the individual author(s) and contributor(s) and not of MDPI and/or the editor(s). MDPI and/or the editor(s) disclaim responsibility for any injury to people or property resulting from any ideas, methods, instructions or products referred to in the content.

