Article

Electrochemical Disposable Printed Aptasensor for Sensitive Ciprofloxacin Monitoring in Milk Samples

by
Daniela Nunes da Silva
,
Thaís Cristina de Oliveira Cândido
and
Arnaldo César Pereira
*
Natural Sciences Department, Federal University of São João del Rei, 74 Praça Dom Helvécio, São João del Rei 36301-160, MG, Brazil
*
Author to whom correspondence should be addressed.
Chemosensors 2025, 13(7), 235; https://doi.org/10.3390/chemosensors13070235 (registering DOI)
Submission received: 30 March 2025 / Revised: 19 June 2025 / Accepted: 24 June 2025 / Published: 28 June 2025

Abstract

An electrochemical aptasensor was developed for the rapid and sensitive detection of ciprofloxacin (CPX) in milk samples. The device was fabricated on a polyethylene terephthalate (PET) substrate using a screen-printing technique with carbon-based conductive ink. Gold nanoparticles (AuNPs) were incorporated to enhance aptamer immobilization and facilitate electron transfer at the electrode surface. The sensor’s analytical performance was optimized by adjusting key parameters, including AuNP volume, DNA aptamer concentration, and incubation times for both the aptamer and the blocking agent (6-mercapto-1-hexanol, MCH). Differential pulse voltammetry (DPV) measurements demonstrated a linear response ranging from 10 to 50 nmol L−1 and a low detection limit of 3.0 nmol L−1. When applied to real milk samples, the method achieved high recovery rates (101.4–106.7%) with a relative standard deviation below 3.1%, confirming its robustness. This disposable and cost-effective aptasensor represents a promising tool for food safety monitoring, with potential for adaptation to detect other pharmaceutical residues in dairy products.

1. Introduction

Bovine milk is among the most widely consumed foods globally due to its high nutritional value. However, a significant concern is the potential contamination of milk with pharmaceuticals, particularly antibiotics [1]. Antibiotics are classified as chemotherapeutic agents that limit or prevent the growth of microorganisms [2]. Although a significant portion of the drug is excreted through urine and feces, residues of the substance may still be present in food products [3], making the establishment of a withdrawal period necessary. This interval is essential to ensure that food products derived from treated animals do not contain antibiotic concentrations exceeding the established maximum residue limit (MRL) [1]. These limits are established according to the different classes of antibiotics.
Ciprofloxacin (CPX), a widely used fluoroquinolone antibiotic, is commonly prescribed for bacterial infections [4]. Residues of CPX in milk can pose serious health risks to humans, including allergic reactions and renal dysfunction. The European Commission Regulation established 0.1 mg kg−1 as the maximum allowable concentration for the sum of enrofloxacin and ciprofloxacin residues in cow’s milk [5].
Numerous methods exist for detecting antibiotic residues in milk, such as chromatographic assays [6,7,8,9], which require sophisticated laboratory equipment and prolonged analysis times. In addition to traditional chromatographic methods, new technologies such as electrochemical sensors have shown promise in the detection of antibiotic residues in food [10,11,12]. We highlight screen-printed electrodes (SPEs) that provide a low-cost, reproducible, and disposable device. Unlike the conventional three-electrode configuration, SPEs can be fabricated by depositing a conductive ink onto a substrate, incorporating the working electrode, counter electrode, and reference electrode into a single, miniaturized system [13,14,15,16]. This design not only enhances the efficiency of electrochemical sensing but also paves the way for integrating biological components. Biological modifiers are frequently employed to confer selectivity to electrochemical devices, leading to biosensors’ development. In biosensors, selective recognition is facilitated by specific biomolecules, such as antibodies, enzymes, and aptamers [17,18].
Aptamers are small single-stranded DNA or RNA oligonucleotides with defined nucleotide sequences, selected from libraries of random oligonucleotides through systematic evolution of ligands by exponential enrichment (SELEX). Aptamer-based electrochemical biosensors (aptasensors) offer advantages in terms of synthesis efficiency and cost reduction when compared to antibodies while maintaining the same level of specificity and affinity. Their unique nucleotide sequences and three-dimensional structures enable specific recognition and binding to their corresponding targets [19,20].
Recent advances in aptasensor design have explored various configurations, including both label-free and labeled strategies, often coupled with signal amplification techniques such as the integration of nanomaterials, enzymatic labels, and redox probes (e.g., ferri/ferrocyanide) [21,22,23]. Gold nanoparticles (AuNPs), in particular, have been employed to modify electrode surfaces due to their excellent conductivity and biocompatibility, thereby enhancing aptamer immobilization and overall sensor performance [24]. For example, Chi et al. developed two electrochemical aptasensors using octahedral Cu2O@Au and rGO-Fe3O4 nanoparticles for tetracycline detection, achieving detection limits as low as 0.3 nM and demonstrating successful application in milk samples with recoveries between 88.6% and 107.8% [25].
These developments underscore the potential of electrochemical aptasensors for the sensitive and selective detection of antibiotic residues in food matrices. Building on this foundation, the present study reports the fabrication of an electrochemical aptasensor for ciprofloxacin detection in milk. The sensor was constructed on a disposable substrate using a conductive ink composed of graphite and carbon black. To enhance its performance, the electrode surface was functionalized with gold nanoparticles, enabling effective aptamer immobilization and signal transduction.

2. Materials and Methods

2.1. Chemicals and Materials

Powdered graphite (purity 98%), acetone, sodium bicarbonate heptahydrate, and monobasic sodium phosphate monohydrate were purchased from Synth (Diadema, SP, Brazil). Potassium ferricyanide and potassium ferrocyanide (K4[Fe(CN)6]) were obtained from Neon (Suzano, SP, Brazil). Potassium chloride was purchased from Êxodo Científica (Sumaré, SP, Brazil). Ciprofloxacin, sodium tetrachloroaurate, and 6-mercapto-1-hexanol (MCH) were purchased from Sigma-Aldrich (St. Louis, MO, USA). Trisodium citrate was purchased from Cinética (Jandira, SP, Brazil). Carbon black was purchased from Cabot (Mauá, SP, Brazil). Powdered silver was obtained from Purex ACS Científica (Rio de Janeiro, RJ, Brazil). A4 sheet/transparent crystalline polyethylene terephthalate (PET) was purchased from BWB Embalagens (Mogi Guaçu, SP, Brazil). Commercial bleach, Santa Clara brand, was purchased from Super Globo Química, Ltd.,(active chlorine content 5% w/w) (Contagem, MG, Brazil). Nail polish, a clear base coat for nails batch number 001, was purchased from Cora (São Paulo, SP, Brazil). Tetracycline hydrochloride (500 mg) and amoxicillin (500 mg) were obtained from Prati-Donaduzzi (Toledo, PR, Brazil). Norfloxacin was obtained from Dr. Reddy’s Laboratories (São Paulo, SP, Brazil). Enrofloxacin was purchased from Hebei Veyong Pharmaceutical (Shijiazhuang, China). Ciprofloxacin hydrochloride (500 mg) was purchased from Laboratório Globo (São José da Lapa, MG, Brazil).
The aptamers were acquired from FastBio (Ribeirão Preto, SP, Brazil) and Synbio Technologies (Monmouth Junction, NJ, USA). The aptamer sequence used in this study, obtained from the literature [26], was thiophosphorylated DNA: ATACCAGCTTATTCAATTGCAGGGTATCTGAGGCTTGATCTACTAAATGTCGTGGGGCATTGCTATTGGCGTTGATACGTACAATCGTAATCAGTTAG.
All reagents were of analytical grade, and all solutions were prepared with water purified by the Milli-Q system (Millipore Inc., Burlington, NJ, USA) (18.2 MΩ cm).

2.2. Instrumentation

Electrochemical measurements were conducted using an Autolab PGSTAT204 potentiostat/galvanostat (Utrecht, The Netherlands). The electrochemical technique utilized was differential pulse voltammetry (DPV). Data acquisition and analysis were performed using Nova 2.1 software.
The synthesized nanoparticles were characterized by UV–vis spectroscopy, with measurements performed on a UV-2550 spectrophotometer, SHIMADZU (Kyoto, Japan) over a wavelength range of 300–800 nm.

2.3. Fabrication of Screen-Printed Carbon Electrodes (SPCEs)

The disposable electrodes, designated as SPCEs, were fabricated through screen printing. Custom molds were designed using a Visutec MVSK800 cutting printer (Uberlândia, Brazil) and assembled onto PET sheets. The printed sensor comprises a three-electrode configuration: a working electrode (WE), a counter electrode (CE), and a quasi-reference electrode (QRE). The device dimensions are 1.5 cm × 3.5 cm. The geometric area of the WE is 0.28 cm2, while the CE has a larger area (0.42 cm2) to ensure efficient current distribution and reduce polarization effects, thus stabilizing the potential at the WE.
A conductive ink was subsequently applied to the molds. The conductive ink consisted of 1.76 g of powdered graphite, 0.59 g of carbon black, and 2.65 g of nail polish, with 5 mL of acetone added as the solvent to ensure thorough homogenization. In this system, nail polish functions as a binder, promoting the adhesion and uniform dispersion of the conductive materials (graphite and carbon black). The complete characterization and optimization of this ink were previously reported by our research group [27]. Further comprehensive characterizations of the sensor are also detailed in this reference. For the QRE, a silver-based ink was employed, made from silver powder, nail polish, and acetone [28].

2.4. Synthesis of AuNPs

The AuNPs were synthesized based on the Turkevich method, which involves the reduction of gold salt by sodium citrate in an aqueous solution. To achieve this, 420 µL of the sodium tetrachloroaurate solution was added to an Erlenmeyer flask containing 94.6 mL of distilled water. The solution was then heated and stirred until it reached 90 °C. Subsequently, 5 mL of the sodium citrate solution was slowly introduced, with constant stirring, and the temperature was maintained at 90 °C for an additional 20 min.

2.5. Immobilization of the Aptamer Sequence on the Working Electrode Surface and Operation of the Aptasensor

Before aptamer immobilization, the working electrode was modified with gold nanoparticles (AuNPs) to facilitate thiol–gold binding and enhance the electrochemical surface area. For this, 10 μL of the freshly prepared AuNP dispersion was deposited onto the working electrode surface by the drop-casting method and subsequently dried in a laboratory oven at 50 °C for 20 min to ensure adequate solvent evaporation and nanoparticle adhesion. Next, 10 μL of a 3 μmol L−1 aptamer sequence solution was added to the electrode and incubated for 30 min at room temperature. After this period, 4 μL of a 1 mmol L−1 MCH solution was added to the electrode for 30 min to fill the unoccupied spaces between the aptamer sequences, as shown in Figure 1.
The aptasensor developed for CPX determination was evaluated using electrochemical measurements. A 10 μL aliquot of a CPX solution (50 nmol L−1) was added to the surface of the Apt-modified electrode and incubated at room temperature for 10 min. The measurements were conducted using differential pulse voltammetry (DPV) in a 0.1 mol L−1 phosphate buffer solution, employing K4[Fe(CN)6] (5 mmol L−1) as the redox indicator, within a potential range of −0.4 to +0.8 V, with a step amplitude of 40 mV and a scan rate of 20 mV s−1. After the incubation steps with aptamer, MCH, and CPX, the electrode surface was carefully washed with phosphate buffer solution (0.1 mol L−1, pH 7.00) to avoid any damage to the layers formed on the working electrode.

2.6. Optimization of Analytical Conditions of the Aptasensor

To optimize the sensitivity, specificity, and reproducibility of the aptasensor, the following parameters were investigated, based on previous studies concerning aptamer–analyte interactions and theoretical considerations regarding nanoparticle surface chemistry: AuNP volume (5–20 µL), aptamer incubation time (15–240 min), aptamer concentration (0.75–5.0 µmol L−1), MCH incubation time (15–60 min), and CPX incubation time (5–45 min). Measurements were performed by DPV under the conditions detailed in the previous section.

2.7. Obtaining the Analytical Curve for the Aptasensor

To assess the sensitivity of the aptasensor, 10 μL aliquots of CPX solutions, prepared in concentrations ranging from 10 to 50 nmol L−1, were carefully deposited onto the surfaces of aptamer-modified electrodes. The electrodes were then incubated at ambient temperature for 10 min to facilitate binding interactions. Following incubation, the electrode surfaces were thoroughly rinsed with phosphate buffer solution (0.1 mol L−1, pH 7.00) to remove unbound analyte. Differential pulse voltammetry was performed under optimized conditions to generate the analytical calibration curve.

2.8. Selectivity, Repeatability, and Reproducibility of the Aptasensor

The selectivity of the proposed aptasensor was evaluated by incubating it with potential interferents, including tetracycline and amoxicillin at a concentration of 400 nmol L−1 (10 times higher than that of ciprofloxacin), as well as norfloxacin and enrofloxacin at the same concentration as ciprofloxacin (40 nmol L−1).
To assess the repeatability of the proposed aptasensor, ten consecutive measurements were carried out using a single sensor in the presence of ciprofloxacin (CPX) at a concentration of 40 nmol L−1. The resulting current responses were recorded, and the relative standard deviation (RSD) was calculated to evaluate the signal stability under repeat use.
The reproducibility of the sensor fabrication process was evaluated by independently preparing five separate aptasensors under the same experimental conditions. Each sensor was used to detect CPX at the same concentration (40 nmol L−1), and the variation among the measurements was analyzed through the corresponding RSD.

2.9. Determination of CPX in Milk Samples

Milk samples were purchased from a local market in São João del-Rei, Brazil. A representative sample was homogenized before analysis to ensure uniformity. To precipitate proteins and remove interfering matrix components, 80 μL of sulfuric acid (0.5 mol L−1) was added to 2 mL of raw milk. The mixture was subsequently centrifuged at 4000 rpm for 10 min. The upper fat layer was carefully removed, and the supernatant was filtered to eliminate residual particulates. To evaluate the aptasensor performance, the processed milk sample was fortified with known concentrations of CPX (11, 21, and 36 nmol L−1) for recovery studies. These concentrations were selected based on the linear range of the method, ensuring that the recovery tests accurately reflect the analytical performance within the working range.

3. Results and Discussion

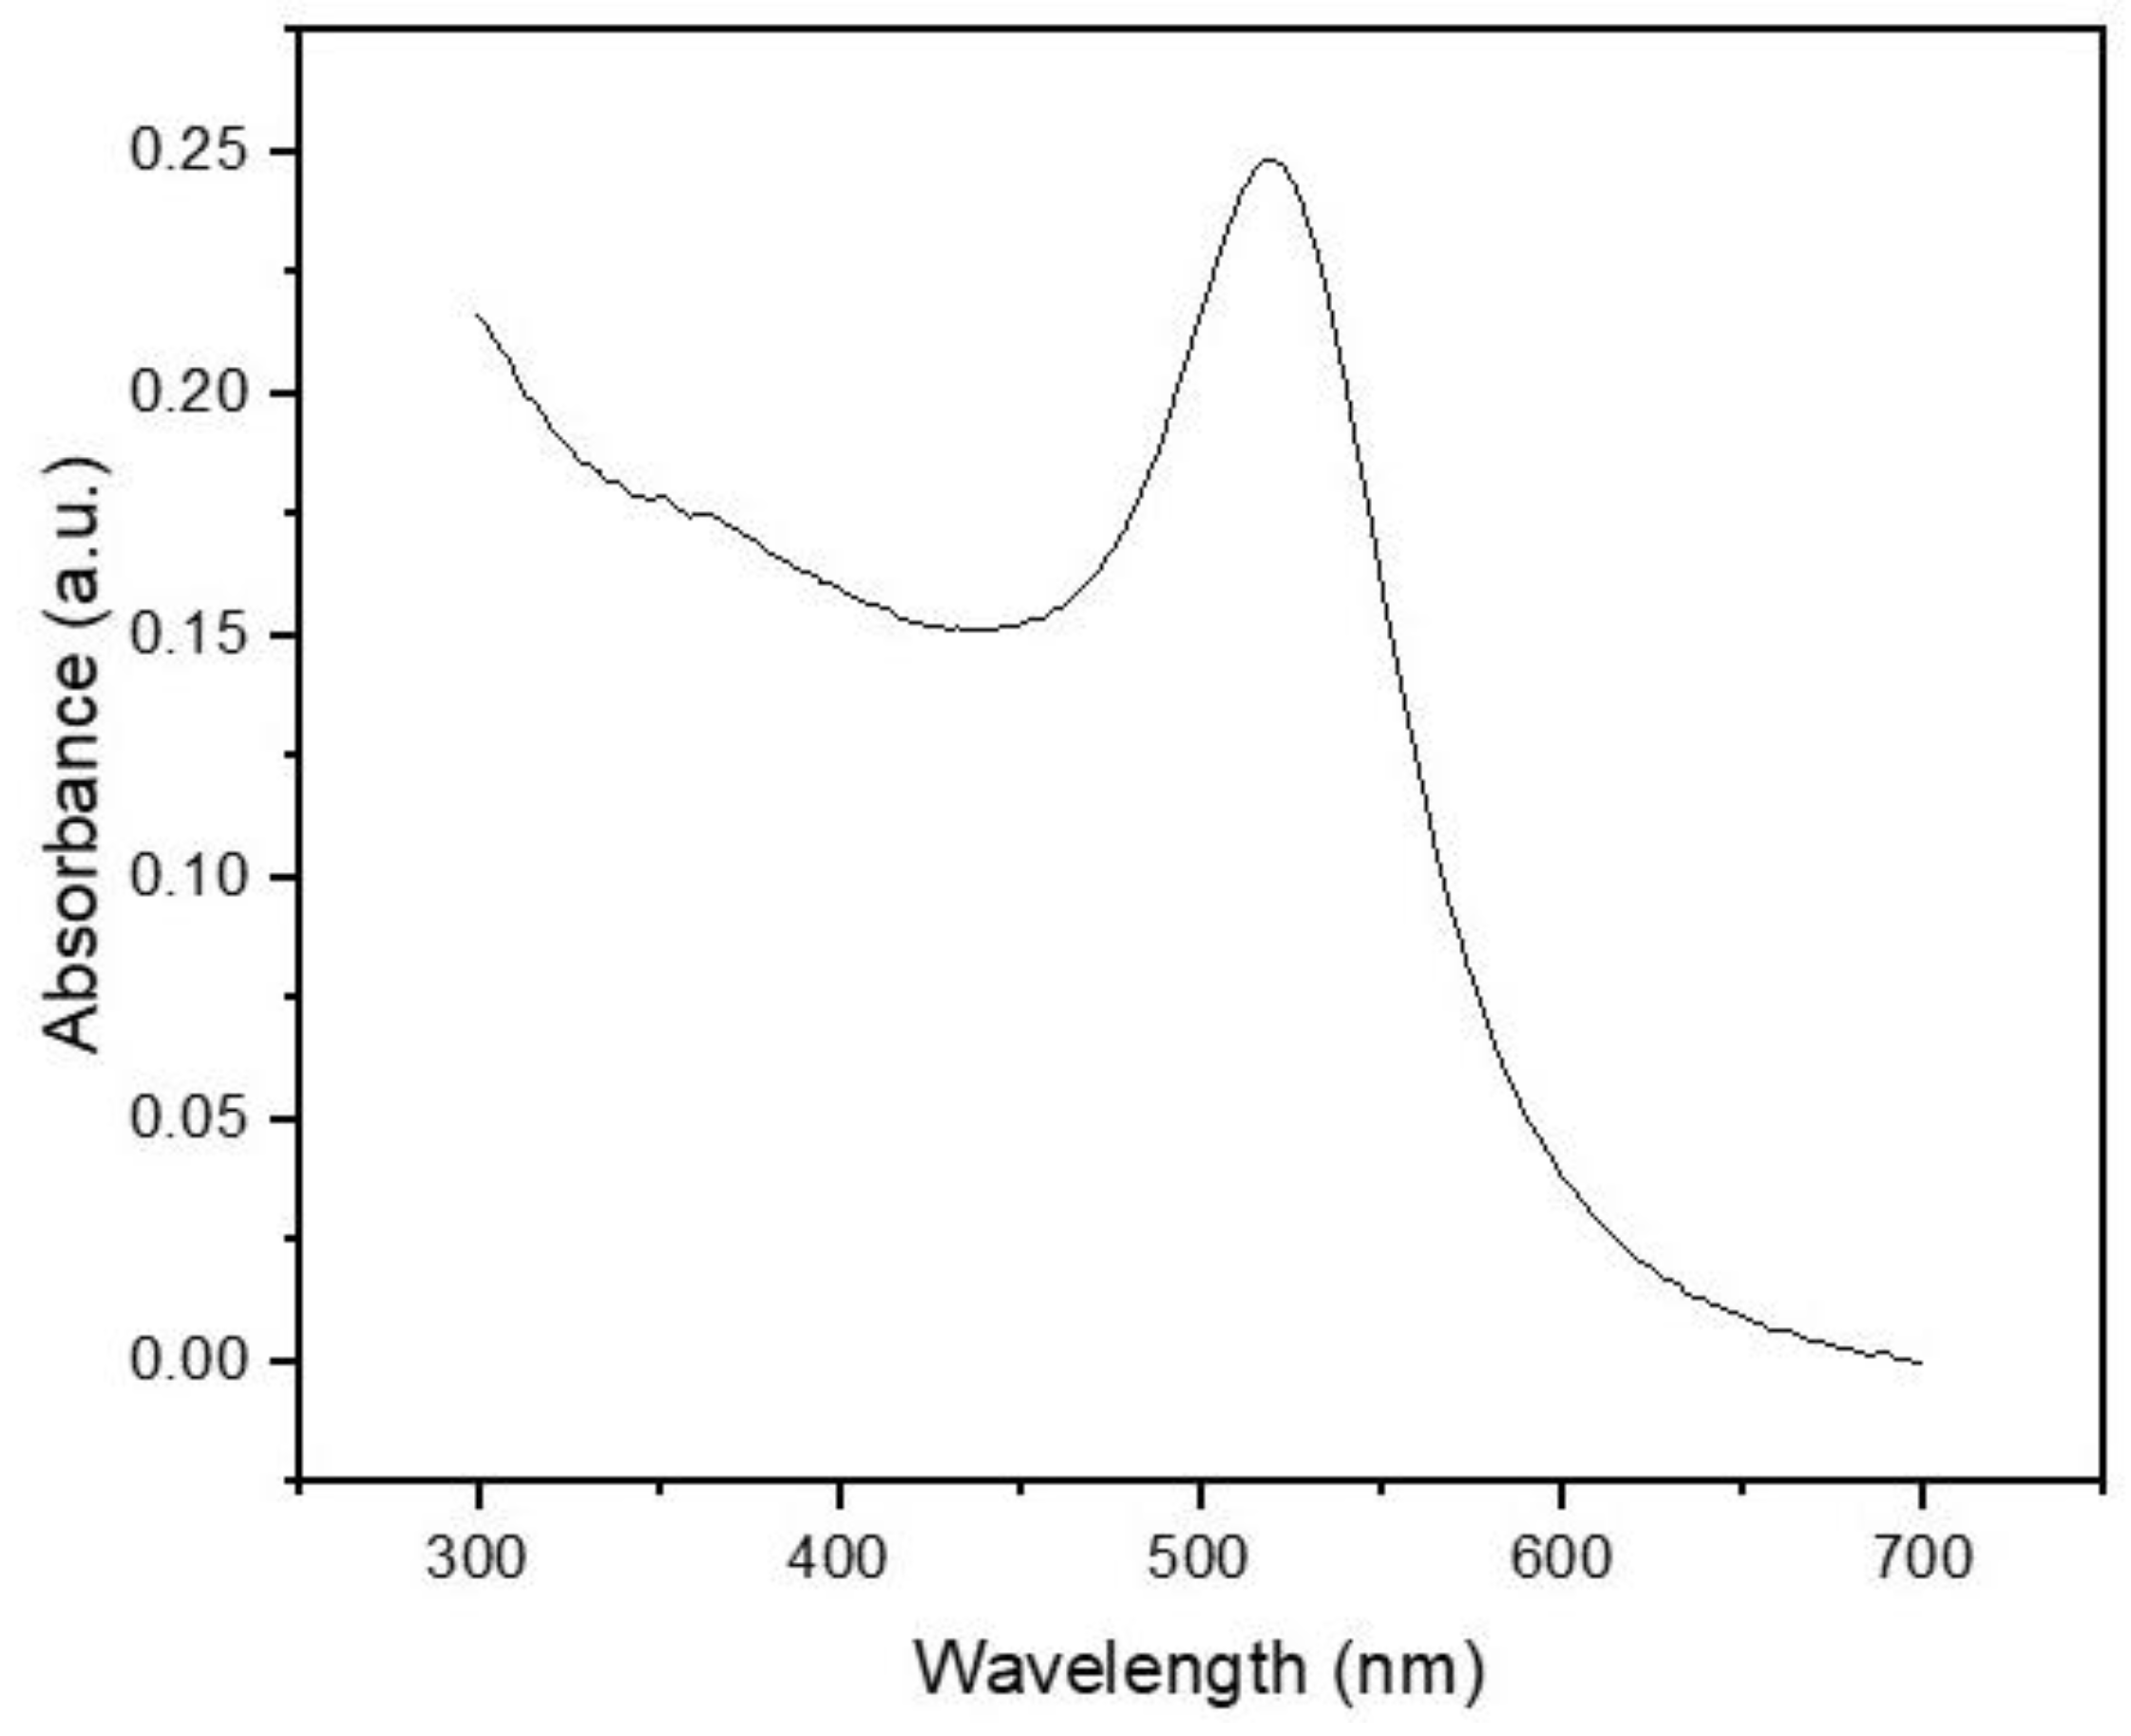
3.1. Characterization of AuNPs

The gold nanoparticles (AuNPs) used in this study were characterized by UV–vis absorption spectroscopy, taking advantage of their localized surface plasmon resonance (LSPR) properties. LSPR arises from the collective oscillation of conduction band electrons at the nanoparticle surface when irradiated with light, and its spectral characteristics are highly sensitive to the nanoparticle’s size, shape, and surrounding medium [29,30].
As shown in Figure 2, the UV–vis spectrum exhibited a distinct absorption peak centered at 520 nm, which is consistent with the LSPR signature of spherical AuNPs with an average diameter of approximately 15–20 nm [31]. This result aligns with the expected morphology of nanoparticles synthesized via the classical Turkevich citrate-reduction method. The absence of secondary peaks or significant spectral broadening above 600 nm suggests a low degree of particle aggregation, further confirming the monodispersity and colloidal stability of the synthesized AuNPs [32].

3.2. Electrochemical Characterization of the Aptasensor

The immobilization of the aptamer on the surface of the electrode modified with gold nanoparticles (AuNPs) was carried out through covalent binding between the thiol (-SH) group at the 5′ end of the aptamer and the gold atoms on the AuNP surface. This strong and specific interaction enables the formation of a stable monolayer [33]. After aptamer immobilization, the electrode surface was incubated with an MCH solution to form a self-assembled monolayer. MCH fills the vacant spaces on the electrode surface, preventing nonspecific adsorption of molecules and enhancing the selectivity of the biosensor [34].
The construction and electrochemical characterization of the aptasensor (SPCE-AuNPs-Apt-MCH-CPX) were investigated by DPV. Measurements were performed in a 0.1 mol L−1 phosphate buffer solution containing 5.0 mmol L−1 K4[Fe(CN)6] as a redox mediator.
Modification of the screen-printed electrode (SPCE) with AuNPs resulted in a significant increase in the anodic peak current (Figure 3b) compared to the unmodified SPCE (Figure 3a). This enhancement is attributed to the synergistic effect of the carbon-based ink, composed of graphite and carbon black, and the AuNPs, which promote an increase in the electrode’s surface area and electrical conductivity. Due to their high surface area and excellent conductivity, AuNPs facilitate electron transfer, thereby amplifying the electrochemical signal [35].
Aptamer (Apt) immobilization on the SPCE-AuNPs surface led to a decrease in the peak current (Figure 3c). This behavior is consistent with the formation of a non-conductive aptamer layer, which hinders electron transfer between the redox mediator and the electrode surface [36]. The adsorption capacity of AuNPs enables aptamer binding through Au-S interactions, forming an organized layer.
Blocking non-specific sites with 6-mercapto-1-hexanol (MCH) resulted in a further reduction in peak current (Figure 3d). MCH forms a self-assembled monolayer that prevents the redox mediator from accessing these sites, thereby decreasing the faradaic current [37,38].
After the binding of ciprofloxacin to the surface-immobilized aptamer, a consistent increase in the oxidation current of the redox probe was observed (Figure 3e). This signal enhancement is attributed to a conformational change in the aptamer structure upon target recognition, which may lead to a more compact and reorganized surface configuration [39]. Such rearrangement can reduce steric and electrostatic barriers at the electrode interface, facilitating more efficient diffusion and electron transfer of the redox mediator. Although molecular modeling of the aptamer geometry was not performed in this study, the experimental results support the hypothesis that the binding-induced folding of the aptamer enhances electron transfer kinetics, thereby increasing the electrochemical signal.

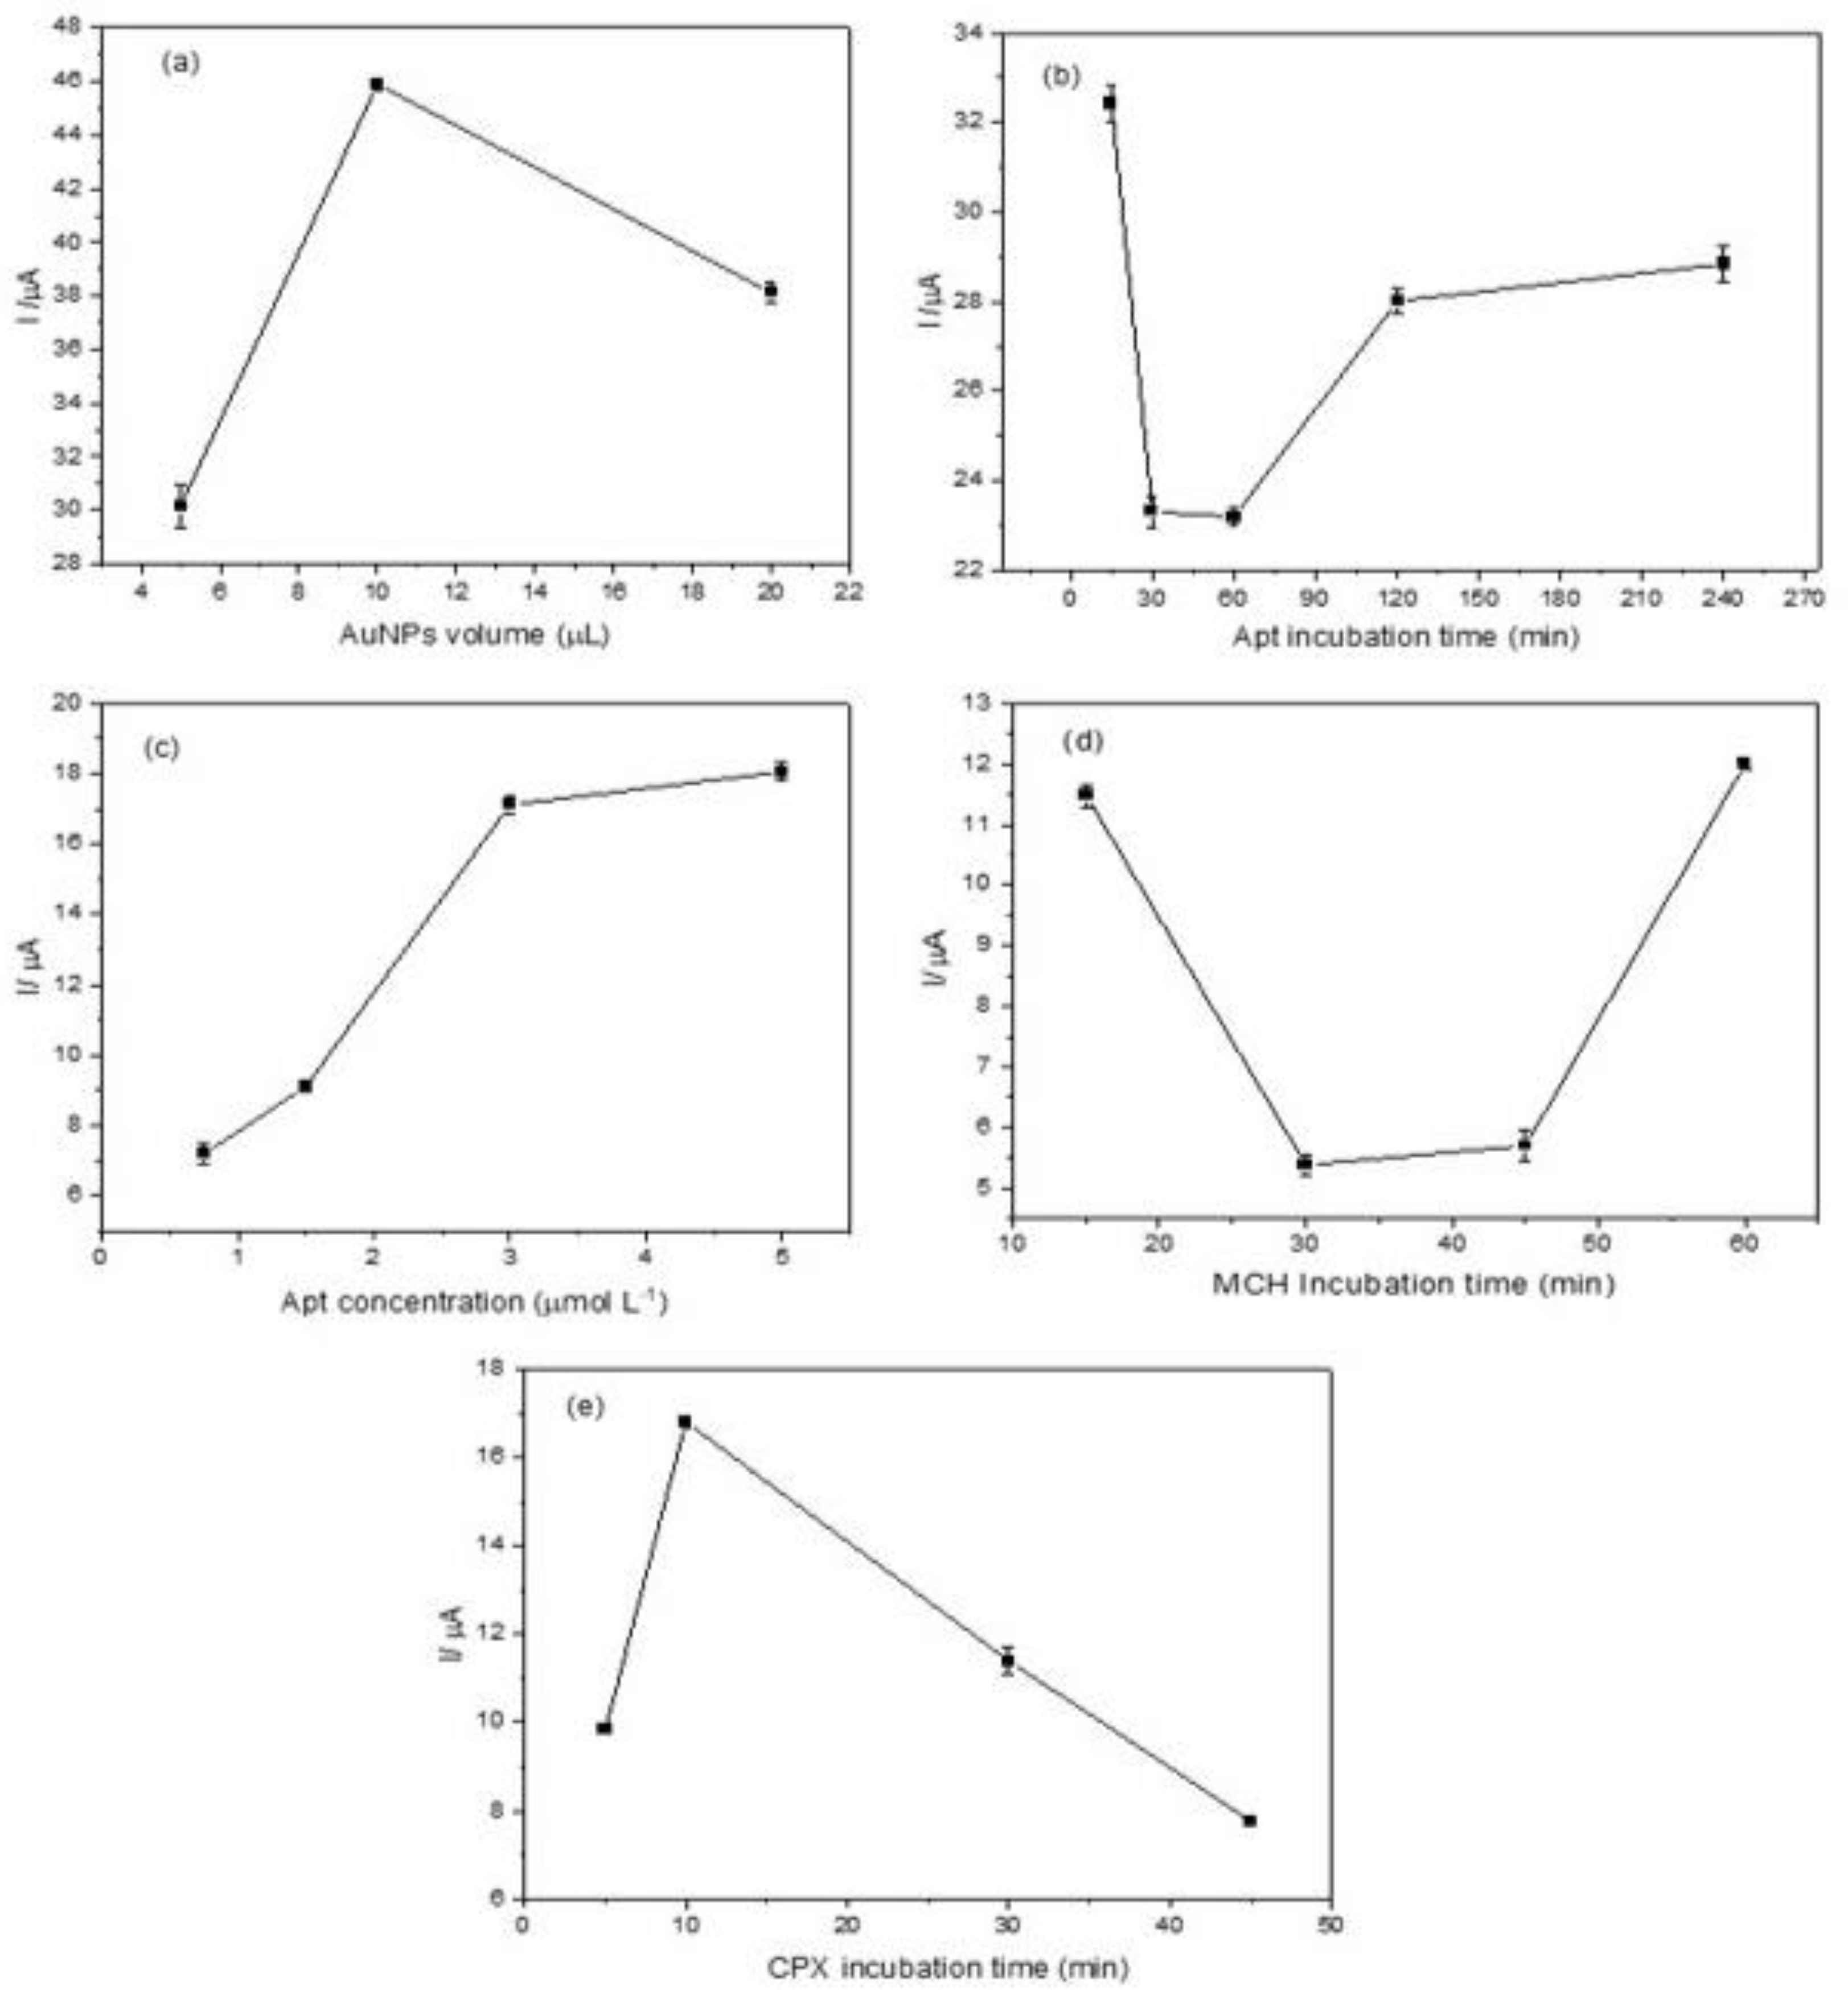
3.3. Aptasensor Optimization

3.3.1. AuNP Volume Optimization

As illustrated in Figure 4a, an increase in peak current was observed with the increase in AuNP volume from 5.0 μL to 10.0 μL. This increase can be attributed to the enhanced electrode surface area and, consequently, the higher number of active sites for electron transfer. However, when the volume was further increased to 20.0 μL, the peak current decreased. This behavior suggests that forming a thick AuNP layer hinders electron transport [40]. Therefore, a volume of 10.0 μL was selected as the optimal modification volume for the aptasensor. For detailed voltammograms, see Figure S1 in the Supplementary Material.

3.3.2. Optimization of Incubation Time and Aptamer Sequence Concentration (Apt)

The aptamer incubation time was evaluated within a range of 15 to 240 min, using an aptamer concentration of 3 μmol L−1 in the absence of the target analyte (CPX). The DPV results are shown in Figure 4b (see also Figure S2). A noticeable decrease in the oxidation signal confirms successful aptamer immobilization [41]. At 15 min of incubation, a high peak current was observed, suggesting incomplete immobilization of the aptamer to the electrode surface. A substantial decrease in peak current at 30 and 60 min indicates improved aptamer binding to AuNPs, suggesting effective immobilization. However, at longer incubation times (120 and 240 min), a peak current increase was detected, likely due to non-specific adsorption, conformational changes in the aptamer, or monolayer degradation. Based on these results, an incubation time of 30 min was selected as the optimal condition, balancing efficient aptamer immobilization with minimal non-specific interactions, thereby enhancing the sensor’s sensitivity.
The aptamer concentration used for electrode modification is a key factor in determining immobilization efficiency, directly influencing target binding and the electrochemical response. In this study, aptamer concentrations of 0.75, 1.5, 3.0, and 5.0 μmol L−1 were evaluated in the presence of CPX (Figure S3). As the aptamer concentration increased, a progressive enhancement in the peak current was observed (Figure 4c), indicating improved aptamer–target interaction. However, at 5.0 μmol L−1, the response tended to reach a plateau, suggesting a saturation effect where no further significant increase in the electrochemical signal occurred. These results indicate that at 3.0 μmol L−1, the aptamer achieves optimal binding with CPX, promoting a conformational change that maximizes the electrochemical response

3.3.3. MCH Incubation Time

The effect of MCH incubation time on the performance of the electrochemical aptasensor was evaluated by varying the incubation time from 15 to 60 min (Figure 4d). A lower peak current was observed at 30 min, indicating a more uniform surface modification and optimal aptamer orientation. Voltammograms showing this trend are provided in Figure S4. At longer incubation times, non-specific interactions may interfere with the ability of MCH to effectively organize the immobilized aptamer, potentially compromising sensor performance.

3.3.4. CPX Incubation Time

The incubation time for CPX binding was investigated over a range of 5 to 45 min. CPX interacts with the aptamer through a specific binding mechanism. The electrochemical signal increased from 5 to 10 min (Figure 4e), indicating an optimal binding event. As previously discussed in the aptamer incubation study, prolonged incubation times may lead to non-specific interactions, which, in turn, reduce the electrochemical response associated with CPX detection. Voltammograms are provided in Figure S5. Therefore, 10 min was identified as the optimal incubation time for CPX, ensuring a balance between specificity and signal intensity.

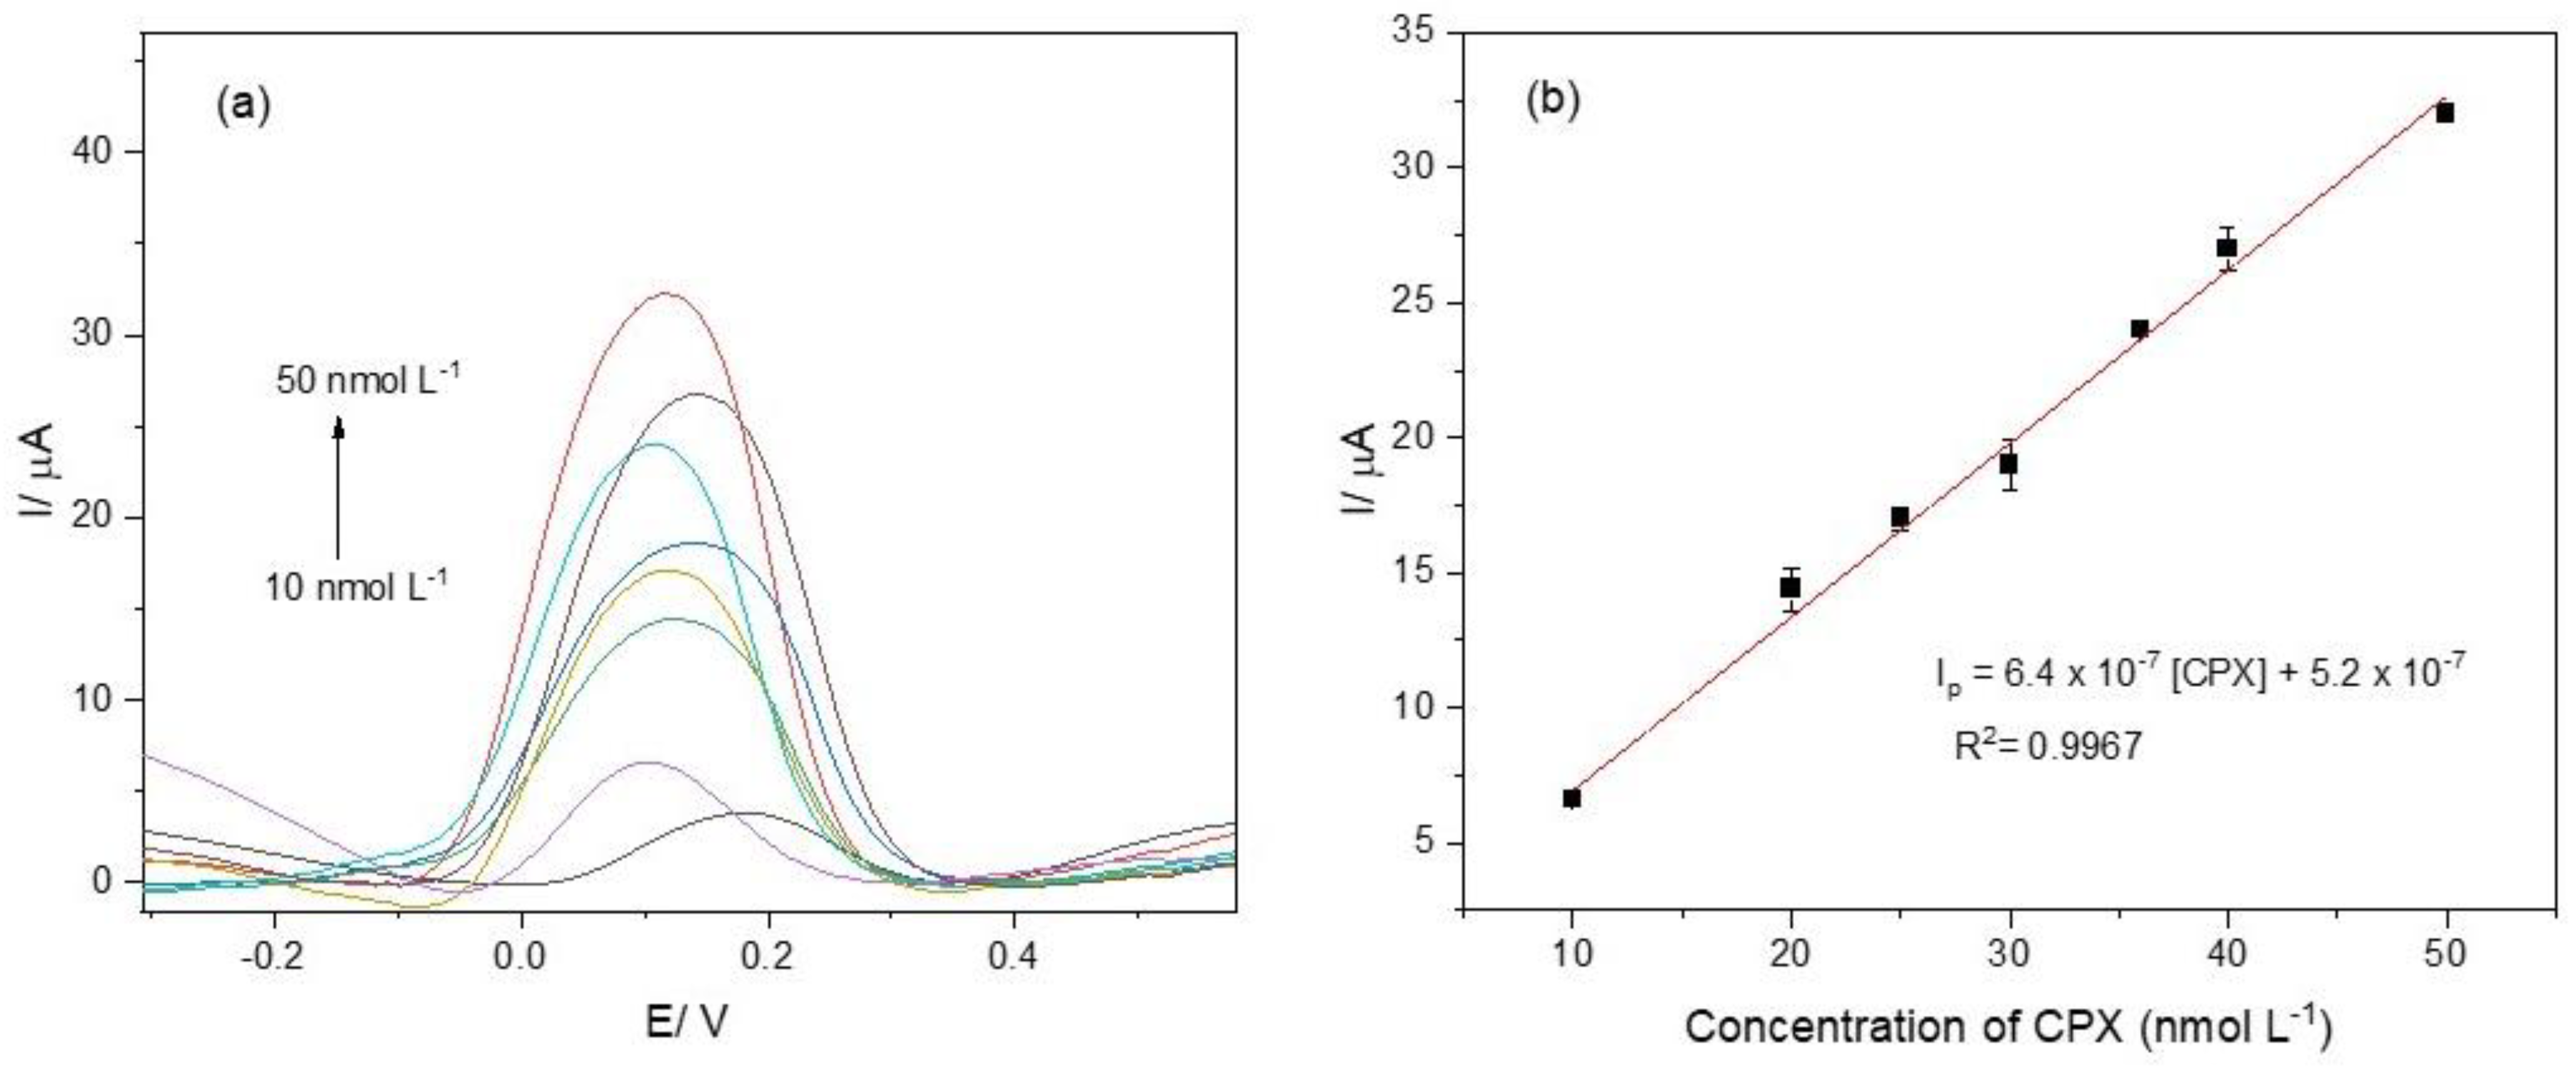
3.4. Analytical Curve for the Aptasensor

The analytical curve was obtained after optimizing the parameters for the electrochemical aptasensor. The voltammograms are presented in Figure 5a. The voltammogram colors represent varying analyte concentrations, with the arrow denoting the direction of increasing concentration. The aptasensor exhibited a linear response in the concentration range of 10 to 50 nmol L−1. The detection limit (LOD) and the quantification limit (LOQ) were calculated based on the parameters of the analytical curve (Figure 5b) [42]: Ip = 6.4 × 10⁻⁷ [CPX] + 5.2 × 10⁻⁷, with a correlation coefficient of 0.9967. The LOD and LOQ were determined as 3.0 nmol L−1 and 10 nmol L−1, respectively.
The comparison of the proposed aptasensor with other sensors reported in the literature (Table 1) highlights the device’s sensitivity. This characteristic, combined with other relevant advantages, underscores its potential. Firstly, the disposable nature of the sensor minimizes the risk of cross-contamination and ensures the reproducibility of analyses, contributing to reliable results. Additionally, low-cost materials make the methodology accessible to research and quality control laboratories.
Considering that the maximum permissible limit for CPX residues in milk is 0.1 mg kg−1 [5], the developed method stands out with a detection limit of 0.000994 mg kg−1. This value is significantly lower than the regulatory limit, demonstrating the aptasensor’s capability to detect CPX in milk samples.

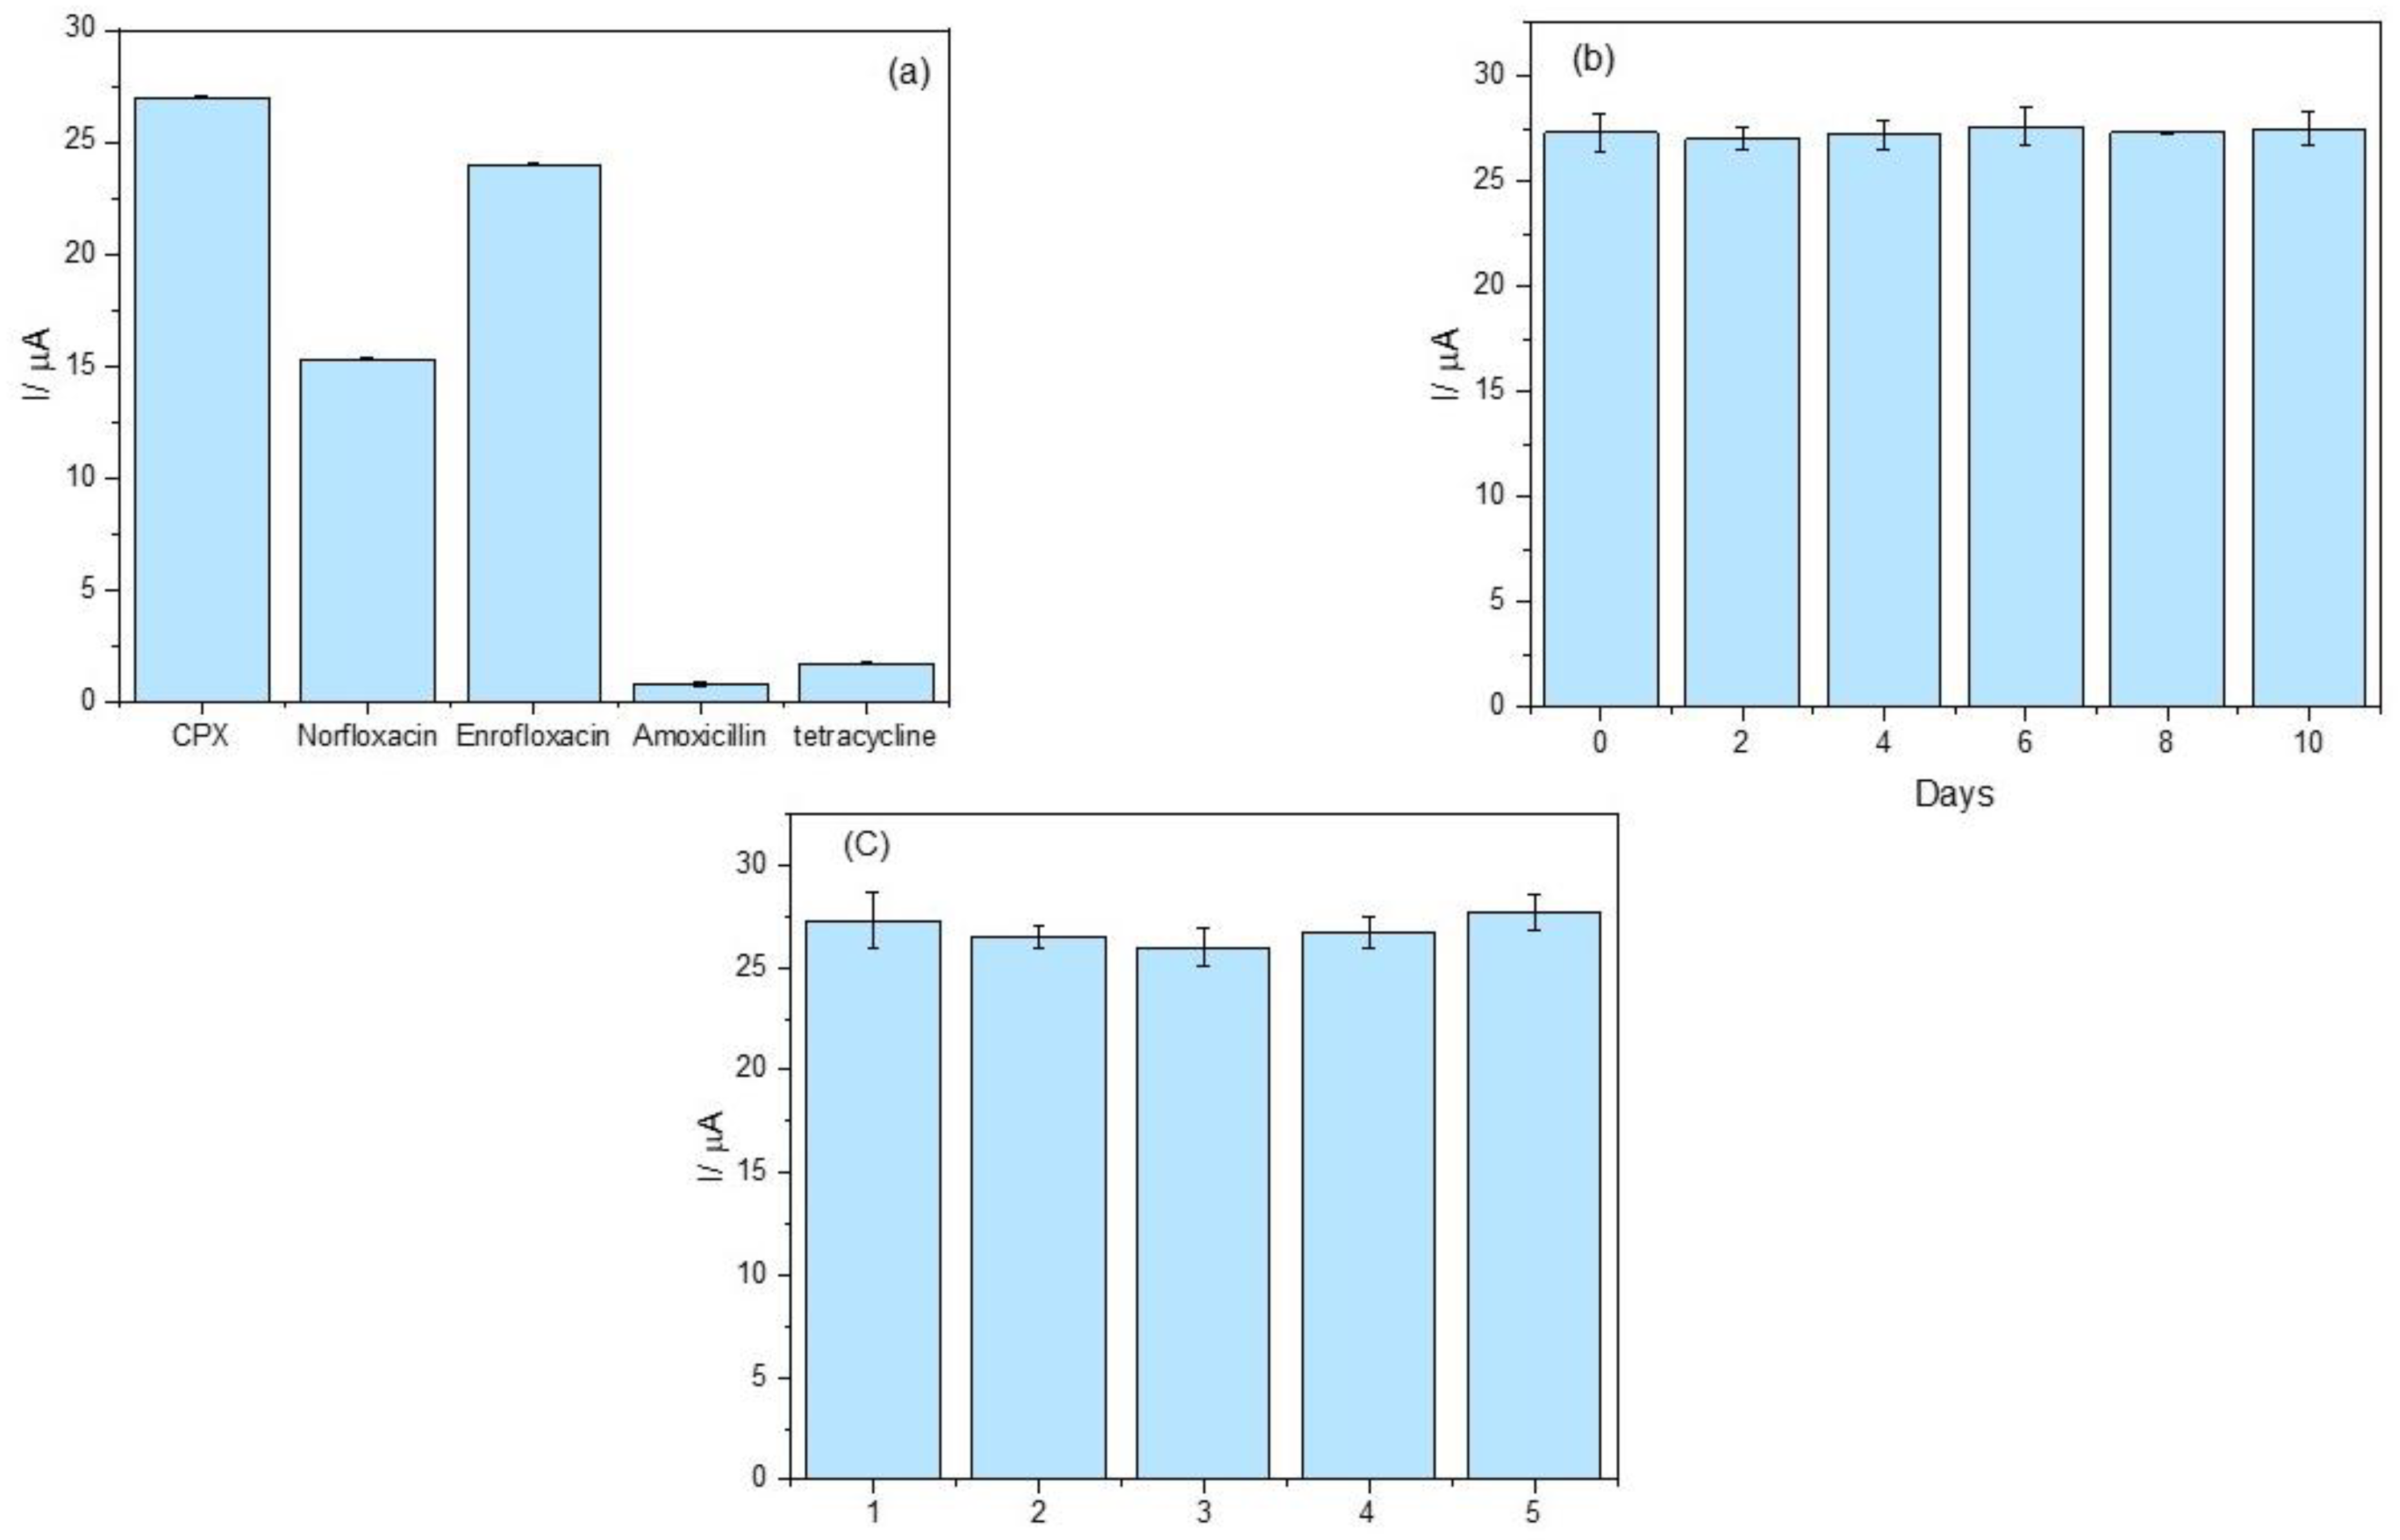
3.5. Evaluation of Selectivity, Repeatability, and Reproducibility of the Aptasensor

The selectivity study compared structurally related compounds at the same concentration while evaluating structurally different antibiotics at higher concentrations to simulate real-sample conditions better and assess potential cross-reactivity. As shown in Figure 6a, the peak current variation was less than 6% in the presence of tetracycline and amoxicillin, indicating negligible interference from these compounds. These results demonstrate that the proposed aptasensor exhibits high selectivity for CPX detection in the presence of these potential interferents.
The response to enrofloxacin and norfloxacin, both belonging to the fluoroquinolone class, reveal a recovery of 56.7% for norfloxacin and 88.9% for enrofloxacin, suggesting that the aptasensor is sensitive to these compounds with potential applicability of the device for fluoroquinolone detection. However, further optimization could enhance specificity by refining the aptamer sequence.
The repeatability of the sensor response was evaluated over ten consecutive days. As depicted in Figure 6b, the results demonstrate excellent signal consistency, with a relative standard deviation (RSD) below 5%. This low variability reflects the chemical stability of the immobilized aptamer and the reliability of the sensing interface over time—an essential attribute for real-world analytical applications.
In terms of reproducibility, independent aptasensors were fabricated and tested under identical conditions. As shown in Figure 6c, an RSD of 1.43% was obtained, underscoring the robustness of the sensor fabrication process. The low inter-device variability confirms the reliability of the platform and supports its potential for scalable, cost-effective deployment in point-of-care diagnostics or routine monitoring.

3.6. Application of Aptasensor in Milk Samples

The application of the developed aptasensor for CPX determination in milk samples is presented in Table 2. The results show recovery rates ranging from 101.4% to 106.7%, with low RSD values, demonstrating the accuracy and reliability of the method. For detailed voltammograms, see Figure S6.

4. Conclusions

The developed printed electrochemical aptasensor exhibits exceptional performance for CPX detection, demonstrating a low detection limit. This remarkable sensitivity and selectivity, especially against other antibiotic classes, are attributed to the high affinity of the immobilized DNA-based aptameric sequence and its favorable interaction with gold nanoparticles, a stability confirmed by UV–vis characterization. The practical applicability of the SPCE-AuNPs-Apt-MCH-CPX was further validated in commercial milk samples across three concentration levels, yielding recovery rates between 101.4% and 106.7%, with an RSD below 3.1%. These results underscore the method’s accuracy and reliability, thereby reinforcing its suitability for CPX determination in dairy matrices. Future investigations could focus on optimizing the electrode surface and integrating the sensor into miniaturized platforms for on-site analysis, ultimately enhancing its real-world applicability.

Supplementary Materials

The following supporting information can be downloaded at: https://www.mdpi.com/article/10.3390/chemosensors13070235/s1, Figure S1: Variation of the anodic peak current as a function of the AuNP volume applied to the electrode. Measurements were performed in Phosphate buffer solution (0.1 mol L−1, pH 7.00) containing 5.0 mmol L−1 K4[Fe(CN)6]. Figure S2: Variation of the anodic peak current as a function of the aptamer incubation time. Measurements were performed in 0.1 mol L−1 phosphate buffer solution, pH 7.0, containing 5.0 mmol L−1 K4[Fe(CN)6]. Figure S3: Variation of the anodic peak current with aptamer concentration. Measurements were performed in 0.1 mol L−1 phosphate buffer solution, pH 7.0, containing 5.0 mmol L−1 K4[Fe(CN)6]. Figure S4: Variation of anodic peak current as a function of MCH incubation time on the electrode surface. Conditions: 0.1 mol L−1 phosphate buffer solution, pH 7.00, containing 5.0 mmol L−1 K4[Fe(CN)6]. Figure S5. Variation of the anodic peak current as a function of CPX incubation time. Measurements were performed in 0.1 mol L−1 phosphate buffer solution (pH 7.00) containing 5.0 mmol L−1 K4[Fe(CN)6]. Figure S6: Differential pulse voltammograms for determining CPX concentrations in milk samples. Measurements were performed in 0.1 mol L−1 phosphate buffer solution (pH 7.00) containing 5.0 mmol L−1 K4[Fe(CN)6].

Author Contributions

Formal analysis, investigation, data curation, methodology development, and manuscript writing: D.N.d.S. and T.C.d.O.C.; A.C.P. contributed to the development of the analytical method, provided resources, and oversaw review, editing, and supervision. All authors have read and agreed to the published version of the manuscript.

Funding

This research received no external funding.

Institutional Review Board Statement

Not applicable.

Informed Consent Statement

Not applicable.

Data Availability Statement

The raw data supporting the conclusions of this article will be made available by the authors on request.

Acknowledgments

The authors gratefully acknowledge the support provided by Fundação de Amparo à Pesquisa do Estado de Minas Gerais (FAPEMIG), Conselho Nacional de Desenvolvimento Científico e Tecnológico (CNPq), Coordenação de Aperfeiçoamento de Pessoal de Nível Superior (CAPES), and INCT-DATREM.

Conflicts of Interest

The authors declare no conflicts of interest.

Abbreviations

The following abbreviations are used in this manuscript:
MRLMaximum Residue Limit (MRL)
CPXCiprofloxacin
SPEsScreen-Printed Electrodes
DNADeoxyribonucleic Acid
RNARibonucleic Acid
SELEXSystematic Evolution of Ligands by Exponential Enrichment
AuNPsGold Nanoparticles
TET Tetracycline
DPVDifferential Pulse Voltammetry
LODDetection Limit
MCH6-mercapto-1-hexanol
PETPolyethylene Terephthalate
SPCEScreen-Printed Carbon Electrode
AptAptamer
LSPRLocalized Surface Plasmon Resonance
LOQQuantification Limit
RSDRelative Standard Deviation

References

  1. Vercelli, C.; Amadori, M.; Gambino, G.; Re, G. A review on the most frequently used methods to detect antibiotic residues in bovine raw milk. Int. Dairy J. 2023, 144, 105695. [Google Scholar] [CrossRef]
  2. Joshi, A.; Kim, K.-H. Recent advances in nanomaterial-based electrochemical detection of antibiotics: Challenges and future perspectives. Biosens. Bioelectron. 2020, 153, 112046. [Google Scholar] [CrossRef]
  3. Santamarina-García, G.; Amores, G.; Gandarias, N.; Hernández, I.; Virto, M. Cross-sectional, commercial testing, and chromatographic study of the occurrence of antibiotic residues throughout an artisanal raw milk cheese production chain. Food Chem. 2024, 442, 138445. [Google Scholar] [CrossRef]
  4. Gao, Y.; Chen, Y.; Li, Z.; Lu, Q.; Chen, Y.; Jiang, Y.; Fang, X.; Song, L.; Mao, X. Sensitive detection of ciprofloxacin in the livestock manure by a portable smartphone platform based on Eu-MOFs@hydrogel composites. Microchem. J. 2025, 211, 113086. [Google Scholar] [CrossRef]
  5. Feng, X.; You, F.; Yuan, R.; Ding, L.; Wang, T.; Min, Y.; Wang, K. Self-validating photoelectrochemical/photoelectrochromic visual sensing platform for ciprofloxacin precise detection in milk. Anal. Chim. Acta 2024, 1330, 343282. [Google Scholar] [CrossRef] [PubMed]
  6. Zhai, S.; Bai, M.; Yue, F.; Wang, H.; Huang, J.; Dong, H.; Yuan, B.; Li, Z.; Zhang, P.; Zhao, M.; et al. Strip biosensors based on broad-spectrum aptamers and cationic polymers for the on-site rapid detection of tetracycline antibiotics residues in milk. Food Chem. 2025, 464 Pt 2, 141743. [Google Scholar] [CrossRef]
  7. Uddin, M.N.; Hasnaine, A.; Haque, M.S.; Das, S.; Uddin, M.; Chakraborty, D.; Mostafa, M. Development of an HPLC-PDA Method for the Simultaneous Estimation of Three Antibiotics in Pharmaceutical Formulations and Bovine Milk and Health Risk Assessment. J. Food Prot. 2024, 87, 100279. [Google Scholar] [CrossRef]
  8. Elgendy, K.; Zaky, M.; Alaa Eldin, T.; Fadel, S. Rapid HPLC determination of ciprofloxacin, ofloxacin, and marbofloxacin alone or in a mixture. Results Chem. 2023, 5, 100749. [Google Scholar] [CrossRef]
  9. Khaled, O.; Ryad, L.; Nagi, M.; Eissa, F. Multiclass method for detecting 41 antibiotic residues in bovine liver, muscle, and milk using LC-Q-Orbitrap-HRMS. J. Food Compos. Anal. 2024, 132, 106299. [Google Scholar] [CrossRef]
  10. Adane, W.D.; Chandravanshi, B.S.; Tessema, M. Multi-elemental nanocomposite electrochemical sensor for the simultaneous determination of azithromycin and enrofloxacin residues in food and water samples. Microchem. J. 2025, 210, 113042. [Google Scholar] [CrossRef]
  11. Adane, W.D.; Chandravanshi, B.S.; Tessema, M. Hypersensitive electrochemical sensor based on thermally annealed gold–silver alloy nanoporous matrices for the simultaneous determination of sulfathiazole and sulfamethoxazole residues in food samples. Food Chem. 2024, 457, 140071. [Google Scholar] [CrossRef] [PubMed]
  12. Varatharajan, P.; Rajaji, U.; Kutii Rani, S.; Vasimalai, N.; Govindasamy, M. Ultrasonic synthesis of MOF-based hybrid composite for electrochemical detection of furazolidone antibiotic in food and biological samples. Surf. Interfaces 2024, 55, 105384. [Google Scholar] [CrossRef]
  13. Wongpakdee, T.; Nacapricha, D.; McCord, B. Modification of screen-printed electrodes using gold nanostructures for SERS detection of low explosives. Forensic Chem. 2025, 42, 100636. [Google Scholar] [CrossRef]
  14. Silva, F.W.L.; Name, L.L.; Tiba, D.Y.; Braz, B.F.; Santelli, R.E.; Canevari, T.C.; Cincotto, F.H. High sensitivity, low-cost, and disposability: A novel screen-printed electrode developed for direct electrochemical detection of the antibiotic ceftriaxone. Talanta 2024, 266, 125075. [Google Scholar] [CrossRef]
  15. Hannah, S.; Addington, E.; Alcorn, D.; Shu, W.; Hoskisson, P.A.; Corrigan, D.K. Rapid antibiotic susceptibility testing using low-cost, commercially available screen-printed electrodes. Biosens. Bioelectron. 2019, 145, 111696. [Google Scholar] [CrossRef]
  16. Ribeiro, B.V.; Ferreira, L.F.; Franco, D.L. Advances in biosensor development for the determination of antibiotics in cow’s milk—A review. Talanta Open 2022, 6, 100145. [Google Scholar] [CrossRef]
  17. Sumitha, M.S.; Xavier, T.S. Recent advances in electrochemical biosensors—A brief review. Hybrid Adv. 2023, 2, 100023. [Google Scholar] [CrossRef]
  18. Lee, Y.Y.; Sriram, B.; Wang, S.-F.; Kogularasu, S.; Chang-Chien, G.-P. A comprehensive review on emerging role of rare earth oxides in electrochemical biosensors. Microchem. J. 2023, 193, 109140. [Google Scholar] [CrossRef]
  19. Mathavan, S.; Tam, Y.; Mustaffa, K.M.F.; Tye, G. Aptamer based immunotherapy: A potential solid tumor therapeutic. Front. Immunol. 2025, 16, 1536569. [Google Scholar] [CrossRef]
  20. da Silva, D.N.; Pereira, A.C. Relevant Aspects in the Development of Electrochemical Aptasensors for the Determination of Antibiotics—A Review. Electrochem 2023, 4, 553–567. [Google Scholar] [CrossRef]
  21. El Hage, R.; El Hage, A.; El Hage, M.; Karam, M.; El Hage, M.; El Hage, C.; El Hage, R.; El Hage, A. Enhancing antibiotic detection via an aptasensor. Biosensors 2025, 15, 345. [Google Scholar]
  22. Zhao, Y.; Wang, Y.; Li, Y.; Li, J.; Wu, Y.; Zhang, Y.; Wang, J. An electrochemical aptasensor based on AuPt@PEI-g-C3N4 combined with a rolling circle amplification strategy for ultrasensitive detection of ciprofloxacin. Microchem. J. 2024, 197, 109871. [Google Scholar]
  23. Zhang, L.; Wang, X.; Luo, J.; Ma, C.; Zhang, H. Electrochemical detection of ciprofloxacin using a graphene oxide–ZnO nanocomposite modified electrode. Microchem. J. 2023, 189, 108512. [Google Scholar]
  24. Lai, H.; Ming, P.; Wu, M.; Wang, S.; Sun, D.; Zhai, H. An electrochemical aptasensor based on P-Ce-MOF@MWCNTs as signal amplification strategy for highly sensitive detection of zearalenone. Food Chem. 2023, 423, 136331. [Google Scholar] [CrossRef] [PubMed]
  25. Chi, C.; Lin, X.; Sun, Q.; Huang, X.; Bo, S.; Huang, Z.; Zhou, S. A study on fast detection methods for tetracycline antibiotic residues based on magnetic nanoparticles and electrochemical aptasensors. Alex. Eng. J. 2025, 110, 322–328. [Google Scholar] [CrossRef]
  26. Abnous, K.; Danesh, N.M.; Alibolandi, M.; Ramezani, M.; Taghdisi, S.M.; Emrani, A.S. A novel electrochemical aptasensor for ultrasensitive detection of fluoroquinolones based on single-stranded DNA-binding protein. Sens. Actuators B Chem. 2017, 240, 100–106. [Google Scholar] [CrossRef]
  27. da Silva, D.N.; de Oliveira Cândido, T.C.; Pereira, A.C. Simple and disposable device based on gold nanoparticles modified screen-printed carbon electrode for detection of ciprofloxacin. J. Solid State Electrochem. 2025, 29, 901–914. [Google Scholar] [CrossRef]
  28. Oliveira, A.E.F.; Pereira, A.C.; Campos de Resende, M.A.; Ferreira, L.F. Fabrication of a Simple and Cheap Screen-Printed Silver/Silver Chloride (Ag/AgCl) Quasi-Reference Electrode. Electroanalysis 2022, 34, 809. [Google Scholar] [CrossRef]
  29. Kelly, K.L.; Coronado, E.; Zhao, L.L.; Schatz, G.C. The Optical Properties of Metal Nanoparticles: The Influence of Size, Shape, and Dielectric Environment. J. Phys. Chem. B 2003, 107, 668–677. [Google Scholar] [CrossRef]
  30. Link, S.; El-Sayed, M.A. Spectral Properties and Relaxation Dynamics of Surface Plasmon Electronic Oscillations in Gold and Silver Metallic Nanoparticles. J. Phys. Chem. B 1999, 103, 8410–8426. [Google Scholar] [CrossRef]
  31. Haiss, C.; Thanh, N.T.K.; Aveyard, J.; Fernig, D.G. Determination of Gold Nanoparticle Size Via UV-Vis Spectroscopy. Anal. Chem. 2007, 79, 4215–4221. [Google Scholar] [CrossRef] [PubMed]
  32. Love, J.C.; Estroff, L.A.; Kriebel, J.K.; Nuzzo, R.G.; Whitesides, G.M. Self-assembled monolayers of thiolates on metals as a form of nanotechnology. Chem. Rev. 2005, 105, 1103–1169. [Google Scholar] [CrossRef] [PubMed]
  33. Liu, X.; Atwater, M.A.; Wang, J.V.; Huo, Q. Extinction Coefficient of Gold Nanoparticles with Different Sizes and Different Capping Ligands. Colloids Surf. B 2007, 58, 3–7. [Google Scholar] [CrossRef]
  34. Wiaderldewicz, R.; Ruiz-Carrillo, A. Mismatch and blunt to protruding-end joining by DNA ligases. Nucleic Acids Res. 1987, 15, 7831–7848. [Google Scholar] [CrossRef]
  35. Willner, I.; Zayats, M. Electronic and electrochemical communication with redox enzymes and proteins using supramolecular assemblies. Angew. Chem. Int. Ed. 2007, 46, 2508–2585. [Google Scholar]
  36. Plaxco, K.W.; Soh, H.T. Observing proteins with electrochemical aptamer-based sensors. Trends Biotechnol. 2011, 29, 17–23. [Google Scholar]
  37. Alhindawi, M.; Rhouati, A.; Noordin, R.; Cialla-May, D.; Popp, J.; Zourob, M. Selection of ssDNA aptamers and construction of an aptameric electrochemical biosensor for detecting Giardia intestinalis cyst protein. Sens. Diagn. 2025, 4, 82–89. [Google Scholar] [CrossRef]
  38. Khosropour, H.; Maeboonruan, N.; Sriprachuabwong, C.; Tuantranont, A.; Laiwattanapaisal, W. A new double signal on electrochemical aptasensor based on gold nanoparticles/graphene nanoribbons/MOF-808 as enhancing nanocomposite for ultrasensitive and selective detection of carbendazim. OpenNano 2022, 8, 100086. [Google Scholar] [CrossRef]
  39. Ricci, F.; Plaxco, K.W. Using electrochemical methods to monitor DNA interactions and DNA-based structures. Chem. Soc. Rev. 2009, 38, 2372–2381. [Google Scholar]
  40. Liu, Y.; Gao, F.; Zhang, Q.; Li, J.; Liu, M. A gold nanoparticle-based electrochemical aptasensor for sensitive detection of malathion in environmental samples. Biosens. Bioelectron. 2024, 233, 115609. [Google Scholar]
  41. Yang, Y.; Yan, W.; Guo, Y.; Wang, X.; Zhang, F.; Yu, L.; Guo, C.; Fang, G. Sensitive and selective electrochemical aptasensor via diazonium-coupling reaction for label-free determination of oxytetracycline in milk samples. Sens. Actuators Rep. 2020, 2, 100009. [Google Scholar] [CrossRef]
  42. dos Santos, S.M.V.; Oliveira, P.R.; Oliveira, M.C.; Bergamini, M.F.; Marcolino-Jr, L.H. Eletrodos impressos construídos por serigrafia utilizando negro de fumo como material condutor. Rev. Virtual Quím. 2017, 9, 626. [Google Scholar] [CrossRef]
  43. Chauhan, R.; Gill, A.S.; Nate, Z.; Karpoormath, R. Highly selective electrochemical detection of ciprofloxacin using reduced graphene oxide/poly(phenol red) modified glassy carbon electrode. J. Electroanal. Chem. 2020, 871, 114254. [Google Scholar] [CrossRef]
  44. Matsunaga, T.; Kondo, T.; Osasa, T.; Kotsugai, A.; Shitanda, I.; Hoshi, Y.; Itagaki, M.; Aikawa, T.; Tojo, T.; Yuasa, M. Sensitive electrochemical detection of ciprofloxacin at screen-printed diamond electrodes. Carbon 2020, 159, 247–254. [Google Scholar] [CrossRef]
  45. Sadeghi, S.; Javanshiri-Ghasemabadi, J. Bimetallic metal-organic framework/Ni-doped ZnO nanomaterials modified carbon paste electrode for selective electrochemical determination of ciprofloxacin. RSC Adv. 2024, 14, 7836–7849. [Google Scholar] [CrossRef]
  46. Jiwanti, P.K.; Sukardi, D.K.A.; Sari, A.P.; Tomisaki, M.; Wafiroh, S.; Hartati, S.; Arramel, Y.H.; Wong, P.M.; Juan, J.C. Fabrication and characterization of rGO-SnO2 nanocomposite for electrochemical sensor of ciprofloxacin. Sens. Int. 2024, 5, 100276. [Google Scholar] [CrossRef]
Figure 1. Schematic representation of the surface modification of the printed electrode modified with AuNPs and the immobilization of the thiolated aptamer sequence on the electrode surface, organized with the aid of 6-mercapto-hexanol (MCH).
Chemosensors 13 00235 g001
Figure 2. UV–vis absorption spectrum of AuNPs.
Chemosensors 13 00235 g002
Figure 3. Differential pulse voltammograms at different electrode modification stages in 0.10 mol L−1 phosphate buffer (pH 7.00) containing 5.0 mmol L−1 K4[Fe(CN)6]: (a) SPCE; (b) SPCE-AuNPs; (c) SPCE-AuNPs-Apt; (d) SPCE-AuNPs-Apt-MCH; (e) SPCE-CB-AuNPs-Apt-MCH-CPX.
Chemosensors 13 00235 g003
Figure 4. Optimization of the electrochemical aptasensor: (a) anodic peak current variation as a function of the AuNP volume applied to the electrode; (b) effect of aptamer incubation time on the anodic peak current; (c) influence of aptamer concentration on the anodic peak current in the presence of CPX (50 nmol L−1); (d) impact of MCH incubation time on the anodic peak current; (e) anodic peak current variation with CPX (50 nmol L−1) incubation time. Measurements were performed in 0.1 mol L−1 phosphate buffer solution (pH 7.00) containing 5.0 mmol L−1 K4 [Fe (CN)6].
Chemosensors 13 00235 g004
Figure 5. (a) Differential pulse voltammograms recorded for CPX at concentrations of 10, 20, 25, 30, 36, 40, and 50 nmol L−1; (b) analytical curve constructed from the voltammograms shown in Figure 5a. The electrochemical measurements were performed in 0.1 mol L−1 phosphate buffer solution (pH 7.00) containing 5.0 mmol L−1 K4[Fe(CN)6].
Chemosensors 13 00235 g005
Figure 6. (a) Selectivity assessment of the aptasensor; (b) repeatability evaluation over ten days (n = 3); (c) reproducibility analysis across five independently fabricated sensors (n = 3). The electrochemical measurements were performed in 0.1 mol L−1 phosphate buffer solution (pH 7.00) containing 5.0 mmol L−1 K4[Fe(CN)6].
Chemosensors 13 00235 g006
Table 1. Comparison of the performance of the proposed aptasensor for CPX detection with that of other electrochemical devices.
Technique/ElectrodeLinear Range (μmol L−1)LOD (μmol L−1)Reference
DPV/rGO/PPR/GCE a0.002–0.05 and 0.05–400
1–170
0.002[43]
LSV/O-BDDP-printed electrodes b1–300.59[44]
DPV/Cu/Ce-MOF/NZP/CPE c0.75–1000.14[45]
SWV/SPE/rGO-SnO2 d30–1002.03[46]
DPV/SPCE-AuNPs-Apt-MCH-CPX 0.01–0.050.003This work
a. Reduced graphene oxide/poly (phenol red) modified glassy carbon electrode. b. Linear sweep voltammogram (LSV). Oxygen-terminated boron-doped diamond powder (O-BDDP). c. Paste electrode (CPE) bimetallic copper/cerium-based metal organic framework (Cu/Ce-MOF) and nickel-doped zinc oxide nanoparticles (NZP)carbon. d. Square wave voltammetry (SWV). Screen-printed electrode (SPE) modified by rGO-SnO2 nanocomposite.
Table 2. Detection of CPX in fortified milk samples using the developed aptasensor.
Added
Concentration
(nmol L−1)
Found
Concentration (nmol L−1)
* RSD (%)Recovery (%)
1111.23.1101.8
2122.41.6106.7
3636.51.3101.4
* n = 3
Disclaimer/Publisher’s Note: The statements, opinions and data contained in all publications are solely those of the individual author(s) and contributor(s) and not of MDPI and/or the editor(s). MDPI and/or the editor(s) disclaim responsibility for any injury to people or property resulting from any ideas, methods, instructions or products referred to in the content.

