Article

Sensitive Hydrogen Peroxide Sensor Based on Hexacyanoferrate Nickel–Carbon Nanodots

by
Emiliano Martínez-Periñán
1,2,*,
Juan Manuel Hernández-Gómez
1,
Encarnación Lorenzo
1,2,3 and
Cristina Gutiérrez-Sánchez
1,2,*
1
Departamento de Química Analítica y Análisis Instrumental, Universidad Autónoma de Madrid, 28049 Madrid, Spain
2
Institute for Advanced Research in Chemical Sciences (IAdChem), Universidad Autónoma de Madrid, 28049 Madrid, Spain
3
IMDEA-Nanociencia, Ciudad Universitaria de Cantoblanco, 28049 Madrid, Spain
*
Authors to whom correspondence should be addressed.
Chemosensors 2025, 13(6), 195; https://doi.org/10.3390/chemosensors13060195
Submission received: 7 April 2025 / Revised: 12 May 2025 / Accepted: 14 May 2025 / Published: 22 May 2025
(This article belongs to the Special Issue Electrochemical Sensor for Food Analysis)

Abstract

:
An electrochemical sensor was developed for the detection of hydrogen peroxide (H2O2) based on the in situ formation of a nickel hexacyanoferrate complex on the electrode surface. Screen-printed carbon electrodes were modified with nickel-doped carbon nanodots (Ni-CNDs), and a nickel hexacyanoferrate complex was electrogenerated over the nickel carbon nanodots. Ni-CNDs were synthetized “a la carte” in one step by including nickel (II) acetate as precursor and characterized using different techniques: transmission electron microscopy (TEM), energy-dispersive X-ray spectroscopy, atomic force microscopy (AFM), and infrared spectroscopy (FTIR). The electrocatalytic activity toward H2O2 reduction and the oxidation of the resulting modified electrodes was studied. The developed sensor had a strong electrocatalytic effect on the oxidation and reduction of H2O2, yielding detection limits of 3.22 and 0.49 μM, respectively. The H2O2 content of a tap water sample was determined, confirming the viability of the developed electrochemical sensor.

Graphical Abstract

1. Introduction

Hydrogen peroxide (H2O2) is an analyte that arouses great interest because it is a hazardous chemical agent. It is a waste product of many industries and atomic plants, so it can be present in rain and groundwater [1,2]. Additionally, H2O2 is used to disinfect water in swimming pools, food, and beverage packages [3,4,5]. Also, H2O2 is a byproduct of oxidase enzymes because the enzymes that catalyze the oxidation of this analyte generate H2O2 during the enzymatic reaction; therefore, electrochemical biosensors have been developed based on the detection of H2O2 [6,7] and are included in most enzyme-based analytical kits. Furthermore, H2O2 is used as a non-invasive inflammatory marker that reflects oxidative stress in the airways, as oxidative stress is involved in the pathogenesis of asthma and chronic obstructive pulmonary disease (COPD). The level of H2O2 in exhaled breath condensate reflects the health status of COPD patients [8]. Hence, H2O2 has a wide range of applications in various fields, including the chemical, biological, and medical industries, as well as the environmental sector and sustainable energy conversion and storage [9]. Therefore, several reasons highlight the importance of continuing to advance the development of new rapid and reliable methods for the detection of H2O2.
Currently, methods for the detection of H2O2 based on spectrophotometry [10], chemiluminescence [11], chromatography [12], and electrochemistry [13] are available. Electrochemical sensors based on modified electrodes have demonstrated some advantages for the determination of H2O2 due to their simplicity, low cost, and high sensitivity and selectivity [13]. The chemical modification of surfaces using inorganic films is an interesting approach to developing electrochemical sensors [14,15]. The modification of electrodes with Prussian blue is a model that has aroused much interest. The formation of films of hexacyanoferrates with transition metals and their analogues has also aroused interest because the developed sensors have demonstrated applicability for a wide variety of analytes, including NADH [16], glucose [17], ascorbic acid [18], drugs [14,15], thiosulfate [19], dopamine [20], and hydrogen peroxide [21]. Hexacyanoferrates are a great answer to the need for the development of chemical sensors for non-electroactive ions. In particular, sensors for thallium [22], cesium [23], and potassium [24], as well as cationic analytes such as ammonium [25] and even other mono- and divalent cations, have been described.
Related transition metal hexacyanoferrates (MeHCFs) are an emerging class of inorganic compounds as they have been widely studied due to their interesting properties, including corrosion protection, molecular magnetism, electrochromism, supercapacitance, ion sensing and ion exchange, and great electrocatalytic activity [26]. The metal (M) used is a transition metal with an almost cubic three-dimensional structure—such as Fe (III), Co (II), or Ni (II)—similar to that of zeolite and presents repeating units, –NC–Fe–CN–M–NC, in which the carbon atom of the cyano residue coordinates with an iron ion and a nitrogen atom coordinates with an M ion to form the edge of the cube [27].
The nickel complexes have the advantage of exhibiting interesting catalytic properties [28,29]. Hence, different nickel complexes have been used for electrode surface modification. In particular, nickel hexacyanoferrate films have previously been used as hydrogen peroxide electrocatalysts, showing their applicability as H2O2 electrochemical sensors [30,31]. They have also been used for the determination of other analytes of interest, such as cesium [32], metronidazole [33], and ammonium [34]. This is the basis of our research, but as far as we know, no work can be found in the literature concerning the inclusion of NiHCF as carbon nanodots in a nanomaterial.
Carbon nanodots (CNDs) are a new type of carbon-based nanomaterial. They have a nanometric diameter and low dimensionality, are soluble in aqueous media, and have low toxicity. In general, CNDs consist of a compact core made up of condensed aromatic rings of sp2 carbon and a shell in which there are sp3 carbons modified with a wide variety of functional groups that give these nanostructures their different chemical characteristics. They can be synthesized using several top-down and bottom-up methodologies, such as electrochemical etching [35], pyrolysis [36], and hydrothermal synthesis [37]. The bottom-up approach has shown that choosing the right starting precursors is essential to obtain CNDs with great structural variety. Moreover, heteroatoms can be introduced during synthesis through the use of compounds rich in, for example, nitrogen [38,39,40], yielding nanostructures with improved properties. Recently, CNDs doped with phenothiazines [41] or metals [42] and heteroatoms [43] have been described and applied for different purposes. In this way, the band gap is modulated so that these CNDs can be applied in electrocatalysis [44], semiconductor devices [45], the design of supercapacitors [46], and biosensing with optics and electrochemical detection [40].
The signal-to-noise ratio can be improved by using microelectrode arrays instead of conventional ones [47,48]. Hence, different microelectrode arrays with quite similar analytical characteristics have been elaborated. Although the most common procedure for producing microelectrode arrays involves photolithography and/or electron beam techniques, nanoelectrode arrays have also been formed by nanostructuring the electrode surface without isolating the exposed area. In particular, electrode nanostructuration has been achieved via the electrodeposition of Prussian blue through templates, as well as stopping its conventional growth at the early stage [49], and using nanomaterials directly as precursors, such as nickel nanoparticles mixed with reduced graphene [50]. Based on these previous results and because the nanostructured electrocatalysts function as sets of nanoelectrodes, in the present work, we synthesized CNDs doped with Ni (Ni-CNDs) with a triple function: nanostructure the surface, provide elements necessary for the electrosynthesis of the hexacyanoferrate complex (Ni-HCF), and improve the electrocatalytic response. We developed a new H2O2 electrochemical sensor based on modified electrodes via the formation of the nickel hexacyanoferrate complex on nanocarbon structures in order to improve its electrocatalytic properties of H2O2 oxidation and reduction.

2. Materials and Methods

2.1. Chemicals

L-Arginine (C6H14N4O2) (reagent grade, ≥98%) and 3,3′-Diamino-N-methyldipropylamine (C7H19N3) (reagent grade, ≥96%), potassium hexacyanoferrate (III) (K3Fe(CN)6) (ACS reagent, ≥99.0%), chitosan (C12H24N2O9) (low molecular weight, 50,000–190,000 Da), potassium hydrogen phosphate (K2HPO4) (anhydrous 99.99%), potassium dihydrogen phosphate (KH2PO4) (anhydrous 99.99%), and hydrogen peroxide (H2O2) (50 wt. % in H2O, stabilized) were obtained from SIGMA-ALDRICH (St. Louis, MA, USA), and nickel acetate (II) tetrahydrate (Ni(CH3CO2)2·4H2O) was obtained from FLUKA (Seelze, Germany) (reagent grade, ≥99%). Dialysis membranes in the range of 0.1 to 0.5 kDa were purchased from Spectrum Laboratories (Piraeus, Greece).
All solutions were prepared using deionized water from a Millipore Milli-Q purification system (Darmstadt, Germany).

2.2. Instrumentation

Ni-CNDs were synthesized with CEM Discover microwave (Matthews, NC, USA).
Fourier transform infrared (FTIR) spectra were obtained by preparing KBr pressed pellets of the solid material and precursors. The spectra were obtained with a Brucker (Billerica, MA, USA) IFS60v spectrometer in the range of 5000–500 cm−1.
A JEOL (Akishima, Tokyo, Japan) JEM 2100 FX TEM system was used with an accelerating voltage of 200 kV and XEDS (OXFORD INCA (High Wycombe, UK)) during transmission electron microscopy (TEM) analysis. Samples were prepared by drop-casting the dispersion over carbon TEM grill (CF1.2/1.3–4 C-50).
For atomic force microscopy (AFM) analysis, we employed an Olympus (Tokyo, Japan) OMCLRC800PSA cantilever (69 kHz and 71 kHz of resonance frequency) operating in air tapping mode. Screen-printed carbon electrodes have a very rough surface, so to obtain a flat carbon surface suitable for AFM, we used a flat electrode, highly ordered pyrolytic graphite (HOPG). HOPG plates (10 mm × 10 mm × 2 mm) were purchased from Goodfellow (Huntingdon, UK).
Electrochemical measurements were performed with a Metrohm Autolab VIONIC potentiostat using Intello software 1.6 with screen-printed carbon electrodes (SPCEs) from Metrohm-DropSens (Herisau, Switzerland) that include a carbon ink counter electrode and a silver pseudoreference electrode.

2.3. Procedures

2.3.1. Synthesis of Ni-CNDs

The Ni-CNDs were synthesized in a microwave system, keeping a constant temperature of 235 °C and a maximum pressure of 20 bars for 3 min. The precursors used were 87.0 mg of L-Arginine, 62.2 mg of nickel (II) acetate tetrahydrate, 80.6 μL of 3,3′-Diamino-N-methyldipropylamine, and 100 μL of Milli-Q water as solvent. Then, the obtained brown solid was dissolved in 10 mL of Milli-Q water and filtered using a 0.1 μm porous filter. The solution obtained was dialyzed with a 0.1–0.5 kDa dialysis membrane for 1 week. The resulting Ni-CND solution was conserved in the fridge at 4 °C.

2.3.2. Modification of SPCE with Ni-CNDs

No previous treatment was used to activate the surface of SPCEs. Disposable SPCEs were modified by drop-casting 10 μL of the synthesized Ni-CNDs, and, in turn, 10 μL of chitosan was deposited. This polymer enhances the fixation of the Ni-CNDs on the electrode and prevents them from being transferred to the solution. Finally, the electrode was allowed to dry completely in an oven at a temperature of 40 °C for 5 min.

2.3.3. On Surface Electrochemical Synthesis of Ni-HCF-CND

The nickel hexacyanoferrate (Ni-HCF) complex was generated electrochemically on the Ni-CNDs deposited on the electrode surface together with chitosan. The modified electrodes were immersed in the potassium hexacyanoferrate (III) solution, and the potential was scanned between −0.3 and 1.2 V at 100 mV/s. The new Ni-HCF nanodot generated is called Ni-HCF-CND.

2.3.4. Calibration Curves and Real Samples Analysis

Chronoamperometric measurements fixing the potential at −0.35 V and at +0.30 V vs. Ag pseudo reference electrode were obtained for cathodic and anodic calibration curves, respectively. For calibration, H2O2 standards at different concentrations were prepared in 0.1 M phosphate buffer (PB) pH 7.0. Real samples of tap water were fortified with a concentration of 100 µM of H2O2. To analyze them, 900 µL of the fortified tap water was mixed with 100 µL of 1 M PB at pH 7.0.

3. Results and Discussion

3.1. Development of the Sensing Platform (Ni-HCF-CND/SPCE)

Nickel-doped carbon nanodots (Ni-CNDs) were synthesized following a similar method to that previously described by M. Prato et al. [51], so we considered that a similar mechanism for carbon nanodot generation follows in our nanomaterial synthesis. Ni-CNDs have been used to modify the electrode surface of screen-printed carbon electrodes (SPCE). We previously optimized the assisted microwave process for their synthesis, and we exhaustively controlled all the parameters using L-arginine and 3,3′-Diamino-N-methyldipropylamine during the carbon nanodot synthesis, with the possibility of using other compounds as dopants [37,41,52,53,54]. Furthermore, the nickel present in CND is used to form the transition metal hexacyanoferrate-type complex in the presence of potassium (III) hexacyanoferrate. In this way, the complex nickel (II) hexacyanoferrate is formed on the CNDs surface, providing a nanostructured electrode that behaves as a random nanoelectrode array with excellent electrocatalytic properties for H2O2 oxidation. The developed sensor allows for the detection of low concentrations of H2O2.

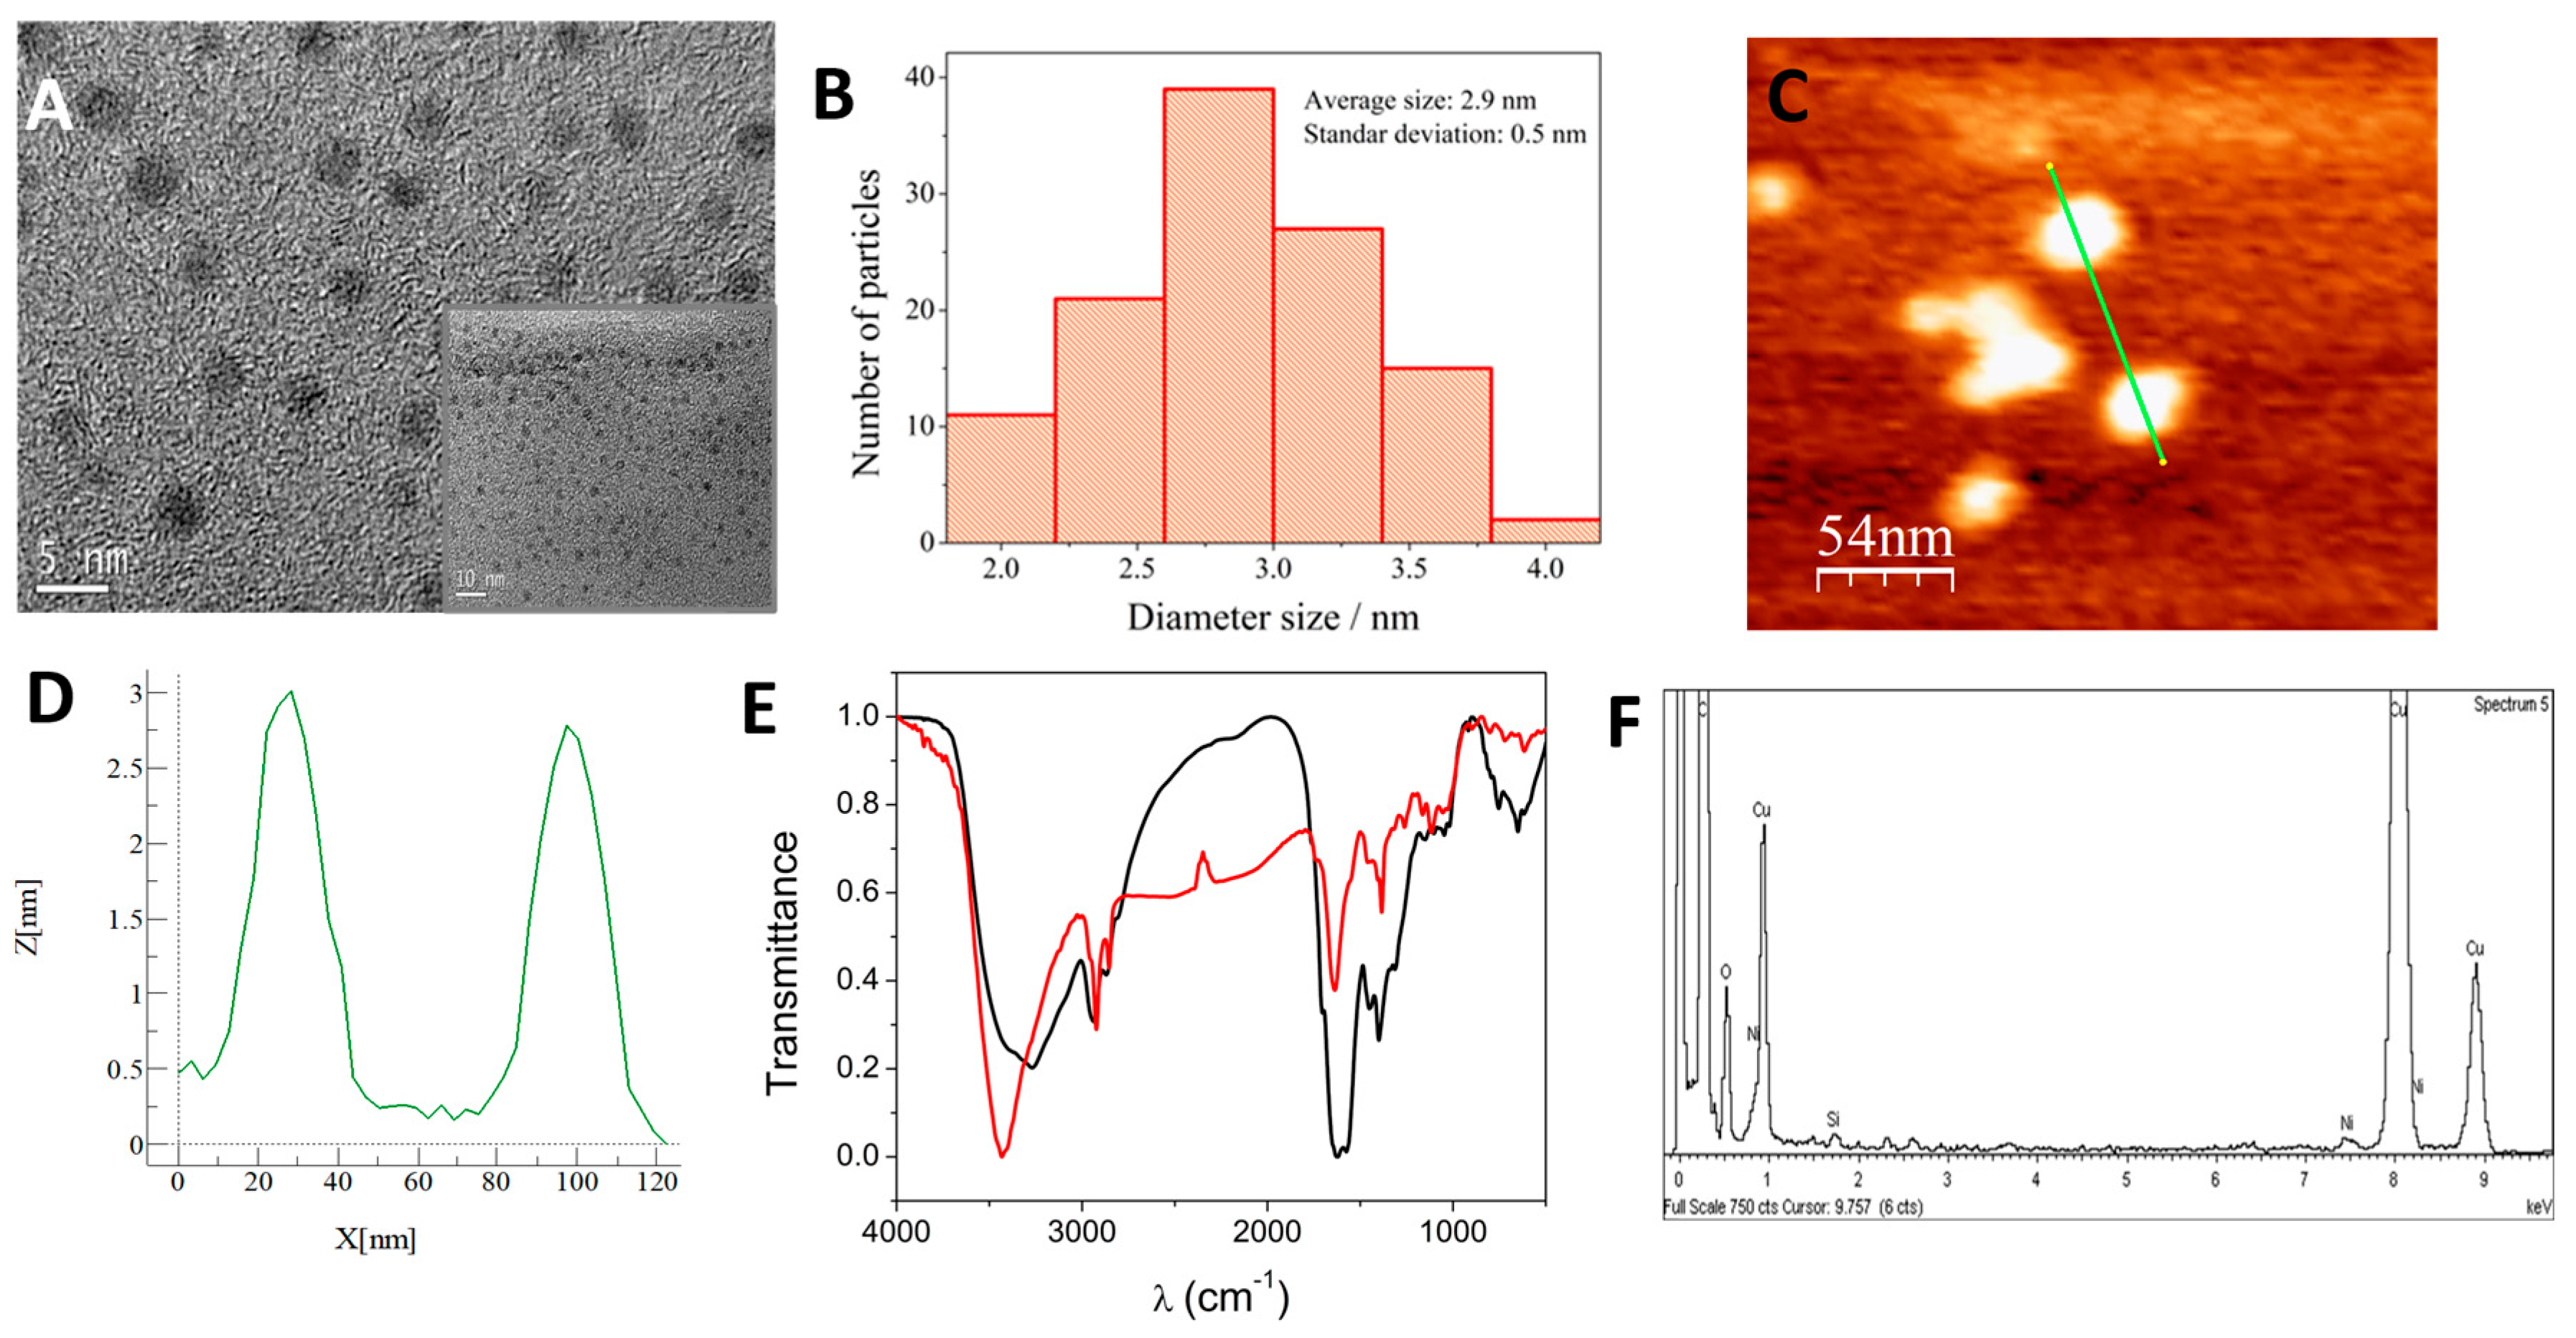
3.1.1. Characterization of Ni-CNDs

The synthesized Ni-CNDs were characterized by transmission electron microscopy (TEM), atomic force microscopy (AFM), energy-dispersive X-ray spectroscopy (EDX), and infrared spectroscopy (FTIR).
In Figure 1A, a TEM image of the prepared nanomaterial can be observed. The nanodots are homogeneously distributed without forming aggregates and present a quasi-circular morphology with a diameter of approximately 3 nm. An exhaustive analysis of the Ni-CND size distribution (Figure 1B) was carried out, measuring 120 nanoparticles observed in TEM micrographs, with an average diameter of 2.9 ± 0.5 nm.
AFM was used to characterize Ni-CNDs (Figure 1C). The heights of the Ni-CNDs were approximately 3 nm (Figure 1D), which is consistent with the size obtained by TEM. It can be confirmed that the Ni-CNDs were synthesized correctly.
Fourier transform infrared (FTIR) analysis was performed to elucidate the functional groups on the Ni-CND surface. The FTIR spectrum of the Ni-CNDs can be observed in Figure 1E, and it was compared with the spectrum of the CND synthesized in the absence of nickel, which was used as a control. Although the FTIR spectra are quite similar to each other, there are some significant differences. In the spectrum associated with the Ni-CNDs, a displacement of the band around 3431 cm−1 into a band with a maximum at 3252 cm−1 was observed. This is a consequence of the metal centers’ inclusion in the carbon nanostructure because of the generation of NiOOH [55]. In both cases, these bands are attributed to stretching vibrations of OH and NH bonds, which suggests the presence of hydroxyl and amino groups on both the Ni-CND and CND surfaces. At 1650 cm−1, it is possible to appreciate a strong band related to C=N stretching. Other less intense absorption bands can also be seen at 1150 cm−1 and 1283 cm−1, which are assigned to the folding and stretching vibrations corresponding to the C-O bonds present in carboxyl groups [56]. The band at 1399 cm−1 is more intense in the case of Ni-CNDs, and it is associated with CO-OH, which is ascribed to the presence of more acetate groups [55] (nickel acetate is employed as a metal precursor in Ni-CND synthesis). The broad band centered at 642 cm−1 could be ascribed to Ni-O stretching [57]. These results are consistent with the incorporation of acetate ions, since they are present in the Ni-CND synthesis medium, and nickel into the carbon dot nanostructure.
Finally, Figure 1F shows the analysis of the Ni-CNDs using EDX. It demonstrates that the nanodots have nickel atoms in their structure since the energies were observed to be associated with them. Because the nanodots were deposited on copper grids, the energies of copper in the same region can also be observed.

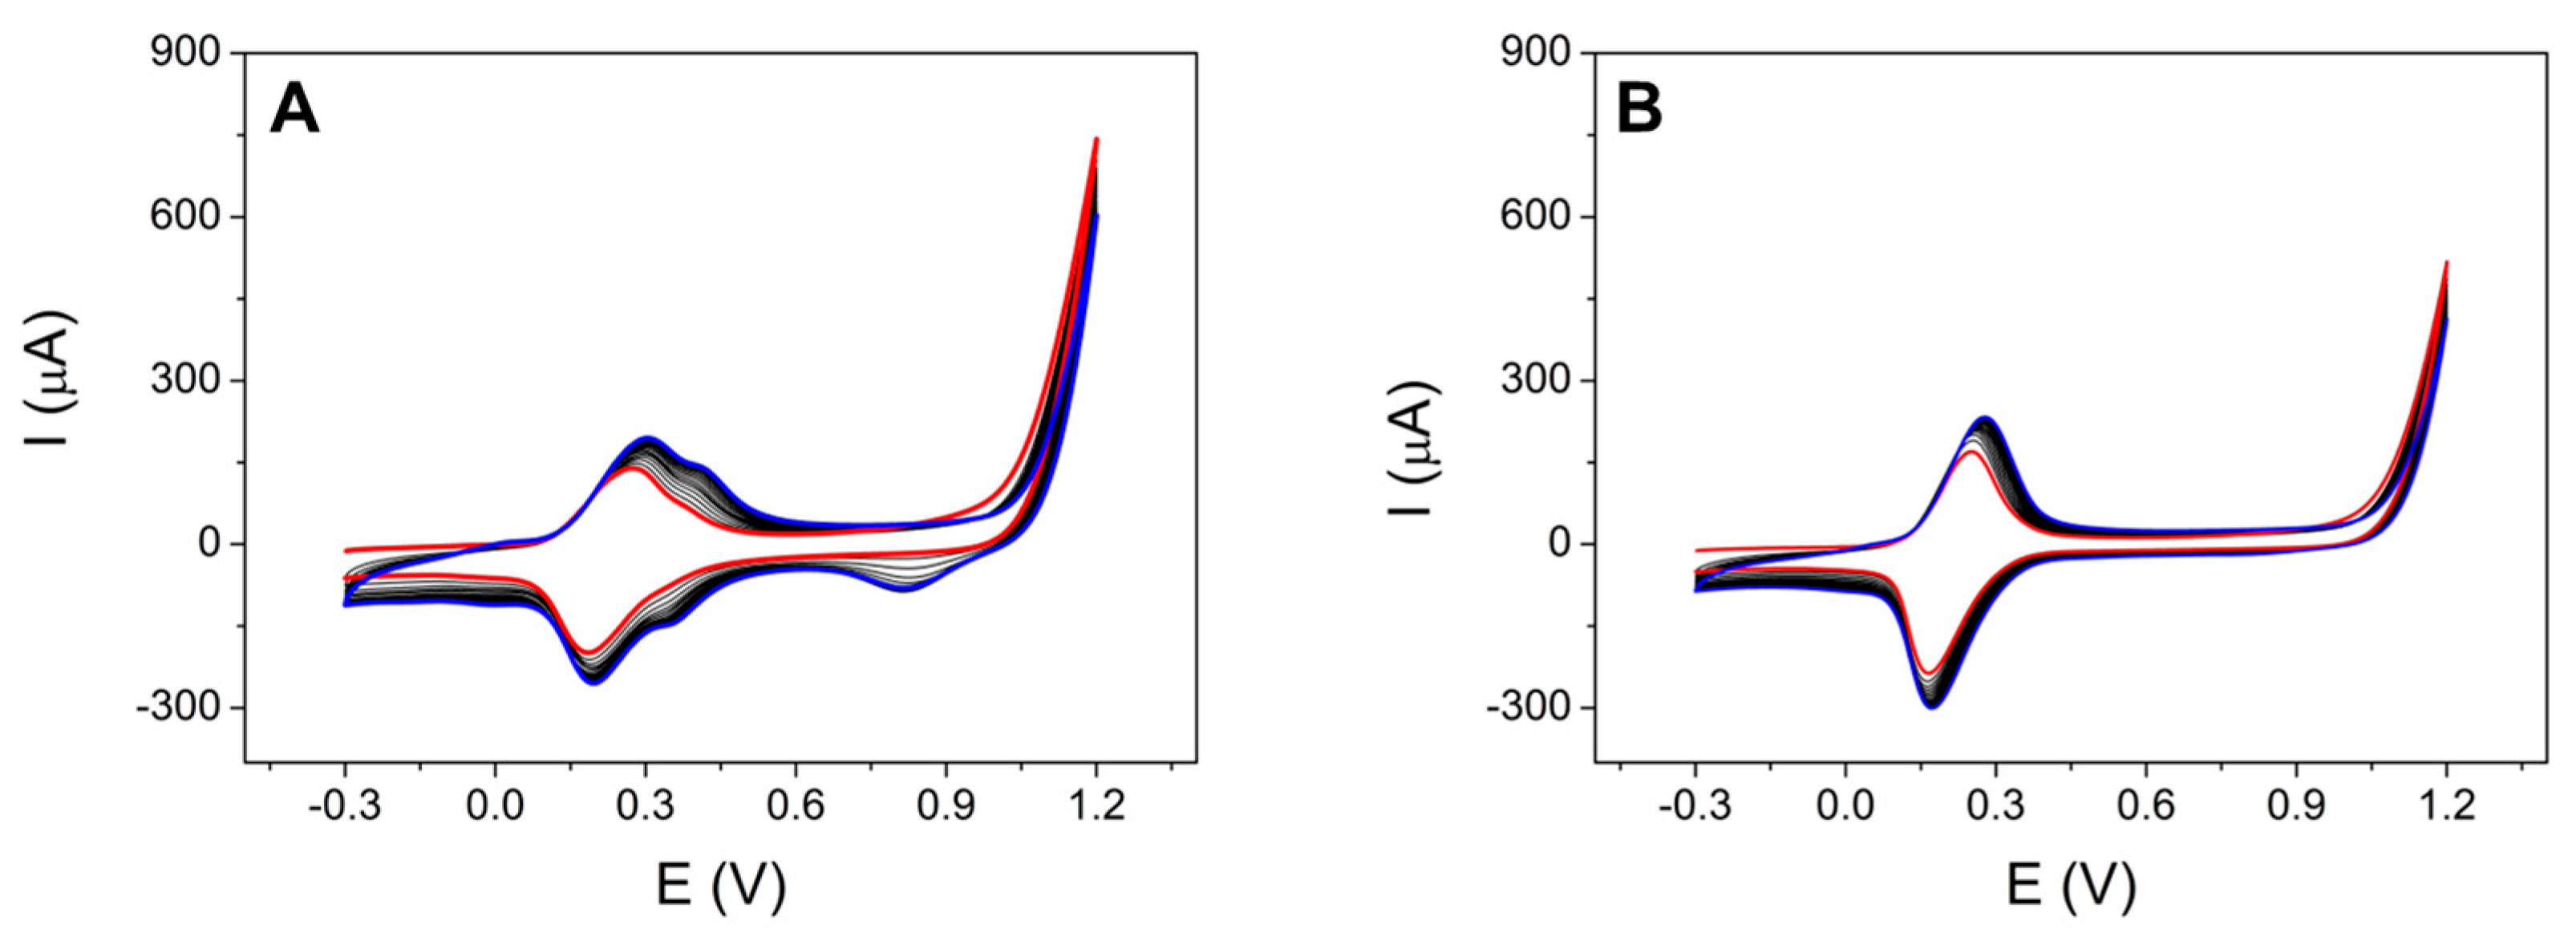
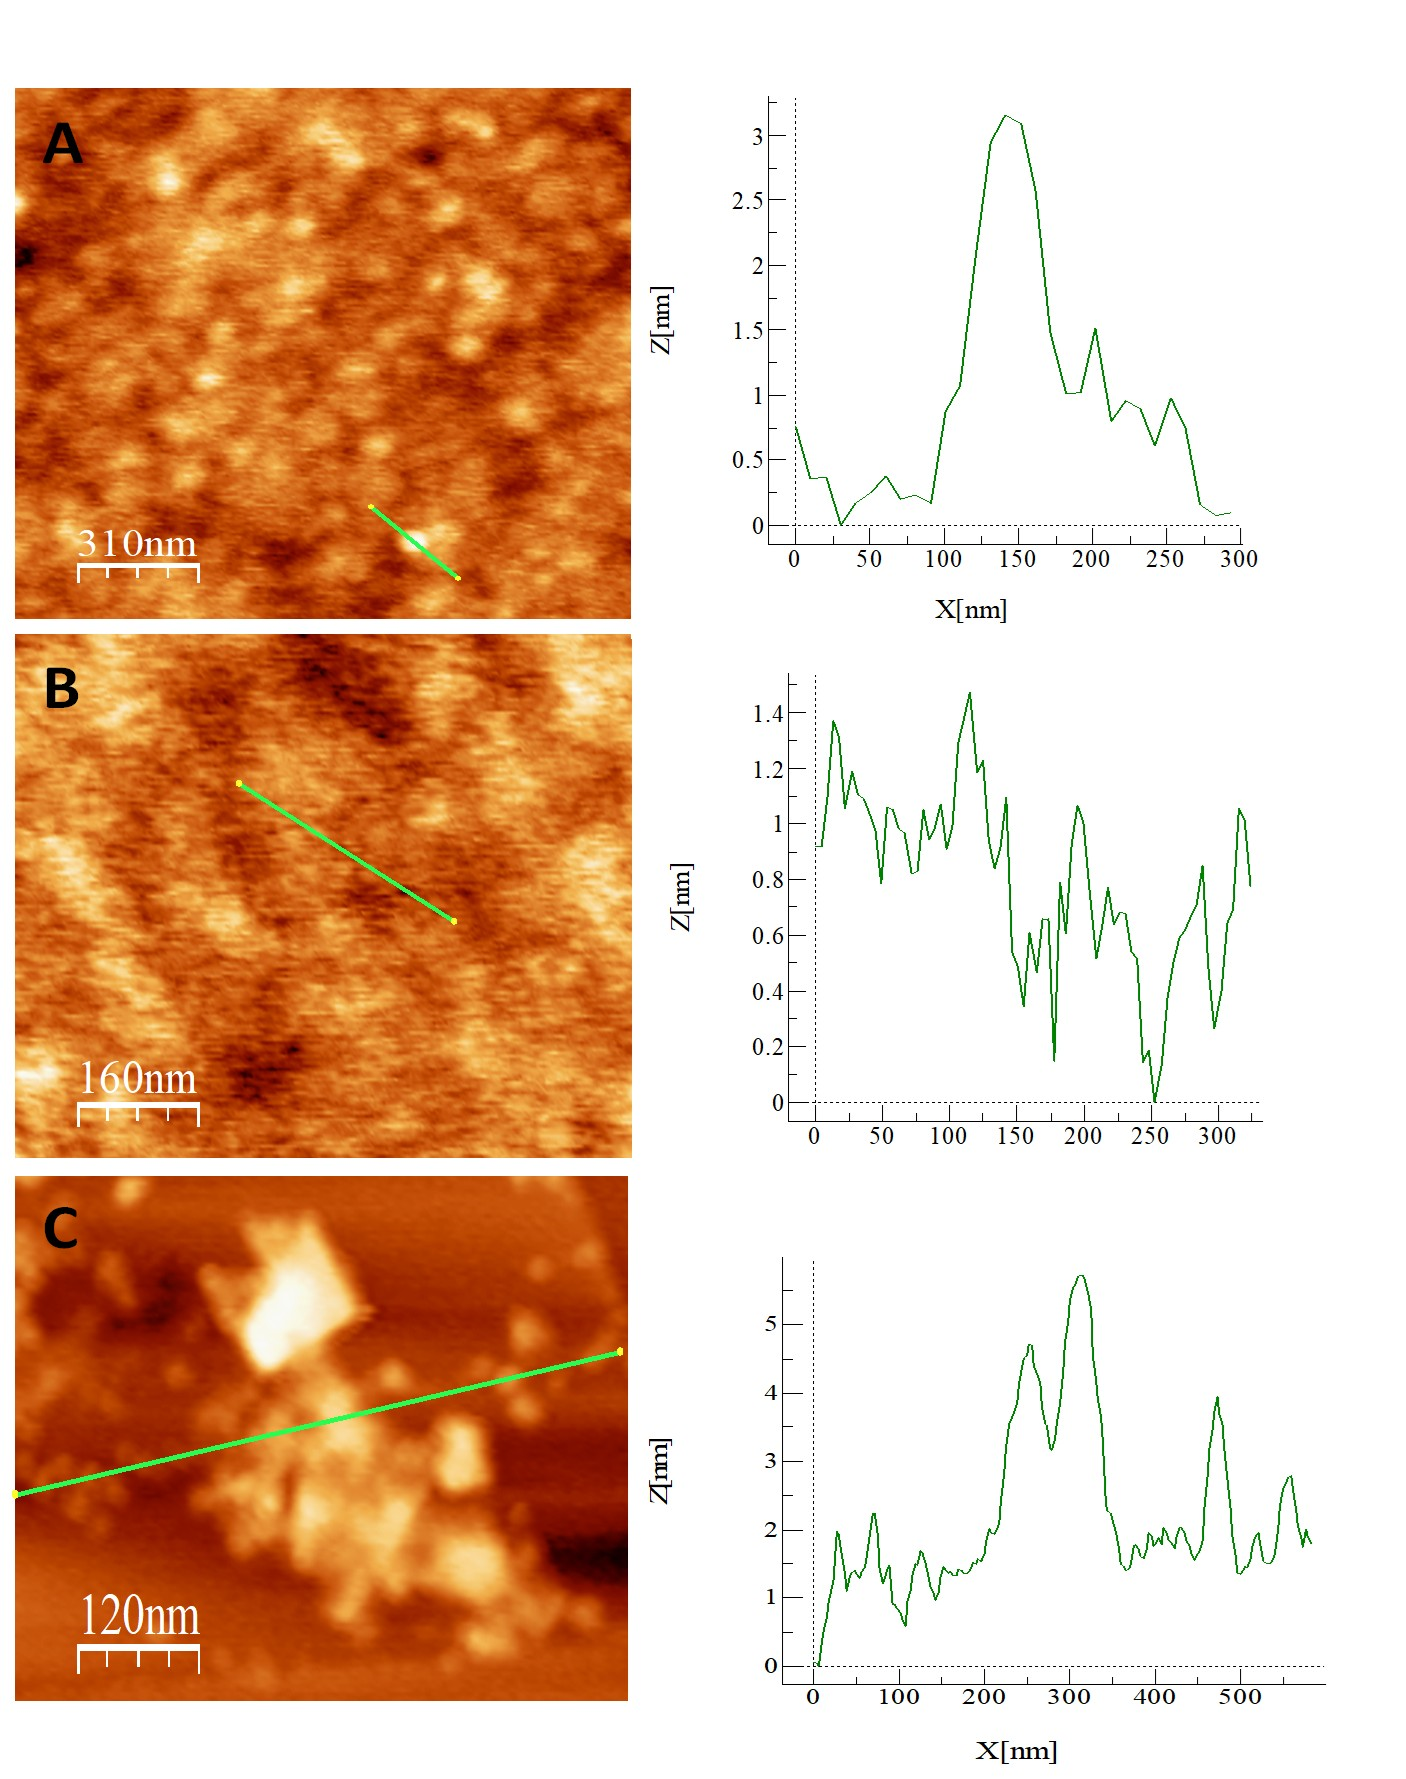
3.1.2. Electrochemical Synthesis of Ni-HCF-CND/SPCE

The SPCE was modified with the Ni-CNDs synthesized, as previously described in Section 2.3.2, Procedures. Subsequently, the nickel hexacyanoferrate (Ni-HCF) complex was electrogenerated on their surface (Section 2.3.3.) on the nickel-containing carbon nanodots, which are presumably located on the Ni-CND surface (Figure 2A). It is observed in the continuous cycling process that the maximum current increases with the number of scans, suggesting the growth of Ni-HCF over multiple cyclic voltammetry (CV) scans. Under these conditions, a complex called Ni-HCF-CND is formed via electro-synthesis through the oxidation of the metal Ni (II) to Ni (III) and a coordination reaction between Ni (II) and HCF ions. As can be observed in Figure 2B, a control was used in the absence of Ni-CNDs. The unmodified electrode only presents the characteristic redox process ascribed to the oxidation–reduction of ferrocyanide (E0 = +0.25 V vs. Ag). However, the Ni-CND modified electrode in addition to the ferrocyanide process shows a new reversible redox process at +0.40 V vs. Ag associated with iron (II/III) center of Ni-HCF, and at more positive potential, +0.80 V vs. the Ag pseudoreference, mainly in the reduction scans, which can be associated with the nickel (II/III) center of Ni-HCF, which is due the formation of the complex. Characteristic redox pairs of nickel hexacyanoferrates were obtained in cyclic voltammograms like those obtained by other authors [58,59,60]. Both signals increase their current intensity by increasing the number of cycles applied, which suggests the successful growth of the Ni-HCF polymer during multiple CV scans.
These results were compared with those reported in the literature [61,62,63]. It is observed that other authors also obtained both redox processes, which indicates that the complex was successfully generated.
AFM topography analysis was used to follow the different stages of the development of the sensor platform. AFM images of the HOPG surface after dropping the Ni-CND-containing solution showed that the surface is modified by circular structures associated with Ni-CNDs (Figure 1C). Figure 3A shows a topographic view of the surface modified with Ni-CNDs and chitosan. In this case, the Ni-CNDs are difficult to see and distinguish through the polymer network generated by the chitosan. It is observed that the Ni-CNDs are randomly distributed around the surface. This is because after chitosan deposition, the surface is completely covered with the polymer (Figure 3B). In order to analyze the surface after generating the complex formed by Ni-HCF-CND in more detail, we performed the same experiment but in the absence of chitosan. As can be seen in Figure 3C, the surface was modified with the Ni-HCF-CND, and the formation of some Ni-CND aggregates can be seen. These aggregates may be a consequence of the electrochemical treatment for the formation of a nickel hexacyanoferrate complex. The height profile suggests that some Ni-CNDs are isolated, and others are organized in multiple layers.
This result shows that the electrosynthesis of nickel hexacyanoferrate has not been carried out in the form of films, since the areas of the HOPG unmodified with the CNDs are not modified. This reveals that nickel hexacyanoferrate could only be formed on the CND since it was the only source of nickel available. This is the desired result, since the goal was to obtain an electrode modified with discrete nanoparticles.

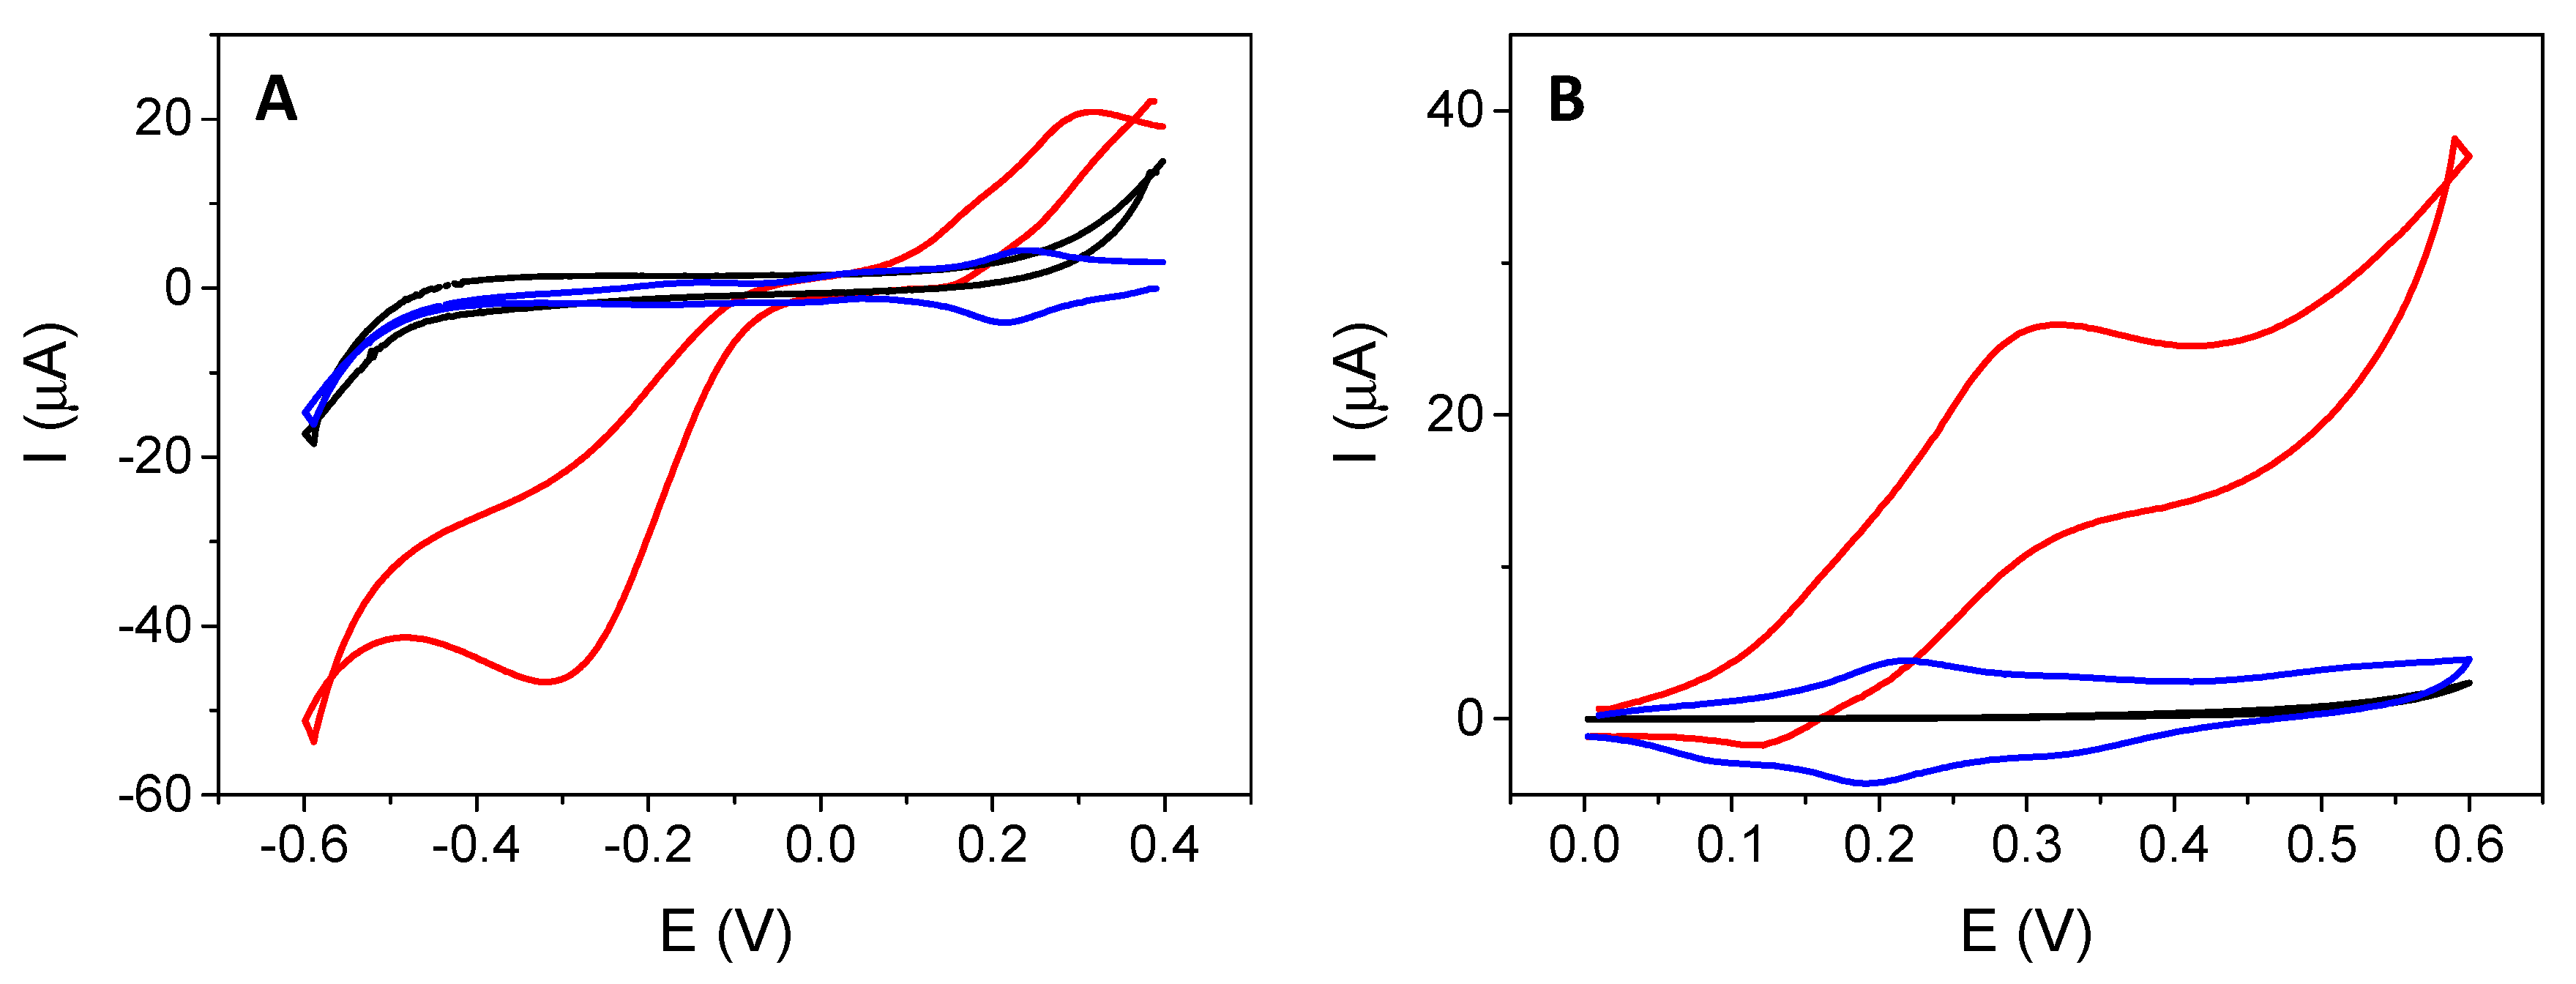
3.2. Electrocatalytic Activity of Ni-HCF-CND/SPCE Toward H2O2 Oxidation

Figure 4 shows the cyclic voltammograms at a SPCE modified with the electrogenerated Ni-HCF complex (blue line) in 0.1 M PB at pH 7.0. Compared to the bare SPCE (black line), a reversible redox process at +0.22 V associated with the iron centers of the HCF that switches between the Fe (II) and Fe (III) states depending on the applied potential was observed. A less defined process was observed at −0.02 V that has not been reported previously for the Ni or Fe center of Ni-HCF. In the presence of 1.0 mM H2O2 (red line), it shows a clear electrocatalytic effect, which produces an increase in the current intensity both in the direction of reduction (Figure 4A) and oxidation (Figure 4B). These catalytic currents are due to the reduction and oxidation of H2O2, respectively, catalyzed by the Ni-HCF-CND complex generated at the electrode surface. The hydrogen peroxide electrocatalytic reduction occurs a few mVs after the reduction process observed at −0.02 V, as can be observed in the magnification of Figure 4A (Figure S1). This electrocatalytic activity for H2O2 electroreduction has not been reported previously for Ni-HCF materials. It is worth shedding light on this process, unless a possible explanation is the synergic properties of carbon nanodots and the small pieces of Ni-HCF generated over the CND surface, giving rise to new electrocatalytic phenomena. It is important to highlight that several metal ions, including Ni (II) and Fe (II), are known to be catalysts for the decomposition of H2O2, according to the so-called Fenton reaction. Furthermore, the electrode containing the nickel hexacyanoferrate complex showed higher electrocatalytic activity in the oxidation and reduction of H₂O2 due to the combination of metals and the surface nanostructuration compared to the unmodified electrode. At the unmodified electrode, in the presence of H2O2 (black line), neither the redox processes attributed to nickel hexacyanoferrate nor any electrocatalytic current was observed in the range of reduction or oxidation potentials.

Optimization of Experimental Variables of the Electrocatalytic Process

Once the electrocatalytic activity of the developed platform Ni-HCF-CND/SPCE was proved, the main variables involved in the process—the volume of Ni-CNDs and chitosan added to the electrode and the number of cycles for the formation of the complex nickel hexacyanoferrate (HCF)—were optimized.
Firstly, the volume of Ni-CNDs deposited on the electrode was optimized. Hence, the SPCE was modified with different volumes of Ni-CNDs: 2.5 μL, 5.0 μL, 10.0 μL, and 20.0 μL. Next, the electrochemical response for each electrode was studied between 0.4 V and −0.6 V and between 0.6 V and 0.0 V at 10 mV/s, which shows the results obtained from the optimization based on the volume of Ni-CNDs (Figure S2). We chose 10 μL of Ni-CNDs as the best option to modify SPCE. A compromise between the best results for the H2O2-reduction process (20 μL of Ni-CNDs) and the best result for the H2O2-oxidation process (10 μL of Ni-CNDs) is required, so we decided to continue working with 10 μL of Ni-CNDs for better operativity reasons during electrode modification.
Next, the total number of optimal cycles for the formation of the complex Ni-HCF was established. The SPCE was modified with 10.0 μL of Ni-CDs under the same previous conditions, with only one difference in the number of scans for the formation of the Ni-HCF complex: 15, 30, 60, 120, and 240 scans were applied. Subsequently, the electrode response in the presence of 1 mM H2O2 was recorded (Figure S3). Given these results, it can be stated that the optimal number of cycles for the formation of the Ni-HCF complex is 120 scans. The number of cycles required for complex formation can vary due to the fact that the electrochemical process mainly occurs within the CNDs, where the supply of [Fe(CN)6]3- ions could be limited. A similar situation occurs with the small channels when a porous alumina template is used for the electrochemical synthesis of hexacyanoferrate nanoarray [61].
Finally, the volume of chitosan deposited on the electrode surface was optimized. The following volumes of chitosan were used: 0.0 μL, 5.0 μL, 10.0 μL, and 30.0 μL. The electrochemical response of the electrode was studied under the conditions previously optimized for the formation of Ni-HCF and varying the volume of chitosan. The volume of chitosan selected as optimal was 5.0 μL since it offers the greats value of current intensity (Figure S4).
The selected conditions were 10.0 μL of Ni-CNDs, 120 cycles for the formation of the Ni-HCF complex, and 5.0 μL of chitosan. Figure 4 shows the electrocatalytic oxidation and reduction of 1 mM H2O2 in 0.1 M PB at pH 7.0 under the optimized conditions compared with the unmodified electrode.

3.3. Electrochemical Characterization of SPCE/Ni-HCF-CND

Once the studied variables were optimized, a study of scanning rates was carried out to analyze the electrochemical behaviour of the modified electrode, Ni-HCF-CND/SPCE, in depth.
The cyclic voltammograms show three redox couples, two of them partially overlapped at formal potentials of +0.40 and +0.22 V vs. Ag (Figure S5), and the third one at −0.02 vs. Ag. All of them increase in current when increasing the scan rate. To characterize the electrochemical process, the current intensities of the redox peaks with the formal potential +0.40 V vs. Ag (a cathodic peak at 0.41 V and an anodic peak 0.39 V vs. Ag) were plotted against the scan rate (Figure S6A) and against the square root of the scan rate (Figure S6B). The objective is to determine if the electrochemical processes observed are surface-confined or diffusional. As can be seen, the correlation between intensity and the scan rate is linear, which implies that it is a redox process in which the species responsible for it are deposited on the surface of the electrode, and it is an electron transfer process confined on the surface. This was an expected result since the Ni-CND is immobilized on the electrode surface through the chitosan polymer, avoiding the loss of the nanomaterial. This behaviour is consistent with another report, where other CND were fixed to the surface with chitosan [41].
Once it was proven that the redox process is not diffusional, the constant and the coefficient of heterogeneous charge transfer (ks and α) were calculated using the Laviron method. This establishes that, when the anodic and cathodic peak potential difference exceeds the value corresponding to 200/n mV, it is possible to calculate the charge transfer coefficient (α) using Equations (1) and (2), as well as the heterogeneous charge transfer constant (ks) using Equation (3).
E pa = E 0 + 2 · 3 RT 1 α nF · log ν
E pc = E 0 2 · 3 RT α nF · log ν
log k s = α log 1 α + 1 α log α log RT nF ν nF Δ E p α 1 α 2 · 3 RT  
The charge transfer coefficient (α) can also be calculated graphically by representing the anodic and cathodic peak potentials versus the logarithm of the scan rate, obtaining two asymptotic curves. In this way, the coefficient α is obtained from the slopes of the lines, and the value of the heterogeneous charge transfer constant is obtained by determining the corresponding value of log νc and log νa through the intersection point of the lines obtained with the formal potential value using Equation (3).
Figure S7 represents the anodic and cathodic peak potential against the logarithm of the sweep rate. As can be seen at a scan rate greater than 200 mV/s, a linear trend is clearly shown, obtaining the values of α = 0.7 and ks = 55.8 s−1. With these values, it can be stated that it is a quasi-reversible process since the value of the coefficient α obtained deviates a little from 0.5. It is also observed that both processes are energetically very similar—both oxidation and reduction.

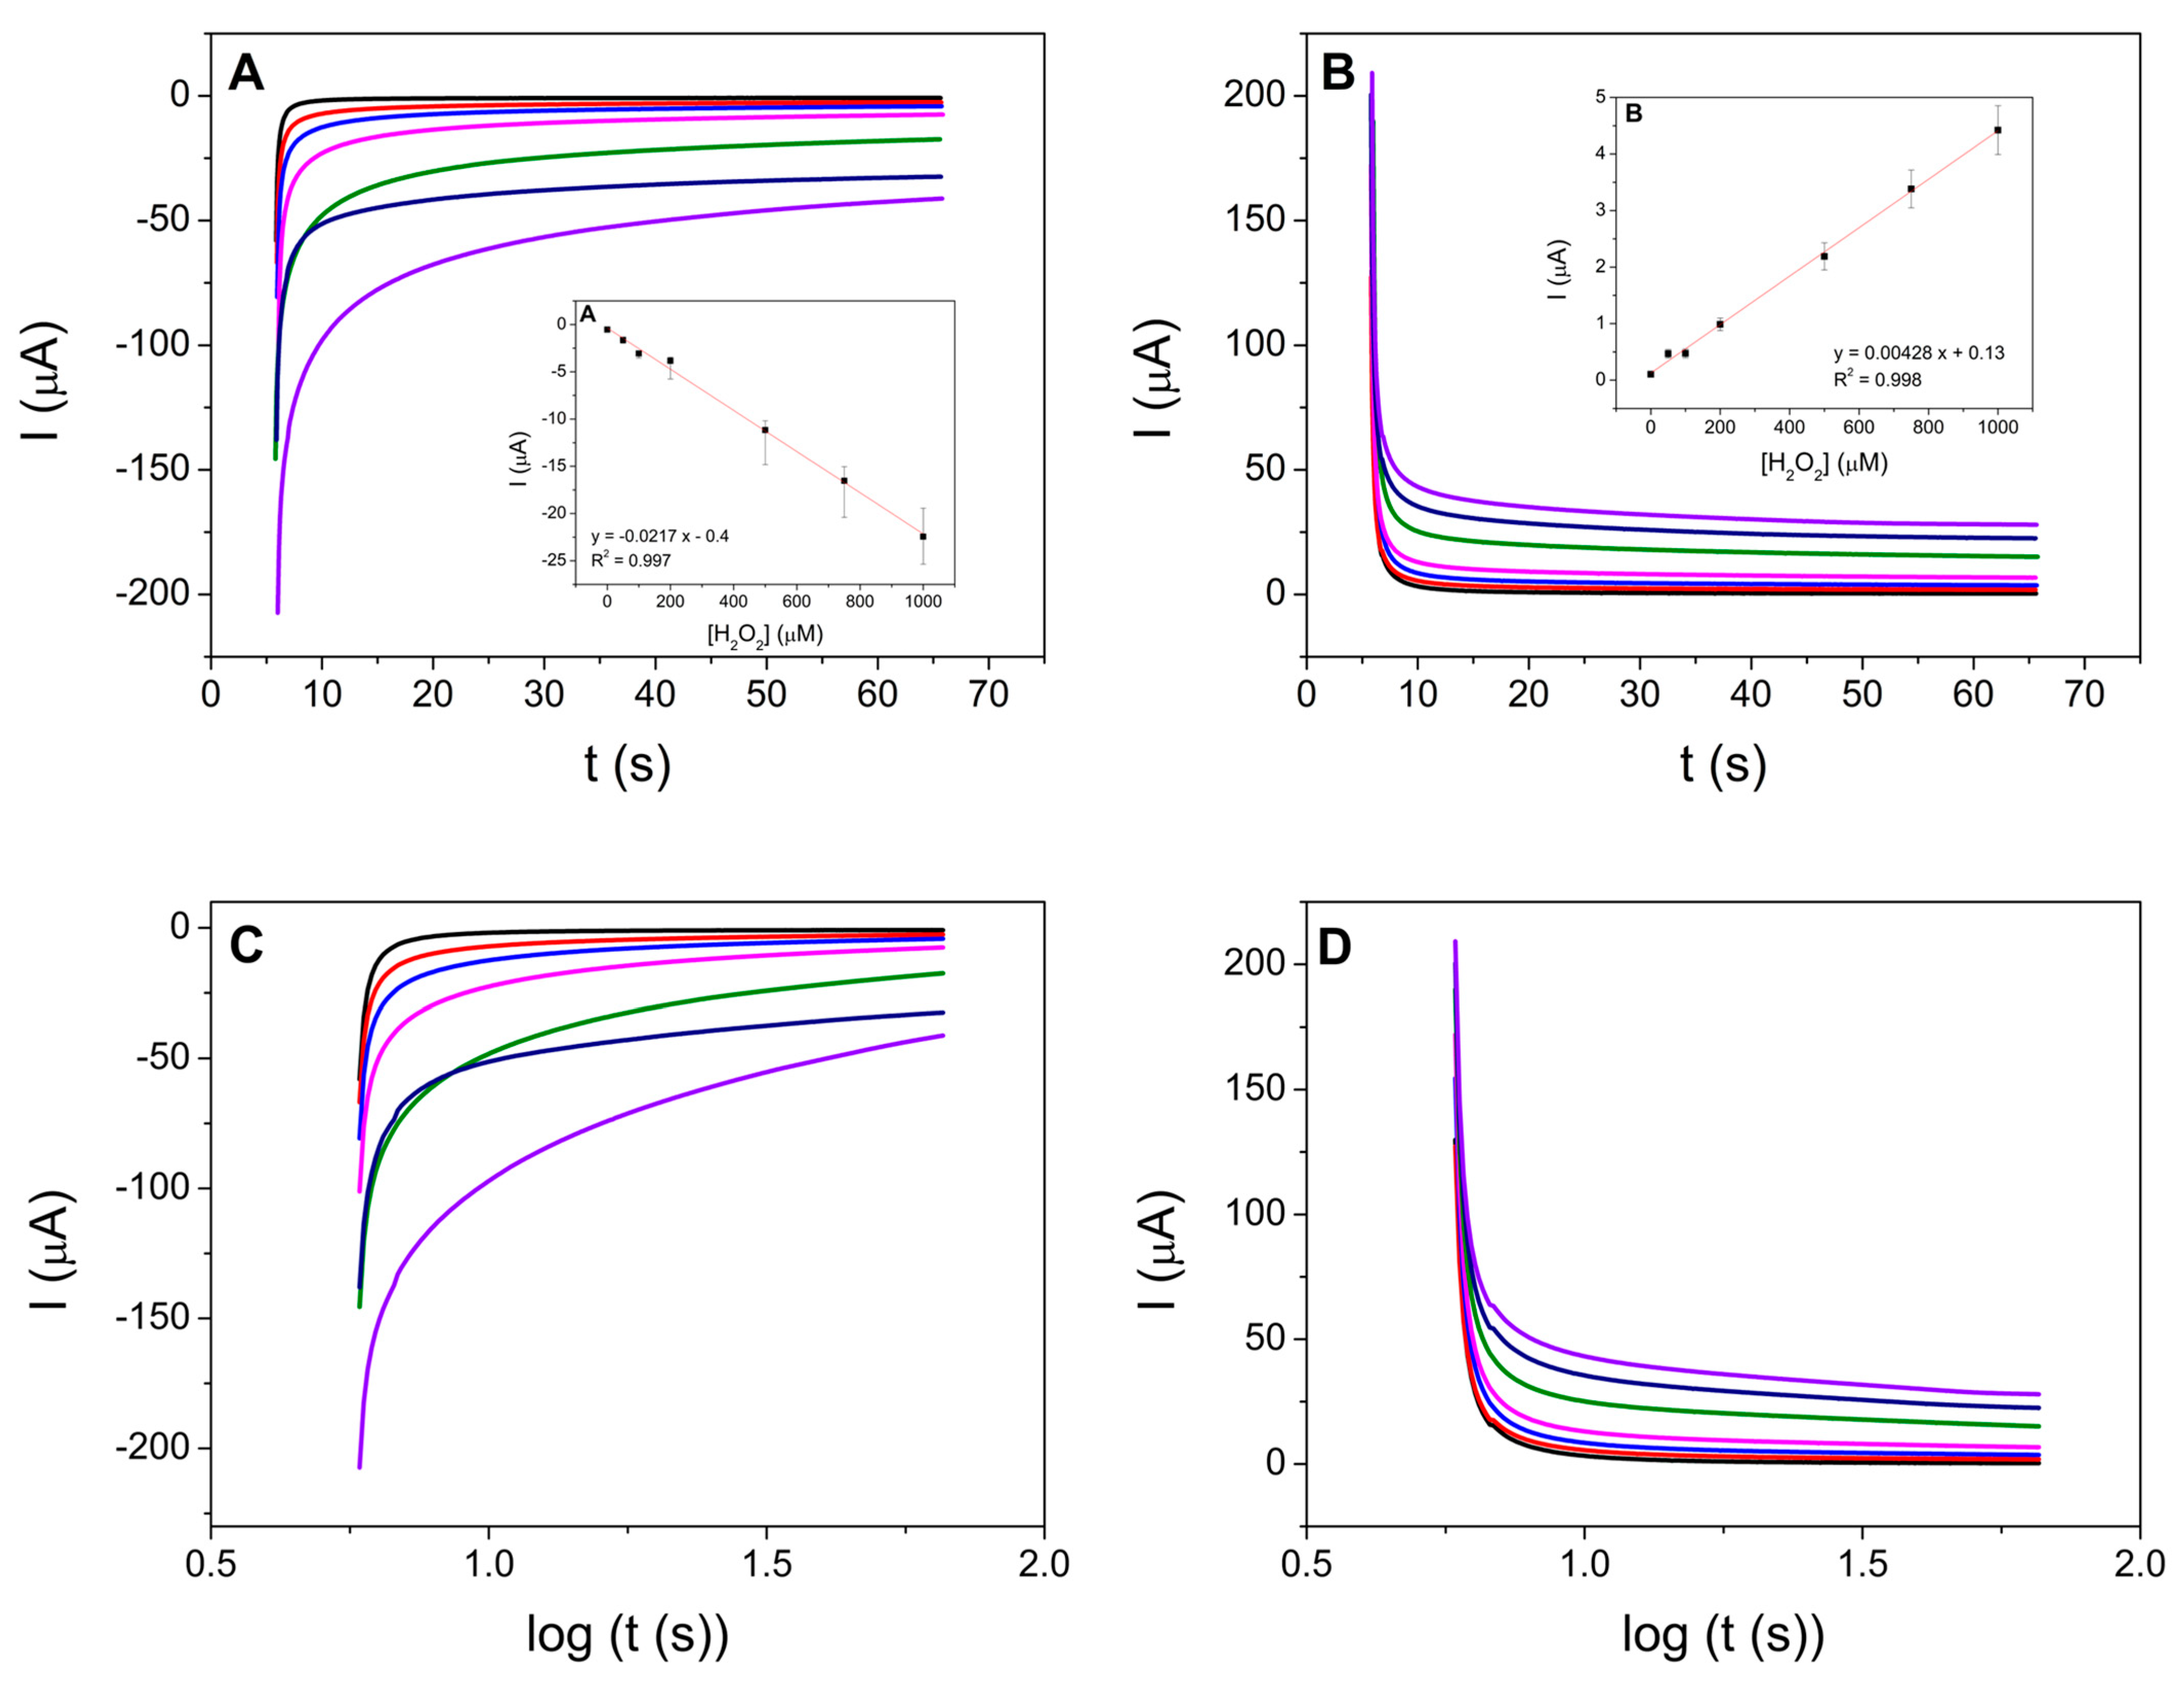
3.4. Analytical Performance of H2O2 Electrochemical Sensor

In order to use these electrodes as electrochemical H2O2 sensors, a study with increasing concentrations of the analyte using chronoamperometry was carried out. Therefore, the corresponding chronoamperograms were recorded, both for reduction and oxidation process, setting potentials of −0.35 and +0.30 V, respectively. These potentials were selected since they are approximately 60 mV once the potential of the Ni-HCF reduction and oxidation processes is exceeded, respectively. Initially, several chronoamperograms were obtained, without adding the analyte, to stabilize the sensor and reach the steady state. After stabilizing, chronoamperometries were obtained at different increasing concentrations of H2O2 (Figure 5).
In the chronoamperograms, it is observed that the steady-state currents obtained 1 min after the potential step show that the intensity of the current increases linearly as the concentration of H2O2 increases in both processes. For both oxidation and reduction, a linear dependence on the concentration of H2O2 (R2 = 0.997 and 0.998, respectively) present in the solution is obtained in the concentration range from 50.0 μM to 1000 μM. Calibration plots and chronoamperometries in the range of 1 μM to 50 μM were also tested, obtaining good results, unless the linear fit of the calibration curve was worse than that obtained for higher concentrations (Figure S8). The analytical parameters of the H2O2 sensor, such as limits of detection (LOD) and quantitation (LOQ), were determined from the linear part of the calibration curve. These parameters and the sensitivity, given by the slope of the linear section of the calibration curve, are summarized in Table 1. The reproducibility was determined by using five different prepared sensors and measuring a 100 µM H2O2 solution (in both oxidation and reduction processes). Repeatability was obtained by measuring the same solution of 100 µM of H2O2 five times. The results are shown in Table 1.
Different sensors were previously developed for the determination of H2O2 using nickel hexacyanoferrate (Table 2). It can be seen that the LOD obtained by these sensors is in the same order of magnitude as the sensor developed in this work, although the values obtained are lower. Regarding linear range and sensitivity, very competitive values were obtained compared with other sensors reported in the literature.
Furthermore, the stability of the SPCE/Ni-HCF-CND was evaluated by applying ten consecutive reduction potentials between 0.4 and −0.6 V and oxidation potentials between 0.0 and 0.6 V in 0.1 M PB, pH 7.0, containing 100 µM of H2O2. The current kept about 95% of the initial value (Figure S9A). The storage stability of the SPCE/Ni-HCF-CND was also evaluated. The sensor was stored at 4 °C for 15 days and kept 93% of the initial response (Figure S9B).
Real samples of fortified tap water were analyzed, obtaining great recovery results (Table 3).

4. Conclusions

Nickel-doped carbon nanodots (Ni-CNDs) were synthesized and characterized using various techniques such as transmission electron microscopy (TEM), atomic force microscopy (AFM), energy-dispersive X-ray spectroscopy (EDX), and infrared spectroscopy (FTIR). The characterization of Ni-CND shows that they are particles with a circular projection, with a diameter of approximately 3 nm, and they are mainly composed of carbon and nitrogen, along with nickel in their structure.
In the Ni-CND, a Ni-HCF complex was formed on the surface of a carbon screen-printed electrode via the electro-polymerization of potassium hexacyanoferrate (III). This process takes place as the oxidation of Ni (II) to Ni (III) occurs, and a coordination reaction occurs between the Ni2+ and HCF ions.
The optimization of the platform was carried out successfully, obtaining the optimal values both for the volumes of Ni-CDs (10.0 μL) and chitosan (5.0 μL) added and for the optimal number of cycles for the formation of the Ni-HCF complex (120 cycles). The studies of scan rates confirm that the Ni-CNDs are immobilized on the electrode surface. The Ni-HCF complex shows an electrocatalytic response to the presence of H2O2, both at reduction and oxidation potentials. The most relevant kinetic parameters were also obtained, such as the charge transfer coefficient (α = 0.7) and the heterogeneous charge transfer constant (ks = 55.8 s−1), thus demonstrating that it is a quasi-reversible process.
This Ni-HCF-CND/SPCE platform can be used as an electrochemical H2O2 sensor, both for reduction processes (LOD = 0.49 μM) and for oxidation processes (LOD = 3.22 μM). This sensor can be the starting point for the development of new electrochemical biosensors in which H2O2 is generated by an enzymatic reaction.

Supplementary Materials

The following supporting information can be downloaded at: https://www.mdpi.com/article/10.3390/chemosensors13060195/s1. Figure S1. Magnification of figure 4A. CVs obtained using Ni HCF-CDs modified SPCE in the absence (blue line) and in the presence of 1.0 mM H2O2 (red line), in 0.1 M PB at pH 7.0 at a scan rate of 10 mV/s. Figure S2. CVs at a Ni-HCF-CND/SPCE in the presence of 1.0 mM H2O2 in 0.1 M PB at pH 7.0. (A) Reduction potentials between 0.4 and −0.6 V. (B) Oxidation potentials between 0.0 and 0.6 V. Unmodified electrode (black line) and modified electrodes with 2.5 μL (red line), 5.0 μL (blue line), 10.0 μL (green line) and 20.0 μL (pink line) Ni-CDs. Scan rate10 mV/s. Figure S3. CVs at a Ni-HCF-CND/SPCE in the presence of 1.0 mM H2O2, in 0.1 M PB at pH 7.0. Electrodes modified with 15 (black line), 30 (red line), 60 (blue line), 120 (pink line) and 240 (green line) scans. (A) Reduction potentials between 0.4 and −0.6 V. (B) Oxidation potentials between 0.0 and 0.6 V. Scan rate 10 mV/s. Figure S4. CVs at a Ni-HCF-CND/SPCE in the presence of 1.0 mM H2O2, in 0.1 M PB pH 7.0 at 10 mV/s. Unmodified electrode (black line), and modified electrodes with 5.0 μL (red line), 10.0 μL (blue line) and 30.0 μL (pink line) of chitosan. (A) Reduction potentials between 0.4 and −0.6 V. (B) Oxidation potentials between 0.0 and 0.6 V. Figure S5. CVs at a SPCE/Ni-HCF-CND from -0.6 V to 0.6 V in 0.1 M PB pH 7.0 at different scan rates: 5 (black line), 10 (red line), 25 (blue line), 50 (pink line), 75 (green line), 100 (dark blue line), 200 (lilac line), 300 (purple line), 400 (brown line) and 500 (dark green line) mV/s. Figure S6. Graphic representation of the anodic (■ black) and cathodic (● red) peak (E0 = +0.40 V vs. Ag) current intensity versus (A) the scan rate and (B) the root of the scan rate. Figure S7. Graphic representation of the anodic (■ black) and cathodic (● red) demand versus the logarithm of the scan rate using the Laviron method. Figure S8. Chronoamperometric responses to H2O2 (A) Reduction potential kept at −0.35 V and (B) Oxidation potential kept at +0.30 V at SPCE/Ni-HCF-CND in 0.1 M PB, pH 7.0. H2O2 concentrations: 0 (black line), 1 μM (red line), 2 μM (blue line), 5 μM (pink line), 10 μM (green line), 25 μM (gark blue line) and 50 μM (lilac line). (C,D): Calibration curves obtained for number of replicate measurements, n = 3. Figure S9. (A) Current intensity of reduction (black) and oxidation (red) of SPCE/Ni-HCF-CND applying ten consecutive cyclic voltammetry scans in 0.1 M PB, pH 7.0, containing 100 µM H2O2. (B) Current intensity of reduction (black) and oxidation (red) of a SPCE/Ni-HCF-CND, applying cyclic voltammetry scans in 0.1 M PB, pH 7.0, containing 100 µM H2O2 at different days (storage of the sensor in absence of light and at 4 °C).

Author Contributions

Investigation, J.M.H.-G.; data curation, E.M.-P. and C.G.-S.; writing—original draft preparation: E.M.-P. and C.G.-S.; writing—review and editing, E.M.-P. and C.G.-S.; supervision, E.M.-P. and C.G.-S.; funding acquisition, E.M.-P., E.L. and C.G.-S. All authors have read and agreed to the published version of the manuscript.

Funding

This research was funded by the Spanish Ministerio de Ciencia e Innovación (PID2022-142262OA-I00 and TED2021–129738B-I00).

Institutional Review Board Statement

Not applicable.

Informed Consent Statement

Not applicable.

Data Availability Statement

The data presented in this study are available upon request from the corresponding authors.

Acknowledgments

This work was supported by the Comunidad Autónoma de Madrid SI3/PJI/2021-00341, and this work was also supported by the Spanish Ministerio de Ciencia e Innovación (PID2022-142262OA-I00, TED2021-129738B-I00, and PID2020-116728-RB100). The authors thank Sara Fernández-Miranda for her additional work.

Conflicts of Interest

The authors declare no conflicts of interest.

References

  1. Yuan, X.; Nico, P.S.; Huang, X.; Liu, T.; Ulrich, C.; Williams, K.H.; Davis, J.A. Production of Hydrogen Peroxide in Groundwater at Rifle, Colorado. Environ. Sci. Technol. 2017, 51, 7881–7891. [Google Scholar] [CrossRef]
  2. Lee, C.-S.; Venkatesan, A.K.; Walker, H.W.; Gobler, C.J. Impact of groundwater quality and associated byproduct formation during UV/hydrogen peroxide treatment of 1,4-dioxane. Water Res. 2020, 173, 115534. [Google Scholar] [CrossRef] [PubMed]
  3. Palsaniya, S.; Jat, B.L.; Mukherji, S. Amperometry sensor for real time detection of hydrogen peroxide adulteration in food samples. Electrochim. Acta 2023, 462, 142724. [Google Scholar] [CrossRef]
  4. Xing, L.; Zhang, W.; Fu, L.; Lorenzo, J.M.; Hao, Y. Fabrication and application of electrochemical sensor for analyzing hydrogen peroxide in food system and biological samples. Food Chem. 2022, 385, 132555. [Google Scholar] [CrossRef] [PubMed]
  5. Ping, J.; Wu, J.; Fan, K.; Ying, Y. An amperometric sensor based on Prussian blue and poly(o-phenylenediamine) modified glassy carbon electrode for the determination of hydrogen peroxide in beverages. Food Chem. 2011, 126, 2005–2009. [Google Scholar] [CrossRef] [PubMed]
  6. Qi, H.; Zhang, C.; Li, X. Amperometric third-generation hydrogen peroxide biosensor incorporating multiwall carbon nanotubes and hemoglobin. Sens. Actuators B Chem. 2006, 114, 364–370. [Google Scholar] [CrossRef]
  7. Zou, N.; Wei, X.; Zong, Z.; Li, X.; Wang, Z.; Wang, X. A novel enzymatic biosensor for detection of intracellular hydrogen peroxide based on 1-aminopyrene and reduced graphene oxides. J. Chem. Sci. 2019, 131, 28. [Google Scholar] [CrossRef]
  8. Murata, K.; Fujimoto, K.; Kitaguchi, Y.; Horiuchi, T.; Kubo, K.; Honda, T. Hydrogen Peroxide Content and pH of Expired Breath Condensate from Patients with Asthma and COPD. COPD: J. Chronic Obstr. Pulm. Dis. 2014, 11, 81–87. [Google Scholar] [CrossRef]
  9. Sun, Y.; Han, L.; Strasser, P. A comparative perspective of electrochemical and photochemical approaches for catalytic H2O2 production. Chem. Soc. Rev. 2020, 49, 6605–6631. [Google Scholar] [CrossRef]
  10. Pappas, A.C.; Stalikas, C.D.; Fiamegos, Y.C.; Karayannis, M.I. Determination of hydrogen peroxide by using a flow injection system with immobilized peroxidase and long pathlength capillary spectrophotometry. Anal. Chim. Acta 2002, 455, 305–313. [Google Scholar] [CrossRef]
  11. Chen, J.; Bai, J. Chemiluminescence flow sensor with immobilized reagent for the determination of pyrogallol based on potassium hexacyanoferrate(III) oxidation. Spectrochim. Acta Part A Mol. Biomol. Spectrosc. 2008, 71, 989–992. [Google Scholar] [CrossRef] [PubMed]
  12. Nakashima, K.; Wada, M.; Kuroda, N.; Akiyama, S.; Imai, K. High-Performance Liquid Chromatographic Determination of Hydrogen Peroxide with Peroxyoxalate Chemiluminescence Detection. J. Liq. Chromatogr. 1994, 17, 2111–2126. [Google Scholar] [CrossRef]
  13. Garguilo, M.G.; Nhan, H.; Proctor, A.; Michael, A.C. Amperometric sensors for peroxide, choline, and acetylcholine based on electron transfer between horseradish peroxidase and a redox polymer. Anal. Chem. 1993, 65, 523–528. [Google Scholar] [CrossRef] [PubMed]
  14. Oliveira, P.R.; Schibelbain, A.F.; Neiva, E.G.C.; Zarbin, A.J.G.; Marcolino, L.H.; Bergamini, M.F. Nickel hexacyanoferrate supported at nickel nanoparticles for voltammetric determination of rifampicin. Sens. Actuators B Chem. 2018, 260, 816–823. [Google Scholar] [CrossRef]
  15. Rajpurohit, A.S.; Srivastava, A.K. Simultaneous electrochemical sensing of three prevalent anti-allergic drugs utilizing nanostructured manganese hexacyanoferrate/chitosan modified screen printed electrode. Sens. Actuators B Chem. 2019, 294, 231–244. [Google Scholar] [CrossRef]
  16. de Mattos, I.L.; Gorton, L.; Laurell, T.; Malinauskas, A.; Karyakin, A.A. Development of biosensors based on hexacyanoferrates. Talanta 2000, 52, 791–799. [Google Scholar] [CrossRef]
  17. Uzunçar, S.; Özdoğan, N.; Ak, M. Amperometric detection of glucose and H2O2 using peroxide selective electrode based on carboxymethylcellulose/polypyrrole and Prussian Blue nanocomposite. Mater. Today Commun. 2021, 26, 101839. [Google Scholar] [CrossRef]
  18. Banavath, R.; Abhinav, A.; Srivastava, R.; Bhargava, P. Highly sensitive ascorbic acid sensors from EDTA chelation derived nickel hexacyanoferrate/ graphene nanocomposites. Electrochim. Acta 2022, 419, 140335. [Google Scholar] [CrossRef]
  19. Ravi Shankaran, D.; Sriman Narayanan, S. Amperometric sensor for thiosulphate based on cobalt hexacyanoferrate modified electrode. Sens. Actuators B Chem. 2002, 86, 180–184. [Google Scholar] [CrossRef]
  20. Pandey, P.C.; Pandey, A.K. Electrochemical sensing of dopamine and pyrogallol on mixed analogue of Prussian blue nanoparticles modified electrodes—Role of transition metal on the electrocatalysis and peroxidase mimetic activity. Electrochim. Acta 2013, 109, 536–545. [Google Scholar] [CrossRef]
  21. Yang, S.; Li, G.; Wang, G.; Zhao, J.; Hu, M.; Qu, L. A novel nonenzymatic H2O2 sensor based on cobalt hexacyanoferrate nanoparticles and graphene composite modified electrode. Sens. Actuators B Chem. 2015, 208, 593–599. [Google Scholar] [CrossRef]
  22. Liu, Y.; Xu, L. Electrochemical Sensor for Tryptophan Determination Based on Copper-cobalt Hexacyanoferrate Film Modified Graphite Electrode. Sensors 2007, 7, 2446–2457. [Google Scholar] [CrossRef] [PubMed]
  23. Wang, J.; Zhuang, S.; Liu, Y. Metal hexacyanoferrates-based adsorbents for cesium removal. Coord. Chem. Rev. 2018, 374, 430–438. [Google Scholar] [CrossRef]
  24. Zhiqiang, G.; Xingyao, Z.; Guangqing, W.; Peibiao, L.; Zaofan, Z. Potassium ion-selective electrode based on a cobalt(II)-hexacyanoferrate film-modified electrode. Anal. Chim. Acta 1991, 244, 39–48. [Google Scholar] [CrossRef]
  25. Fu, T. A room temperature ammonia sensor based on nanosized copper hexacyanoferrate(II). Sens. Actuators B Chem. 2015, 212, 487–494. [Google Scholar] [CrossRef]
  26. Omarova, M.; Koishybay, A.; Yesibolati, N.; Mentbayeva, A.; Umirov, N.; Ismailov, K.; Adair, D.; Babaa, M.-R.; Kurmanbayeva, I.; Bakenov, Z. Nickel Hexacyanoferrate Nanoparticles as a Low Cost Cathode Material for Lithium-Ion Batteries. Electrochim. Acta 2015, 184, 58–63. [Google Scholar] [CrossRef]
  27. Itaya, K.; Uchida, I.; Neff, V.D. Electrochemistry of polynuclear transition metal cyanides: Prussian blue and its analogues. Acc. Chem. Res. 1986, 19, 162–168. [Google Scholar] [CrossRef]
  28. Revenga-Parra, M.; Robledo, S.N.; Martínez-Periñán, E.; González-Quirós, M.M.; Colina, A.; Heras, A.; Pariente, F.; Lorenzo, E. Direct determination of monosaccharides in honey by coupling a sensitive new Schiff base Ni complex electrochemical sensor and chemometric tools. Sens. Actuators B Chem. 2020, 312, 127848. [Google Scholar] [CrossRef]
  29. Revenga-Parra, M.; García, T.; Lorenzo, E.; Pariente, F. Electrocatalytic oxidation of methanol and other short chain aliphatic alcohols on glassy carbon electrodes modified with conductive films derived from NiII-(N,N′-bis(2,5-dihydroxybenzylidene)-1,2-diaminobenzene). Sens. Actuators B Chem. 2008, 130, 730–738. [Google Scholar] [CrossRef]
  30. Fiorito, P.A.; Córdoba de Torresi, S.I. Hybrid nickel hexacyanoferrate/polypyrrole composite as mediator for hydrogen peroxide detection and its application in oxidase-based biosensors. J. Electroanal. Chem. 2005, 581, 31–37. [Google Scholar] [CrossRef]
  31. Lin, J.; Zhou, D.M.; Hocevar, S.B.; McAdams, E.T.; Ogorevc, B.; Zhang, X. Nickel hexacyanoferrate modified screen-printed carbon electrode for sensitive detection of ascorbic acid and hydrogen peroxide. FBL 2005, 10, 483–491. [Google Scholar] [CrossRef] [PubMed]
  32. Yu, Z.; Fu, H.; Xu, W.; He, L.; Zhao, Z. Determination of cesium using nickel hexacyanoferrate by stripping voltammetry. Analyst 2024, 149, 4922–4931. [Google Scholar] [CrossRef] [PubMed]
  33. Lushaj, E.; Bordin, M.; Akbar, K.; Liccardo, L.; Barroso-Martín, I.; Rodríguez-Castellón, E.; Vomiero, A.; Moretti, E.; Polo, F. Highly Efficient Solar-Light-Driven Photodegradation of Metronidazole by Nickel Hexacyanoferrate Nanocubes Showing Enhanced Catalytic Performances. Small Methods 2024, 9, 2301541. [Google Scholar] [CrossRef] [PubMed]
  34. Tsai, S.-W.; Cuong, D.V.; Hou, C.-H. Selective capture of ammonium ions from municipal wastewater treatment plant effluent with a nickel hexacyanoferrate electrode. Water Res. 2022, 221, 118786. [Google Scholar] [CrossRef]
  35. Bao, L.; Zhang, Z.-L.; Tian, Z.-Q.; Zhang, L.; Liu, C.; Lin, Y.; Qi, B.; Pang, D.-W. Electrochemical Tuning of Luminescent Carbon Nanodots: From Preparation to Luminescence Mechanism. Adv. Mater. 2011, 23, 5801–5806. [Google Scholar] [CrossRef]
  36. Hsu, P.-C.; Chang, H.-T. Synthesis of high-quality carbon nanodots from hydrophilic compounds: Role of functional groups. Chem. Commun. 2012, 48, 3984–3986. [Google Scholar] [CrossRef]
  37. Guerrero-Esteban, T.; Gutiérrez-Sánchez, C.; Martínez-Periñán, E.; Revenga-Parra, M.; Pariente, F.; Lorenzo, E. Sensitive glyphosate electrochemiluminescence immunosensor based on electrografted carbon nanodots. Sens. Actuators B Chem. 2021, 330, 129389. [Google Scholar] [CrossRef]
  38. Gutiérrez-Sánchez, C.; Mediavilla, M.; Guerrero-Esteban, T.; Revenga-Parra, M.; Pariente, F.; Lorenzo, E. Direct covalent immobilization of new nitrogen-doped carbon nanodots by electrografting for sensing applications. Carbon 2020, 159, 303–310. [Google Scholar] [CrossRef]
  39. Shokri, R.; Amjadi, M. Boron and nitrogen co-doped carbon dots as a chemiluminescence probe for sensitive assay of rifampicin. J. Photochem. Photobiol. A Chem. 2022, 425, 113694. [Google Scholar] [CrossRef]
  40. Guerrero-Esteban, T.; Gutiérrez-Sánchez, C.; Villa-Manso, A.M.; Revenga-Parra, M.; Pariente, F.; Lorenzo, E. Sensitive SARS-CoV-2 detection in wastewaters using a carbon nanodot-amplified electrochemiluminescence immunosensor. Talanta 2022, 247, 123543. [Google Scholar] [CrossRef]
  41. Martínez-Periñán, E.; Domínguez-Saldaña, A.; Villa-Manso, A.M.; Gutiérrez-Sánchez, C.; Revenga-Parra, M.; Mateo-Martí, E.; Pariente, F.; Lorenzo, E. Azure A embedded in carbon dots as NADH electrocatalyst: Development of a glutamate electrochemical biosensor. Sens. Actuators B Chem. 2023, 374, 132761. [Google Scholar] [CrossRef]
  42. Li, X.; Fu, Y.; Zhao, S.; Xiao, J.; Lan, M.; Wang, B.; Zhang, K.; Song, X.; Zeng, L. Metal ions-doped carbon dots: Synthesis, properties, and applications. Chem. Eng. J. 2022, 430, 133101. [Google Scholar] [CrossRef]
  43. Gutiérrez-Sánchez, C.; Martínez-Periñán, E.; Mateo-Martí, E.; Lorenzo, E. “In situ” hexagonal nanostructures surface growth from boron-carbon nanodots. Surf. Interfaces 2025, 64, 106425. [Google Scholar] [CrossRef]
  44. Qu, L.; Liu, Y.; Baek, J.-B.; Dai, L. Nitrogen-Doped Graphene as Efficient Metal-Free Electrocatalyst for Oxygen Reduction in Fuel Cells. ACS Nano 2010, 4, 1321–1326. [Google Scholar] [CrossRef]
  45. Jeong, H.M.; Lee, J.W.; Shin, W.H.; Choi, Y.J.; Shin, H.J.; Kang, J.K.; Choi, J.W. Nitrogen-Doped Graphene for High-Performance Ultracapacitors and the Importance of Nitrogen-Doped Sites at Basal Planes. Nano Lett. 2011, 11, 2472–2477. [Google Scholar] [CrossRef]
  46. Gopalakrishnan, K.; Moses, K.; Govindaraj, A.; Rao, C.N.R. Supercapacitors based on nitrogen-doped reduced graphene oxide and borocarbonitrides. Solid State Commun. 2013, 175–176, 43–50. [Google Scholar] [CrossRef]
  47. Fiaccabrino, G.C.; Koudelka-Hep, M. Thin-Film Microfabrication of Electrochemical Transducers. Electroanalysis 1998, 10, 217–222. [Google Scholar] [CrossRef]
  48. Puganova, E.A.; Karyakin, A.A. New materials based on nanostructured Prussian blue for development of hydrogen peroxide sensors. Sens. Actuators B Chem. 2005, 109, 167–170. [Google Scholar] [CrossRef]
  49. Karyakin, A.A.; Puganova, E.A.; Budashov, I.A.; Kurochkin, I.N.; Karyakina, E.E.; Levchenko, V.A.; Matveyenko, V.N.; Varfolomeyev, S.D. Prussian Blue Based Nanoelectrode Arrays for H2O2 Detection. Anal. Chem. 2004, 76, 474–478. [Google Scholar] [CrossRef]
  50. Neiva, E.G.C.; Zarbin, A.J.G. Nickel hexacyanoferrate/graphene thin film: A candidate for the cathode in aqueous metal-ion batteries. New J. Chem. 2022, 46, 11118–11127. [Google Scholar] [CrossRef]
  51. Arcudi, F.; Đorđević, L.; Prato, M. Synthesis, Separation, and Characterization of Small and Highly Fluorescent Nitrogen-Doped Carbon NanoDots. Angew. Chem. Int. Ed. 2016, 55, 2107–2112. [Google Scholar] [CrossRef]
  52. Martínez-Periñán, E.; García-Mendiola, T.; Enebral-Romero, E.; del Caño, R.; Vera-Hidalgo, M.; Vázquez Sulleiro, M.; Navío, C.; Pariente, F.; Pérez, E.M.; Lorenzo, E. A MoS2 platform and thionine-carbon nanodots for sensitive and selective detection of pathogens. Biosens. Bioelectron. 2021, 189, 113375. [Google Scholar] [CrossRef]
  53. Pina-Coronado, C.; Martínez-Sobrino, Á.; Gutiérrez-Gálvez, L.; Del Caño, R.; Martínez-Periñán, E.; García-Nieto, D.; Rodríguez-Peña, M.; Luna, M.; Milán-Rois, P.; Castellanos, M.; et al. Methylene Blue functionalized carbon nanodots combined with different shape gold nanostructures for sensitive and selective SARS-CoV-2 sensing. Sens. Actuators B Chem. 2022, 369, 132217. [Google Scholar] [CrossRef] [PubMed]
  54. Martínez-Periñán, E.; Martínez-Sobrino, Á.; Bravo, I.; García-Mendiola, T.; Mateo-Martí, E.; Pariente, F.; Lorenzo, E. Neutral Red-carbon nanodots for selective fluorescent DNA sensing. Anal. Bioanal. Chem. 2022, 414, 5537–5548. [Google Scholar] [CrossRef] [PubMed]
  55. Li, L.; Wang, C.; Liu, K.; Wang, Y.; Liu, K.; Lin, Y. Hexagonal Cobalt Oxyhydroxide–Carbon Dots Hybridized Surface: High Sensitive Fluorescence Turn-on Probe for Monitoring of Ascorbic Acid in Rat Brain Following Brain Ischemia. Anal. Chem. 2015, 87, 3404–3411. [Google Scholar] [CrossRef] [PubMed]
  56. Niu, J.; Gao, H.; Wang, L.; Xin, S.; Zhang, G.; Wang, Q.; Guo, L.; Liu, W.; Gao, X.; Wang, Y. Facile synthesis and optical properties of nitrogen-doped carbon dots. New J. Chem. 2014, 38, 1522–1527. [Google Scholar] [CrossRef]
  57. Rub Pakkath, S.A.; Chetty, S.S.; Selvarasu, P.; Vadivel Murugan, A.; Kumar, Y.; Periyasamy, L.; Santhakumar, M.; Sadras, S.R.; Santhakumar, K. Transition Metal Ion (Mn2+, Fe2+, Co2+, and Ni2+)-Doped Carbon Dots Synthesized via Microwave-Assisted Pyrolysis: A Potential Nanoprobe for Magneto-fluorescent Dual-Modality Bioimaging. ACS Biomater. Sci. Eng. 2018, 4, 2582–2596. [Google Scholar] [CrossRef]
  58. Andreev, E.A.; Shavokshina, V.A.; Nikitina, V.N.; Pozdnyakova, D.D.; Baranova, I.A.; Chuchalin, A.G.; Karyakin, A.A. Sensor platform for noninvasive evaluation of pulmonary oxidative status. Talanta 2025, 290, 127792. [Google Scholar] [CrossRef]
  59. Komkova, M.A.; Ibragimova, O.A.; Karyakina, E.E.; Karyakin, A.A. Catalytic Pathway of Nanozyme “Artificial Peroxidase” with 100-Fold Greater Bimolecular Rate Constants Compared to Those of the Enzyme. J. Phys. Chem. Lett. 2021, 12, 171–176. [Google Scholar] [CrossRef]
  60. Karpova, E.V.; Shcherbacheva, E.V.; Komkova, M.A.; Eliseev, A.A.; Karyakin, A.A. Core–Shell Nanozymes “Artificial Peroxidase”: Stability with Superior Catalytic Properties. J. Phys. Chem. Lett. 2021, 12, 5547–5551. [Google Scholar] [CrossRef]
  61. Sabzi, R.E.; Kant, K.; Losic, D. Electrochemical synthesis of nickel hexacyanoferrate nanoarrays with dots, rods and nanotubes morphology using a porous alumina template. Electrochim. Acta 2010, 55, 1829–1835. [Google Scholar] [CrossRef]
  62. Chen, S.-M.; Wang, C.-H.; Lin, K.-C. Electrocatalytic Oxidation of Guanine and Adenine Based on Iron Hexacyanoferrate Film Modified Electrodes. Int. J. Electrochem. Sci. 2012, 7, 405–425. [Google Scholar] [CrossRef]
  63. Wang, Z.; Hao, X.; Zhang, Z.; Liu, S.; Liang, Z.; Guan, G. One-step unipolar pulse electrodeposition of nickel hexacyanoferrate/chitosan/carbon nanotubes film and its application in hydrogen peroxide sensor. Sens. Actuators B Chem. 2012, 162, 353–360. [Google Scholar] [CrossRef]
  64. Vokhmyanina, D.V.; Shcherbacheva, E.V.; Daboss, E.V.; Karyakina, E.E.; Karyakin, A.A. Core-Shell Iron-Nickel Hexacyanoferrate Nanoparticle-Based Sensors for Hydrogen Peroxide Scavenging Activity. Chemosensors 2021, 9, 344. [Google Scholar] [CrossRef]
  65. Eren, E.; Uygun Oksuz, A. Flexible nickel Prussian blue analogue films for electrochromic and H2O2 sensing. J. Mater. Sci. Mater. Electron. 2020, 31, 15434–15445. [Google Scholar] [CrossRef]
  66. Sitnikova, N.A.; Borisova, A.V.; Komkova, M.A.; Karyakin, A.A. Superstable Advanced Hydrogen Peroxide Transducer Based on Transition Metal Hexacyanoferrates. Anal. Chem. 2011, 83, 2359–2363. [Google Scholar] [CrossRef]
  67. Wang, Z.; Sun, S.; Hao, X.; Ma, X.; Guan, G.; Zhang, Z.; Liu, S. A facile electrosynthesis method for the controllable preparation of electroactive nickel hexacyanoferrate/polyaniline hybrid films for H2O2 detection. Sens. Actuators B Chem. 2012, 171–172, 1073–1080. [Google Scholar] [CrossRef]
  68. Li, X.; Du, X.; Wang, Z.; Hao, X.; Guan, G.; Zhang, H.; Abuliti, A.; Ma, G. Electroactive NiHCF/PANI hybrid films prepared by pulse potentiostatic method and its performance for H2O2 detection. J. Electroanal. Chem. 2014, 717–718, 69–77. [Google Scholar] [CrossRef]
Figure 1. (A) TEM microscopy of the Ni-CNDs with different magnifications of 400 k and 500 k (inset). (B) Ni-CND diameter size histogram obtained from measuring 120 nanoparticles. (C) Tapping-mode AFM topographic image of Ni-CNDs and (D) topographic profile (green line) along the green line drawn at (C). (E) FTIR spectra of the CND in the absence of nickel (red line) and Ni-CNDs (black line). (F) EDX analysis of Ni-CNDs.
Chemosensors 13 00195 g001
Figure 2. Successive CVs of the electrosynthesis of the nickel hexacyanoferrate complex applying a potential between −0.3 and 1.2 V, and 15 scans at 100 mV/s for a SPCE modified with Ni-CNDs (A) and unmodified (B) in presence of 2.0 mM K3[Fe(CN)6] 0.1 M KCl. Red CV indicates the first scan, black CVs indicate the intermediate scans, and blue CV indicates the last scan.
Chemosensors 13 00195 g002
Figure 3. Tapping-mode AFM topographic image of (A) Ni-CND/chitosan/HOPG. (B) Chitosan/HOPG and (C) Ni-HCF-CND/HOPG and topographic profile along the line drawn in green.
Chemosensors 13 00195 g003
Figure 4. CVs obtained from an unmodified SPCE (black line) and Ni HCF-CD-modified SPCE (red line) in the presence of 1.0 mM H2O2, in 0.1 M PB at pH 7.0 at a scan rate of 10 mV/s. Ni HCF-CDs modified (blue line) in the absence of 1.0 mM H2O2. (A) Reduction potential between 0.4 and −0.6 V and (B) oxidation potential between 0.0 and 0.6 V.
Chemosensors 13 00195 g004
Figure 5. Figure 5. Chronoamperometric responses to H2O2 (A,C) reduction potential kept at −0.35 V and (B,D) oxidation potential kept at +0.30 V at SPCE/Ni-HCF-CND in 0.1 M PB, pH 7.0. H2O2 concentrations: 0 (black line), 50 μM (red line), 100 μM (blue line), 200 μM (pink line), 500 μM (green line), 750 μM (gray blue line), and 1000 μM (lilac line). Inset: calibration curve (line red) obtained for number of replicate measurements, n = 3.
Chemosensors 13 00195 g005
Table 1. Analytical parameters obtained in this work from the developed sensor platforms SPCE/Ni-HCF-CND.
ReductionOxidation
Limit of detection (LOD) (μM)0.493.22
Limit of quantitation (LOQ) (μM)1.6410.73
Sensitivity (μA/μM)0.02170.00428
Reproducibility (%)12.115.8
Repeatability (%)3.24.5
Table 2. Analytical parameters of hydrogen peroxide sensors based on nickel hexacyanoferrate reported in the literature.
ElectrodeLOD (µM)Linear Range (µM)Sensitivity (A·mM−1·cm−2)Reference
Nickel hexacyanoferrate/polypirrole composite-100–1000340.9[30]
Nickelhexacyanoferrate/chitosan/carbon nanotube film0.2840–56006.54 × 10−4[63]
Core–Shell Iron–Nickel Hexacyanoferrate Nanoparticle0.151–10005 × 10−4[64]
Flexible nickel Prussian blue analogueNiPBA ITO/PET13703920–15,6801672[65]
Iron- and nickel–hexacyanoferrate (NiHCF)layers0.10.1–10003.5 × 10−4[66]
Electrochemically modified screen-printedcarbon electrode (SPCE)5.550–150018.42 µA/mM[31]
NiHCF/PANI/CNTs0.1241–30002.288 × 10−3[67]
NiHCF/PANI hybrid films prepared using pulse potentiostatic method0.05551.25–29503.119 × 10−4[68]
SPCE/Ni-HCF-CND0.491–1000180This Work
Table 3. Fortified tap water analysis.
SampleReduction Calibration Curve/Recovery %Oxidation Calibration Curve/Recovery %
100 µM of H2O2 Tap Water108.5102.1
Disclaimer/Publisher’s Note: The statements, opinions and data contained in all publications are solely those of the individual author(s) and contributor(s) and not of MDPI and/or the editor(s). MDPI and/or the editor(s) disclaim responsibility for any injury to people or property resulting from any ideas, methods, instructions or products referred to in the content.

