Article

Determination of the Critical Micelle Concentration of Gelatin, ι-Carrageenan, Pectin, Gellan Gum and Xanthan Gum by Mid Infrared Spectroscopy Among Other Techniques

by
Joel Henri Konan Kouakou Koko
1,2,
Vama Etienne Tia
2,
Gaoussou Karamoko
1 and
Romdhane Karoui
1,*
1
University of Artois, University of Lille, University Littoral Côte d’Opale, University of Picardie Jules Verne, University of Liège, INRAE, Junia, UMR-T 1158, BioEcoAgro, F-62300 Lens, France
2
Department of Biochemistry, Peleforo Gon Coulibaly University, Korhogo 1328, Côte d’Ivoire
*
Author to whom correspondence should be addressed.
Chemosensors 2025, 13(3), 99; https://doi.org/10.3390/chemosensors13030099
Submission received: 7 January 2025 / Revised: 4 March 2025 / Accepted: 6 March 2025 / Published: 9 March 2025

Abstract

:
Critical micelle concentration (CMC) is the main physico-chemical parameter to be determined for surfactants due to its impact on surface activity and self-assembled aggregation. The aim of the present study is to determine CMC at 40 °C of gelatin, ι-carrageenan, pectin, gellan gum and xanthan gum by using different analytical techniques, particularly mid-infrared (MIR) spectroscopy as a rapid technique. The CMC values obtained for each hydrocolloid were relatively identical regardless of the applied technique: rheometer, conductimetry and automatic drop tensiometer (tracker). Indeed, CMC values of 55.16 g/L, 14 g/L, 6.04 g/L, 7 g/L and 3.48 g/L were obtained, respectively, for gelatin, ι-carrageenan, pectin, gellan gum and xanthan gum by using the surface tension method (tracker). Similar results were obtained for MIR spectroscopy since CMC values of 70 g/L, 15 g/L, 7 g/L, 5 g/L and 6 g/L were observed, respectively, for gelatin, ι-carrageenan, pectin, gellan gum and xanthan gum. The results presented here clearly demonstrate that it is possible to use MIR spectroscopy as a rapid analytical technique for the CMC determination of the investigated hydrocolloids.

1. Introduction

Hydrocolloids are defined as polysaccharides and/or proteins that contribute to the viscosity and gelation of a considered solution. Hydrocolloids are used in the industrial sector for their thickening and gelling properties, stabilizing foams, emulsions and dispersions, inhibiting ice and sugar formation and controlling the release of flavor [1]. Their application in the food industry is due to their hydrophilicity and surface activity [2,3].
Polysaccharides are generally used for their strong hydrophilic character, while proteins are employed as emulsifiers due to their hydrophilic and hydrophobic side chains, which make them effective surface active agents. Hence, small fractions of proteins, present in some polysaccharides, are often considered to be responsible for the observed emulsification properties [4]. The surface activity of these hydrocolloids is due either to the (i) non-polar character of chemical groups attached to the hydrophilic polysaccharide backbone and/or (ii) the presence of a protein component linked covalently or physically to the polysaccharide (some gums, pectins, etc.) [5,6]. The most widely used polysaccharide emulsifiers are gum arabic (Acacia senegal), modified starches, modified celluloses, some kinds of pectins, and galactomannans (fenugreek, guar gum, tara gum, and locust bean gum) [7]. Gelatin is the only protein that can be properly categorized as a hydrocolloid due to its unique hydrophilic character. Gelatin is mostly used as a stabilizer and gelling agent, but it present some emulsifying properties.
An emulsifying agent (emulsifier) is a surface-active ingredient that adsorbs at the newly formed oil/water interface during emulsion preparation, and it protects the newly formed droplets against immediate recoalescence [5]. A convenient way to have the relative effectiveness of an emulsifier to stabilize an emulsion is to determine the emulsifier concentration required to produce the minimum mean droplet size (maximum surface area per unit volume of oil). In water, emulsifiers are dissolved completely at very low concentrations, but above certain concentrations, they aggregate and form micelles. This concentration is known as “critical micelle concentration (CMC)” and represents one of the most important physico-chemical parameters to be determined for these surface active agents [8,9].
The CMC of a surfactant is the concentration range beyond which physical parameters such as electrical conductivity, osmotic pressure, surface tension, density, light scattering, refractive index, or the medium’s polarity abruptly change [10]. The value of the CMC can be evaluated by the change in the physicochemical properties of the surfactant solutions as the concentration of the amphipathic molecules is increased. Several experimental approaches are used to determine CMC, all based on measurement of the abrupt change in the corresponding physical property in the concentration range covering the transition of the surfactant molecules from the monomeric to micellar state [11,12]. One of the main known techniques is the drop tensiometer, which is based on the determination of surface tension measurements [11]. However, it has been reported that the presence of surface-active impurities in the solution leads to an incorrect interpretation of the CMC with this method [11]. In addition, measurements using this technique, which is known as the reference one, must then be undertaken with caution. Other methods are also used to determine the CMC, such as rheology, electrophoresis, and isothermal titration calorimetry [11,12,13]. Although they can be advantageous, all of these techniques are considered destructive, require relatively large amounts of samples, and need skilled operators [9,11]. Other analytical techniques are proposed as rapid ones allowing the determination of CMC. Among them, there is fluorescence spectroscopy, densimetry, spectrophotometry [8,9], conductimetry, and viscosimeter [12,13]. These techniques have demonstrated their ability to determine CMC.
FT-MIR spectroscopy is among the most powerful spectroscopic techniques used as an analytical tool in various fields to give details on the functional group as well as the chemical composition of specific substances [14,15,16,17,18]. The technique was used with success to determine chemical, physico-chemical, structural, morphological, and intermolecular cross-linking of foods and biomaterials [19]. In fact, previous studies have successfully used FT-MIR to determine functional groups and to study the structure of several hydrocolloids like gelatin, kappa-carrageenan, xanthan gum, pectin, gellan gum [20,21,22,23,24,25,26,27,28]. The authors pointed out that the transition from the monomeric state to the micellar state could therefore be visualized through an abrupt change in the absorbance of surfactant solutions. Also, other studies were used to determine the CMC of surfactants [29,30,31]. In fact, Guo et al. [29] studied the water-induced micellization of poly(oxyethylene—oxypropylene—oxyethylene) block copolymer, Pluronic L92, in p-xylene solution by FT-MIR. The results indicated that the block copolymer molecules showed stronger intermolecular interactions as compared with that before the transition to micellization. The micellization of Pluronic L92 in p-xylene was explained by the strengthening of the intermolecular interaction of copolymer. Furthermore, Becherová et al. [31] used MIR measurements to determine the CMC of sodium decanoate based on changes in the recorded spectra (shifts in vibrational bands and their overall absorbance) at various concentrations. Again, an abrupt change in the curve was observed at the concentration around 80 mM corresponding to the CMC of sodium decanoate. It was depicted from the previous findings that increasing the surfactant concentrations induced an increase in the absorbance of some peaks at approximately the same wavelength.
However, the above-mentioned techniques related to the determination of CMC were realized on chemical surfactants such as sodium decanoate and Pluronic L92. In the present study, we evaluate for the first time the use of FT-MIR spectroscopy as a rapid technique to determine CMC values of five hydrocolloids. Therefore, this study aimed to determine the CMC of hydrocolloids derived from vegetable (Iota-carrageenan and pectin), microbial (gellan gum and xanthan gum) and animal (gelatin) by different analytical techniques named FT-MIR spectroscopy, tensiometry, viscosity and condutimetry.

2. Materials and Methods

2.1. Materials

The hydrocolloids employed in this study were:
  • Gelatin (Bloom 210, 20 Mesh, Type A S4814, Nactis, Furdenheim, France)
  • Gellan gum (Modulose LA800, Kalys, Saint Nolff, France)
  • Iota-carrageenan (ι-Carrageenan) (Genuvisco carrageenan type J, Alliances Gums et Industries, Cormeilles En Parisis, France)
  • Pectin (GRINSED Pectin XSS 100, PD 234149-4.5EN, Danisco, Neuilly-Sur-Seine, France)
  • Xanthan gum (Ref. GE060, E415, Millbaker, Torcy Le Petit, France)

2.2. Preparation of Hydrocolloid Solutions

Each hydrocolloid solution is prepared with distilled water by stirring at 500 rpm for 2 h to ensure proper solubilization. According to the Literature, the he solubilization temperatures are fixed to 40 °C, 85 °C, 80 °C, 75 °C and 20 °C, respectively, for gelatin, ι-Carrageenan, pectin, gellan gum and xanthan gum. For each hydrocolloid, different concentration ranges were prepared according to the type of hydrocolloids: from 10 g/L to 20 g/L for iota-carrageenan, 10 g/L to 100 g/L for gelatin and 1 g/L to 10 g/L for pectin, gellan gum and xanthan gum. All measurements were made in triplicate.

2.3. Mid-Infrared Analysis

FT-MIR spectra were acquired at 40 °C from 3000 to 400 cm−1 with a resolution of 4 cm−1 on a Fourier transform spectrometer IRTracer-100 (Shimadzu, Duisburg, Germany). The ATR (Attenuated total reflection) cell used as a sampling accessory has a horizontal reflection crystal made of zinc selenide (ZnSe) with an incidence angle of 45° and reflections of 10. Thirty-two (32) scans were accumulated for each spectrum with a resolution of 16 cm−1 and an apodization of Square Triangle. The background spectrum was scanned at the beginning of the measurement by pouring the ATR cell with distilled water [21,23]. Two (2) mL of hydrocolloid solutions was introduced into the ATR cell and after each measurement the ATR crystal was thoroughly washed with distilled water and then dried. For each concentration of hydrocolloid solution, three spectra were recorded. For CMC values determination, MIR spectra of hydrocolloid solutions (gelatin, ι-carrageenan, pectin, gellan gum and xanthan gum) are first depicted. Then, from MIR spectra, CMC of hydrocolloids are determined by plotting the sum of absorbance of all the major peaks ( A T ) against hydrocolloid concentrations.

2.4. Conductivity Analysis

The specific conductivity (μS/cm) of hydrocolloid solutions was measured at 40 °C using a conductimetry equipped with a WT 340i probe CO-330 (VWR international, Rosny-sous-Bois, France). The equipment was calibrated using KCl conductivity standard solution ([KCl] = 0.1000 mol/L, κ = 12.97 mS/cm). Conductivity measurements are determined for each hydrocolloid solutions at different concentrations varying from 10 g/L to 20 g/L for iota-carrageenan, 10 g/L to 100 g/L for gelatin and 1 g/L to 10 g/L for pectin, gellan gum and xanthan gum. The choice of these concentration was based on previous studies that have used these hydrocolloids as emulsifiers for emulsion formulation [32,33]. The CMC is determined from the curve of the conductivity depending on the concentration of hydrocolloid solutions.

2.5. Viscosity Analysis

The apparent viscosity of hydrocolloid solutions was measured at 40 °C using a Haake Mars rheometer (Thermo Scientific, Bordeaux, France) by utilizing a parallel plate geometry (TMP50, P35 TiL). The shear rate ranged from 0.1 to 100 1/s. All solutions were maintained at 40 °C for 3 min prior to measurement. 1 mL of each hydrocolloid solution was taken and placed on thermostat plate. The measured flow rates of the hydrocolloid solutions for each concentration were translated into their specific viscosity ( η S P ) values according to the following equation [13,34]
η S P = η η 0 1
where η is the solution viscosity and η 0 is the pure solvent viscosity.
The CMC of hydrocolloid solutions are determined by plotting the curves of the specific viscosity as a function of the solution concentrations.

2.6. Surface Tension Analysis

Different concentrations of hydrocolloid solutions prepared in distilled water are analyzed at 40 °C using a Drop tensiometer shape analysis method. A Tracker drop tensiometer (Teclis scientific, Civrieux-d’Azergues, France) was used to measure the dynamic surface tension γ at air-water interface [9,35]. An air drop was formed in hydrocolloid solutions at different concentrations according to the type of hydrocolloid. Both volume drop (10 µL) and temperature (40 °C) were controlled. The drop profile was recorded in real-time with a video camera and its surface tension value was determined according to the Laplacian shape. For xanthan gum, above 6 g/L, measurement was enabled because it was impossible to form the drop from the concentration higher than 6 g/L for the surface tension measurement because the solution was too concentrated.

2.7. Statistical Analysis

The recorded CMC values were subjected to statistical analysis to determine the differences between CMC values from each technique for all hydrocolloids. Statistical analysis were conducted using one-way analysis of variance (ANOVA) followed by multiple comparisons using a t-test (Fisher’s LSD, p < 0.05). All experiments were repeated at least three times and values were expressed as means ± standard deviation.

3. Results and Discussion

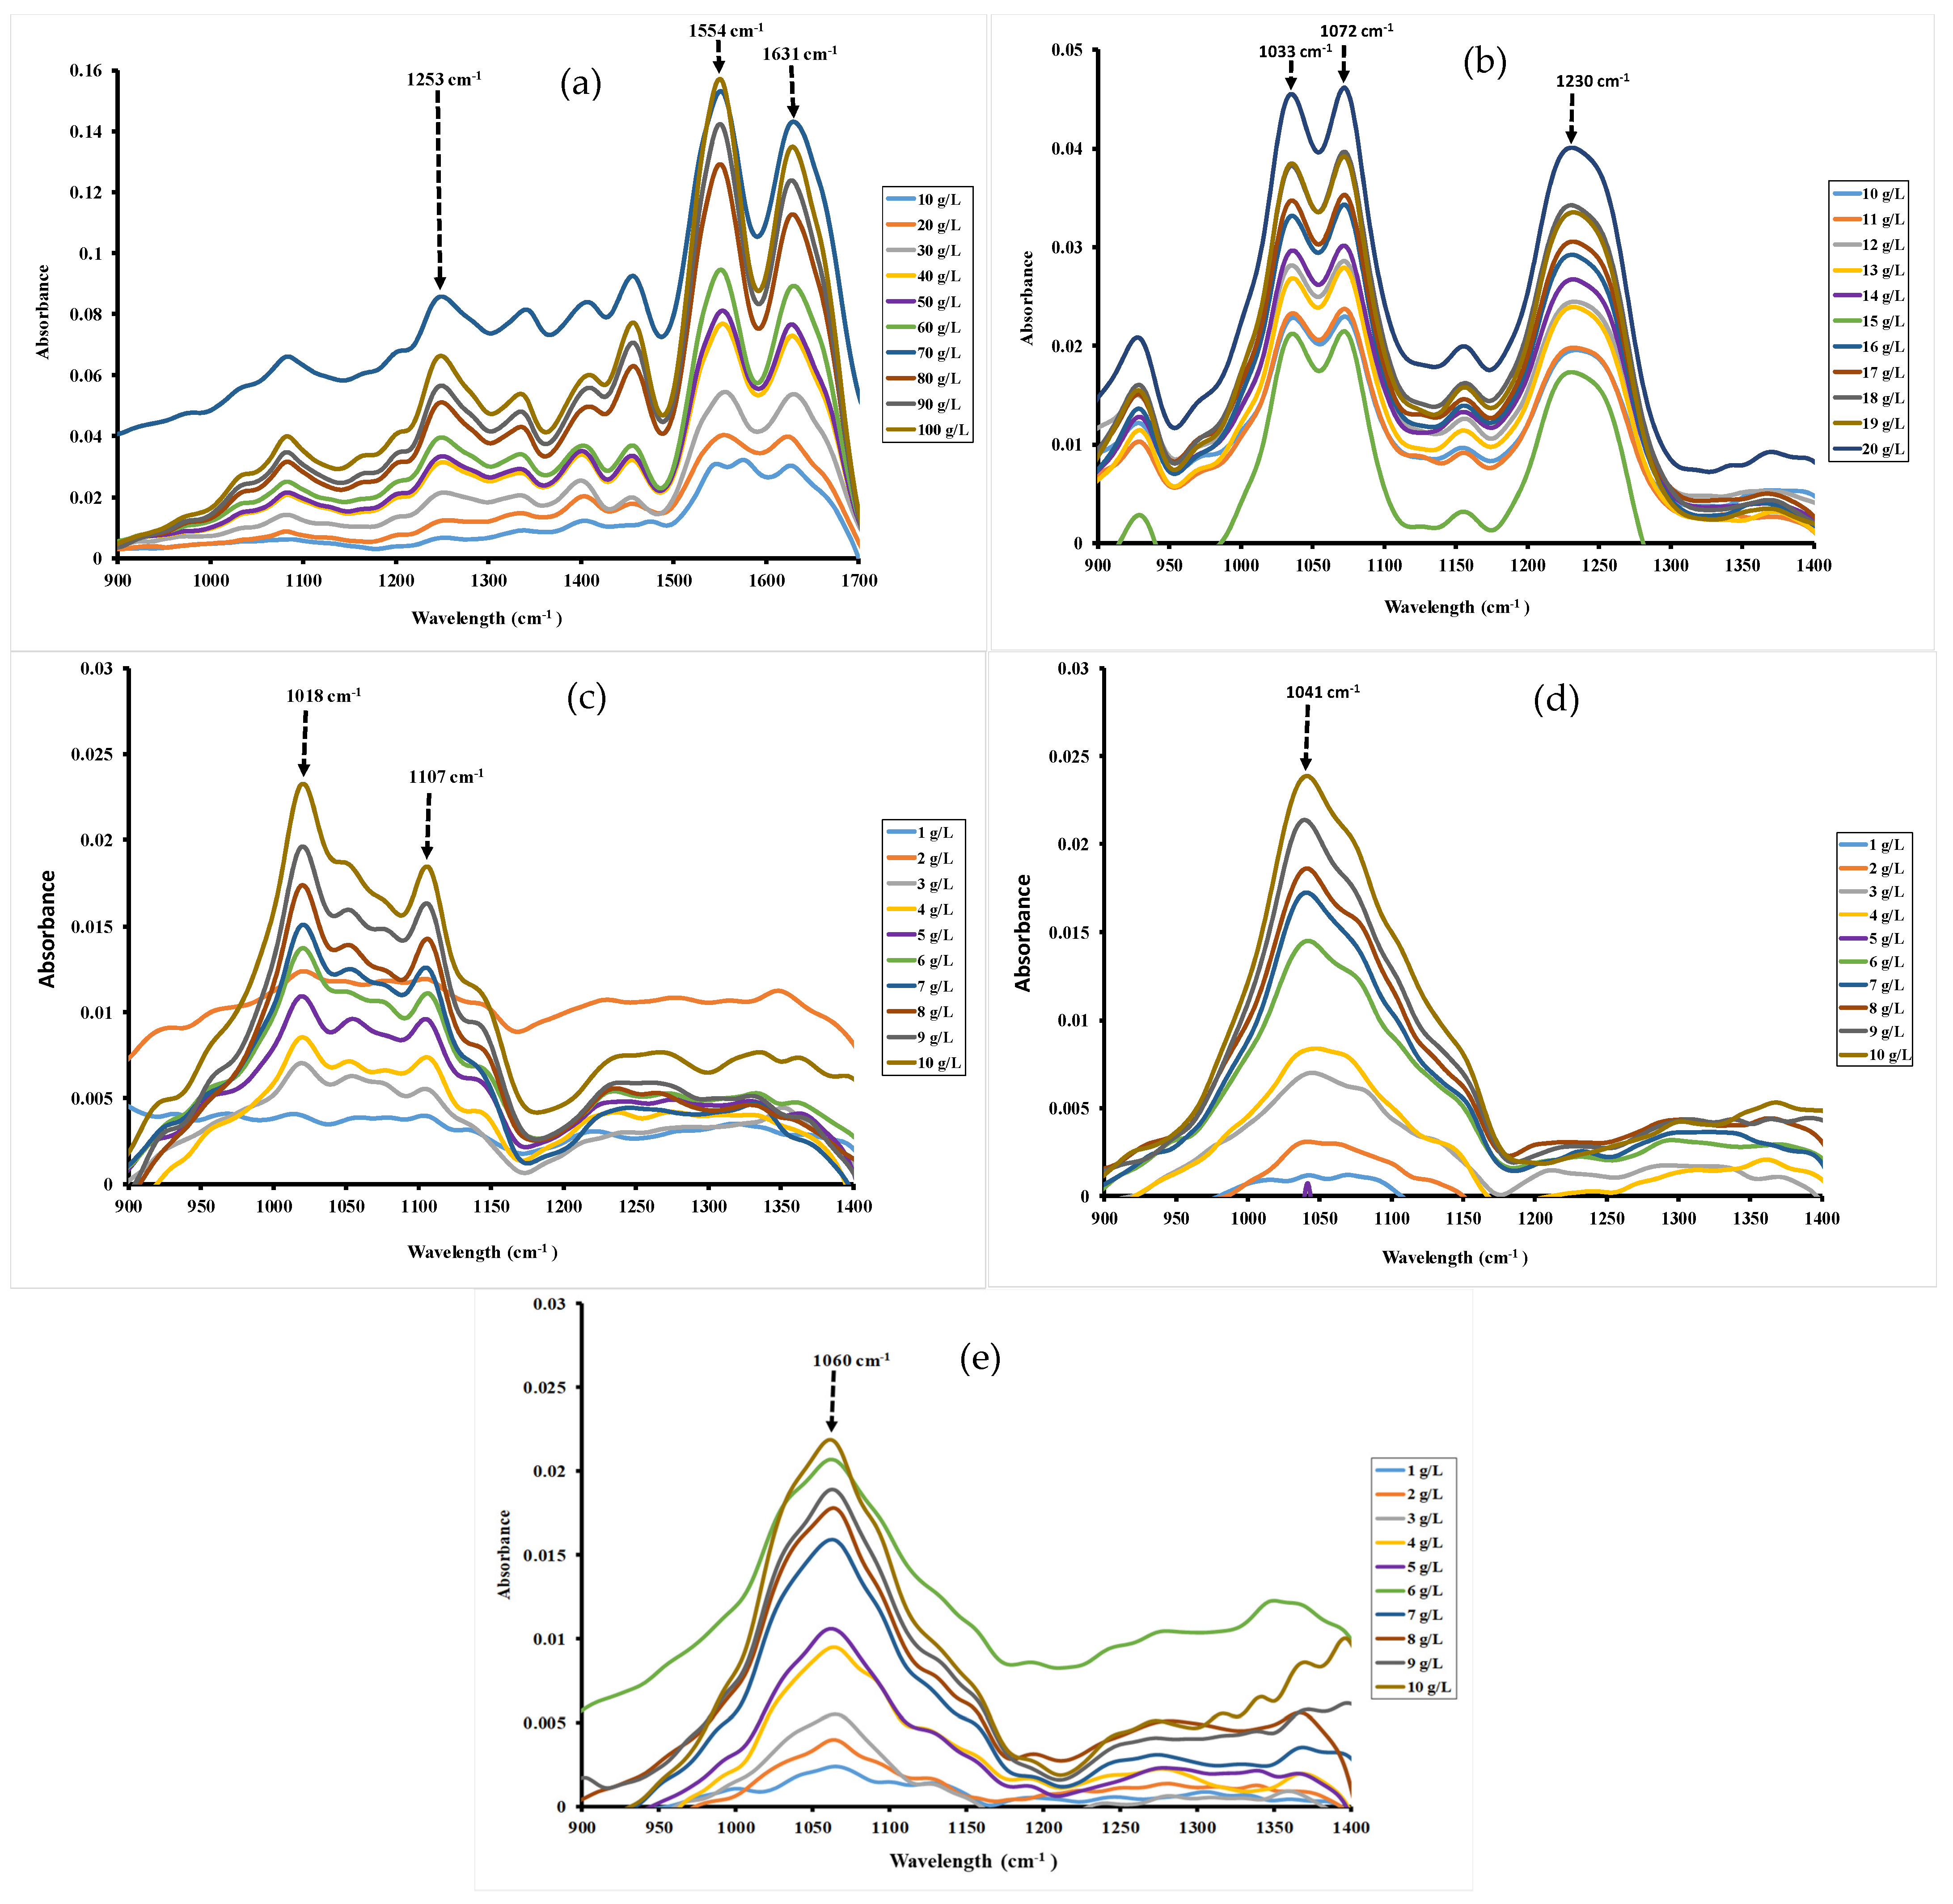
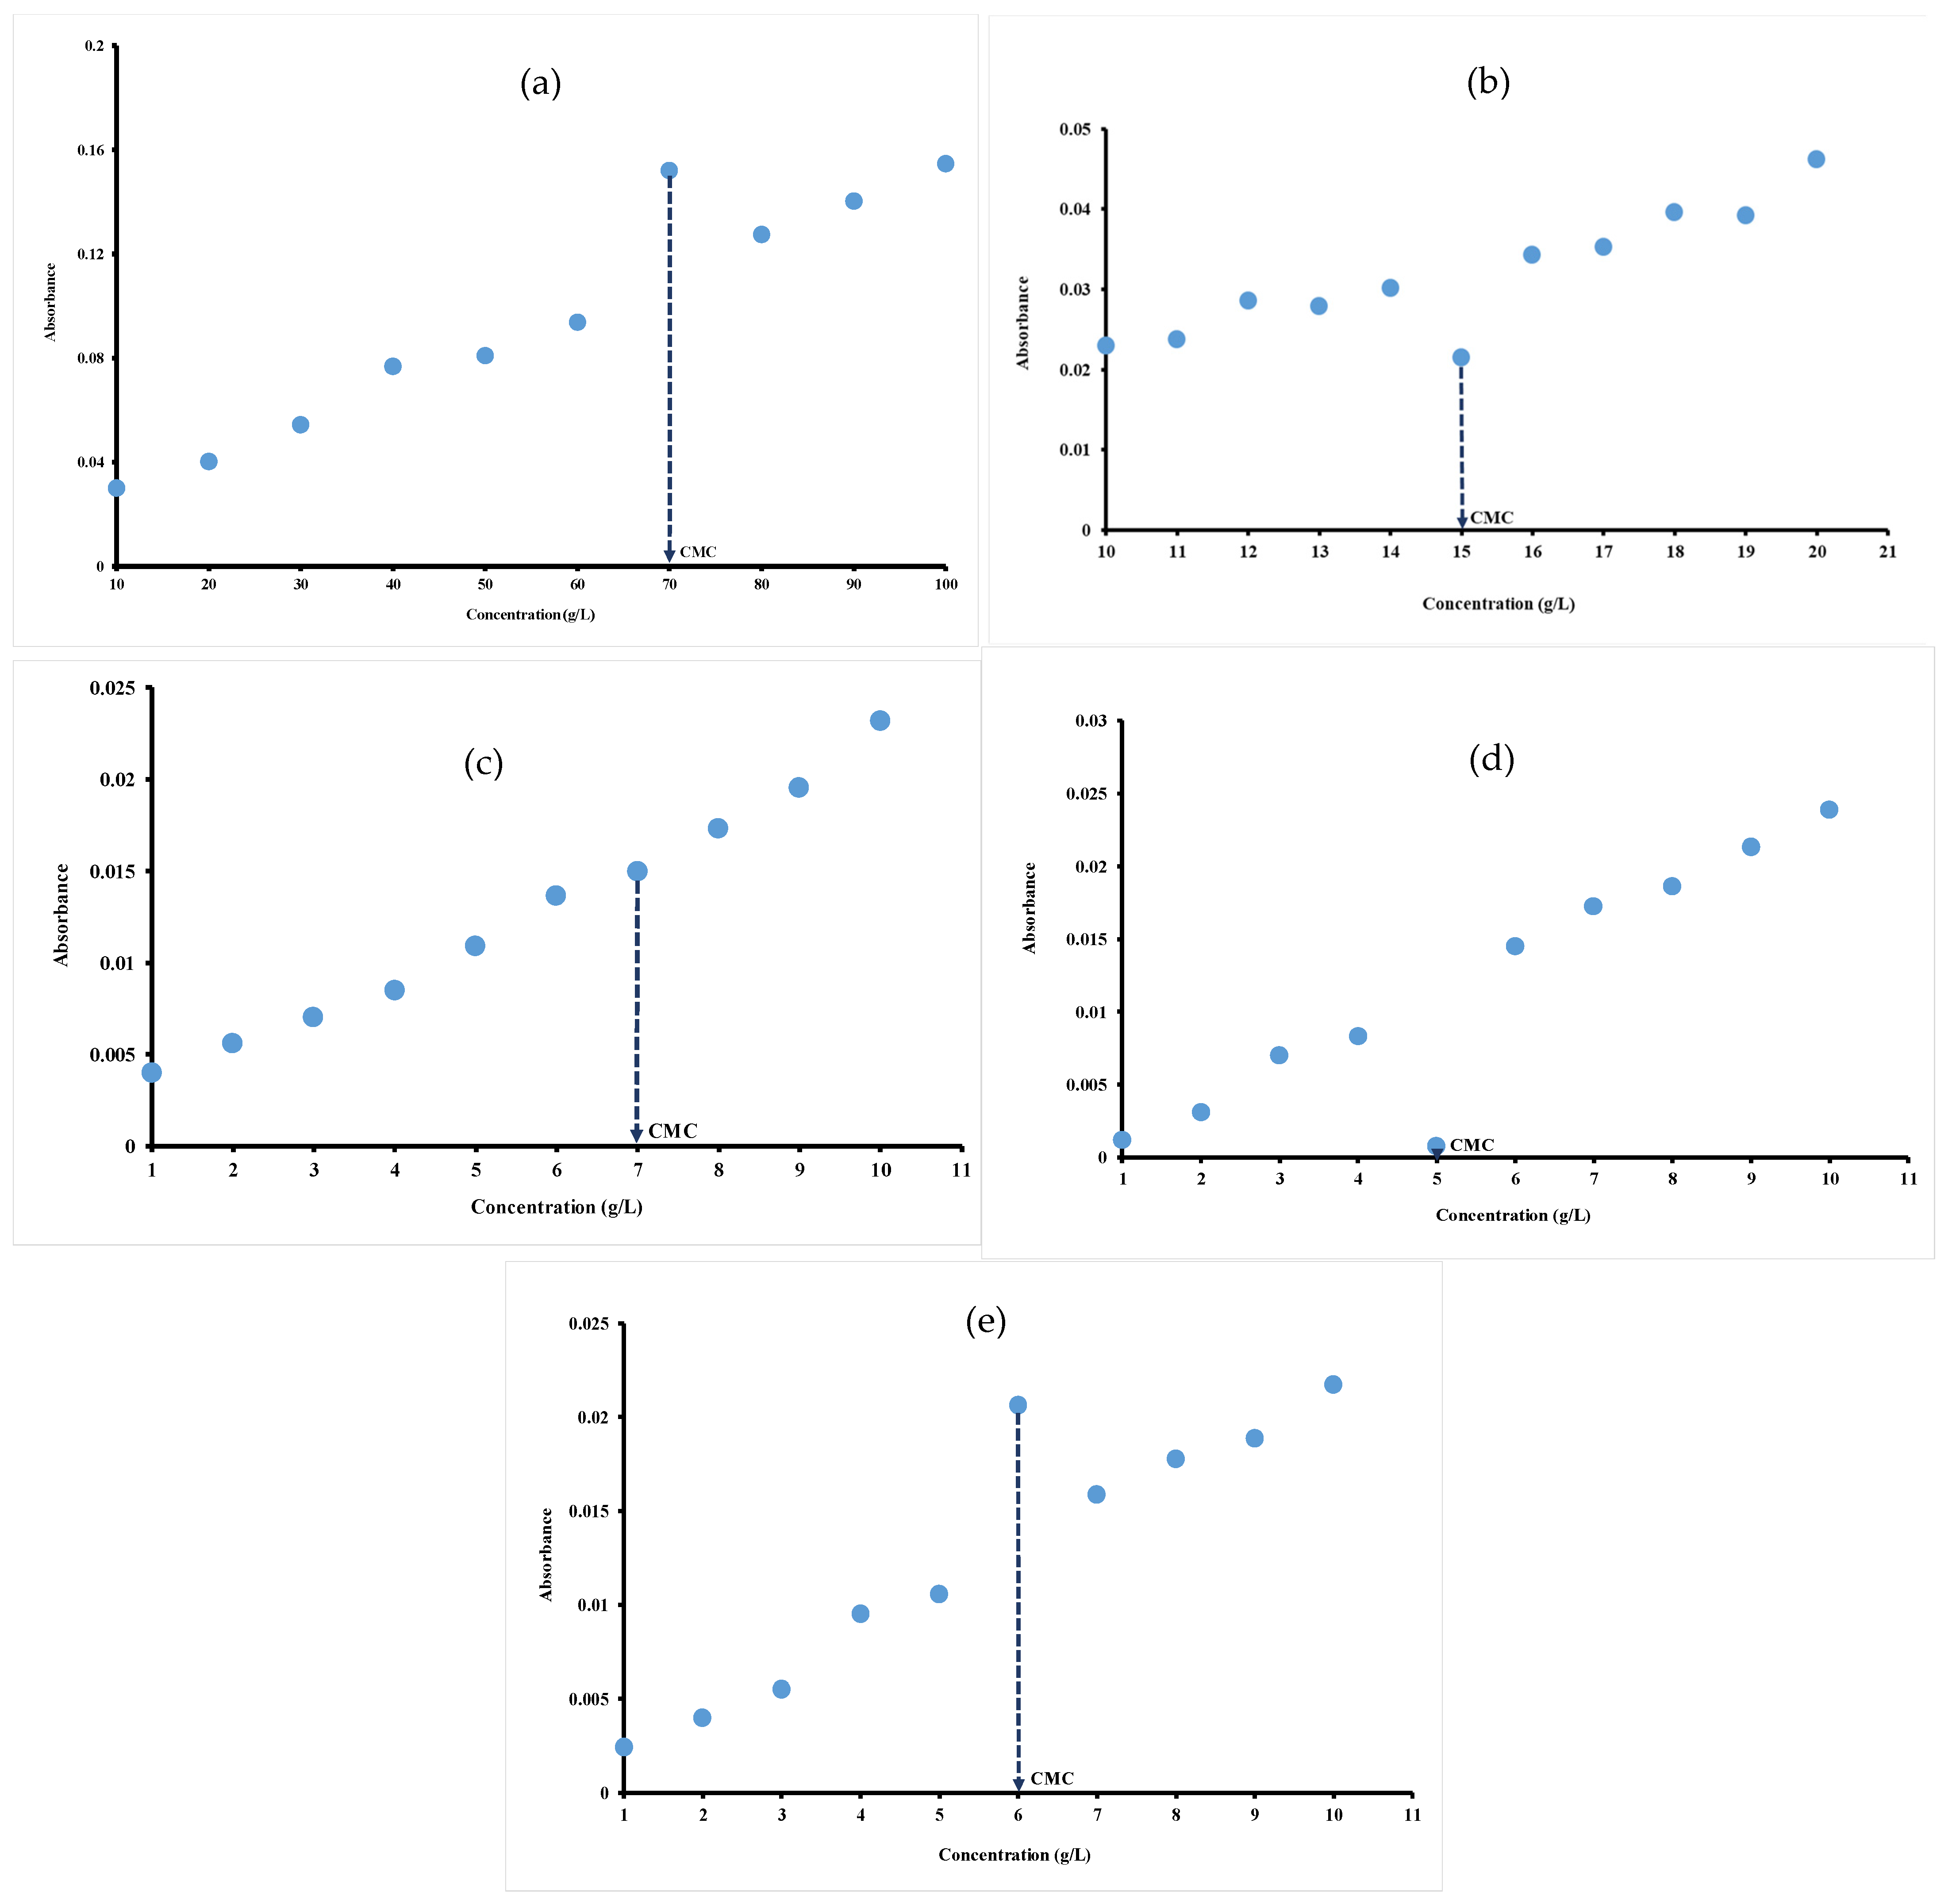
3.1. Mid-Infrared Measurements

Although spectra were scanned between 3000 and 400 cm−1, the studied regions were fixed between 1700–900 cm−1 for gelatin and 1400–900 cm−1 for ι-carrageenan, pectin, gellan gum and xanthan gum. Indeed, outside these spectral regions, no peak was observed for these hydrocolloids. The characteristic bands between 1300 and 800 cm−1 were ascribed generally to the fingerprints region of polysaccharide, while bands between 1500 and 1700 cm−1 can be assigned to protein structures [20,36].
FT-MIR absorption spectrum and band assignment of gelatin are indicated in Figure 1a. Spectra of gelatin showed the major peaks in Amide region, revealing footprints of gelatin. The vibration peaks at 1631 cm−1, 1554 cm−1 and 1253 cm−1 are assigned, respectively, to Amide I, Amide II and Amide III [21]. These bands correspond to those obtained by Haghighi et al. [37], which were observed at 1631 cm−1 (Amide I), 1545 cm−1 (Amide II) and 1245 cm−1 (Amide III). Other authors, such as Almeida et al. [20], found the same findings, ascribing the bands at the following wavenumbers 1652.01, 1539.87 and 1241.29 cm−1 to Amide I, Amide II and Amide III, respectively. The peaks at 1342 and 1458 cm−1 can be assigned, respectively, to CH2 bending and wagging vibrations, while that at 1053 cm−1 corresponds to CH3 group. Ibrahim et al. depicted vibrations for CH2 bending and wagging at 1452 and 1337 cm−1, respectively, and CH3 group at 1031 cm−1 [38].
The infrared spectra of ι-carrageenan (Figure 1b) showed the characteristic bands around 929, 1033, 1072, 1141, 1172 and 1230 cm−1, which were allocated to the footprints of polysaccharides like ι-carrageenan. The asymmetric O=S=O stretching vibration of the sulfate group (O=S=O) was observed at 1230 cm−1 [39]. The signal at 1148 cm−1 was attributed to C-O glycosidic band vibrations, whereas the strong absorption band at 1029 cm−1 was attributed to the carbohydrate stretching vibrations. The weak signal near 929 cm−1 was ascribed to the vibration C-O-C bridge in 3,6-anhydro-D-galactose [40].
The FT-MIR spectra profile of pectin from citrus presented the peaks from 1150 to 950 cm−1, observed with sharps at 1018 and 1107 cm−1 (Figure 1c). Li et al. reported that peaks between 1148 and 1005 cm−1 are attributed to C-OH, C-O-C and C-C stretching vibrations and are indicative of the presence of a pyranose in the pectin structures [22]. Pan et al. [41] had also previously reported peaks between 1152 and 1020 cm−1 for these same functional groups in pumpkin pectin.
The spectra of gellan gum, as depicted in Figure 1d, exhibited an intense band from 1180 to 950 cm−1 with a sharp at 1041 cm−1 that was attributed to C-O bonds of C-OH groups in carbohydrates [27,28].
Regarding xanthan gum, the FT-MIR spectra (Figure 1e) exhibited an intense absorption band from 1160 to 900 cm−1 with a sharp at 1060 cm−1. This intense absorption of xanthan gum in this spectral region is attributed to the axial deformation of C-O as reported by others [23]. However, the sharp peak at 1060 cm−1 can be ascribed to acetyl groups as reported by Da Silva et al. [42] (1049 cm−1) and Niknezhad et al. [43] (1065 cm−1).
The FT-MIR approach used to determine the CMC of hydrocolloids is based on plotting the absorbance of all the major peaks ( A T ) against hydrocolloid concentrations at specific wavelength. Figure 1 illustrated MIR spectra of hydrocolloid solutions as a function of the specific spectral region. As illustrated in Figure 1, increasing hydrocolloid concentrations (from 10 to 100 g/L for gelatin, 10 to 20 g/L for ι-carrageenan and 1 to 10 g/L for pectin, gellan gum and xanthan gum) induced a blue shift in the maximum absorbance of specific bands. Indeed, the blue shift was observed with increasing hydrocolloid concentration, resulting in a shift in the absorption bands from 1573.91 to 1550.76 cm−1 for gelatin, from 1022.27 to 1018.41 cm−1 for pectin, from 1068.56 to 1041.56 cm−1 for gellan gum, and from 1064.70 to 1060.84 cm−1 for xanthan gum (Figure 1). This phenomenon could be attributed to the incorporation of functional groups, such as amines in the case of gelatin, within the hydrophobic environment of the micelles, thus reducing interactions with the aqueous medium. These changes indicate modification at the molecular level that could be due to the formation of micelles as reported previously by Becherová et al. [31].
For the investigated hydrocolloids, CMC values are determined at a wavelength of 1554 cm−1, 1072 cm−1, 1018 cm−1, 1041 cm−1 and 1060 cm−1 respectively for gelatin (Figure 2a), ι-carrageenan (Figure 2b), pectin (Figure 2c), gellan gum (Figure 2d) and xanthan gum (Figure 2e) by plotting the absorbance of all the major peaks ( A T ) against hydrocolloid concentrations. In fact, there are an abrupt change in the absorbance of hydrocolloid solutions characterized by a sudden increase or decrease in the absorbance. This abrupt change in the absorbance indicate deep modifications in the properties of the hydrocolloid solution affecting the shape of FT-MIR spectra. In fact, the changes correspond to the process of micelle formation and the concentration at which this interruption occurs correspond to the CMC. The abrupt interruption of absorption observed in hydrocolloid solutions is mainly attributed to the formation of micelles when the concentration exceeds the CMC. This phenomenon is the result of molecular mechanisms like hydrogen bonds modification, self-aggregation of molecules and structural reorganization of molecules [30,31].
In fact, the change in the FT-IR absorption is due to the deformation of N-H in the Amide group for gelatin, the asymmetric O=S=O stretching vibration of the sulfate group for iota-carrageenan, the C-OH, C-O-C and C-C stretching vibrations for pectin, the C-O bonds of C-OH groups for gellan gum and the axial deformation of C-O for xanthan gum [22,23,28,37,39]. The different observed vibrations profoundly affected the spectral properties of the hydrocolloids investigated in this work [31,44]. The water–water, hydrocolloid–water and hydrocolloid–hydrocolloid interactions influences the solubility of hydrocolloids as well as the values of CMC. Water molecules exhibit an attractive force towards the hydrophilic region of the hydrocolloid molecules while simultaneously exerting a repulsive force against the hydrophobic region [31]. The strong affinity of hydrocolloid molecules for water molecules leads to their rapid solubilization. At low concentrations in aqueous solutions, the interactions between water and hydrocolloid molecules dominate over the interactions among hydrocolloid molecules themselves, resulting in the presence of the hydrocolloid molecules in monomeric form. As the concentration increases, the hydrophobic tails of the hydrocolloid molecules cluster together to minimize their contact with water, while the hydrophilic heads remain oriented outward (in contact with water) due to the dipole moment. Once the CMC is reached, the interaction between the hydrocolloid molecules becomes large enough to promote their aggregation into micelles. The abrupt interruption observed in the absorption is the result of the self-aggregation of hydrocolloid molecules to form micelles (Scheme 1) [31,45].
As illustrated in Figure 2a,e, there are a sudden increase in absorbance at concentrations of 70 g/L and 6 g/L, respectively, for gelatin (Figure 2a) and xanthan gum (Figure 2e) before returning to initial Newtonian rise. The sudden interruption (decrease) occurred at 5 g/L and 15 g/L, respectively, for gellan gum (Figure 2d) and ι-carrageenan (Figure 2b). It can be suggested that these abrupt interruptions occurred at the CMC value of hydrocolloid solutions as earlier demonstrated.
The plot of the absorbance of all the major peaks ( A T ) against the pectin concentration also shows a curve with a Newtonian appearance. However, unlike other hydrocolloids, there is no clear breakpoint corresponding to concentrations below and above CMC. Thus, from Figure 2c, based on the equations of the slopes before (y = 0.0019x + 0.0017; R2 = 0.9788) and after (y = 0.0027x − 0.0039; R2 = 0.9851), the inflection point made it possible to determine the CMC of pectin. The profile is Newtonian in nature with a slight interruption at the concentration of 7 g/L, which can be defined as CMC value of pectin. The observed inflections likely occur at the CMC, reflecting the aggregation of hydrocolloid molecules. The transition from a polar medium to a slightly polar medium could be explained by the presence of an inflection point, as demonstrated above [45]. The CMC values at different wavelengths when the absorbance is plotted as a function of concentration for gelatin (1253 cm−1, 1554 cm−1 and 1631 cm−1), for carrageenan (1033 cm−1, 1072 cm−1 and 1230 cm−1) and for pectin (1018 cm−1 and 1107 cm−1) are compared. CMC values of 70 g/L, 15 g/L and 7 g/L are obtained, respectively, for gelatin, ι-carrageenan and pectin regardless of the wavelength indicating the robustness of FT-MIR method in determining CMC for these hydrocolloids.

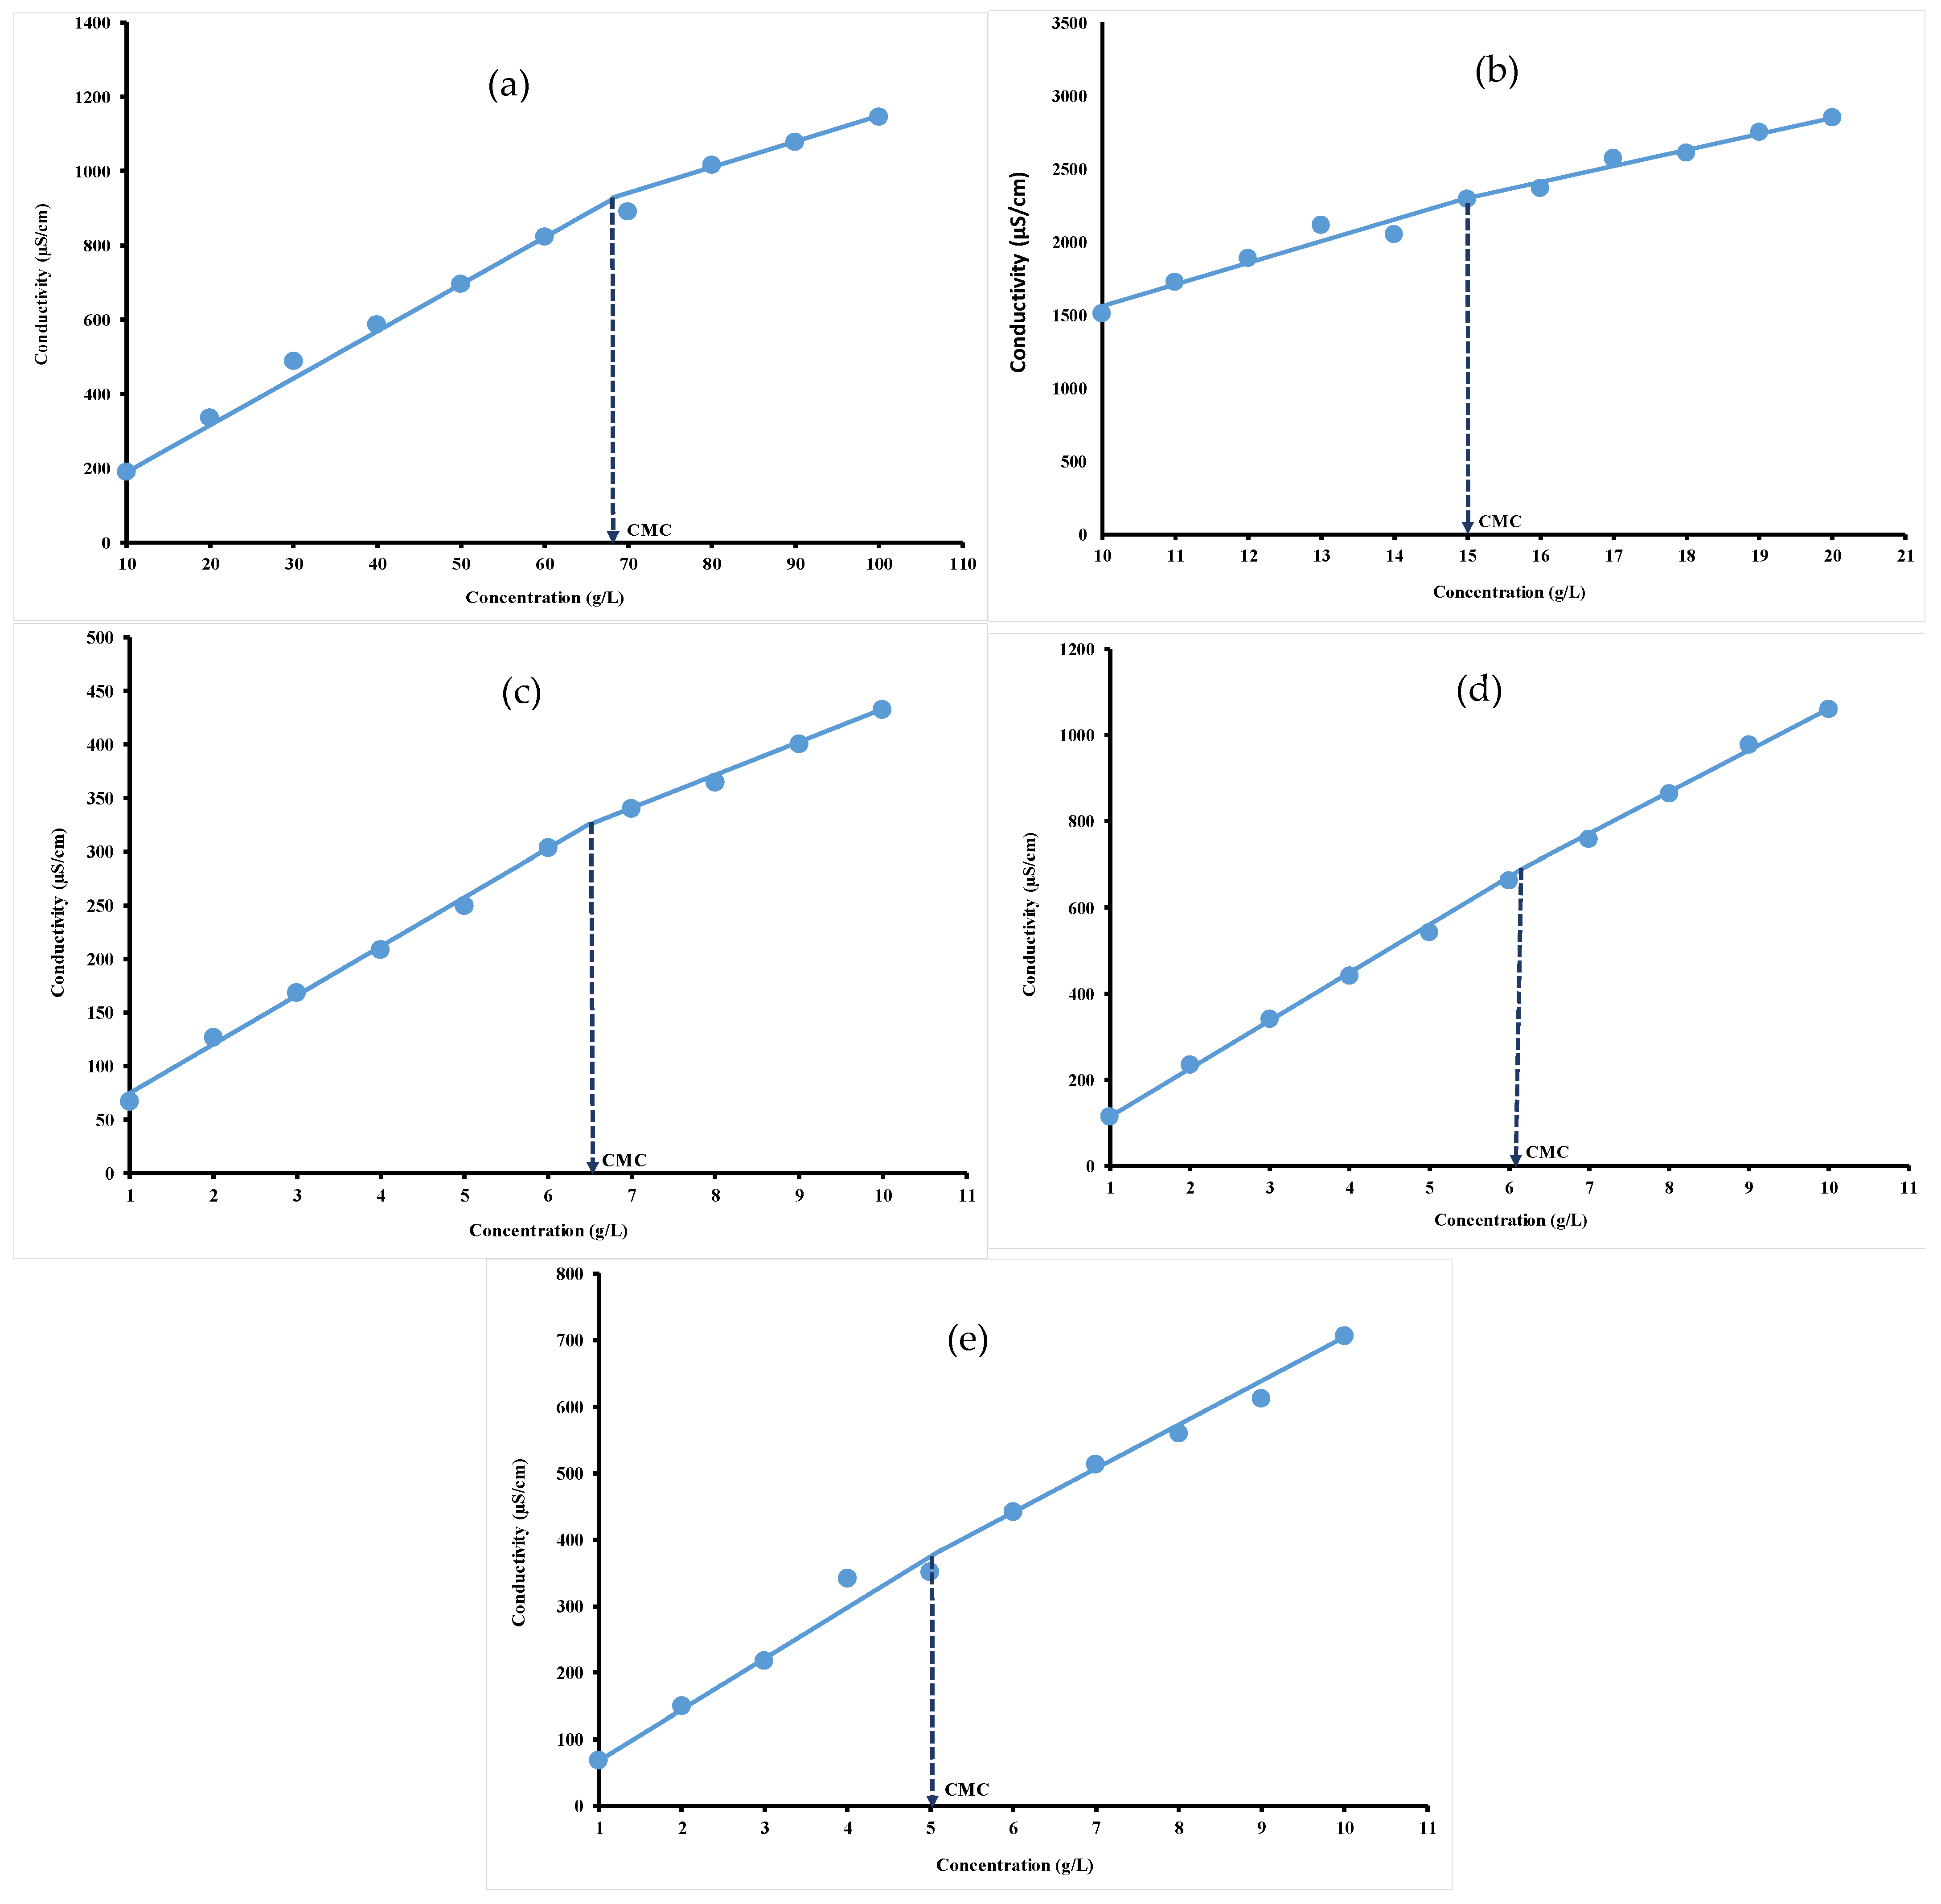
3.2. Conductivity Measurements

The conductivity values increased as a function of concentration, regardless of the hydrocolloid nature, as shown in Figure 3. This could be explained by an increase in the number of free counter-ions in the solution. The intersection point of the plot of conductivity values versus hydrocolloid concentration was used to determine the CMC, as previously depicted by others [8,9]. The CMC plot clearly indicates two linear regions with different slopes ascribed to the monomeric and micellar states of hydrocolloids in solution. Before attaining CMC (greatest slope region), the amount of surfactant is not sufficient enough to form micelles. The hydrocolloids dissolve in water to yield simple monomers. After attaining CMC (lowest slope region), the micelle formation continues and results in an increase in the conductivity but less significantly than in the absence of micelle [46].
For an ideal case, below the CMC, the surfactant molecules are completely dissociated from each other, explaining the linear relationship between concentration and conductivity. Above the CMC, the conductivity remains constant and therefore becomes independent of the surfactant concentration, indicating that any excess anions and cations are in micellar form and therefore the free ion concentration has remained constant [47]. The CMC values were 68.59 g/L, around 15 g/L, 6.53 g/L, 6.16 g/L and 5.08 g/L, respectively, for gelatin (Figure 3a), ι-carrageenan (Figure 3b), pectin (Figure 3c), gellan gum (Figure 3d) and xanthan gum (Figure 3e). The difference in the CMC values for each investigated hydrocolloid could be ascribed to their micellar properties due to the presence of different electrolytes groups [48]. These electrolytes induce changes in the micellization behavior of ionic surfactants that are more pronounced as compared to those of zwitter ionic and nonionics [49]. It appeared that the slope after attaining the CMC is lower than before attaining CMC, indicating that fewer ionic species are present in the solution after CMC, inducing lower conductance values and a decrease in the micelle charge density. These findings are in agreement with those of Banipal et al. [35], who indicated that the increased number of counter ions bound to the micellar surface decreased the degree of micelle ionization.

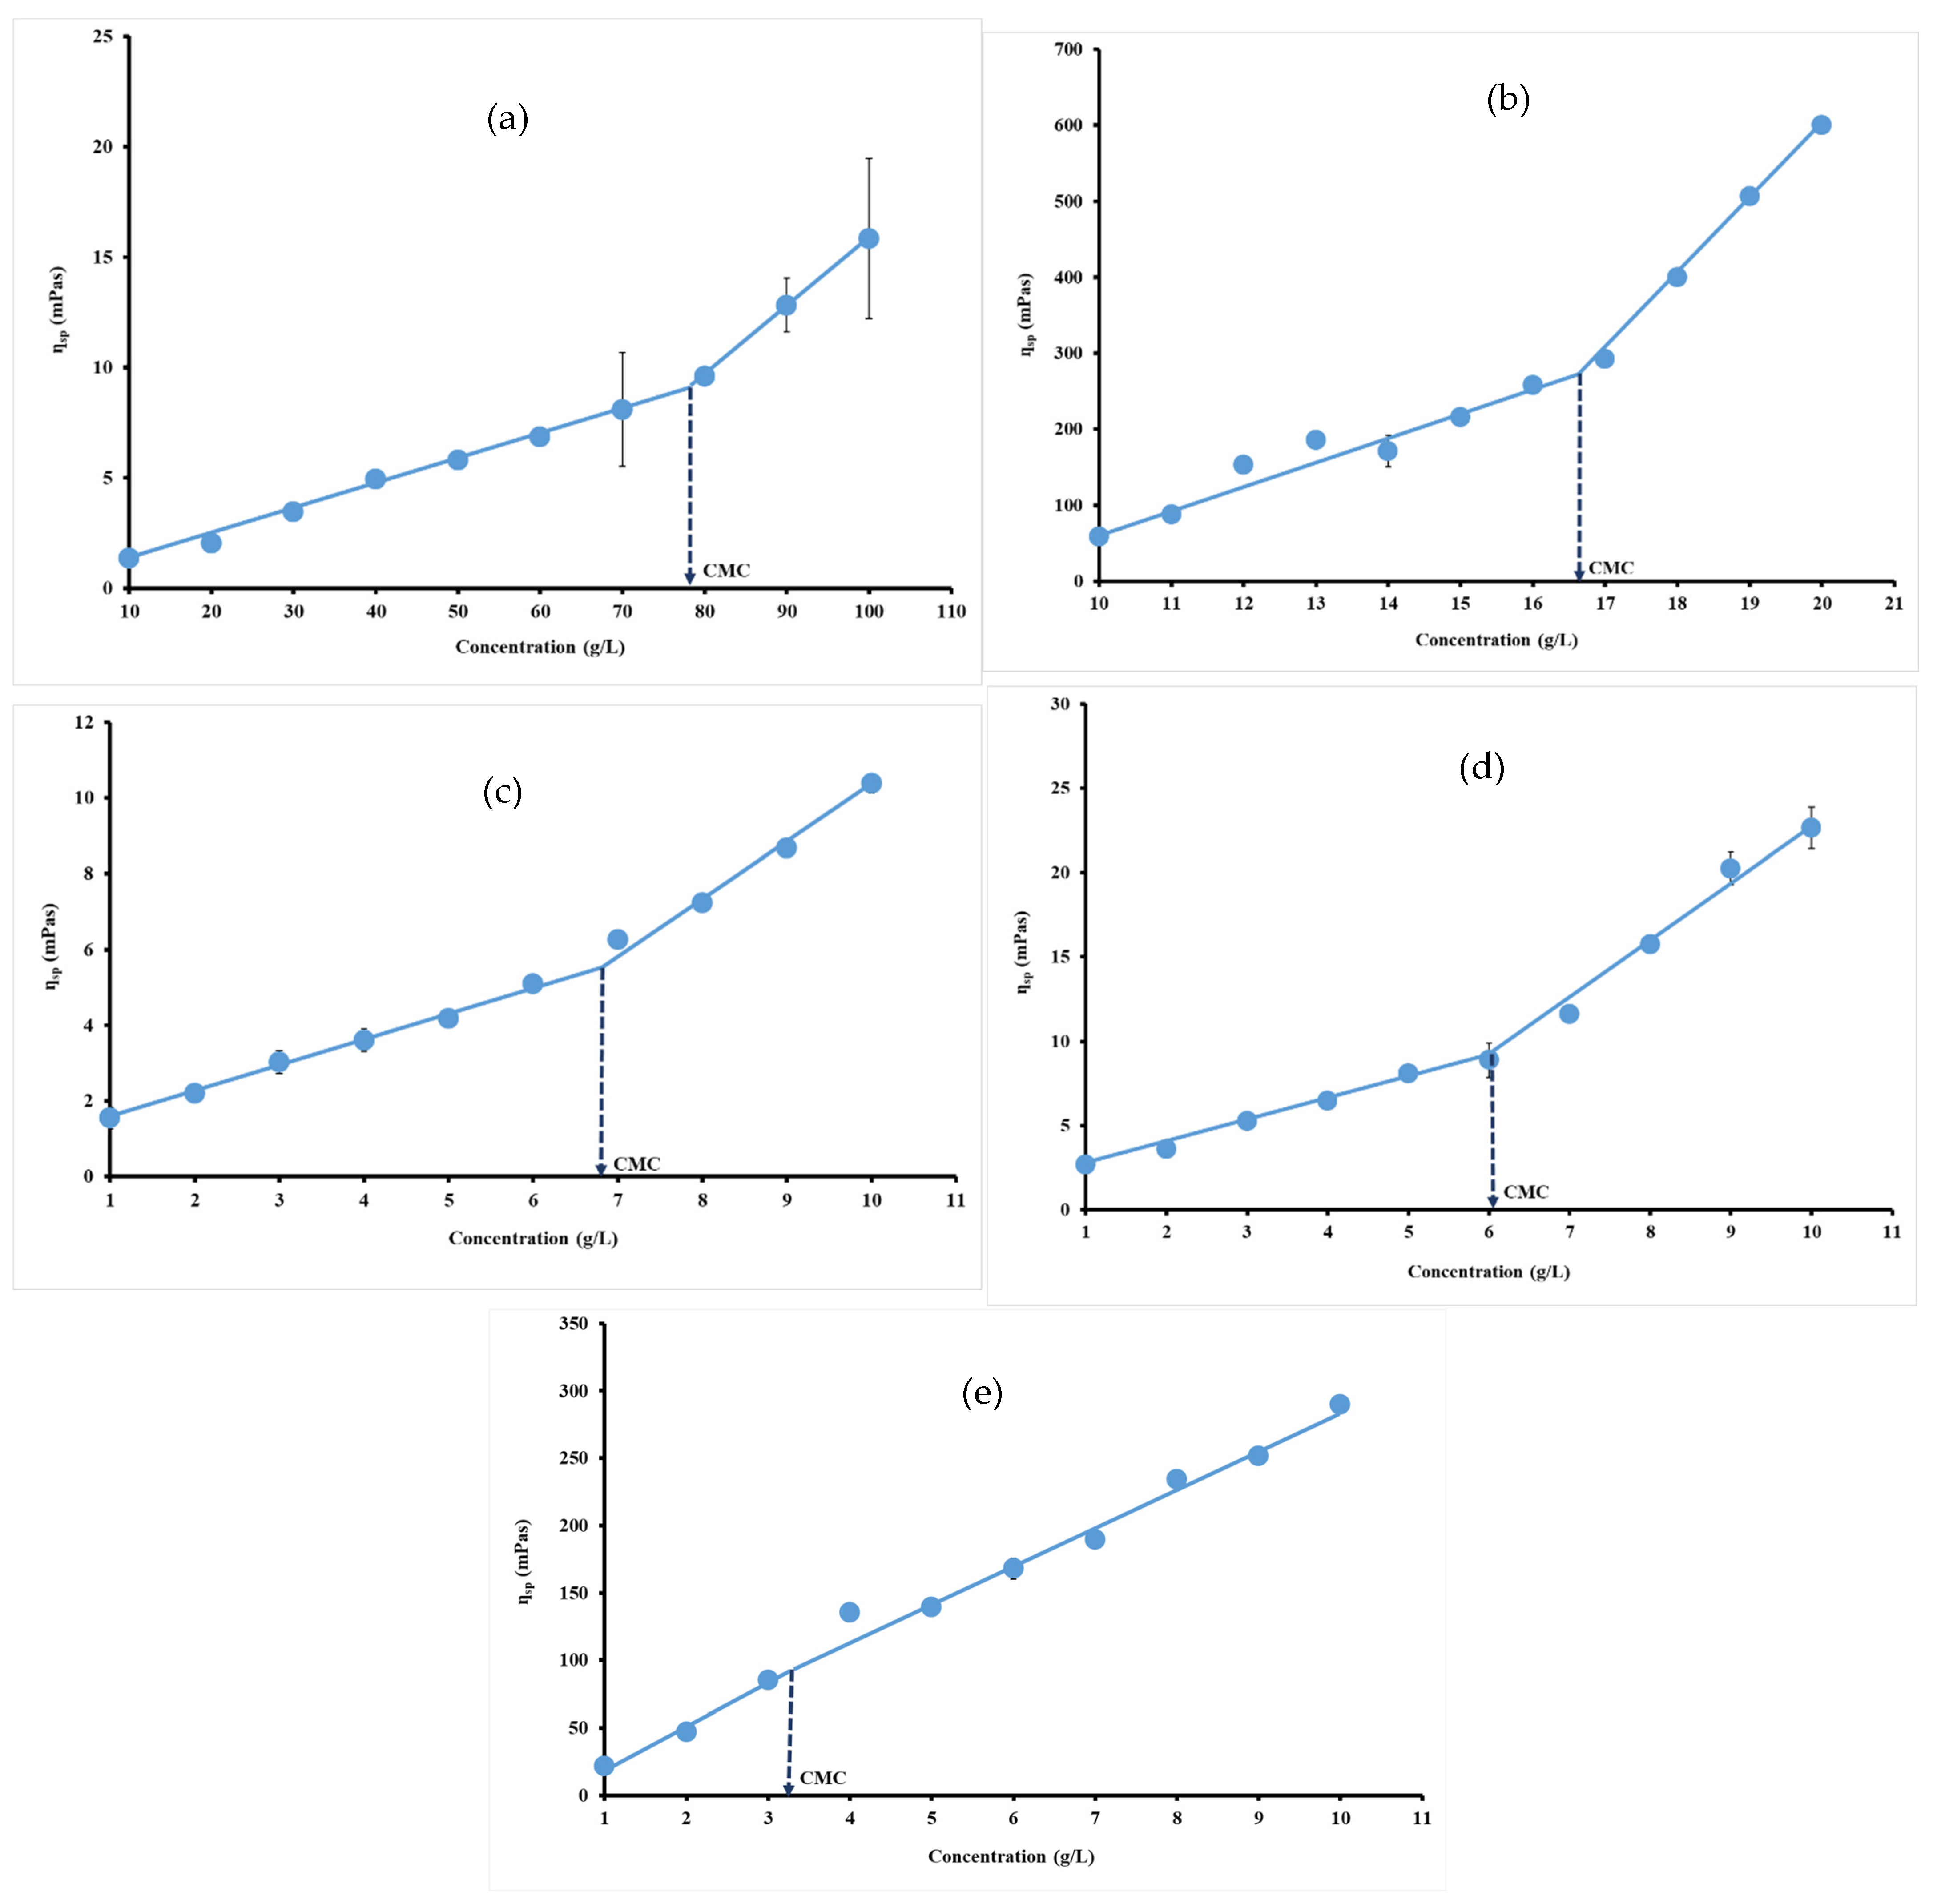
3.3. Viscosity Measurements

Specific viscosity of each hydrocolloid dispersion was calculated at 95.85 s−1, where viscosity remains constant, and plotted versus hydrocolloid concentration. The curves obtained for each hydrocolloid revealed two linear regions due to their non-Newton behavior. The point of intersection of these two linear regions could be defined as the concentration at which individual polymer molecules begin to physically interact [50]. Physical interaction of polymer so-called CMC arises due to the aggregation of hydrophobic groups, which tend to minimize their exposure to water [51]. The change that occurred in specific viscosity reflects those observed in protein or carbohydrate intermolecular forces. In this study, CMC values were 79.15 g/L, around 16.64 g/L, 6.91 g/L, 6.03 g/L and 3.29 g/L, respectively, for gelatin (Figure 4a), ι-carrageenan (Figure 4b), pectin (Figure 4c), gellan gum (Figure 4d) and xanthan gum (Figure 4e).
Xu et al. [28] studied the critical aggregation concentration or overlap concentration (CAC) and CMC of gellan gum (GG). The critical aggregation concentration is defined as the concentration of the transition from the dilute region to the semi-dilute region, which is the concentration point where the molecules in solution start to become permanently entangled with each other, while the CMC value is the lowest concentration required to form a micelle. Xu et al. [28] reported values of 0.15 g/L and 0.72 g/L for CAC and CMC, respectively, for gellan gum. The same authors found CACs of 0.24 g/L, 0.12 g/L, and 2.90 g/L for, respectively, for welan gum (WG), diutan gum (DG) and deacylated gellan gum (GG). They conclude that polysaccharide molecules with longer side chains have a lower CAC, which indicates that polysaccharide molecules with long side chains are easier to aggregate together. Moreover, hydrocolloids with low CAC or CMC are likely to rapidly entangle with each other to form micelles as which agrees with our results [5,28]. Wang et al. [52] are reported the overlap concentration for xanthan gum and waxy corn starch. CAC values are 0.65 g/L and 65 g/L, respectively, for xanthan gum and waxy corn starch. The CMC value reported by Wang et al. [52] depicted CMC values of 0.65 g/L for xanthan gum in 90% dimethyle sulfoxide (DMSO) and 10% distilled water (v/v).
These results suggest that the hydrophobic tails of polymers in dilute solutions are associated intra-molecularly in order to minimize contact with water. For this reason, after certain concentration the polymer chains probably start to curl and shrink.

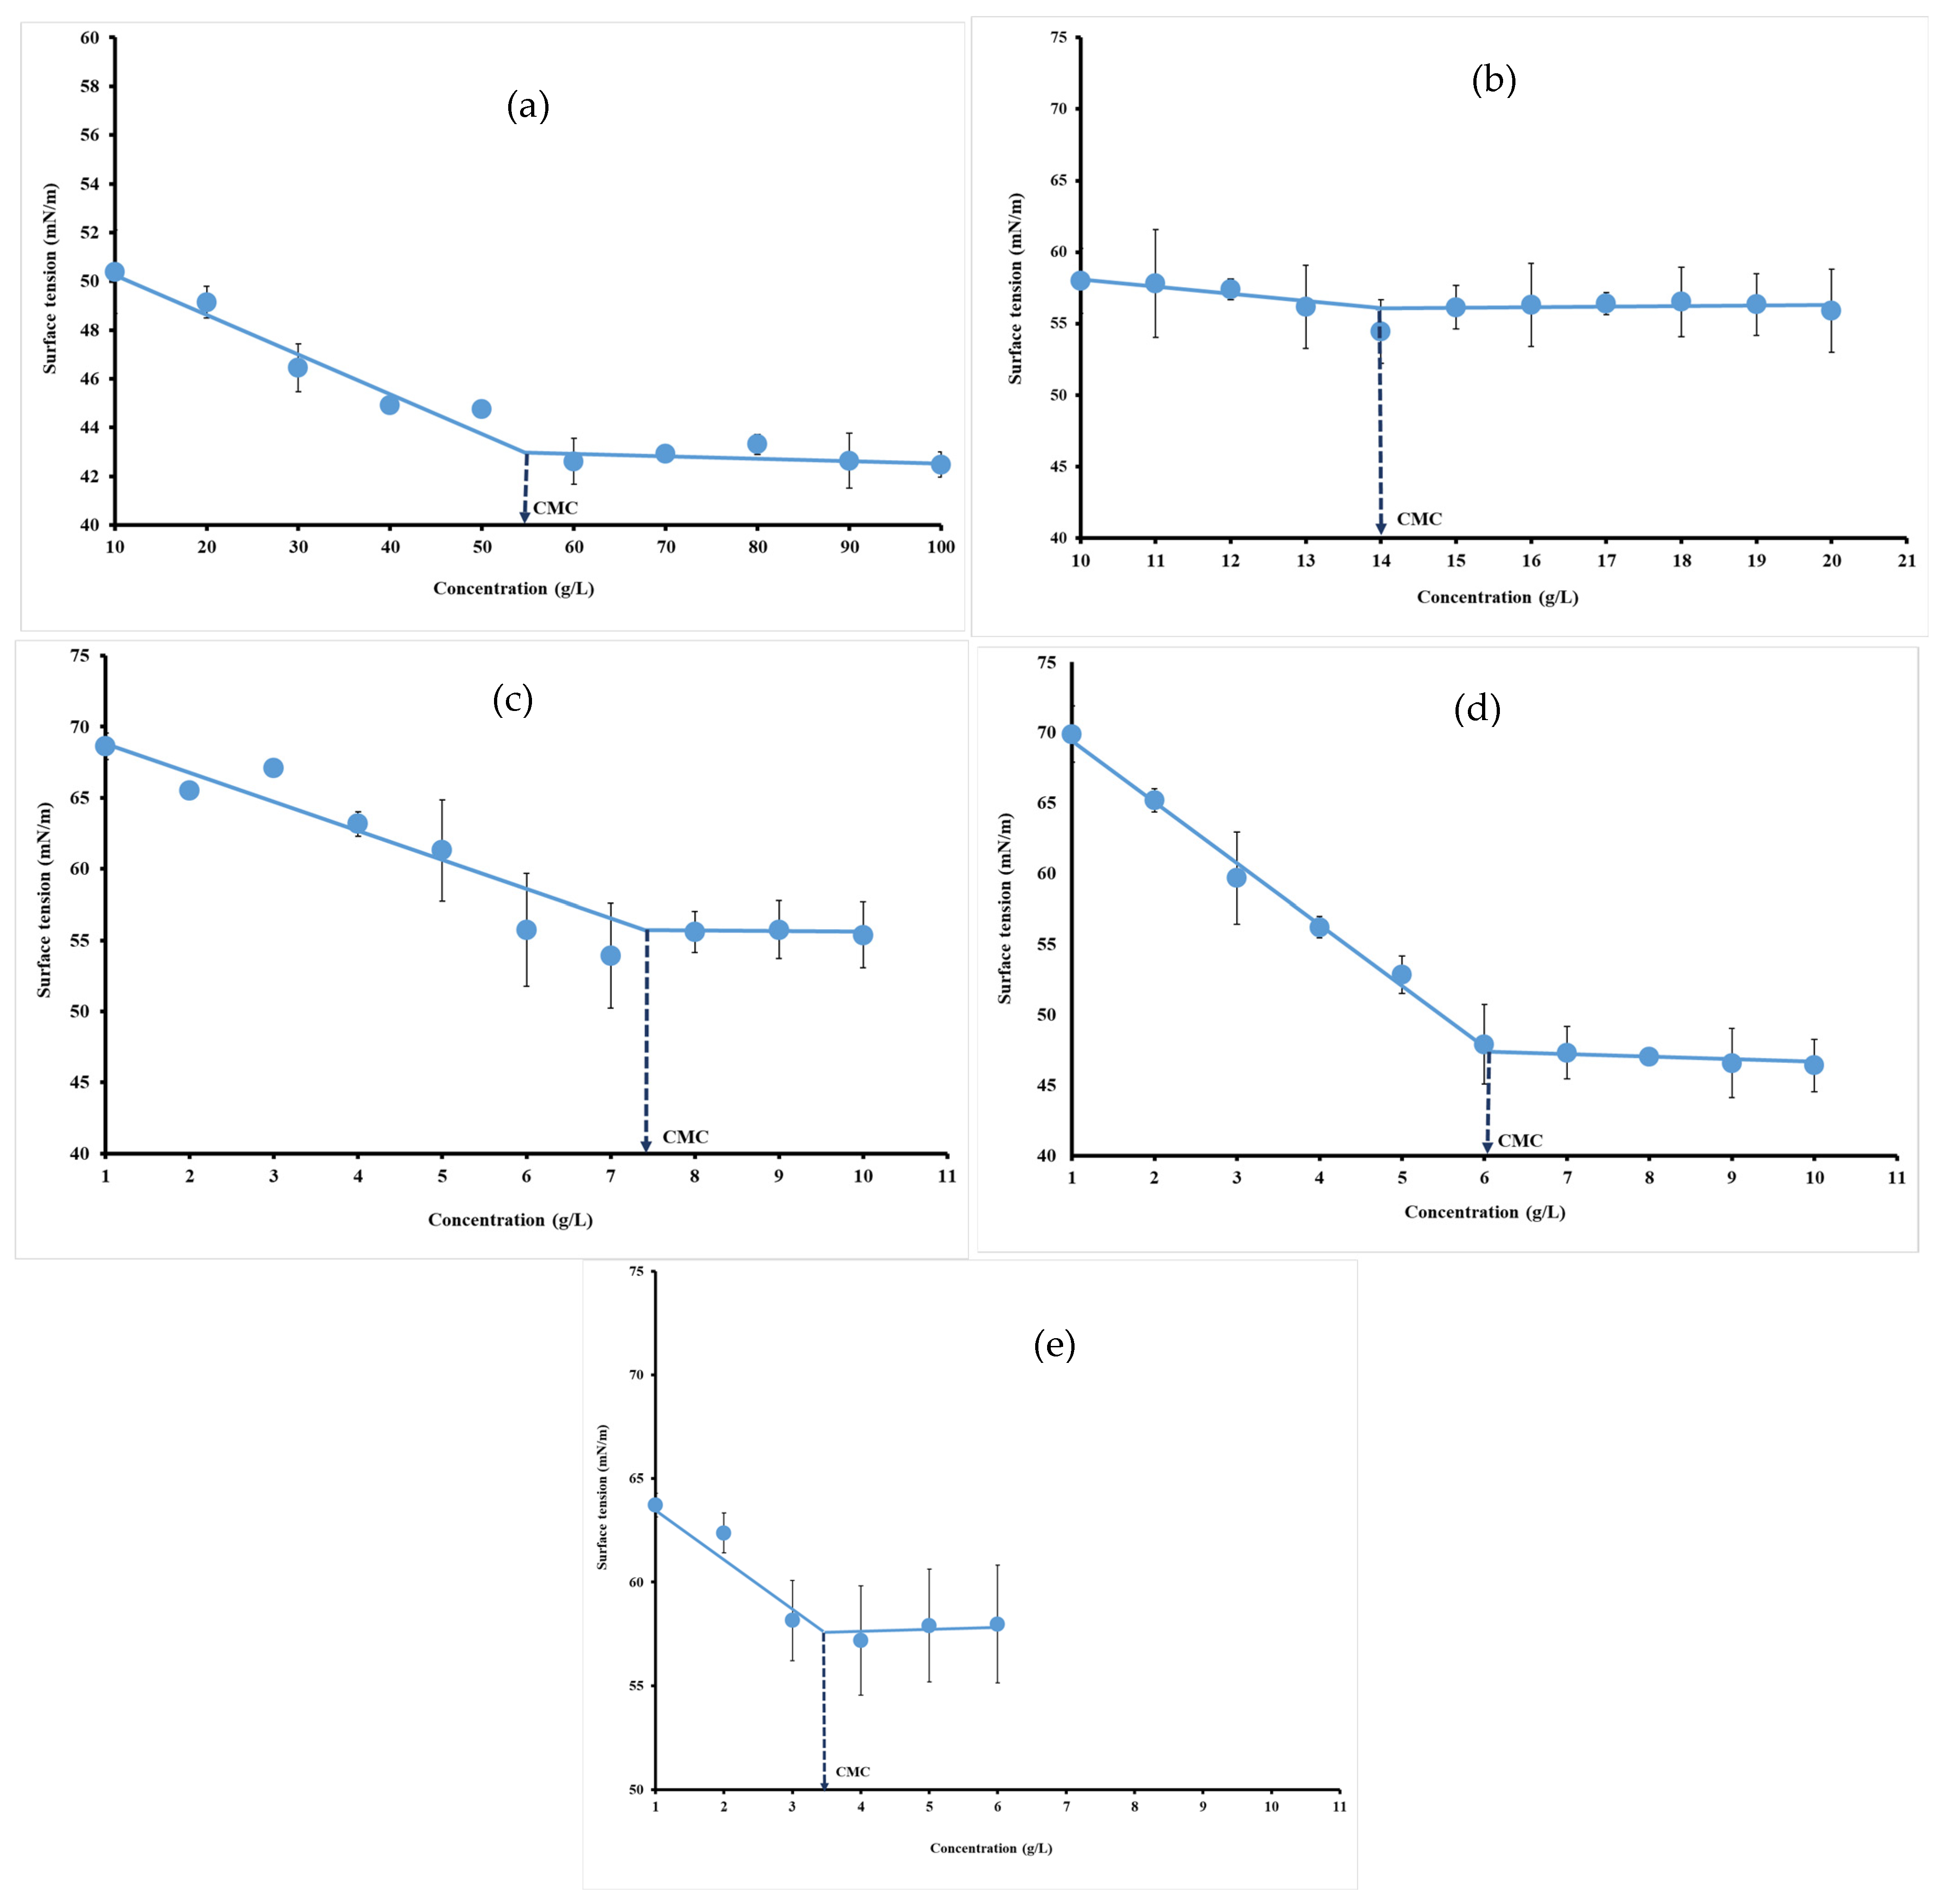
3.4. Surface Tension Measurements

Surface tension measurement is a method to study surfactant micellization and possible interactions in solution. Below the CMC, surface tension strongly decreases, while surfactant concentration increases. After reaching the CMC, surface tension remains constant. Therefore, the CMC can be determined as the concentration after which surface tension does not change. The CMC was obtained from a sharp break in curves versus hydrocolloid concentrations. The neat change in the slope of surface tension raw data can be used for the estimation of CMC as depicted by Perinelli et al. [9] and Banipal et al. [35]. The CMC of hydrocolloid dispersion was presented in Figure 3. The decrease in the surface tension values as a function of concentrations indicated that hydrocolloids exhibited surface-active properties. Increasing the hydrocolloid concentration substantially reduced the surface tension from 72 mN/m to 43.72 mN/m (Figure 5a), 54.46 mN/m (Figure 5b), 53.76 mN/m (Figure 5c), 46.02 mN/m (Figure 5d) and 56.93 mN/m (Figure 5e), respectively, for gelatin (55.16 g/L), ι-carrageenan (14 g/L), pectin (7.46 g/L), gellan gum (6.04 g/L) and xanthan gum (3.48 g/L).
These stabilized surface tension values are noted as self-aggregation of surfactant molecules to form micelles. These findings are in accordance with the results reported by previous investigations reporting that gelatin, pectin, octenyl succinate (OSA) modified starches, gum arabic, sodium dodecyl sulfate (SDS) reduced the surface tension [53,54]. Surfactants are capable of forming relatively strong intermolecular interactions between two immiscible phases, thus leading to a reduction in surface tension. This reduction in surface tension is due to the orientation of the hydrophilic head and the hydrophobic tail of the surfactant molecule towards the water and towards the inside, respectively. At the CMC value, the surface tension remains constant due to the saturation of the interface, and increasing the surfactant concentration leads to aggregation and the formation of micelles [11]. Indeed, the technological performance as an emulsifier of various polysaccharides is usually controlled by their molecular properties (e.g., conformation, polyelectrolyte nature, surface charge density, molecular weight, etc.) and their intra and inter-chain interactions. Several hydrocolloids (e.g., carrageenan, xanthan, gum arabic) can be used as emulsifiers, as they can rapidly adsorb to the interface, reduce the interfacial tension to facilitate droplet disruption and impede droplet aggregation. This is typically attributed to the presence of hydrophobic elements in biopolymer structures, such as proteins, ferulic acids, or acetyl groups [32,55]. Osano et al. reported that proteinaceous moiety, bound to the carbohydrate moiety of the pectin, plays an important role in its adsorption properties, and polysaccharide protein may not be the only driving force for adsorption, but also the polysaccharide itself has surface activity [7].
Other parameters like the surface pressure (Π), the maximum surface excess concentration (Γm), and the minimum surface area per adsorbed molecule (Amin) are important to define the ability of hydrocolloids to reduce the surface tension and adsorb at the oil–water interface, thus enabling emulsion stability. The CMC is of no significance in terms of surfactant packing, which is why it has no effect on Γm. Instead, CMC controls the partition coefficient, which is not between water and surface but between monomers and micelles [56]. So, the ability of an emulsifier to generate and stabilize an emulsion is associated with its interfacial properties at both oil–water and air–water interfaces [57]. Although quantitative differences exist in interfacial behavior at both interfaces, adsorbed layers of active macromolecules present similar general features of both surface tension and surface rheology [58]. Therefore, the interfacial properties of hydrocolloid solutions at the air–water interface were investigated in the present study. The surface pressure ( Π C M C ) of each hydrocolloid, which is the surfactant’s ability to reduce the surface tension in water, is calculated.
The value of surface pressure at CMC ( Π C M C ) can be calculated by using the following equation [35]
Π C M C = γ 0 γ C M C
where γ 0 is the surface tension of pure water (72 mN/m) and γ C M C is the surface tension at CMC.
Π C M C values (Table 1) for each hydrocolloid are 28.28 mN/m, 17.54 mN/m, 18.24 mN/m, 25.975 mN/m and 15.07 mN/m, respectively, for gelatin, ι-carrageenan, pectin, gellan gum and xanthan gum.
A greater value of Π C M C predicts a better ability for a surfactant to lower the surface tension of a solution [59]. A comparison of the relative tendency of the hydrocolloids in reducing the surface tension shows that the highest surface tension reduction was obtained for the gelatin while the lowest one was noted with xanthan gum. Thus, the higher the surface pressure, the greater the ability of the hydrocolloid to reduce surface tension and its surface activity.
In fact, polysaccharides are mostly known as texturizing and stabilizing agents; however, they can act as emulsifiers due to the hydrophobic groups or proteinaceous moieties associated with them. Our results with xanthan gum surface activity showed that the surface tension remained constant at 3.48 g/L (CMC value) compared to those reported by Benichou et al. [60] (10 g/L). The ability of ultrahigh methoxylated pectin (UHMP) and sugar beet pectin (SBP) to reduce surface tension was evaluated by Liu et al. [61]. These pectins significantly reduce surface tension from 73 mN/m to 55–60 mN/m when the pectin concentration is increased to 1 g/L, and the most obvious reduction occurred at 0.4–0.6 g/L. Subsequently, the profiles tended to flatten at 0.8 g/L for ultrahigh methoxylated pectin and 1.0 g/L for sugar beet pectin, which represent CMC values for both pectins.
Castellani et al. [62] have shown the ability of different gum arabic (5 g/L) to reduce surface tension. The control gum (conventional) decreased surface tension from 71 mN/m to 57.4 mN/m and the two matured gums (EM1 and EM2) reduced the surface tension from 71 mN/m to 53.7 mN/m [62]. These same authors compared the interfacial properties of Gatti gum and sugar beet pectin. These results show that the protein reduces surface tension better than Gatti gum at a concentration of 0.5 g/L. The results of these authors and those obtained in this study effectively prove that polysaccharides can reduce surface tension, which gives them the capacity to adsorb at the air–water and/or oil–water interfaces [7,63].
Protein molecules enhanced interfacial pressure more efficiently than polysaccharides, because protein molecules have more opportunities to adsorb at the air–water and/or oil–water interfaces. In fact, Du et al. reported the highest surface pressure with sarcoplasmic proteins (SPs) rather than with xanthan gum (XG) and concluded that xanthan gum could not generate competitive adsorption with sarcoplasmic proteins due to its nature as a non-adsorbed polysaccharide [64].
However, the association of protein and polysaccharide molecules improves the performance of protein molecules in increasing the interface pressure, as reported by Cai et al. [65] and Zhao et al. [66] in walnut protein/xanthan gum and sodium caseinate/flaxseed gum mixture systems, respectively. It means that polysaccharide can act as a surface active agent but reduce surface tension less than protein [6,60].
The maximum surface excess concentration per unit area ( Γ m ) can be calculated for each hydrocolloid in water used Gibbs adsorption equation [60]
Γ m = 1 R T d γ C M C d l n C
where γ C M C is surface tension at CMC, CMC is the critical micelle concentration, R is the perfect gas constant (8.314 J/mol K) and T (313.15 K) is the temperature.
This parameter relates the adsorbed surface density to the bulk surfactant concentration. The absorbed surfactant monolayer represents a two-dimensional lattice in which the total number of sites represents the maximum number of surfactant molecules that can geometrically fit on the surface [67].
As can be seen from Table 1, Γ m values are 63.6 nmol/m2, 100 nmol/m2, 34.86 nmol/m2, 11.09 nmol/m2 and 2.32 nmol/m2, respectively, for gelatin, ι-carrageenan, pectin, gellan gum and xanthan gum. The lower surface excess concentration ( Γ m ) value is obtained with xanthan gum and the higher value with ι-carrageenan. The surface excess concentration ( Γ m ) expressed the capability of hydrophobic groups of surfactant to adsorb at the oil-water interface initiatively. The increased spontaneous adsorption of hydrocolloids is depicted by the great increase in Γ m . Moreover, the repulsion effect enhanced the thermodynamic activity of hydrocolloids and led to specific changes in functional properties [64].
The long hydrocarbon chain of the surfactants provides high hydrophobicity in it, making the molecule prefer the air–solution interface over the bulk, making an excess concentration of it at the interface relative to the bulk known as the excess maximum concentration per unit area ( Γ m ) [68].
Γ m (mol/m2) values are further used to calculate the minimum surface area per adsorbed molecule (Amin (m2)) at the air–water interface, using the following equation [59,61]
A m i n = 1 Γ m N A
where N A is the Avogadro’s number.
The minimum surface area per adsorbed molecule of each hydrocolloid in this study is presented in Table 1. The obtained results showed that the minimum surface area per hydrocolloid molecule is 0.036 nm2, 0.023 nm2, 0.066 nm2, 0.21 nm2 and 0.99 nm2, respectively, for gelatin, ι-Carrageenan, pectin, gellan gum and xanthan gum (Table 1). The minimum surface area indicates the minimum surface occupied by each surfactant molecule. In the surfactant monolayer formed as a result of interfacial adsorption, attractive electrostatic or hydrophobic interactions occur in tightly packed layers that can be different depending on the interacting surfactant molecules. According to Banipal et al. [35], steric interactions caused by the presence of certain bulky groups in the reacting surfactant molecules may contribute to the higher Amin values. This could explain the differences in Amin for the studied hydrocolloids in the present work.
Overall, the results presented high values of Γ m and low Amin values for protein (gelatin), while low Γ m values and high Amin values are generally obtained for polysaccharides, as reported by Bai et al. [33] and Bouyer et al. [32]. Bai et al. [33] reported surface excess concentration of 352 mg/m2, 31 mg/m2 and 4.5 mg/m2, respectively, for corn fiber gum, gum arabic and beet pectin. Moreover, Liu et al. [61] reported surface excess concentration of 2.91 μmol/m2 with a minimum surface area of 0.58 nm2 and 1.69 μmol/m2 with a minimum surface area of 0.99 nm2, respectively, for citrus pectin (CP) and ultrahigh methoxylated pectin (UHMP). As a result, pectin can be absorbed to interface faster and spontaneously than these other polysaccharides. In fact, the surface activity of pectin is mainly originating from protein residues present within the pectin structure, but also to its acetyl groups and molecular weight [6,69]. Furthermore, the molecular weight and packing of these hydrocolloids at air–water interface can explain the differences in the surface excess concentration and the minimum surface area mentioned above for gelatin and polysaccharides. Indeed, several studies have already shown that polysaccharides usually adsorb more slowly at the interface due to their large molecular weight and lower surface activity compared to proteins. Indeed, several studies have already shown that proteins adsorb better at air–water and oil–water interfaces compared to polysaccharides [33,62]. In addition, the higher molecular weight can lead to the development of more viscous solutions, thus leading to slower kinetics to move to the interface [60].
Π C M C and Γ m values are further used in the calculation of the free energy of adsorption of hydrocolloids at the interface, represented as the driving force for adsorption. It is calculated using the following equation [35]
G A d s 0 = G m 0 Π C M C Γ m
where G m 0 is the standard Gibbs energy of adsorption, Π C M C is the surface pressure at CMC and Γ m is the surface excess concentration.
The standard Gibbs energy of micellization ( G m 0 ) is calculated using the following equation [35]
G m 0 = R T   l n   C M C
The phenomena of adsorption and micellization are frequently evaluated by calculating the free energy of adsorption ( G A d s 0 ) and the standard Gibbs energy of micellization ( G m 0 ) in the bulk solution that dictates the equilibrium surface tension of aqueous solutions [69,70]. The negative values in free energy adsorption ( G A d s 0 ) and standard Gibbs energy of micellization ( G m 0 ) indicate the feasibility of these process and their spontaneous nature (Table 1) [71,72]. As can be seen from Table 1, the absolute value of the free energy for adsorption is much higher than that for micellization. This means that the micellization process is neglected compared to the adsorption process. This may imply that micelle formation starts after the completion of the adsorption phenomenon at the interface. It also due to the fact that the hydrophobic parts of the interacting species (hydrocolloids) direct them towards the air–water interface, resulting in an easy adsorption at the interface prior to micelle formation in solution [68,73].

3.5. CMC Comparison of Hydrocolloids According to the Applied Techniques

The CMC values obtained from different methods in this work are shown in Table 2.
Drop tensiometer method is still the only reliable and accurate method for the CMC determination. The comparison of CMC values obtained by conductimetry, rheometer, and FT-MIR in this work to those of drop tensiometer show no significant difference for pectin and gellan gum, regardless of the method used. The difference observed in CMC values for the other hydrocolloids (gelatin, xanthan gum and ι-carrageenan) is due not only to the type, but also the structure of these hydrocolloids, as depicted by Dauvergne [74]. Based upon the data presented in Table 2, it can be seen that all polysaccharide hydrocolloids exhibited CMC values in the same order of magnitude, yet the individual values varied almost three-fold from 0.03 g/L to 2.71 g/L. For gelatin, CMC values have a higher order of magnitude (13.43 g/L to 23.99 g/L); however, the CMC obtained by mid-infrared is on this order.
Most of the research studies on determining the CMC of a surfactant is carried out with chemical surfactants [9,75]. The authors have mostly found that CMC values are somewhat different for a given surfactant. This difference in CMC values for the same surfactant confirms the suggestion that CMC is not one pinpoint value, but it is a range of concentrations at which aggregates are formed [13,75]. Data for pectin and gellan gum clearly showed no significant difference in CMC values for all the applied method. Moreover, CMC values obtained from FT-MIR and conductimetry methods are not significantly different for hydrocolloids used in this paper. Based on the obtained results, FT-MIR could be used as existing techniques (conductimetry, rheometer, and drop tensiometer) to determine CMC of different hydrocolloids.

4. Conclusions

Surfactants are widely used in the food industry as drug carriers in various drug delivery and drug targeting systems, food additives and also emulsifiers to stabilize oil–water interface. Most of these surfactants are chemicals. In order to overcome the restricted use of conventional surfactants, our research is expected to explore the possibility of green application hydrocolloids as emulsifiers to avoid waste and pollution due to conventional surfactants. A complete profile of the effects on the micellar as well as surface properties of hydrocolloids is required for such applications.
In the present study, the CMC values of gelatin, ι-carrageenan, pectin, gellan gum and xanthan gum are investigated by conductimetry, rheometer, drop tensiometer and FT-MIR techniques. The FT-MIR results showed CMC values relatively similar to those obtained with the tensiometer method for pectin, gellan gum and ι-carrageenan and conductivity for all hydrocolloids, confirming that the CMC of surfactants could be determined by this rapid and non-destructive technique.

Author Contributions

Conceptualization, data curation, investigation: J.H.K.K.K. and R.K.; methodology: J.H.K.K.K. and G.K.; formal analysis, writing—original draft preparation: J.H.K.K.K.; writing—review and editing: J.H.K.K.K., G.K., V.E.T. and R.K.; funding acquisition, supervision: V.E.T. and R.K.; project administration: R.K. All authors have read and agreed to the published version of the manuscript.

Funding

This work has been carried out in the framework of BIHAUTS ECO de France project, which is financed by the European Union, the French State, and the French Region of Hauts-de-France.

Institutional Review Board Statement

Not applicable.

Informed Consent Statement

Not applicable.

Data Availability Statement

Data will be made available on request.

Acknowledgments

The authors gratefully acknowledge the financial support from the Major Domain of Interest (DIM) “Eco-Energy Efficiency” of Artois University. J.H.K.K. KOKO is grateful to the Campus France for its financial support of his Ph.D. during his stay at Artois University.

Conflicts of Interest

The authors declare no conflicts of interest.

References

  1. Phillips, G.O.; Williams, P.A. Introduction to Food Hydrocolloids, 2nd ed.; Glyndwr University: Wrexham, UK, 2000; pp. 1–22. [Google Scholar]
  2. Olorunsola, E.O.; Adedokun, M.O. Surface activity as basis for pharmaceutical applications of hydrocolloids: A review. J. Appl. Pharm. Sci. 2014, 4, 110–116. [Google Scholar] [CrossRef]
  3. Munoz, J.; Rincon, F.; Alfaro, M.C.; Zapata, I.; Fuente, J.; Beltran, O.; De Pinto, G.L. Rheological properties and surface tension of Acacia tortuosa. Carbohydr. Polym. 2007, 70, 198–205. [Google Scholar] [CrossRef]
  4. Huang, X.; Kakuda, Y.; Cui, W. Hydrocolloids in emulsions: Particle size distribution and interfacial activity. Food Hydrocoll. 2001, 15, 533–542. [Google Scholar] [CrossRef]
  5. Dickinson, E. Hydrocolloids at interfaces and the influence on the properties of dispersed systems. Food Hydrocoll. 2003, 17, 25–39. [Google Scholar] [CrossRef]
  6. Dickinson, E. Hydrocolloids as emulsifiers and emulsion stabilizers. Food Hydrocoll. 2009, 23, 1473–1482. [Google Scholar] [CrossRef]
  7. Osano, J.P.; Hosseini-Parvar, S.H.; Matia-Merino, L.; Golding, M. Emulsifying properties of a novel polysaccharide extracted from basil seed (Ocimum bacilicum L.): Effect of polysaccharide and protein content. Food Hydrocoll. 2014, 37, 40–48. [Google Scholar] [CrossRef]
  8. Obi, C.; Adebayo, I. Determination of critical micelle concentration and thermodynamic evaluations of micellization of GMS. Mod. Chem. Appl. 2018, 6, 251. [Google Scholar]
  9. Perinelli, D.R.; Cespi, M.; Lorusso, N.; Palmieri, G.F.; Bonacucina, G.; Blasi, P. Surfactant self-assembling and critical micelle concentration: One approach fits all? Langmuir 2020, 36, 5745–5753. [Google Scholar] [CrossRef]
  10. Behari, M.; Das, D.; Mohanty, A.M. Influence of surfactant for stabilization and pipeline transportation of iron ore water slurry: A Review. ACS Omega 2022, 7, 28708–28722. [Google Scholar] [CrossRef]
  11. Smith, O.E.P.; Waters, L.J.; Small, W.; Mellor, S. CMC determination using isothermal titration calorimetry for five industrially significant non-ionic surfactants. Colloids Surf. B Biointerfaces 2022, 211, 112320. [Google Scholar] [CrossRef]
  12. Wu, C.; Li, N.J.; Chen, K.C.; Hsu, H.F. Determination of critical micelle concentrations of ionic and nonionic surfactants based on relative viscosity measurements by capillary electrophoresis. Res. Chem. Intermed. 2014, 40, 2371–2379. [Google Scholar] [CrossRef]
  13. Krstonošić, V.; Dokić, L.; Milanović, J. Micellar properties of OSA starch and interaction with xanthan gum in aqueous solution. Food Hydrocoll. 2011, 25, 361–367. [Google Scholar] [CrossRef]
  14. Seo, S.; Kwon, S.B.; Park, Y. MOF (CuBDC)-Microcantilever IR Spectroscopy for methane sensing with high sensitivity and selectivity. Chemosensors 2025, 13, 8. [Google Scholar] [CrossRef]
  15. Al-Saidi, S.M.K.; Al-Kharousi, Z.S.N.; Rahman, M.S.; Sivakumar, N.; Suleria, H.A.R.; Ashokkumar, M.; Hussain, M.; Al-Habsi, N. Thermal and structural characteristics of date-pits as digested by Trichoderma reesei. Heliyon 2024, 10, e28313. [Google Scholar] [CrossRef]
  16. Karoui, R.; Hammami, M.; Rouissi, H.; Blecker, C. Mid infrared and fluorescence spectroscopies coupled with factorial discriminant analysis technique to identify sheep milk from different feeding systems. Food Chem. 2011, 127, 743–748. [Google Scholar] [CrossRef]
  17. Karoui, R.; Mouazen, A.M.; Dufour, E.; Pillonel, L.; Picque, D.; De Baerdemaeker, J.; Bosset, J. Application of the MIR for the determination of some chemical parameters in European Emmental cheeses produced during summer. Eur. Food Res. Technol. 2006, 222, 165–170. [Google Scholar] [CrossRef]
  18. Karoui, R.; Mazerolles, G.; Bosset, J.; De Baerdemaeker, J.; Dufour, E. Utilisation of mid-infrared spectroscopy for determination of the geographic origin of Gruyère PDO and L’Etivaz PDO Swiss cheeses. Food Chem. 2007, 105, 847–854. [Google Scholar] [CrossRef]
  19. Ibrahima, M.N.M.; Ngaha, W.S.W.; Norliyanaa, M.S.; Daudb, W.R.W.; Rafatullahb, M.; Sulaimanb, O.; Hashim, R. A novel agricultural waste adsorbent for the removal of lead (II) ions from aqueous solutions. J. Hazard. Mater. 2010, 182, 377–385. [Google Scholar] [CrossRef]
  20. Almeida, P.; Lannes, S.; Calarge, F.; Farias, T.M.B.; Santana, J. FTIR characterization of gelatin from chicken feet. J. Chem. Eng. 2012, 6, 1029–1032. [Google Scholar]
  21. Muyonga, J.H.; Cole, C.G.B.; Duodu, K.G. Fourier transform infrared (FTIR) spectroscopic study of acid soluble collagen and gelatin from skins and bones. Food Chem. 2004, 86, 325–332. [Google Scholar] [CrossRef]
  22. Li, F.; Wei, Y.; Liang, L.; Huang, L.; Yu, G.; Li, Q. A novel low-molecular-mass pumpkin polysaccharide: Structural characterization, antioxidant activity, and hypoglycemic potential. Carbohydr. Polym. 2021, 251, 117090. [Google Scholar] [CrossRef] [PubMed]
  23. Misra, N.N.; Hae, I.Y.; Rohit, P.; Cheorun, J. Atmospheric pressure cold plasma improves viscosifying and emulsion stabilizing properties of xanthan gum. Food Hydrocoll. 2018, 82, 29–33. [Google Scholar] [CrossRef]
  24. Faria, S.; Petkowicz, C.L.D.O.; De Morais, S.A.L.; Terrones, M.G.H.; De Resende, M.M.; De França, F.P.; Cardoso, V.L. Characterization of xanthan gum produced from sugar cane broth. Carbohydr. Polym. 2011, 86, 469–476. [Google Scholar] [CrossRef]
  25. Synytsya, A.; Čopíková, A.; Matějka, P.; Machovič, V. Fourier transform Raman and infrared spectroscopy of pectins. Carbohydr. Polym. 2003, 54, 97–106. [Google Scholar] [CrossRef]
  26. Yang, Z.; Wang, D.; Hu, K.; Xiao, J.; Wu, L. Efficient extraction of pectin from sisal waste by combined enzymatic and ultrasonic process. Food Hydrocoll. 2018, 79, 189–196. [Google Scholar] [CrossRef]
  27. Maiti, S.; Chakravorty, A.; Chowdhury, M. Gellan co-polysaccharide micellar solution of budesonide for allergicanti-rhinitis: An in vitro appraisal. Int. J. Biol. Macromol. 2014, 68, 241–246. [Google Scholar] [CrossRef]
  28. Xu, L.; Qiua, Z.; Gonga, H.; Zhua, C.; Lia, Z.; Lia, Y.; Dong, M. Rheological behaviors of microbial polysaccharides with different substituents in aqueous solutions: Effects of concentration, temperature, inorganic salt and surfactant. Carbohydr. Polym. 2019, 219, 162–171. [Google Scholar] [CrossRef]
  29. Guo, C.; Liu, H.-Z.; Chen, J.-Y.A. Fourier transform infrared study on water-induced reverse micelle formation of block copoly(oxyethylene–oxypropylene–oxyethylene) in organic solvent. Colloids Surf. A Physicochem. Eng. Asp. 2000, 175, 193–202. [Google Scholar] [CrossRef]
  30. Scheuing, D.R.; Weers, J.G.A. Fourier transform infrared spectroscopic study of dodecyltrimethylammonium chloride/sodium dodecyl sulfate surfactant mixtures. Langmuir 1990, 6, 665–671. [Google Scholar] [CrossRef]
  31. Becherová, L.; Prokopec, V.; Čejková, J. Vibrational spectroscopic analysis of critical micelle concentration in sodium decanoate solutions. Spectrochim. Acta A Mol. Biomol. Spectrosc. 2021, 250, 119387. [Google Scholar] [CrossRef]
  32. Bouyer, E.; Mekhloufi, G.; Rosilio, V.; Grossiord, J.L.; Agnely, F. Proteins, polysaccharides, and their complexes used as stabilizers for emulsions: Alternatives to synthetic surfactants in the pharmaceutical field? Int. J. Pharm. 2012, 436, 359–378. [Google Scholar] [CrossRef] [PubMed]
  33. Bai, L.; Huan, S.; Li, Z.; McClements, D.J. Comparison of emulsifying properties of food-grade polysaccharides in oil-in-water emulsions: Gum arabic, beet pectin, and corn fiber gum. Food Hydrocoll. 2017, 66, 144–153. [Google Scholar] [CrossRef]
  34. Higiro, J.; Herald, T.J.; Alavi, S.; Bean, S. Rheological study of xanthan and locust bean gum interaction in dilute solution: Effect of salt. Food Res. Int. 2007, 40, 435–447. [Google Scholar] [CrossRef]
  35. Banipal, T.S.; Kaur, H.; Kaur, A.; Banipal, P.K. Effect of tartarate and citrate based food additives on the micellar properties of sodium dodecylsulfate for prospective use as food emulsifier. Food Chem. 2016, 190, 599–606. [Google Scholar] [CrossRef]
  36. Cancella, M.J.; Cerqueira, A.F.L.W.; Teodoro, L.C.; Pereira, J.R.; Ludwig, Z.M.C.; Anjos, V.C.; Denadai, A.M.L.; Hungaro, H.M.; Rodar, M.P. Xanthan gum produced from milk permeate and deproteinized cheese whey: A comparative analysis with commercial xanthan gums. Biocatal. Agric. Biotechnol. 2024, 56, 103053. [Google Scholar] [CrossRef]
  37. Haghighi, H.; Biard, S.; Bigi, F.; De Leo, R.; Bedin, E.; Pfeifer, F.; Siesler, H.W.; Licciardello, F.; Pulvirenti, A. Comprehensive characterization of active chitosan-gelatin blend films enriched with different essential oils. Food Hydrocoll. 2019, 95, 33–42. [Google Scholar] [CrossRef]
  38. Ibrahim, M.I.; Mahmoud, A.A.; Osman, O.; El-Aal, M.A.; Eid, M. Molecular spectroscopic analyses of gelatin. Spectrochim. Acta A 2011, 81, 724–729. [Google Scholar] [CrossRef]
  39. Hentati, F.; Tounsi, L.; Pierre, G.; Barkallah, M.; Ursu, A.V.; Hlima, B.H.; Desbrières, J.; Le Cerf, D.; Fendri, I.; Michaud, P.; et al. Structural characterization and rheological and antioxidant properties of novel polysaccharide from calcareous red seaweed. Mar. Drugs 2022, 20, 546. [Google Scholar] [CrossRef]
  40. Zhang, H.; Zhao, Y. Preparation, characterization and evaluation of tea polyphenole Zn complex loaded b-chitosan nanoparticles. Food Hydrocoll. 2015, 48, 260–273. [Google Scholar] [CrossRef]
  41. Pan, X.; Zhao, W.; Wang, Y.; Xu, Y.; Zhang, W.; Lao, F.; Liao, X.; Wu, J. Physicochemical and structural properties of three pectin fractions from muskmelon (Cucumis melo) and their correlation with juice cloud stability. Food Hydrocoll. 2022, 124, 107–313. [Google Scholar] [CrossRef]
  42. Da Silva, J.A.; Cardoso, L.G.; Assis, D.D.J.; Gomes, G.V.P.; Oliveira, M.B.P.P.; De Souza, C.O.; Druzian, J.I. Xanthan gum production by xanthomonas campestris pv. campestris ibsbf 1866 and 1867 from lignocellulosic agroindustrial wastes. Appl. Biochem. Biotechnol. 2018, 186, 750–763. [Google Scholar] [CrossRef]
  43. Niknezhad, S.V.; Asadollahi, M.A.; Zamanin, A.; Biria, D.; Doostmohammadi, M. Optimization of xanthan gum production using cheese whey and response surface methodology. Food Sci. Biotechnol. 2015, 24, 453–460. [Google Scholar] [CrossRef]
  44. Dominguez, A.; Fernandez, A.; Gonzalez, N.; Iglesias, E.; Montenegro, L. Determination of Critical Micelle Concentration of Some Surfactants by Three Techniques. J. Chem. Educ. 1997, 74, 1227. [Google Scholar] [CrossRef]
  45. Chen, C.; Jiang, C.; Tripp, C.P. Molecular dynamics of the interaction of anionic surfactants with liposomes. Colloids Surf. B Biointerfaces 2013, 105, 173–179. [Google Scholar] [CrossRef]
  46. Abram, T.; Chfaira, R. Etude de la solubilisation micellaire ionique d’un polluant organique, cas du phénol (Study of micelle solubilization ionic of an organic pollutant case of phenol). J. Mater. Environ. Sci. 2015, 6, 491–498. [Google Scholar]
  47. Togbe, F.C.A.; Yete, P.; Azandegbe, E.C.; Wotto, D.V. Évaluation du comportement de quelques savons traditionnels en solution aqueuse: Détermination de la concentration micellaire critique et de la température de Krafft. J. Appl. Biosci. 2014, 83, 7493–7498. [Google Scholar] [CrossRef]
  48. Ofori-Kwakye, K.; Asantewaa, Y.; Kipo, S.L. Physicochemical and binding properties of cashew tree gum in metronidazole tablet formulation. Int. J. Pharm. Pharm. Sci. 2010, 2, 105–109. [Google Scholar]
  49. Cookey, G.A.; Nwokobia, F.U. Conductivity studies of binary mixtures of ionic and non-ionic surfactants at different temperatures and concentrations. Int. J. Appl. Environ. Sci. 2014, 18, 530–534. [Google Scholar]
  50. Rodd, A.B.; Dunstan, D.E.; Boger, D.V. Characterization of xanthan gum solutions using dynamic light scattering and rheology. Carbohydr. Polym. 2000, 42, 159–174. [Google Scholar] [CrossRef]
  51. Egermayer, M.; Karlberg, M.; Piculell, L. Gels of hydrophobically modified ethyl (hydroxyethyl) cellulose cross-linked by amylase: Effect of hydrophobe architecture. Langmuir 2004, 20, 2208–2214. [Google Scholar] [CrossRef]
  52. Wang, F.; Sun, Z.; Wang, Y.J. Study of xanthan gum/waty corn starch interaction in solution by viscosity. Food hydrocoll. 2001, 15, 575–581. [Google Scholar] [CrossRef]
  53. Kalkandelen, C.; Ozbek, B.; Ergul, N.M.; Akyol, S.; Moukbil, Y.; Oktar, F.N.; Ekren, N.; Kılıc, O.; Kılıc, B.; Gunduz, O. Effect of temperature, viscosity and surface tension on gelatine structures produced by modified 3D printer. IOP Conf. Ser. Mater. Sci. Eng. 2017, 293, 012001. [Google Scholar] [CrossRef]
  54. Mahfoudhi, N.; Sessa, M.; Chouaibi, M.; Ferrari, G.; Donsì, F.; Hamdi, S. Assessment of emulsifying ability of almond gum in comparison with gum arabic using response surface methodology. Food Hydrocoll. 2014, 37, 49–59. [Google Scholar] [CrossRef]
  55. Petri, D.F.S. Xanthan gum: A versatile biopolymer for biomedical and technological applications. J. Appl. Polym. Sci. 2015, 132, 42035. [Google Scholar] [CrossRef]
  56. Abbott, S. Surfactant Science: Principles and Practice, 1st ed.; University of Leeds: Leeds, UK, 2015; pp. 1–260. [Google Scholar]
  57. Beverung, C.J.; Radke, C.J.; Blanch, H.W. Protein adsorption at the oil water interface: Characterization of adsorption kinetics by dynamic interfacial tension measurements. Biophys. Chem. 1999, 81, 59–80. [Google Scholar] [CrossRef]
  58. Ganzevles, R.A. Protein/Polysaccharide Complexes at Air/Water Interfaces. Ph.D. Thesis, Wageningen University, Wageningen, The Netherlands, 2007. [Google Scholar]
  59. Saxena, N.; Nilanjan, P.; Keka, O.; Swapan, D.; Ajay, M. Synthesis, characterization, physical and thermodynamic properties of a novel anionic surfactant derived from sapindus laurifolius. RSC Adv. 2018, 8, 24485–24499. [Google Scholar] [CrossRef]
  60. Benichou, A.; Aserin, A.; Lutz, R.; Garti, N. Formation and characteriztion of amphiphilic, conjugates of whey protein isolate (WPI)/xanthan to improve surface activity. Food Hydrocoll. 2007, 21, 379–391. [Google Scholar] [CrossRef]
  61. Liu, J.; Tan, J.; Hua, X.; Jiang, Z.; Wang, M.; Yang, R.; Cao, Y. Interfacial properties of ultrahigh methoxylated pectin. Int. J. Biol. Macromol. 2020, 152, 403–410. [Google Scholar] [CrossRef]
  62. Castellani, O.; Guibert, D.; Al-Assaf, S.; Axelos, M.; Phillips, G.O.; Anton, M. Hydrocolloids with emulsifying capacity. Part 1: Emulsifying properties and interfacial characteristics of conventional (Acacia senegal (L.) Willd. var. senegal) and matured (Acacia (sen) Super gum) Acacia Senegal. Food Hydrocoll. 2010, 24, 193–199. [Google Scholar] [CrossRef]
  63. Castellani, O.; Gaillard, C.; Vié, V.; Al-Assaf, S.; Axelos, M.; Phillips, G.O.; Anton, M. Hydrocolloids with emulsifying capacity. Part 3: Adsorption and structural properties at the air-water surface. Food Hydrocoll. 2010, 24, 131–141. [Google Scholar] [CrossRef]
  64. Du, F.; Qi, Y.; Huang, H.; Wang, P.; Xu, X.; Yang, Z. Stabilization of O/W emulsions via interfacial protein concentrating induced by thermodynamic incompatibility between sarcoplasmic proteins and xanthan gum. Food Hydrocoll. 2022, 124, 107–242. [Google Scholar] [CrossRef]
  65. Cai, Y.; Deng, X.; Liu, T.; Zhao, M.; Zhao, Q.; Chen, S. Effect of xanthan gum on walnut protein/xanthan gum mixtures, interfacial adsorption, and emulsion properties. Food Hydrocoll. 2018, 79, 391–398. [Google Scholar] [CrossRef]
  66. Zaho, Q.; Long, Z.; Kong, J.; Liu, T.; Sun-Waterhouse, D.; Zhao, M. Sodium caseinate/flaxseed gum interactions at oil-water interface: Effect on protein adsorption and functions in oil-in-water emulsion. Food Hydrocoll. 2015, 43, 137–145. [Google Scholar] [CrossRef]
  67. Prosser, A.J.; Franses, E.I. Adsorption and surface tension of ionic surfactants at the air–water interface: Review and evaluation of equilibrium models. Colloids Surf. A Physicochem. Eng. Asp. 2001, 178, 1–40. [Google Scholar] [CrossRef]
  68. Mukherjee, I.; Moulik, S.P.; Rakshit, A.K. Tensiometric determination of Gibbs surface excess and micelle point: A critical revisit. J. Colloid Interface Sci. 2013, 394, 329–336. [Google Scholar] [CrossRef]
  69. Leroux, J.; Langendorff, V.; Schick, G.; Vaishnav, V.; Mazoyer, J. Emulsion stabilizing properties of pectin. Food Hydrocoll. 2003, 17, 455–462. [Google Scholar] [CrossRef]
  70. Ampatzidis, C.D.; Varka, E.M.A.; Karapantsios, T.D. Adsorption behavior of non-conventional eco-friendly tyrosine glycerol ether surfactants. Colloids Surf. A Physicochem. Eng. Asp 2013, 438, 104–111. [Google Scholar] [CrossRef]
  71. Shirzad, S.; Rahmat, S. Micellization properties and related thermodynamic parameters of aqueous sodium dodecyl sulfate and sodium dodecyl sulfonate solutions in the presence of 1-propanol. Fluid Phase Equilib. 2014, 377, 1–8. [Google Scholar] [CrossRef]
  72. Sanlıer, H.; Yasa, S.M.; Cihnioglu, A.O.; Abdulhayoglu, M.; Yılmaz, H.; Güliz, A. Development of gemcitabine-adsorbed magnetic gelatin nanoparticles for targeted drug delivery in lung cancer. Artif. Cells Nanomed. Biotechnol. 2016, 44, 943–949. [Google Scholar]
  73. Yoshimura, T.; Sakato, A.; Tsuchiya, K.; Ohkubo, T.; Sakai, H.; Abe, M.; Esumi, K. Adsorption and aggregation properties of amino acid-based n-alkyl cysteine monomeric and dialkyl cystine gemini surfactants. J. Colloid Interface Sci. 2007, 308, 466–473. [Google Scholar] [CrossRef]
  74. Dauvergne, J. Synthèse et Etude Physico-Chimique de Nouveaux Tensioactifs Utilisables pour la Cristallisation 2D sur Film Lipidique et l’étude des Protéines Membranaires. Ph.D. Thèse, Université d’Avignon et des Pays de Vaucluse, Avignon, France, 2010. [Google Scholar]
  75. Zdziennicka, A.; Katarzyna, S.; Joanna, K.; Bronisław, J. Critical micelle concentration of some surfactants and thermodynamic parameters of their micellization. Fluid. Phase Equilib. 2012, 322–323, 126–134. [Google Scholar] [CrossRef]
Figure 1. FT-MIR spectra of different concentrations for gelatin (a), ι-carrageenan (b), pectin (c), gellan gum (d) and xanthan gum (e) solutions 40 °C.
Chemosensors 13 00099 g001
Scheme 1. Schematic representation of hydrocolloid molecule behaviors in aqueous solution as a function of concentration.
Chemosensors 13 00099 sch001
Figure 2. Absorbance at: (a) 1554 cm−1 of different concentrations of gelatin; (b) 1072 cm−1 of different concentrations of iota-carrageenan; (c) ratio absorbance at 1018/1107 cm−1 of different concentrations of pectin; (d) 1041 cm−1 of different concentrations of gellan gum; (e) 1060 cm−1 of different concentrations of xanthan gum determined at 40 °C.
Chemosensors 13 00099 g002
Figure 3. Conductivity versus concentration plots for gelatin (a), ι-carrageenan (b), pectin (c), gellan gum (d) and xanthan gum (e) solutions at 40 °C.
Chemosensors 13 00099 g003
Figure 4. Specific viscosity versus concentration plots for gelatin (a), ι-carrageenan (b), pectin (c), gellan gum (d) and xanthan gum (e) solutions at 40 °C.
Chemosensors 13 00099 g004
Figure 5. Surface tension versus concentration plots for gelatin (a), ι-carrageenan (b), pectin (c), gellan gum (d) and xanthan gum (e) solutions at 40 °C.
Chemosensors 13 00099 g005
Table 1. Critical micelle concentration (CMC), surface pressure ( C M C ), maximum surface excess concentration ( Γ m ), minimum area per surfactant molecule at air/water interface ( A m i n ), Gibbs energy of micellization ( G m 0 ), Gibbs energy of adsorption ( G A d s 0 ) for ι-carrageenan, gelatin, pectin, gellan gum and xanthan gum from surface tension ( γ C M C ) data at 40 °C.
HydrocolloidsCMC · 10−5
(mol/L)
γ CMC
(mN/m)
CMC
(mNm)
Γ m
(nmol/m2)
A m i n
(nm2)
G m 0 · 10 −7
(kJ/mol)
G A d s 0
(kJ/mol)
Gelatin55.16 ± 1.0743.7228.2863.60.036−1.95−44,592.42
ι-Carrageenan7 ± 0.5754.4617.541000.023−1.24−175,203.05
Pectin7.46 ± 1.9853.7618.2434.860.066−2.47−523,193.6
Gellan gum1.2 ± 0.5646.0225.97511.090.21−58.96−341,098.59
Xanthan gum0.17 ± 0.6256.9315.072.321−17.26−6,493,369.73
Table 2. Critical micelle concentration (CMC) obtained for ι-carrageenan, gelatin, pectin, gellan gum and xanthan gum according to different techniques used.
HydrocolloidsCMC (g/L)
ConductivityViscositySurface TensionMIR
Gelatin68.59 ± 4.35 a79.15 ± 6.45 b55.16 ± 1.07 c70 ± 0 a
ι-carrageenan15 ± 1 a16.64 ± 1.25 b14 ± 0.57 a15 ± 0 a
Pectin6.53 ± 0.43 a6.91 ± 0.31 a7.46 ± 1.98 a7 ± 0 a
Gellan gum6.16 ± 0.51 a6.03 ± 0.56 a6.04 ± 0.56 a5 ± 0 a
Xanthan gum5.08 ± 0.08 a3.29 ± 0.89 b3.48 ± 0.62 b6 ± 0 a
Means in the same row (for different techniques), followed by the same letters are not significantly different (p ≤ 0.05, Fisher test).
Disclaimer/Publisher’s Note: The statements, opinions and data contained in all publications are solely those of the individual author(s) and contributor(s) and not of MDPI and/or the editor(s). MDPI and/or the editor(s) disclaim responsibility for any injury to people or property resulting from any ideas, methods, instructions or products referred to in the content.

