Article

Relationship Between Sensor Sensitivity and Chemical Structure of Benzene-Carboxylic Modifiers for Umami Substance Detection

1
Graduate School of Information Science and Electrical Engineering, Kyushu University, 744 Motooka, Fukuoka 819-0395, Japan
2
Faculty of Information Science and Electrical Engineering, Kyushu University, 744 Motooka, Fukuoka 819-0395, Japan
3
Research and Development Center for Five-Sense Devices, Kyushu University, 744 Motooka, Fukuoka 819-0395, Japan
4
Faculty of Nutritional Sciences, Nakamura Gakuen University, 5-7-1 Befu, Fukuoka 814-0198, Japan
5
Food and Health Innovation Center, Nakamura Gakuen University, 5-7-1 Befu, Fukuoka 814-0198, Japan
6
Institute for Advanced Study, Kyushu University, 744 Motooka, Fukuoka 819-0395, Japan
7
Graduate School of Nutritional Sciences, Nakamura Gakuen University, 5-7-1 Befu, Fukuoka 814-0198, Japan
*
Author to whom correspondence should be addressed.
Chemosensors 2025, 13(3), 98; https://doi.org/10.3390/chemosensors13030098
Submission received: 30 January 2025 / Revised: 3 March 2025 / Accepted: 6 March 2025 / Published: 8 March 2025

Abstract

:
A 2,6-dihydroxyterephthalic acid (2,6-DHTA)-treated taste sensor exhibited sensitivity and selectivity for umami substances, as previously reported. This study aims to investigate the relationship between the sensor’s sensitivity to umami substance and the chemical structure of modifiers—specifically ortho, meta, and para substituents. The investigations focused on using structurally different modifiers to measure monosodium L-glutamate (MSG) at various concentrations. Additionally, based on the investigation of lipid and modifier conditions, a 1 mM lipid concentration was chosen for fabricating the lipid/polymer membranes used in MSG measurements, and each membrane was treated with a 0.03 wt% modifier solution. The results revealed that the sensor’s sensitivity varied depending on the modifier structures as well as the presence of an intramolecular H-bond within these modifiers, indicating the critical role of modifier structures in effectively detecting umami substance with the taste sensor.

1. Introduction

The steady renewal of taste cells in the oral cavity, occurring within a few months, ensures that human perception of different taste stimuli remains uninterrupted and constant throughout life [1,2]. The sense of taste is fundamental for humans to gather information about the external world, as it allows us to assess the nutritious content of food and avoid potentially toxic substances [3,4]. Umami is one of the five basic tastes, alongside sweetness, sourness, saltiness, and bitterness. It is described as a meaty, mouth-filling taste, roughly corresponding to the taste of monosodium L-glutamate (MSG) [5,6,7]. Ikeda [8] further noted that the umami taste originates from the ionic form of monovalent glutamic acid.
Cell-based expression studies in rodents as well as cell-based assays have demonstrated that the T1R1/T1R3 heterodimer, a member of the G-protein-coupled receptor (GCPR) family, is selectively activated by MSG and aspartate, and the glutamate analogue L-AP4 [4,7,9,10]. Additionally, some reports suggest that certain members of the metabotropic glutamate receptors (mGluRs), i.e., mGluR1 and mGluR4, are responsive to umami stimulation, particularly MSG [11,12,13,14]. Furthermore, the extracellular-Ca2+-sensing receptor (CASR) and G-protein-coupled receptor family C group 6 member A (GPRC6A) have been identified as potential taste receptors for umami [7,15]. While CASR responds not only to amino acids but also to polycations, GPRC6A performs common cellular functions unrelated to taste, and its precise role in humans remains unclear [15]. All these receptors are members of class C GPCRs and have the same structure as T1Rs [3]. Their structural characteristics confer semi-selectivity for umami substances. Semi-selectivity means that the signal of one receptor is specific to certain chemical substances. This aligns with the objective of designing sensors that can detect these corresponding substances.
Taste sensing systems, also known as the electronic tongue, are a type of chemical sensor designed to imitate the human sense of taste. These systems incorporate various sensing methodologies, such as potentiometry [16,17,18,19], optical methods [20,21], and biomimetic biosensing [22,23]. A potentiometry taste sensor, featuring multichannel electrodes composed of various types of lipid/polymer membranes to measure the five basic tastes and astringency, was developed by Toko and other co-workers [17,24]. The lipid/polymer membranes on the sensor electrodes were designed based on the ionic and/or hydrophobic (or hydrophilic) properties of taste substances, enabling the taste sensor to classify and quantify different tastes [24]. An example of the commercialized machine is TS-5000Z (Intelligent Sensor Technology, Inc., Kanagawa, Japan), which has been employed in food [25,26,27], beverages [28,29,30], and pharmaceuticals [31,32,33,34] with high reproducibility.
The taste sensor for umami substances exhibited a negative response to MSG, while it also showed a similar negative response to alkaline substances, such as NaOH and NaHCO3 [35], indicating the sensor’s limited selectivity. This umami sensor uses phosphoric acid di (2-ethylhexyl) ester (PAEE), a type of partially dissociated lipid, as one of its lipid components [24]. Studies have shown that protons dissociate from the phosphate groups of lipids PAEE due to its lower dissociation constant compared to the carboxyl group of MSG [35]. This dissociation alters the membrane surface charge density, leading to a negative change in membrane potential. These findings suggest that the sensor response mechanism is driven by the transfer of H+ from the phosphate group of lipids PAEE to the carboxyl groups of MSG rather than by molecular recognition of the chemical structure of MSG by the receptive membrane.
In our previous studies, a novel taste sensor employing the surface modification method was developed for the measurement of umami substances [36]. The taste sensor treated with 2-hydroxyterephthalic acid (2-HTA) and 2,6-dihydroxyterephthalic acid (2,6-DHTA) demonstrated sensitivity to umami substances, including MSG and monosodium L-aspartate (MSA). Additionally, the taste sensor treated with 2,6-DHTA showed selective responses to both MSG and MSA among the five basic tastes and astringency samples. The experimental data also revealed that modifiers capable of detecting umami substances should meet two chemical structure conditions: possess intramolecular H-bonds and have carboxyl groups in the para position, i.e., two carboxyl groups.
To further investigate the response mechanism, 1H-NMR measurements were conducted to analyze how the chemical structure of the modifiers and analytes influence the response values of the taste sensors. Chemical shift changes observed in both 2,6-DHTA and MSG indicated the presence of intermolecular interactions [37]. These findings suggested that intermolecular H-bonds formed between 2,6-DHTA and MSG, affecting the dissociation state of the carboxyl groups of 2,6-DHTA. Specifically, H+ ions return from the solution to the carboxyl groups of 2,6-DHTA, altering its dissociation state. This change in dissociation state eventually alters the membrane surface charge density, enabling the fabricated taste sensor to generate a positive response to MSG [37].
The taste sensor treated with 2,6-DHTA responds to MSG through molecular recognition and intermolecular interactions between the modifier and the analyte. Although the taste sensor treated with 2,6-DHTA exhibited significant sensitivity to MSG, the tested modifiers only included para-substituted benzenedicarboxylic acid. In addition, there are structurally similar modifiers with intramolecular H-bonds, such as the benzenedicarboxylic acid with meta and ortho substituents, which have yet to be thoroughly investigated.
In this study, we aim to investigate the relationship between sensor sensitivity and chemical structure of modifiers for umami substance detection. The modifiers employed in this study include three types of benzenedicarboxylic acid (i.e., with ortho, meta, and para substituents). Prior to the fabrication of sensor electrodes, it is essential to ensure consistent conditions for both the lipid concentration in the lipid/polymer membranes and the mass fraction of the modifier solution used in surface modification. Specifically, we sought to understand how the membrane lipid concentration and the mass fraction of the modifier solution used for membrane surface modification influence the sensor’s sensitivity to MSG.
To address this, lipid/polymer membranes were formed using varying concentrations of tetradodecylammonium bromide (TDAB) lipids. Each membrane group was then immersed in different mass fractions of 2,6-DHTA modifier solution for surface modification before measuring MSG sample solutions. Additionally, UV/Vis absorption spectroscopy measurements were conducted to explore the relationship between the sensor’s sensitivity and the mass fraction of the modifier solution used for membrane surface modification, as well as the amount of the modifier adsorbed onto the membrane.
Based on these results, we determined the lipid concentration and identified the mass fraction of the modifier solution for MSG sensitivity measurements using the taste sensor treated with structurally different chemical modifiers. The relationship between the chemical structure of the modifier and the sensor’s sensitivity to MSG was summarized. Modifiers that exhibited significant sensitivity to MSG were selected for taste selectivity measurements to verify that the sensors’ selective response to MSG is based on molecular recognition.

2. Materials and Methods

2.1. Reagents

TDAB and tetrahydrofuran (THF) were purchased from Sigma-Aldrich (St. Louis, MO, USA). Dioctyl phenyl-phosphonate (DOPP) was purchased from Dojindo Laboratories (Kumamoto, Japan). Polyvinyl chloride (PVC) and 2,6-dihydroxybezoic acid (2,6-DHBA) were purchased from FUJIFILM Wako Pure Chemical Corporation (Osaka, Japan). 2,6-DHTA was purchased from BLDpharm (Shanghai, China). Terephthalic acid (TPA), 2-HTA, 2,5-dihydroxyterephthalic acid (2,5-DHTA), isophthalic acid (IPA), 4-hydroxyisophthalic acid (4-HIPA), and phthalic acid (PA) were purchased from Tokyo Chemical Industry (Tokyo, Japan). MSG, potassium chloride (KCl), tartaric acid, quinine hydrochloride, tannic acid, and sucrose were purchased from Kanto Chemical Co. (Tokyo, Japan). 2,3-Dihydroxyterephthalic acid (2,3-DHTA) was sourced from Fluorochem (Hadfield, Derbyshire, UK). 2-Hydroxyisophthalic acid (2-HIPA) was purchased from Combi-Blocks (San Diego, CA, USA). 4-Hydroxyphthalic acid (4-HPA) was sourced from APPLO SCIENTIFIC (Stockport, Cheshire, UK). 3-Hydroxyphthalic acid was purchased from Angene International Limited. (London, UK). Figure 1 shows the structural formula of 2,6-DHBA, TPA, 2-HTA, 2,3-DHTA, 2,5-DHTA, 2,6-DHTA, IPA, 4-HIPA, 2-HIPA, PA, 4-HPA, 3-HPA, and MSG.

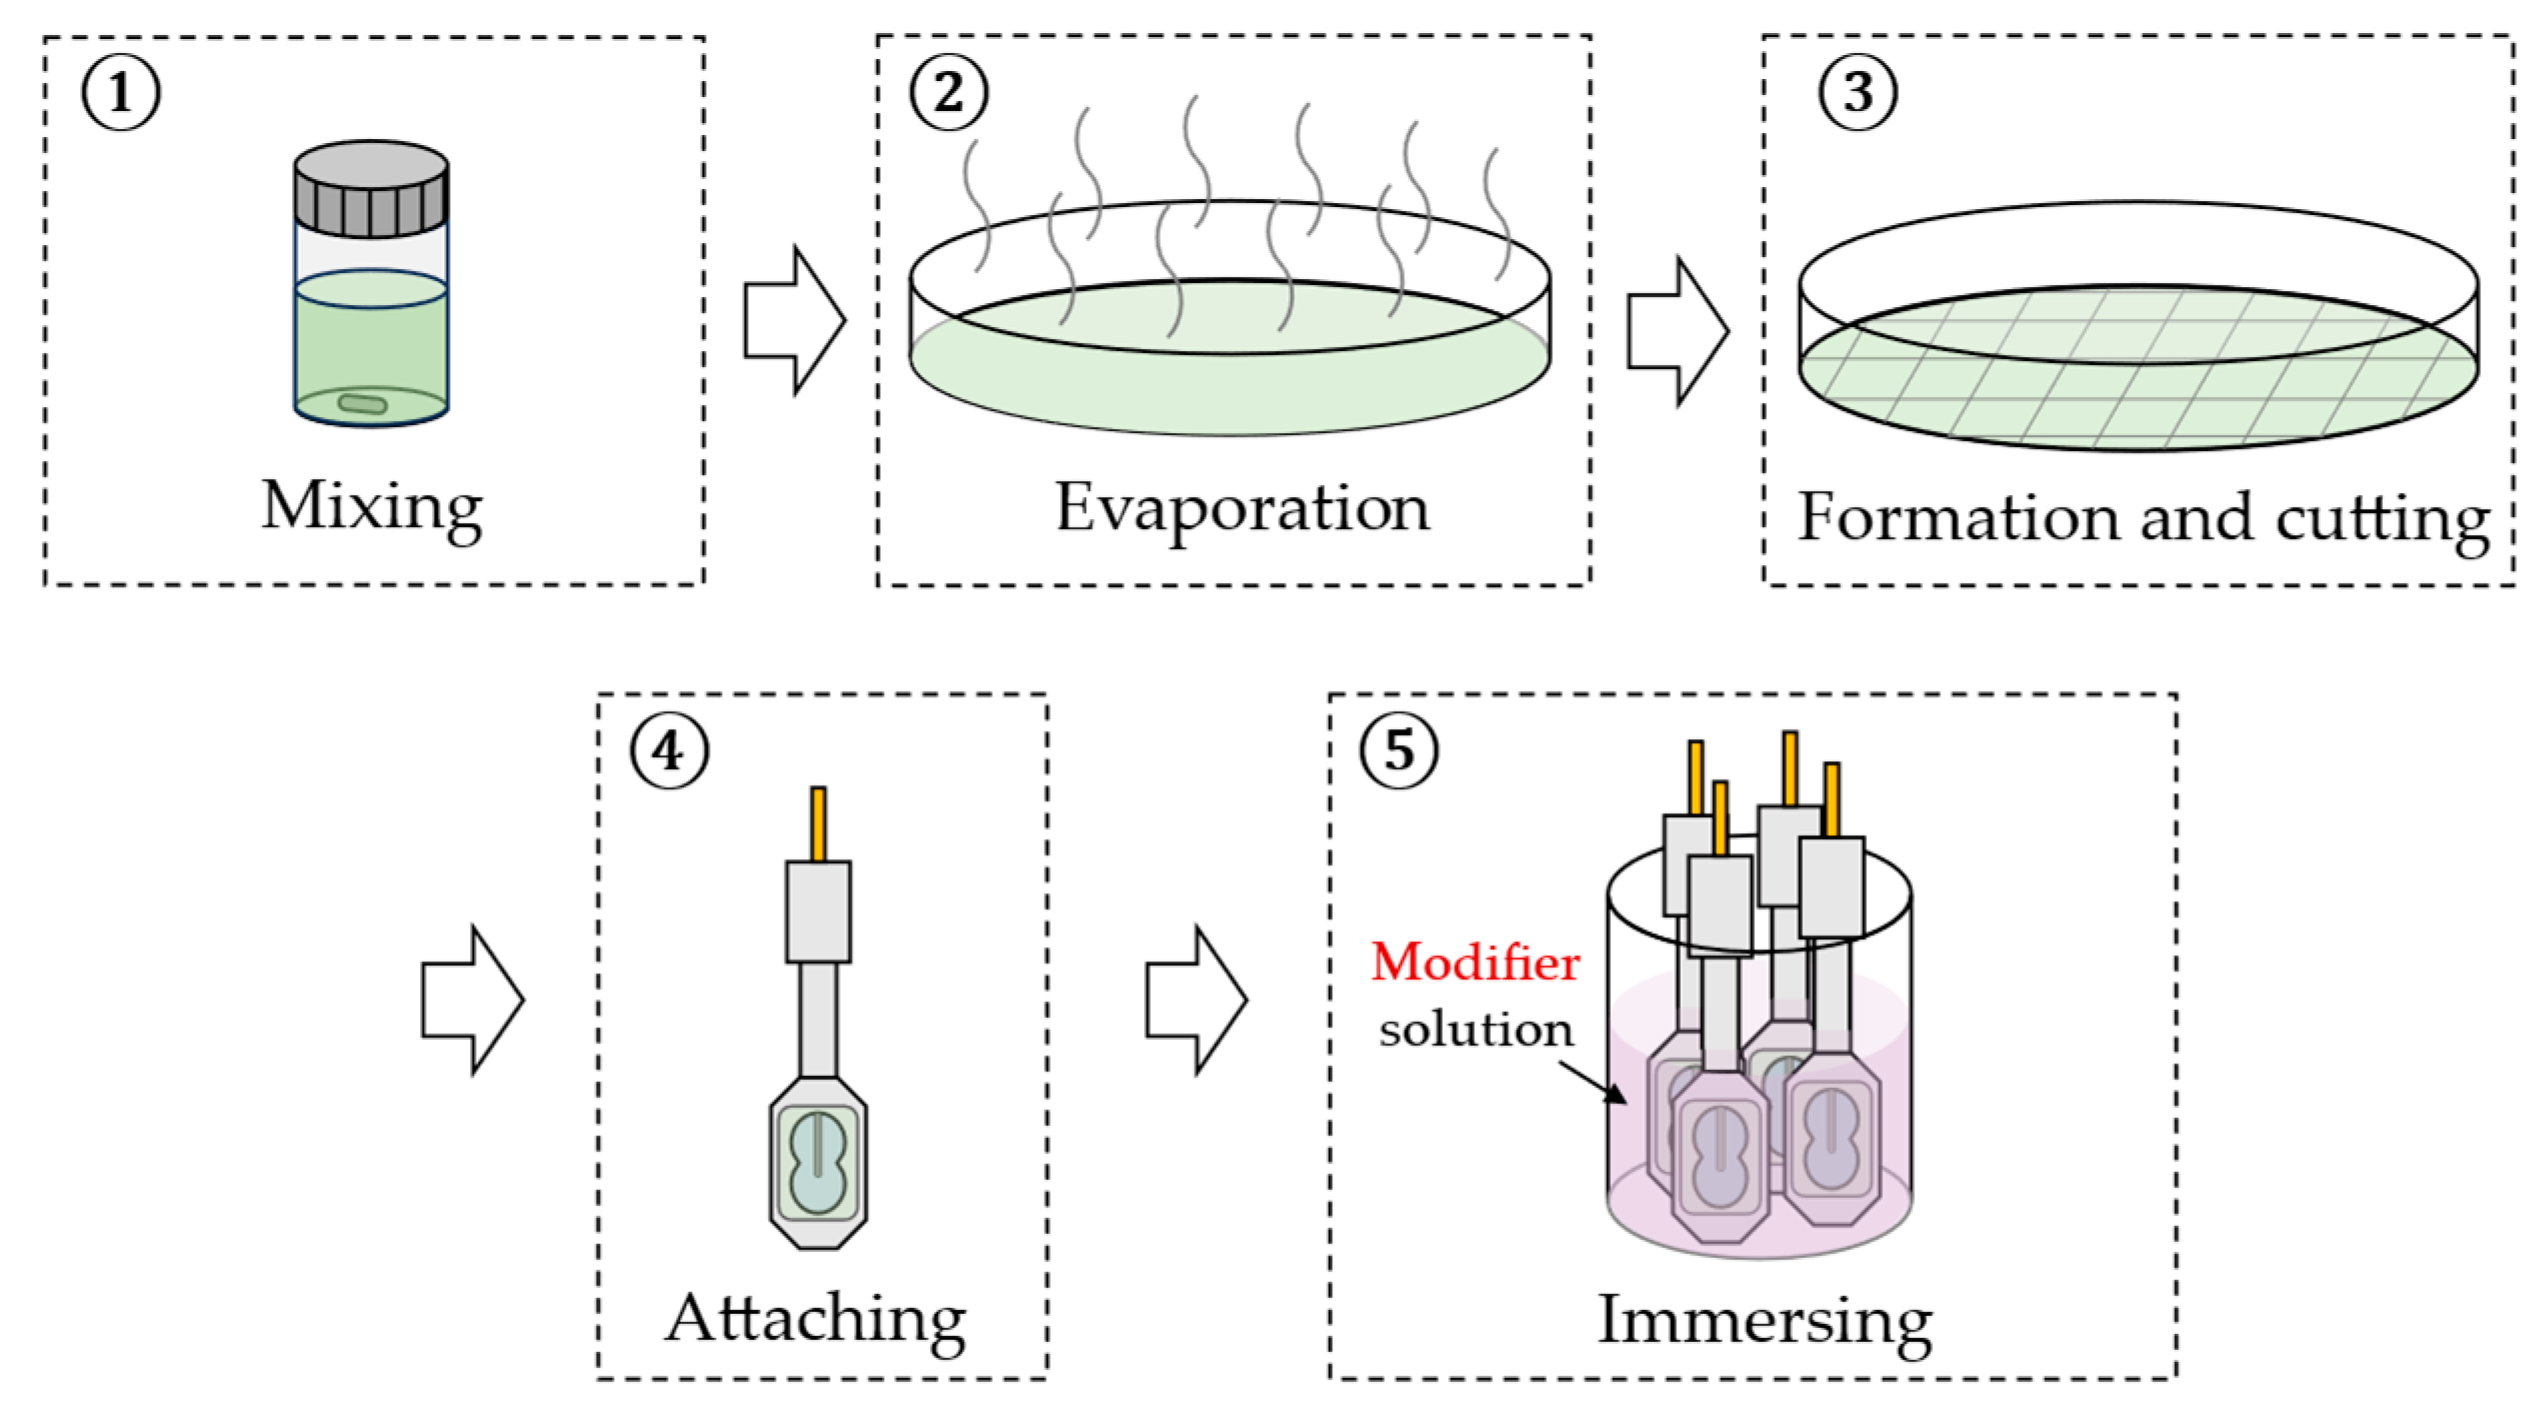
2.2. Fabrication of Lipid/Polymer Membrane

In this study, we prepared four groups of sensor electrodes with lipid/polymer membranes. All lipid/polymer membranes contained TDAB as the lipid, DOPP as the plasticizer, and PVC as the supporting material. The lipid concentrations selected for forming the lipid/polymer membranes in each group varied, specifically 0.1, 0.3, 1, and 3 mM. Initially, four 20 mL screw tube bottles were cleaned, dried, and prepared for the mixture of lipid, DOPP, PVC, and THF. Respectively, 0.001, 0.003, 0.01, and 0.03 mmol of TDAB were dissolved in 10 mL of THF. Subsequently, 1.5 mL of DOPP and 800 mg of PVC were added to each solution. Each mixture was thoroughly stirred and then poured onto a clean Petri dish (90 mm Φ). The TDAB lipid/polymer membranes were formed by allowing the THF to evaporate. The resulting lipid/polymer membrane was then cut and carefully attached to a sensor electrode with an adhesive consisting of PVC and THF.
Twelve types of modifiers, including 2,6-DHBA, PA, 4-HPA, 3-HPA, IPA, 4-HIPA, 2-HIPA, TPA, 2-HTA, 2,3-DHTA, 2,5-DHTA, and 2,6-DHTA, were employed in this study. For membrane surface modification, 2,6-DHTA solutions with mass fraction of 0.001, 0.003, 0.01, 0.03, and 0.3 wt% (using pure water as the solvent) were prepared. All other modifiers were prepared as 0.03 wt% solutions. Sensor electrodes were immersed in the modifier solutions for 72 h to modify the membrane surfaces. Figure 2 illustrates the fabrication process for the sensor electrodes.

2.3. Measurements of the Effects of Modifier Mass Fraction and Lipid Concentration on MSG Sensitivity by Taste Sensor Treated with 2,6-DHTA

A commercial taste sensing system (TS-5000Z, Intelligent Sensor Technology, Inc., Kanagawa, Japan) was employed for conducting measurements. This system works by detecting the potential difference between the sensor electrode and the reference electrode. Figure 3 illustrated the taste sensing system and the structure of sensor electrode and reference electrode.
The taste sensor with surface modification followed three basic steps during the measurement in this study, as shown in Figure 4. Initially, the sensor electrodes and the reference electrode were immersed in a reference solution (containing 30 mM KCl and 0.3 mM tartaric acid) for 30 s to obtain the reference potential (Vr). After that, the electrodes were immersed in the sample solution for 30 s to obtain the sample potential (Vs). Finally, the electrodes were cleaned with a water-based solution containing 10 mM KOH, 100 mM KCl, and 30 vol% EtOH in preparation for the next measurement cycle.
To investigate the effects of two variables—the lipid concentration in forming the lipid/polymer membrane and the mass fraction of the modifier solution used in the membrane surface modification—on the sensitivity of the taste sensor to MSG, we employed lipid/polymer membranes containing 0.1, 0.3, 1, and 3 mM TDAB in this section. Each group of membranes with the same TDAB concentration was further divided into four subgroups, which were, respectively, immersed in 2,6-DHTA aqueous solutions with mass fractions of 0.001, 0.003, 0.01, and 0.03 wt% for membrane surface modification. In this way, we obtained a total of 16 groups (4 sets with different lipid concentrations × 4 sets with different mass fraction modifier solutions) of lipid/polymer membranes, each with at least one different variable. These membranes were then used to measure MSG sample solutions dissolved in the reference solution at concentrations of 0.1, 0.3, 1, 3, 10, 30, and 100 mM.

2.4. Measurement of the Amount of Modifier 2,6-DHTA on Lipid/Polymer Membranes by UV/Vis Absorption Spectroscopy Measurements

To analyze the modifier 2,6-DHTA on the lipid/polymer membrane surface after membrane surface modification, a UV/Vis spectrophotometer (UV-1800, SHIMADZU Co., Kyoto, Japan) was employed in this study. To determine the characteristic absorption peak of the modifier 2,6-DHTA, 3 mL THF solutions of 2,6-DHTA with mass fractions of 0.003 and 0.03 wt% were prepared. A 3 mL THF solution was prepared as the baseline for the graphs of data. The scanning wavelength range is from 200 to 800 nm.
To measure the 2,6-DHTA adsorbed on the lipid/polymer membrane surface, the TDAB lipid/polymer membrane without membrane surface modification was dissolved in 3 mL THF within a cell (ASLAB Quartz Cell, AS ONE Co., Osaka, Japan), and we recorded the UV/Vis absorption spectrum as the baseline. We then prepared two sets of TDAB lipid/polymer membranes, which were immersed in aqueous solutions of 2,6-DHTA with mass fraction of 0.003 and 0.03 wt% for 72 h to modify their membrane surfaces. After surface modification, each group of membranes was dissolved in 3 mL THF within the cells and measured by UV/Vis spectrophotometer.
The spectra obtained were compared with the data measured by the taste sensor treated with 0.003, 0.03 wt% 2,6-DHTA to investigate the relationship between the modifier and the mass fraction of the modifier solution used in surface modification.

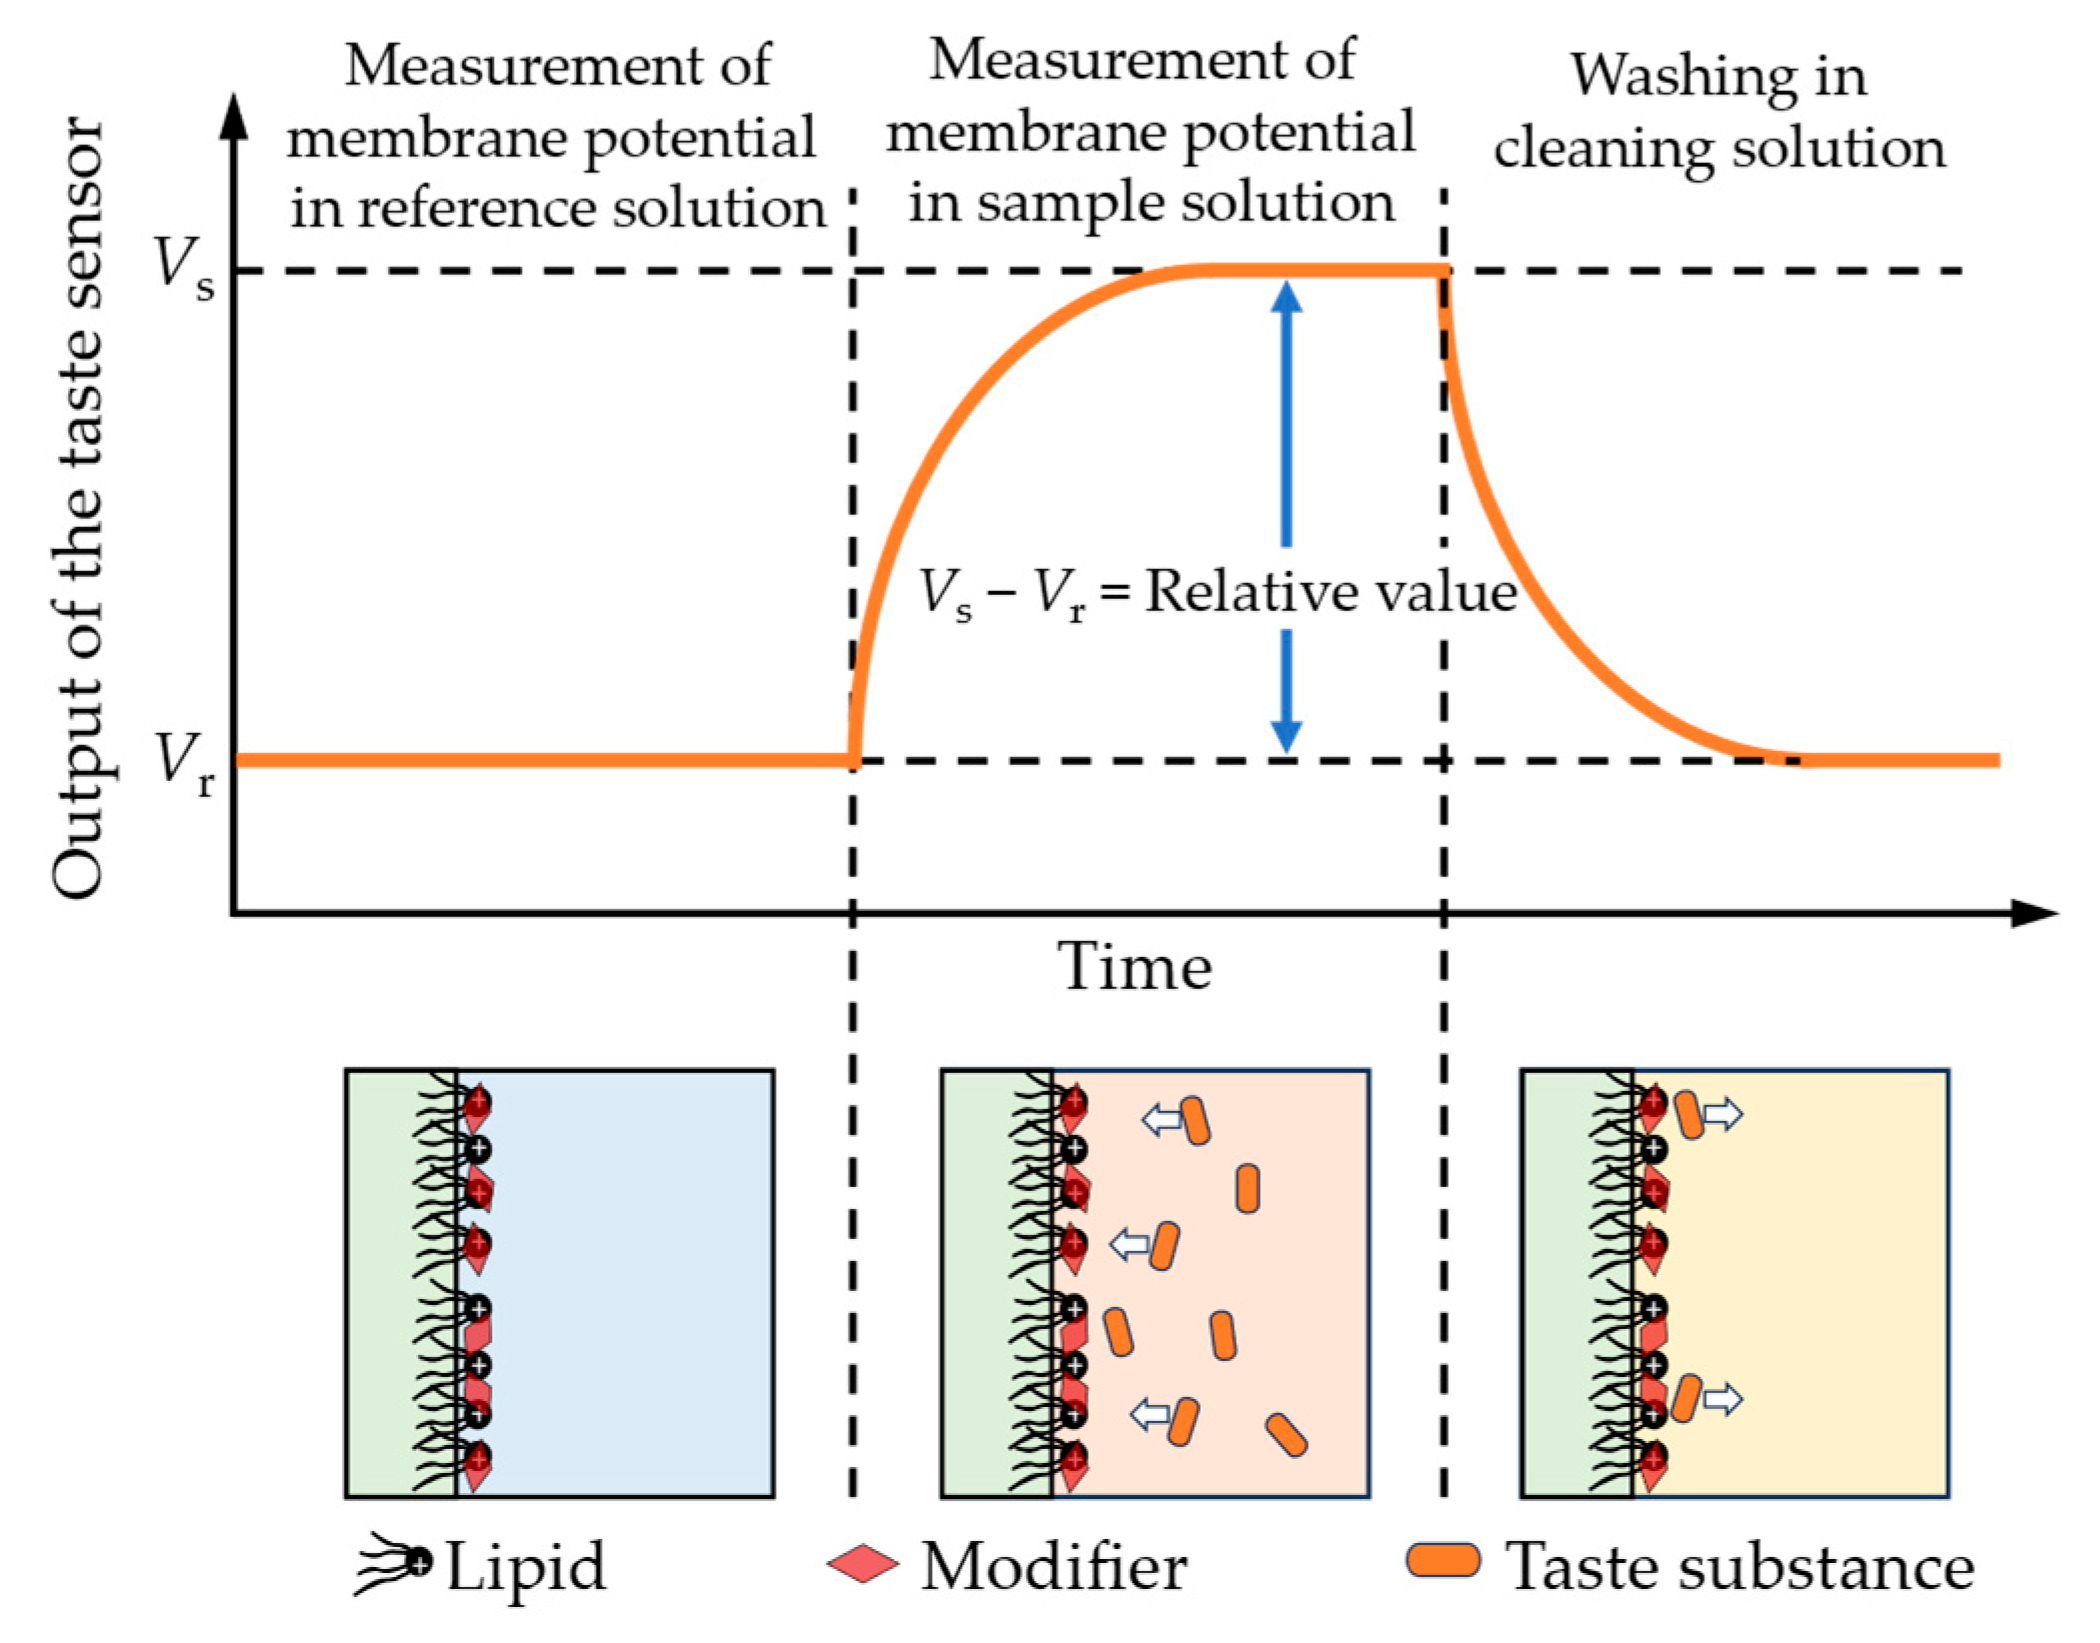
2.5. Measurements of Umami Substance by Fabricated Taste Sensors

To investigate the relationship between the sensor sensitivity to umami substance and chemical structure of modifiers, the 12 modifiers listed in Section 2.1 were prepared as aqueous solutions with a mass fraction of 0.03 wt%. These solutions were then used to modify the surface of the membranes on 12 sets of sensor electrodes, respectively. MSG was used as the test sample and was dissolved in the reference solution at concentrations of 1, 10, and 100 mM. These samples were measured by the 12 sets of fabricated taste sensors. Mean values and standard deviations were calculated from 12 (4 electrodes × 3 rotations) sets of electrical response values.
After measuring the sensitivity to MSG, sensors treated with 2,6-DHTA and 2-HIPA were employed to measure various taste quality samples, as showed in Table 1, to verify whether the sensors’ selective response to MSG is based on molecular recognition.

3. Results and Discussion

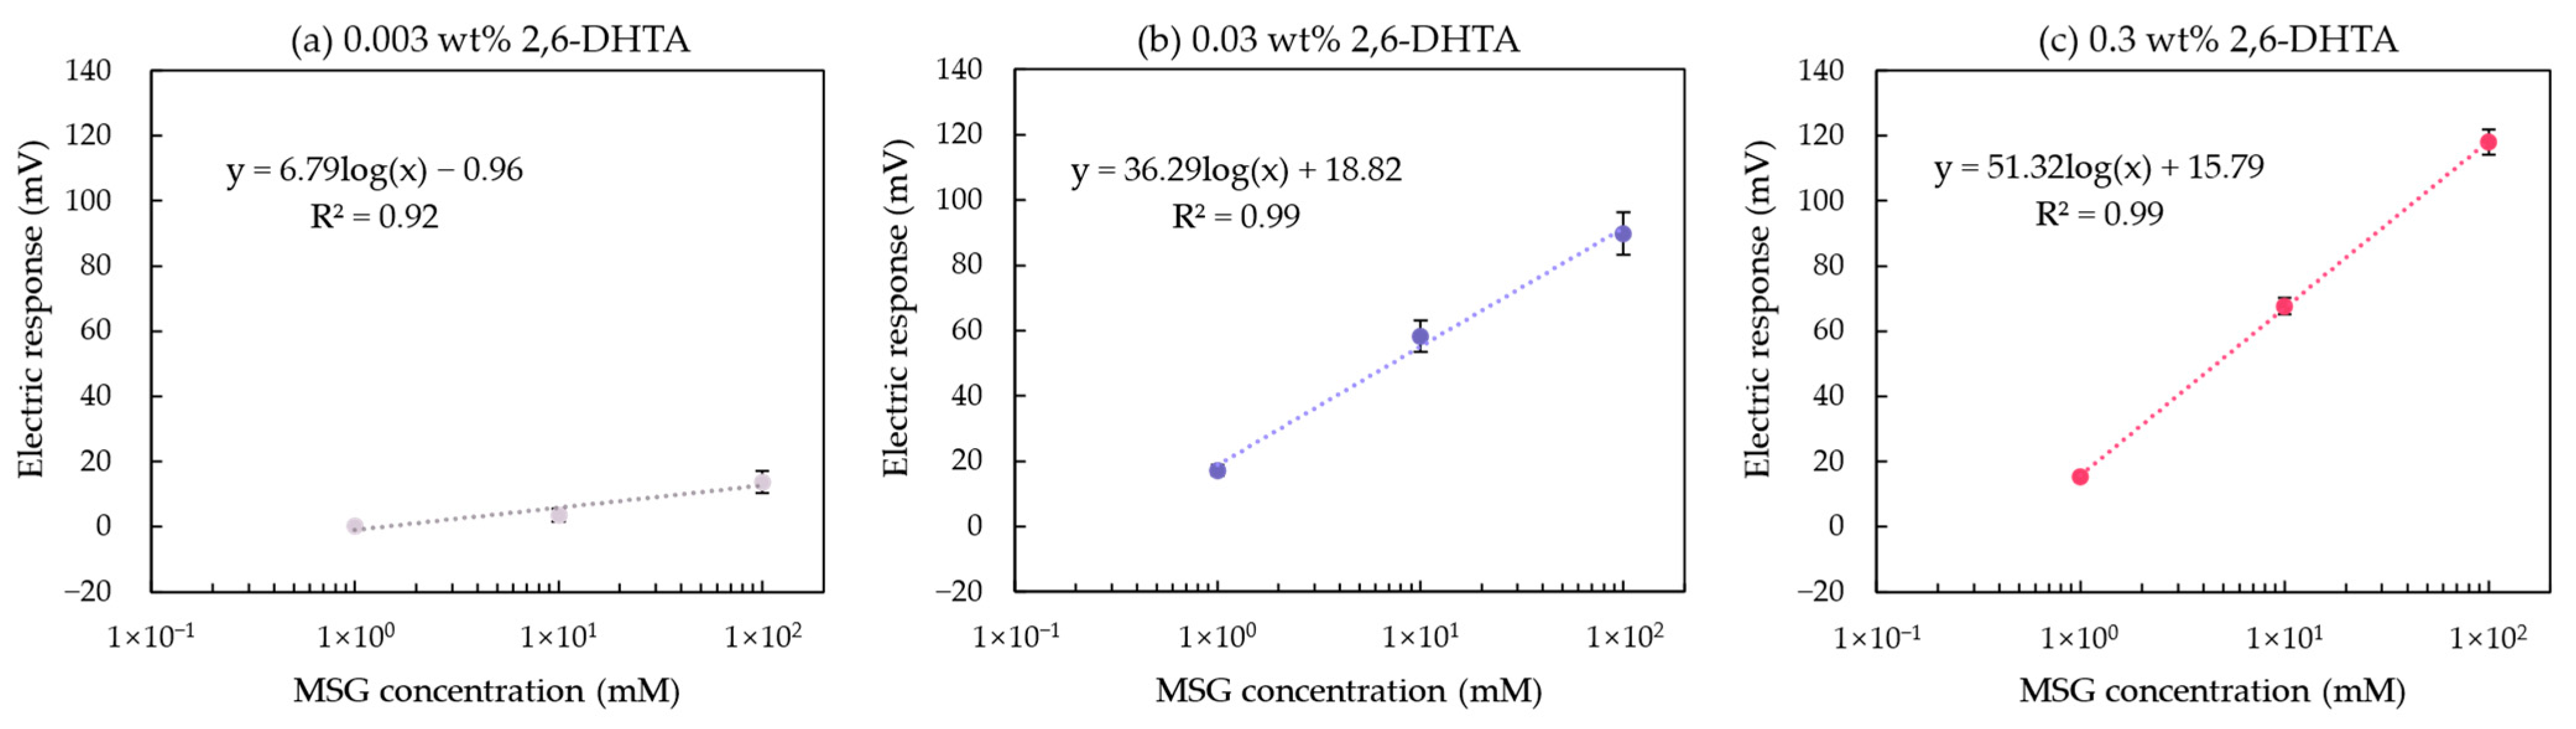
3.1. Investigation of Effects of Modifier Mass Fraction and Lipid Concentration on MSG Sensitivity

In our previous study, the taste sensor containing 1 mM TDAB lipids and treated with 0.03 wt% 2,6-DHTA showed a significant response to MSG [36]. Another study demonstrated that the taste sensor, containing 1 mM TDAB lipids and treated with 0.03 wt% 2,6-DHBA (which lacks the carboxyl group on the para position of the benzene ring compared to 2,6-DHTA), exhibited a relatively significant response to caffeine compared to other lipid concentrations and modifier mass fractions [38]. These findings suggest that two key variables—the lipid concentration in forming the lipid/polymer membrane and the mass fraction of the modifier solution used in the membrane surface modification—play a crucial role in influencing the sensitivity of the taste sensor with surface modification.
A total of 16 groups data of the taste sensors’ response to MSG are shown in Figure 5. Each membrane of the taste sensor includes at least one differing variable. In Figure 5d, the taste sensor containing 3 mM TDAB all showed negligible responses (less than 10 mV) to MSG. Since the 1 mM TDAB membrane without surface modification also exhibited negligible responses to MSG [36], this suggests that the response values in Figure 5d mainly originated from the lipid/polymer membrane of the taste sensor. In other words, the modifier 2,6-DHTA, which interacts with MSG and induces changes in surface charge density, is likely difficult to adsorb onto the 3 mM TDAB lipid/polymer membrane. Therefore, regardless of the mass fraction of the modifier solution used for membrane surface modification, when the TDAB lipid concentration reaches 3 mM, the membrane cannot be used for MSG detection.
In Figure 5a,b, data show that the taste sensor exhibits a negative response to MSG at low concentrations, but as MSG concentration increases, the response becomes positive. We hypothesized that this transition from a negative response at low concentrations to a positive response at high concentrations reflects a competitive interplay affecting the sensor’s sensitivity to MSG: the dissociation of the H+ at the membrane surface and the interaction between the membrane and Na+.
Given that the pKa of 2,6-DHTA is 1.19 (calculated from Marvin 23.7.0, ChemAxon, Budapest, Hungary), this indicates that each 2,6-DHTA adsorbed on the membrane surface will dissociate a H+ in solution, thus becoming negatively charged. Although TDAB dissociates Br⁻ in a solution and is a positively charged lipid, based on the absolute voltage values of taste sensors measured in the reference solutions discussed in this section (Vr in Figure 4), we observed that sensors exhibiting this trend have stable absolute voltage values significantly below 0 mV (e.g., the absolute voltage values for the four sensors containing 0.1 mM TDAB lipids are approximately −45, −49, −50, and −60 mV; the sensor containing 0.3 mM TDAB lipids modified with 0.03 wt% 2,6-DHTA aqueous solution has a value of approximately −38 mV).
Research [39] shows H+ ions are dissociated from lipid/polymer membranes with increasing Na+ concentration at low pH, where most H+ ions are bound with the membrane. In the case of Figure 5a,b, Na+, which is a counter ion of MSG, can be considered to induce the dissociation of H+ from the membranes in a similar way. Therefore, the membrane potential shifts towards the negative direction when measuring MSG solutions ranging from 0.1 to 3 mM. Further increase in MSG concentration leads to a positive shift in the taste sensor’s response values due to the screening effect caused by associated Na+ [39]. As a result, the changes in the surface charge density of these negatively charged membranes are primarily driven by variations in Na+ concentration rather than interactions between modifiers and MSG. Therefore, such electrodes are unsuitable for detecting MSG.
On the other hand, in Figure 5b,c, certain sensors exhibited a response that increases with MSG concentration. These sensors have stable absolute voltage values close to or above 0 mV (e.g., the absolute voltage values for the remaining three sensors containing 0.3 mM TDAB lipids are approximately 75, 70, and −5 mV, while the sensors containing 1 mM TDAB lipids have absolute voltage values of approximately 109, 85, 89, and 50 mV). In these membranes, Na+ ions are repelled from approaching the membrane surface due to the positive charges generated by the dissociation of TDAB. In contrast, the negatively charged dissociated MSG molecules form intramolecular H-bonds with 2,6-DHTA on the membrane surface [36,37]. This process involves the participation of H+ ions from the MSG solution, leading to the return of H+ ions to the membrane surface. The return of H+ ions alters the charge density on the membrane surface. As a result, the taste sensor’s response to MSG increases positively with the rising concentration of MSG in the solution, showing a positive correlation between sensor sensitivity and sample concentration. In summary, a TDAB lipid concentration of 1 mM is more suitable for MSG detection compared to other lipid concentrations.
However, the sensitivity of this type of sensor is limited by the quantity of modifiers adsorbed on the electrode membrane surface. This means that when measuring solutions with high sample concentrations, the sensor’s response tends to reach saturation. For example, the taste sensor with a 1 mM TDAB lipid/polymer membrane modified with 0.03 wt% 2,6-DHTA shows a response that gradually saturates when measuring MSG solutions exceeding 300 mM [36]. To further enhance the sensor’s sensitivity, it is necessary to increase the amount of 2,6-DHTA adsorbed on the membrane surface, which can be achieved by using a higher mass fraction of 2,6-DHTA solution for membrane surface modification. This will be further discussed in the next section.

3.2. Comparison and Discussion of Experimental Results from Taste Sensors and UV/Vis Spectrophotometer

We recorded the UV/Vis absorption spectra of the 2,6-DHTA THF solution at mass fractions of 0.003 and 0.03 wt% to identify its characteristic absorption peak, as shown in Figure 6a. The UV/Vis absorption spectra data of the 2,6-DHTA THF solutions with a mass fraction of 0.003 and 0.03 wt% is shown in Table 2. The maximum absorption peaks of the 0.003 and 0.03 wt% 2,6-DHTA THF solutions were observed at a wavelength of 341.5 and 341 nm (analyzed from UVProbe 2.71, SHIMADZU Co., Kyoto, Japan). Additionally, the absorption spectra of the 1 mM TDAB lipid/polymer membrane modified using 0.003 and 0.03 wt% 2,6-DHTA solutions are shown in Figure 6b. The analyzed values are presented in Table 3. Their respective absorption peak wavelengths were 344 and 345 nm. These results indicated that the characteristic absorption peak wavelength of 2,6-DHTA is approximately within the range of 341 to 345 nm and varies depending on the mass fraction of 2,6-DHTA in the solution.
In Table 3, the absorbance area of the membranes treated with 0.03 wt% 2,6-DHTA, i.e., 12.451 nm, is larger than that of the membranes treated with 0.003 wt% 2,6-DHTA, with values of 0.64 nm. This indicates that to some extent, the higher the mass fraction of the 2,6-DHTA modifier solution used for membrane surface modification, the more 2,6-DHTA adsorbed on the 1 mM TDAB lipid/polymer membrane.
Figure 7a,b show the relationship between MSG concentration and the electric response of the taste sensor modified with 0.003 and 0.03 wt% 2,6-DHTA, respectively. This relationship is fitted using a curve model: y = k log(x) + b, where y represents the response value of the taste sensor, x represents the concentration of MSG, and k represents the increase in sensor response for every tenfold increase in MSG concentration. For the sensors modified with 0.03 wt% 2,6-DHTA solution, k is 36.29 mV/10 mM, which is higher than the value of 6.79 mV/10 mM for the sensors modified with 0.003 wt% 2,6-DHTA. A comparison of the sensor sensitivity with the UV/Vis absorption spectra data in Table 3 clearly shows that the sensor with a higher amount of 2,6-DHTA adsorbed on the 1 mM TDAB lipid/polymer membrane exhibits greater sensitivity to MSG.
At this point, it is evident that within a certain range, using a higher mass fraction of the modifier solution can effectively increase the amount of modifier adsorbed on the membrane surface. The more modifier adsorbed, the higher the sensor’s sensitivity to MSG. Based on this, a set of 0.3 wt% 2,6-DHTA-modified taste sensors were utilized for MSG detection. The relationship between the sensors’ response values and MSG concentration is shown in Figure 7c. For the sensor modified with 0.3 wt% 2,6-DHTA solution, k is 51.32 mV/10 mM, which is higher than the values of 36.29 and 6.79 mV/10 mM for the sensors modified with 0.003 and 0.03 wt% 2,6-DHTA solutions, respectively. In conclusion, the mass fractions of 0.03 and 0.3 wt% 2,6-DHTA are relatively suitable for membrane surface modification in MSG measurements.
However, simply increasing the mass fraction of the modifier solution cannot continuously increase the amount of modifier adsorbed on the membrane surface. This suggests that there is a limit to the amount of modifier adsorbed per unit area on the lipid/polymer membrane surface used for MSG detection. This will be discussed in Section 3.4.

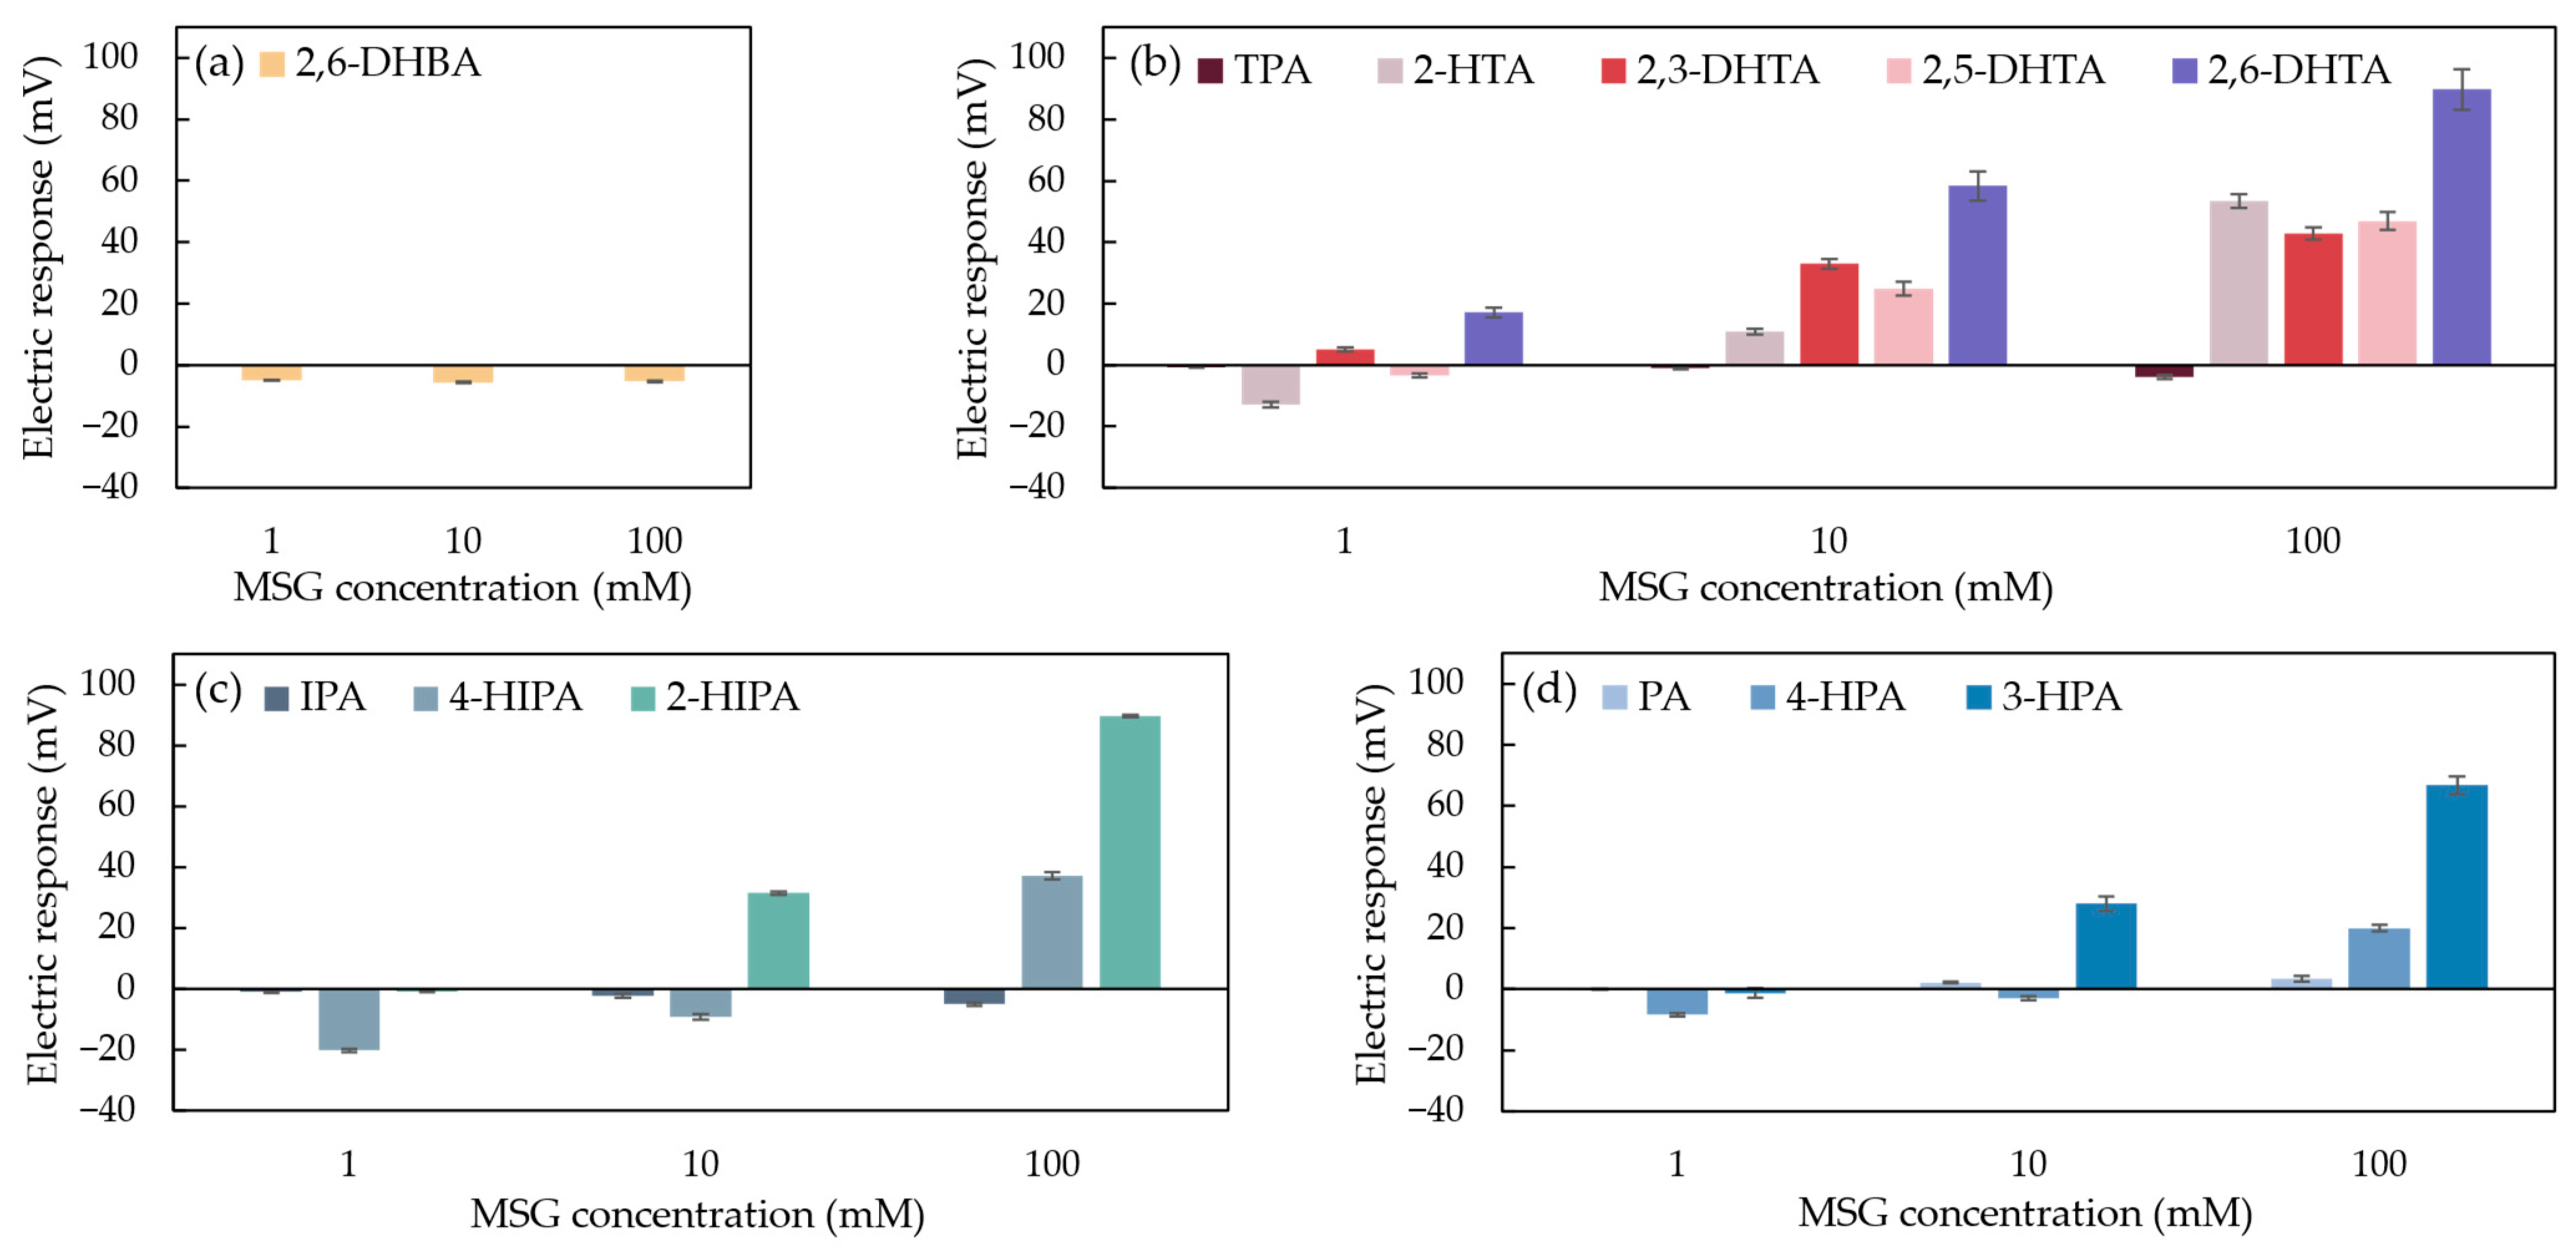
3.3. Detection of Umami Substance Using Taste Sensors Treated with Structurally Different Modifiers

To explore the relationship between sensor sensitivity and the chemical structure of modifiers for umami substance detection, three types of benzenedicarboxylic acid (including 11 modifiers with different chemical structures) and 2,6-DHBA as a negative control were used to prepare 0.03 wt% solutions for modifying the 1 mM TDAB lipid/polymer membranes for MSG detection. The responses of MSG measured by the taste sensor modified with 12 structurally distinct modifiers were shown in Figure 8.
In Figure 8a, the taste sensor modified with 2,6-DHBA shows a negligible response to MSG. This indicates that the structure of 2,6-DHBA, which contains only one carboxyl group on its benzene ring, cannot form a stable interaction with MSG, thus failing to induce a change in the membrane potential [37]. Although the sensor modified with this modifier is able to detect caffeine [38], the fact that 2,6-DHBA cannot be used independently for MSG detection suggests that the binding mechanism of the modifier with MSG differs from that with caffeine.
In Figure 8b, the taste sensors modified with 2-HTA, 2,3-DHTA, 2,5-DHTA, and 2,6-DHTA all show sensitivity to MSG, and the response values increase with the rising MSG concentration. This indicates that these four modifiers exhibit concentration-dependent characteristics with respect to MSG. In contrast, TPA shows negligible responses to MSG. By comparing their chemical structures, we observe that although they all have carboxyl groups at the para positions of the benzene ring, they differ in the number and position of hydroxyl groups on the benzene ring. Research has shown that the hydroxyl group on the benzene ring can form an intramolecular H-bond with the adjacent carboxyl group [40,41]. 2-HTA contains one intramolecular H-bond, and its response value (i.e., 53.3 mV) to 100 mM MSG is lower than that of 2,6-DHTA (i.e., 89.8 mV). 2,3-DHTA and 2,5-DHTA each have a hydroxyl group next to the carboxyl group, and this carboxyl group is positioned at the para position relative to the other carboxyl group. However, the dissociation constants (pKa) of the carboxyl group at the para position are 3.11 and 3.08, respectively (calculated from Marvin 23.7.0, ChemAxon, Budapest, Hungary). This means that in the reference solution, most of the molecules contain only one intramolecular H-bond. The response values of these sensors to 100 mM MSG (42.8 mV and 46.9 mV, respectively) are lower than that of 2,6-DHTA. This suggests that in modifiers with para substitution, the number of intramolecular H-bonds in the modifier molecules affects the taste sensor’s sensitivity to MSG.
Similarly, in Figure 8c, the taste sensors modified with 4-HIPA and 2-HIPA both show sensitivity to MSG, with the sensor modified with 2-HIPA exhibiting a response of 89.6 mV to 100 mM MSG, higher than the response of the 4-HIPA-modified sensor (37.2 mV). In contrast, the sensor modified with IPA shows a negligible response to MSG. This suggests that the intramolecular H-bonds of the modifier also influence the taste sensor’s sensitivity to MSG. Furthermore, through 1H-NMR measurements, we hypothesized that the two carboxyl groups of 2,6-DHTA can form intermolecular H-bonds with the two carboxyl groups of MSG, ultimately altering the membrane surface charge density [37]. For taste sensors modified with modifiers containing meta substituents, the carboxyl groups of modifiers at the meta position of the benzene ring may also form intermolecular H-bonds with the carboxyl groups of MSG, thus affecting the membrane surface charge density.
In Figure 8d, the response value of the taste sensor modified with PA to MSG is negligible. In contrast, the taste sensor modified with 4-HPA shows sensitivity to MSG, with a response value of 20 mV to 100 mM MSG sample solution. The structural difference between these two modifiers is that 4-HPA contains a hydroxyl group at the para position relative to one of its carboxyl groups. This indicates that the binding mechanism of ortho-substituted modifiers mentioned in this study with MSG differs from that of meta- and para-substituted benzenedicarboxylic acids mentioned in this study. Specifically, the hydroxyl group, which serves as a proton donor, is involved in interactions with MSG. Additionally, the sensor modified with 3-HPA exhibits a response value of 66.8 mV to 100 mM MSG, which is higher than that of the sensor modified with 4-HPA. The hydroxyl group of 3-HPA is positioned at the meta position relative to one of its carboxyl groups and can form an intramolecular H-bond with another carboxyl group adjacent to it [40,41], resulting in a higher number of intramolecular H-bonds than 4-HPA. These findings indicate that the intramolecular H-bonds of the modifier influence the sensitivity of taste sensors to MSG. Both 4-HPA- and 3-HPA-modified taste sensors are sensitive to MSG. We speculated that when these modifiers are adsorbed onto the sensor electrode membrane and the reference solution is measured, the pH of the reference solution is higher than the pKa of the modifiers (the pKa of 4-HPA is 2.87; the pKa of 3-HPA is 2.04, calculated from Marvin 23.7.0, ChemAxon, Budapest, Hungary), leading to the dissociation of H+ from the carboxyl group. When the sensors measure MSG solutions, the hydroxyl groups of 4-HPA and 3-HPA can form intermolecular H-bonds with the carboxyl groups of MSG. Additionally, the carboxyl groups of 4-HPA and 3-HPA, positioned at the para or meta positions relative to their hydroxyl groups, can form intermolecular H-bonds with another carboxyl group of MSG. This process causes H+ to return to the membrane surface to participate in H-bond formation, leading to changes in the surface charge density of the membrane.
In summary, we utilized benzenedicarboxylic acids with ortho, meta, and para substituents to modify the lipid/polymer membranes of sensor electrodes. These modifiers differ in their chemical structures, and the taste sensors modified with these modifiers exhibited varying sensitivity to MSG. Based on their response values to MSG, we identified two structural conditions required for a modifier to respond to MSG: (1) having a carboxyl group or hydroxyl group at the para or meta position of the benzene ring, apart from the carboxyl group at the starting position of the substituent, and (2) the presence of intramolecular H-bonds, which significantly influence the sensitivity of the fabricated taste sensors to MSG.

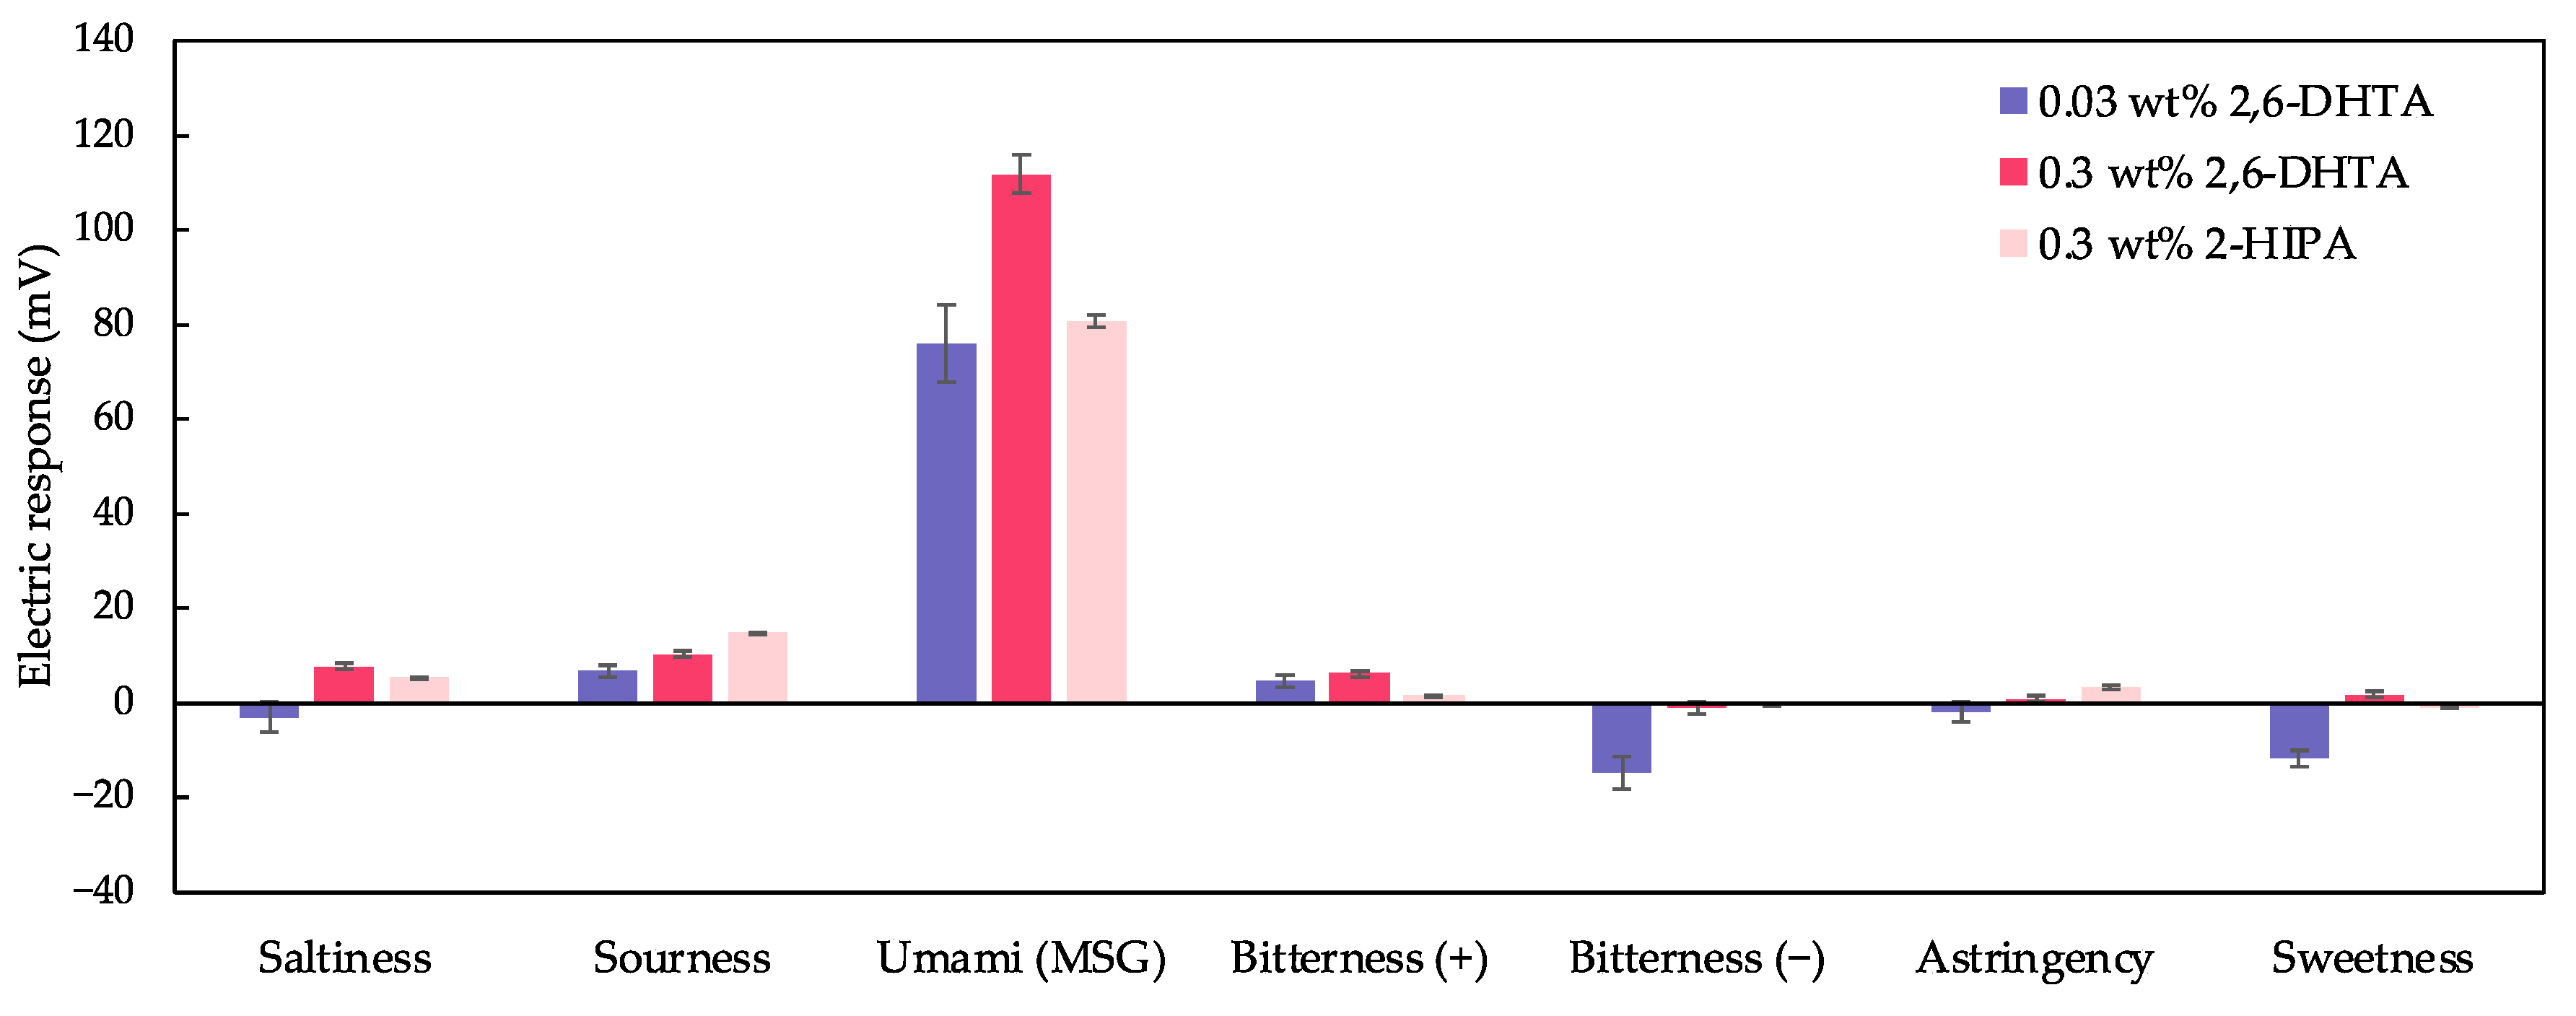
3.4. Selectivity Measurements for Different Taste Substances by 2,6-DHTA- and 2-HIPA-Treated Taste Sensors

In Section 3.2, we mentioned that increasing the mass fraction of the modifier solution can enhance the amount of 2,6-DHTA adsorbed onto the 1 mM TDAB membrane, thereby improving the taste sensor’s sensitivity to MSG. However, this is not the case for all modifiers. In Section 3.3, a sensor modified with 0.03 wt% 2-HIPA, which exhibited a response value of 89.6 mV to 100 mM MSG, was discussed. We prepared a 0.3 wt% 2-HIPA solution and used it to modify the sensor membrane. The MSG sample solutions were measured, and the results are shown in Figure 9.
The relationship between the response values of these two fabricated sensors and the MSG concentration were fitted with a curve model: y = k log(x) + b, where k represents the increase in sensor response per 10 mM increase in MSG concentration. It was found that the sensor modified with 0.03 wt% 2-HIPA had a k-value of 45.28 mV/10 mM, which was approximately the same as the k-value of 41.21 mV/10 mM for the sensor modified with 0.3 wt% 2-HIPA. This indicates that when the sensor electrodes are modified with 0.03 wt% 2-HIPA solutions, the amount of modifier on the membrane surface has already reached saturation. Consequently, using a higher concentration (0.3 wt%) 2-HIPA solution for membrane surface modification neither increases the adsorption of 2-HIPA nor enhances the sensor’s sensitivity to MSG.
We selected taste sensors modified with 0.3 wt% 2,6-DHTA and 2-HIPA for taste selectivity measurements and combined the taste selectivity data from the 0.03 wt% 2,6-DHTA-modified taste sensor in [36] to construct Figure 10. The sensor modified with 2,6-DHTA showed negligible or negative responses to all samples except for MSG. The sensor modified with 0.3 wt% 2-HIPA exhibited a response value of 14.8 mV to sour taste samples while also showing negligible responses to all other samples except MSG. This indicates that all three sensors are suitable for MSG detection, with the sensor modified with 0.3 wt% 2,6-DHTA showing the highest sensitivity to MSG, making it the most suitable for MSG detection. Additionally, as mentioned in [36], it is necessary to combine the sensor modified with 2,6-DHBA to effectively differentiate between umami substances and caffeine.

4. Conclusions

Previous studies have documented the sensitivity and selectivity of taste sensors treated with 2,6-DHTA, a type of para-substituted benzenedicarboxylic acid, for measuring umami substances (MSG and MSA). In this study, 11 types of benzenedicarboxylic acids (including ortho, meta, and para substituents) and 2,6-DHBA as a negative control were used for membrane surface modification to investigate the relationship between taste sensor sensitivity to MSG and the chemical structure of these modifiers. The results showed that 1 mM TDAB lipid/polymer membranes are suitable for MSG detection, and a mass fraction of 0.03 wt% is appropriate for membrane surface modification. Based on these findings, the study identified key chemical structural characteristics for MSG detection: the modifier needs to have a carboxyl or hydroxyl group at the para or meta position of the benzene ring, apart from the carboxyl group at the starting position of the substituent, and contain intramolecular H-bonds. Additionally, among these 12 modifiers, 2,6-DHTA and 2-HIPA are particularly suitable for MSG detection, showing the sensitivity and selectivity of the sensors modified with these two modifiers towards MSG. Future applications of these sensors will include investigating the umami synergy effect in IMP (inosine monophosphate) measurements. Additionally, the surface modification method will be applied to develop sensors that are sensitive to and selective for other specific taste substances.

Author Contributions

The work presented here was carried out as a collaboration among all authors. W.Y., S.O., J.J., T.O., R.Y., S.K. and K.T. defined the research theme; W.Y., S.O. and J.J. carried out the experiments and analyzed the data; W.Y. interpreted the results and wrote the paper; K.T., S.K., R.Y. and T.O. provided directions for the experimental methods, the analysis of data, the interpretation of the results, and the writing of the paper. All authors have contributed to, seen, and approved the manuscript. All authors have read and agreed to the published version of the manuscript.

Funding

This work was supported by JSPS KAKENHI Grant Number JP21H05006.

Institutional Review Board Statement

Not applicable.

Informed Consent Statement

Not applicable.

Data Availability Statement

Data are available on request.

Conflicts of Interest

The authors declare no conflicts of interest.

References

  1. Barlow, L.A. The Sense of Taste: Development, Regeneration, and Dysfunction. WIREs Mech. Dis. 2022, 14, e1517. [Google Scholar] [CrossRef]
  2. Finger, T.E.; Barlow, L.A. Cellular Diversity and Regeneration in Taste Buds. Curr. Opin. Physiol. 2021, 20, 146–153. [Google Scholar] [CrossRef] [PubMed]
  3. Shigemura, N.; Ninomiya, Y. Recent Advances in Molecular Mechanisms of Taste Signaling and Modifying. In International Review of Cell and Molecular Biology; Elsevier Inc.: London, UK, 2016; Volume 323, pp. 71–106. [Google Scholar]
  4. Chandrashekar, J.; Hoon, M.A.; Ryba, N.J.P.; Zuker, C.S. The Receptors and Cells for Mammalian Taste. Nature 2006, 444, 288–294. [Google Scholar] [CrossRef]
  5. Wang, W.; Zhou, X.; Liu, Y. Characterization and Evaluation of Umami Taste: A Review. TrAC Trends Analyt. Chem. 2020, 127, 115876. [Google Scholar] [CrossRef]
  6. Temussi, P.A. The Good Taste of Peptides. J. Pept. Sci. 2012, 18, 73–82. [Google Scholar] [CrossRef]
  7. Zhang, J.; Sun-Waterhouse, D.; Su, G.; Zhao, M. New Insight into Umami Receptor, Umami/Umami-Enhancing Peptides and Their Derivatives: A Review. Trends Food Sci. Technol. 2019, 88, 429–438. [Google Scholar] [CrossRef]
  8. Ikeda, K. New Seasonings. Chem. Senses 2002, 27, 847–849. [Google Scholar] [CrossRef]
  9. Nelson, G.; Chandrashekar, J.; Hoon, M.A.; Feng, L.; Zhao, G.; Ryba, N.J.P.; Zuker, C.S. An Amino-Acid Taste Receptor. Nature 2002, 416, 199–202. [Google Scholar] [CrossRef]
  10. Li, X.; Staszewski, L.; Xu, H.; Durick, K.; Zoller, M.; Adler, E. Human Receptors for Sweet and Umami Taste. Proc. Natl. Acad. Sci. USA 2002, 99, 4692–4696. [Google Scholar] [CrossRef]
  11. Wu, B.; Eldeghaidy, S.; Ayed, C.; Fisk, I.D.; Hewson, L.; Liu, Y. Mechanisms of Umami Taste Perception: From Molecular Level to Brain Imaging. Crit. Rev. Food Sci. Nutr. 2022, 62, 7015–7024. [Google Scholar] [CrossRef]
  12. Chaudhari, N.; Pereira, E.; Roper, S.D. Taste Receptors for Umami: The Case for Multiple Receptors. Am. J. Clin. Nutr. 2009, 90, 738S–742S. [Google Scholar] [CrossRef] [PubMed]
  13. San Gabriel, A.; Uneyama, H.; Yoshie, S.; Torii, K. Cloning and Characterization of a Novel MGluR1 Variant from Vallate Papillae That Functions as a Receptor for L-Glutamate Stimuli. Chem. Senses 2005, 30 (Suppl. S1), i25–i26. [Google Scholar] [CrossRef] [PubMed]
  14. Toyono, T.; Seta, Y.; Kataoka, S.; Kawano, S.; Shigemoto, R.; Toyoshima, K. Expression of Metabotropic Glutamate Receptor Group I in Rat Gustatory Papillae. Cell Tissue Res. 2003, 313, 29–35. [Google Scholar] [CrossRef]
  15. Bystrova, M.F.; Romanov, R.A.; Rogachevskaja, O.A.; Churbanov, G.D.; Kolesnikov, S.S. Functional Expression of the Extracellular-Ca2+-Sensing Receptor in Mouse Taste Cells. J. Cell Sci. 2010, 123, 972–982. [Google Scholar] [CrossRef]
  16. Gabrieli, G.; Muszynski, M.; Ruch, P.W. A Reconfigurable Integrated Electronic Tongue and Its Use in Accelerated Analysis of Juices and Wines. In Proceedings of the 2022 IEEE International Symposium on Olfaction and Electronic Nose (ISOEN), Aveiro, Portugal, 29 May–1 June 2022; pp. 1–3. [Google Scholar]
  17. Toko, K. A Taste Sensor. Meas. Sci. Technol. 1998, 9, 1919. [Google Scholar] [CrossRef]
  18. Kumar, S.; Ghosh, A. An Improved Fractional-Order Circuit Model for Voltammetric Taste Sensor System with Infused Tea as Analyte. IEEE Sens. J. 2020, 20, 7792–7800. [Google Scholar] [CrossRef]
  19. Campos, I.; Masot, R.; Alcañiz, M.; Gil, L.; Soto, J.; Vivancos, J.L.; García-Breijo, E.; Labrador, R.H.; Barat, J.M.; Martínez-Mañez, R. Accurate Concentration Determination of Anions Nitrate, Nitrite and Chloride in Minced Meat Using a Voltammetric Electronic Tongue. Sens. Actuators B Chem. 2010, 149, 71–78. [Google Scholar] [CrossRef]
  20. Sànchez, J.; Del Valle, M. A New Potentiometric Photocurable Membrane Selective to Anionic Surfactants. Electroanalysis 2001, 13, 471–476. [Google Scholar] [CrossRef]
  21. Lee, S.-M.; Jang, S.-W.; Lee’, S.-H.; Kim, J.-H.; Kim, S.-H.; Kang, S.-W. Measurement of Basic Taste Substances by a Fiber Optic Taste Sensor Using Evanescent Field Absorption. Sens. Mater. 2002, 4, 11–21. [Google Scholar]
  22. Tian, Y.; Wang, P.; Du, L.; Wu, C. Advances in Gustatory Biomimetic Biosensing Technologies: In Vitro and in Vivo Bioelectronic Tongue. TrAC Trends Analyt. Chem. 2022, 157, 116778. [Google Scholar] [CrossRef]
  23. Fan, Y.; Chen, W.; Zhang, N.; Li, M.; Zhu, Y.; Chen, G.; Zhang, Y.; Liu, Y. Umami Taste Evaluation Based on a Novel Mouse Taste Receptor Cell-Based Biosensor. Biosens. Bioelectron. 2023, 237, 115447. [Google Scholar] [CrossRef] [PubMed]
  24. Wu, X.; Tahara, Y.; Yatabe, R.; Toko, K. Taste Sensor: Electronic Tongue with Lipid Membranes. Anal. Sci. 2020, 36, 147–159. [Google Scholar] [CrossRef] [PubMed]
  25. Ismail, I.; Hwang, Y.-H.; Joo, S.-T. Low-Temperature and Long-Time Heating Regimes on Non-Volatile Compound and Taste Traits of Beef Assessed by the Electronic Tongue System. Food Chem. 2020, 320, 126656. [Google Scholar] [CrossRef] [PubMed]
  26. Li, Y.; Bi, J.; Lin, Z.; Yang, Z.; Gao, Y.; Ping, C.; Chen, Z. Mining of Kokumi Peptides in Chicken Broth with Peptidomics. Int. J. Gastron. Food Sci. 2023, 32, 100693. [Google Scholar] [CrossRef]
  27. Nodake, K.; Numata, M.; Kosai, K.; Kim, Y.J.; Nishiumi, T. Evaluation of Changes in the Taste of Cooked Meat Products During Curing Using an Artificial Taste Sensor. Anim. Sci. J. 2013, 84, 613–621. [Google Scholar] [CrossRef]
  28. Fujimoto, H.; Narita, Y.; Iwai, K.; Hanzawa, T.; Kobayashi, T.; Kakiuchi, M.; Ariki, S.; Wu, X.; Miyake, K.; Tahara, Y. Bitterness Compounds in Coffee Brew Measured by Analytical Instruments and Taste Sensing System. Food Chem. 2021, 342, 128228. [Google Scholar] [CrossRef]
  29. Zhang, H.; Zou, G.; Liu, W.; Zhou, Z. Beer Taste Detection Based on Electronic Tongue. Sens. Mater. 2020, 32, 2949–2958. [Google Scholar] [CrossRef]
  30. Uchiyama, Y.; Yamashita, M.; Kato, M.; Suzuki, T.; Omori, M.; Chen, R. Evaluation of the Taste of Tea with Different Degrees of Fermentation Using a Taste Sensing System. Sens. Mater. 2011, 23, 501–506. [Google Scholar] [CrossRef]
  31. Liu, R.; Gao, X.; Wang, J.; Dai, L.; Kang, B.; Zhang, L.; Shi, J.; Gui, X.; Liu, P.; Li, X. Traditional Human Taste Panel and Taste Sensors Methods for Bitter Taste Masking Research on Combined Bitterness Suppressants of Berberine Hydrochloride. Sens. Mater. 2017, 29, 105–116. [Google Scholar] [CrossRef]
  32. Kojima, H.; Kurihara, T.; Yoshida, M.; Haraguchi, T.; Nishikawa, H.; Ikegami, S.; Okuno, T.; Yamashita, T.; Nishikawa, J.; Tsujino, H.; et al. A New Bitterness Evaluation Index Obtained Using the Taste Sensor for 48 Active Pharmaceutical Ingredients of Pediatric Medicines. Chem. Pharm. Bull. 2021, 69, 537–547. [Google Scholar] [CrossRef]
  33. Uchida, T. Taste Sensor Assessment of Bitterness in Medicines: Overview and Recent Topics. Sensors 2024, 24, 4799. [Google Scholar] [CrossRef]
  34. Haraguchi, T.; Uchida, T.; Yoshida, M.; Kojima, H.; Habara, M.; Ikezaki, H. The Utility of the Artificial Taste Sensor in Evaluating the Bitterness of Drugs: Correlation with Responses of Human TASTE2 Receptors (HTAS2Rs). Chem. Pharm. Bull. 2018, 66, 71–77. [Google Scholar] [CrossRef] [PubMed]
  35. Iiyama, S.; Kuga, H.; Ezaki, S.; Hayashi, K.; Toko, K. Peculiar Change in Membrane Potential of Taste Sensor Caused by Umami Substances. Sens. Actuators B Chem. 2003, 91, 191–194. [Google Scholar] [CrossRef]
  36. Yuan, W.; Zhao, Z.; Kimura, S.; Toko, K. Development of Taste Sensor with Lipid/Polymer Membranes for Detection of Umami Substances Using Surface Modification. Biosensors 2024, 14, 95. [Google Scholar] [CrossRef]
  37. Yuan, W.; Ide, H.; Zhao, Z.; Koshi, M.; Kimura, S.; Matsui, T.; Toko, K. Investigating the Mechanism Underlying Umami Substance Detection in Taste Sensors by Using 1H-NMR Analysis. Chemosensors 2024, 12, 146. [Google Scholar] [CrossRef]
  38. Yoshimatsu, J.; Toko, K.; Tahara, Y.; Ishida, M.; Habara, M.; Ikezaki, H.; Kojima, H.; Ikegami, S.; Yoshida, M.; Uchida, T. Development of Taste Sensor to Detect Non-Charged Bitter Substances. Sensors 2020, 20, 3455. [Google Scholar] [CrossRef]
  39. Träuble, H.; Teubner, M.; Woolley, P.; Eibl, H. Electrostatic Interactions at Charged Lipid Membranes: I. Effects of Ph and Univalent Cations on Membrane Structure. Biophys. Chem. 1976, 4, 319–342. [Google Scholar] [CrossRef]
  40. Zhang, T.; Liu, F.; Chen, W.; Wang, J.; Li, K. Influence of Intramolecular Hydrogen Bond of Templates on Molecular Recognition of Molecularly Imprinted Polymers. Anal. Chim. Acta. 2001, 450, 53–61. [Google Scholar] [CrossRef]
  41. Fiedler, P.; Böhm, S.; Kulhánek, J.; Exner, O. Acidity of Ortho-Substituted Benzoic Acids: An Infrared and Theoretical Study of the Intramolecular Hydrogen Bonds. Org. Biomol. Chem. 2006, 4, 2003–2011. [Google Scholar] [CrossRef]
Figure 1. The structural formula of 2,6-DHBA, PA, 4-HPA, 3-HPA, IPA, 4-HIPA, 2-HIPA, TPA, 2-HTA, 2,3-DHTA, 2,5-DHTA, 2,6-DHTA, and MSG. PA, 4-HPA, and 3-HPA are benzenedicarboxylic acids with ortho substituents. IPA, 4-HIPA, and 2-HIPA are benzenedicarboxylic acids with meta substituents. TPA, 2-HTA, 2,3-DHTA, 2,5-DHTA, and 2,6-DHTA are benzenedicarboxylic acids with para substituents. MSG is the umami substance utilized in this study.
Chemosensors 13 00098 g001
Figure 2. The fabrication procedure of the sensor electrodes. Steps 1 to 4 describe the preparation of lipid/polymer membranes and their attachment to the sensor electrodes; step 5 illustrates the process of membrane surface modification on the sensor electrodes.
Chemosensors 13 00098 g002
Figure 3. The taste sensing system and the structure of the sensor electrode and reference electrode. This taste sensing system can accommodate two sets of electrodes, with each set consisting of 1 reference electrode and 4 sensor electrodes. Both the sensor electrodes and the reference electrodes are equipped with a Ag wire coated with a layer of AgCl and filled with an internal solution containing 3.33 M KCl saturated with AgCl.
Chemosensors 13 00098 g003
Figure 4. The detection process of the taste sensors in this study. The red rhombi represent the modifiers adsorbed onto the lipid/polymer membrane. When the sensor is immersed in a solution containing taste substances, the taste substances capable of interacting with the modifiers approach the membrane and induce changes in the surface charge density.
Chemosensors 13 00098 g004
Figure 5. The response to MSG measured by the sensors modified with 2,6-DHTA at mass fractions of 0.001, 0.003, 0.01, and 0.03 wt%. The lipid/polymer membranes of these sensors contained TDAB lipids at concentration of (a) 0.1 mM, (b) 0.3 mM, (c) 1 mM, and (d) 3 mM. Error bars indicate the standard deviation (SD) of the data; n = 3 (electrode) × 3 (rotation) = 9 values.
Chemosensors 13 00098 g005
Figure 6. (a) The absorbance of 2,6-DHTA at a mass fraction of 0.003 and 0.03 wt% in THF. (b) The absorbance of 2,6-DHTA adsorbed on the lipid/polymer membrane after surface modification with 0.03 and 0.3 wt% 2,6-DHTA. The absorption spectra were measured using a UV/Vis spectrophotometer.
Chemosensors 13 00098 g006
Figure 7. The relationship between the MSG concentration and the electric response of the taste sensor modified with (a) 0.003, (b) 0.03, and (c) 0.3 wt% 2,6-DHTA. Error bars indicate the SD of the data; n = 4 (electrode) × 3 (rotation) = 12 values. The dotted lines represent the curve fitting based on MSG concentration values and electrical response values.
Chemosensors 13 00098 g007
Figure 8. The response of MSG measured by the taste sensor modified with 12 structurally distinct modifiers. The data for these modifiers were categorized into four groups: (a) 2,6-DHBA; (b) TPA, 2-HTA, 2,3-DHTA, 2,5-DHTA, and 2,6-DHTA; (c) IPA, 4-HIPA, and 2-HIPA; and (d) PA, 4-HPA, and 3-HPA. Error bars indicate the SD of the data; n = 4 (electrode) × 3 (rotation) = 12 values.
Chemosensors 13 00098 g008
Figure 9. The response of MSG measured by the taste sensor modified with 2-HIPA at a mass fraction of (a) 0.03 and (b) 0.3 wt%. Error bars indicate the SD of the data; n = 4 (electrode) × 3 (rotation) = 12 values. The dotted lines represent the curve fitting based on MSG concentration values and electrical response values.
Chemosensors 13 00098 g009
Figure 10. The response to the five basic tastes and astringency samples measured using taste sensors modified with 0.03, 0.3 wt% 2,6-DHTA and 0.3 wt% 2-HIPA. The data of the taste sensor modified with 0.03 wt% 2,6-DHTA are from [36]. Error bars indicate the SD of the data; n = 4 (electrode) × 3 (rotation) = 12 values.
Chemosensors 13 00098 g010
Table 1. Composition of five basic tastes and astringency sample.
SampleCompositionConcentration
SaltinessKCl300 mM
SournessTartaric acid3 mM
UmamiMSG100 mM
Bitterness (+)Quinine hydrochloride0.1 mM
Bitterness (−)Iso-α acid0.01 vol%
AstringencyTannic acid0.05 wt%
SweetnessSucrose1 M
Table 2. UV/Vis absorption spectra data of the 2,6-DHTA THF solutions with a mass fraction of 0.003 and 0.03 wt%.
AnalytesPeak Wavelength (nm)AbsorptionAbsorbance Area (nm)
0.003 wt% 2,6-DHTA341.50.2487.809
0.03 wt% 2,6-DHTA341.02.27678.547
Table 3. UV/Vis absorption spectra data of the 1 mM TDAB lipid/polymer membrane modified using 0.003 and 0.03 wt% 2,6-DHTA solutions.
AnalytesPeak Wavelength (nm)AbsorptionAbsorbance Area (nm)
Membranes treated with 0.003 wt% 2,6-DHTA344.00.0130.640
Membranes treated with 0.03 wt% 2,6-DHTA345.00.33012.451
Disclaimer/Publisher’s Note: The statements, opinions and data contained in all publications are solely those of the individual author(s) and contributor(s) and not of MDPI and/or the editor(s). MDPI and/or the editor(s) disclaim responsibility for any injury to people or property resulting from any ideas, methods, instructions or products referred to in the content.

