Method Validation and Determination of Ametryn Pesticide in Water Samples by QuEChERS-GC-MS

 , and
, and
Abstract
1. Introduction
2. Materials and Methods
2.1. Chemicals and Reagents
2.2. Sample Collection
2.3. QuEChERS Extraction
2.4. Gas Chromatography–Mass Spectrometry (GC-MS)
2.5. Method Validation
2.6. Determination of Matrix Effect
2.7. Concentration on Real Samples
3. Results and Discussion
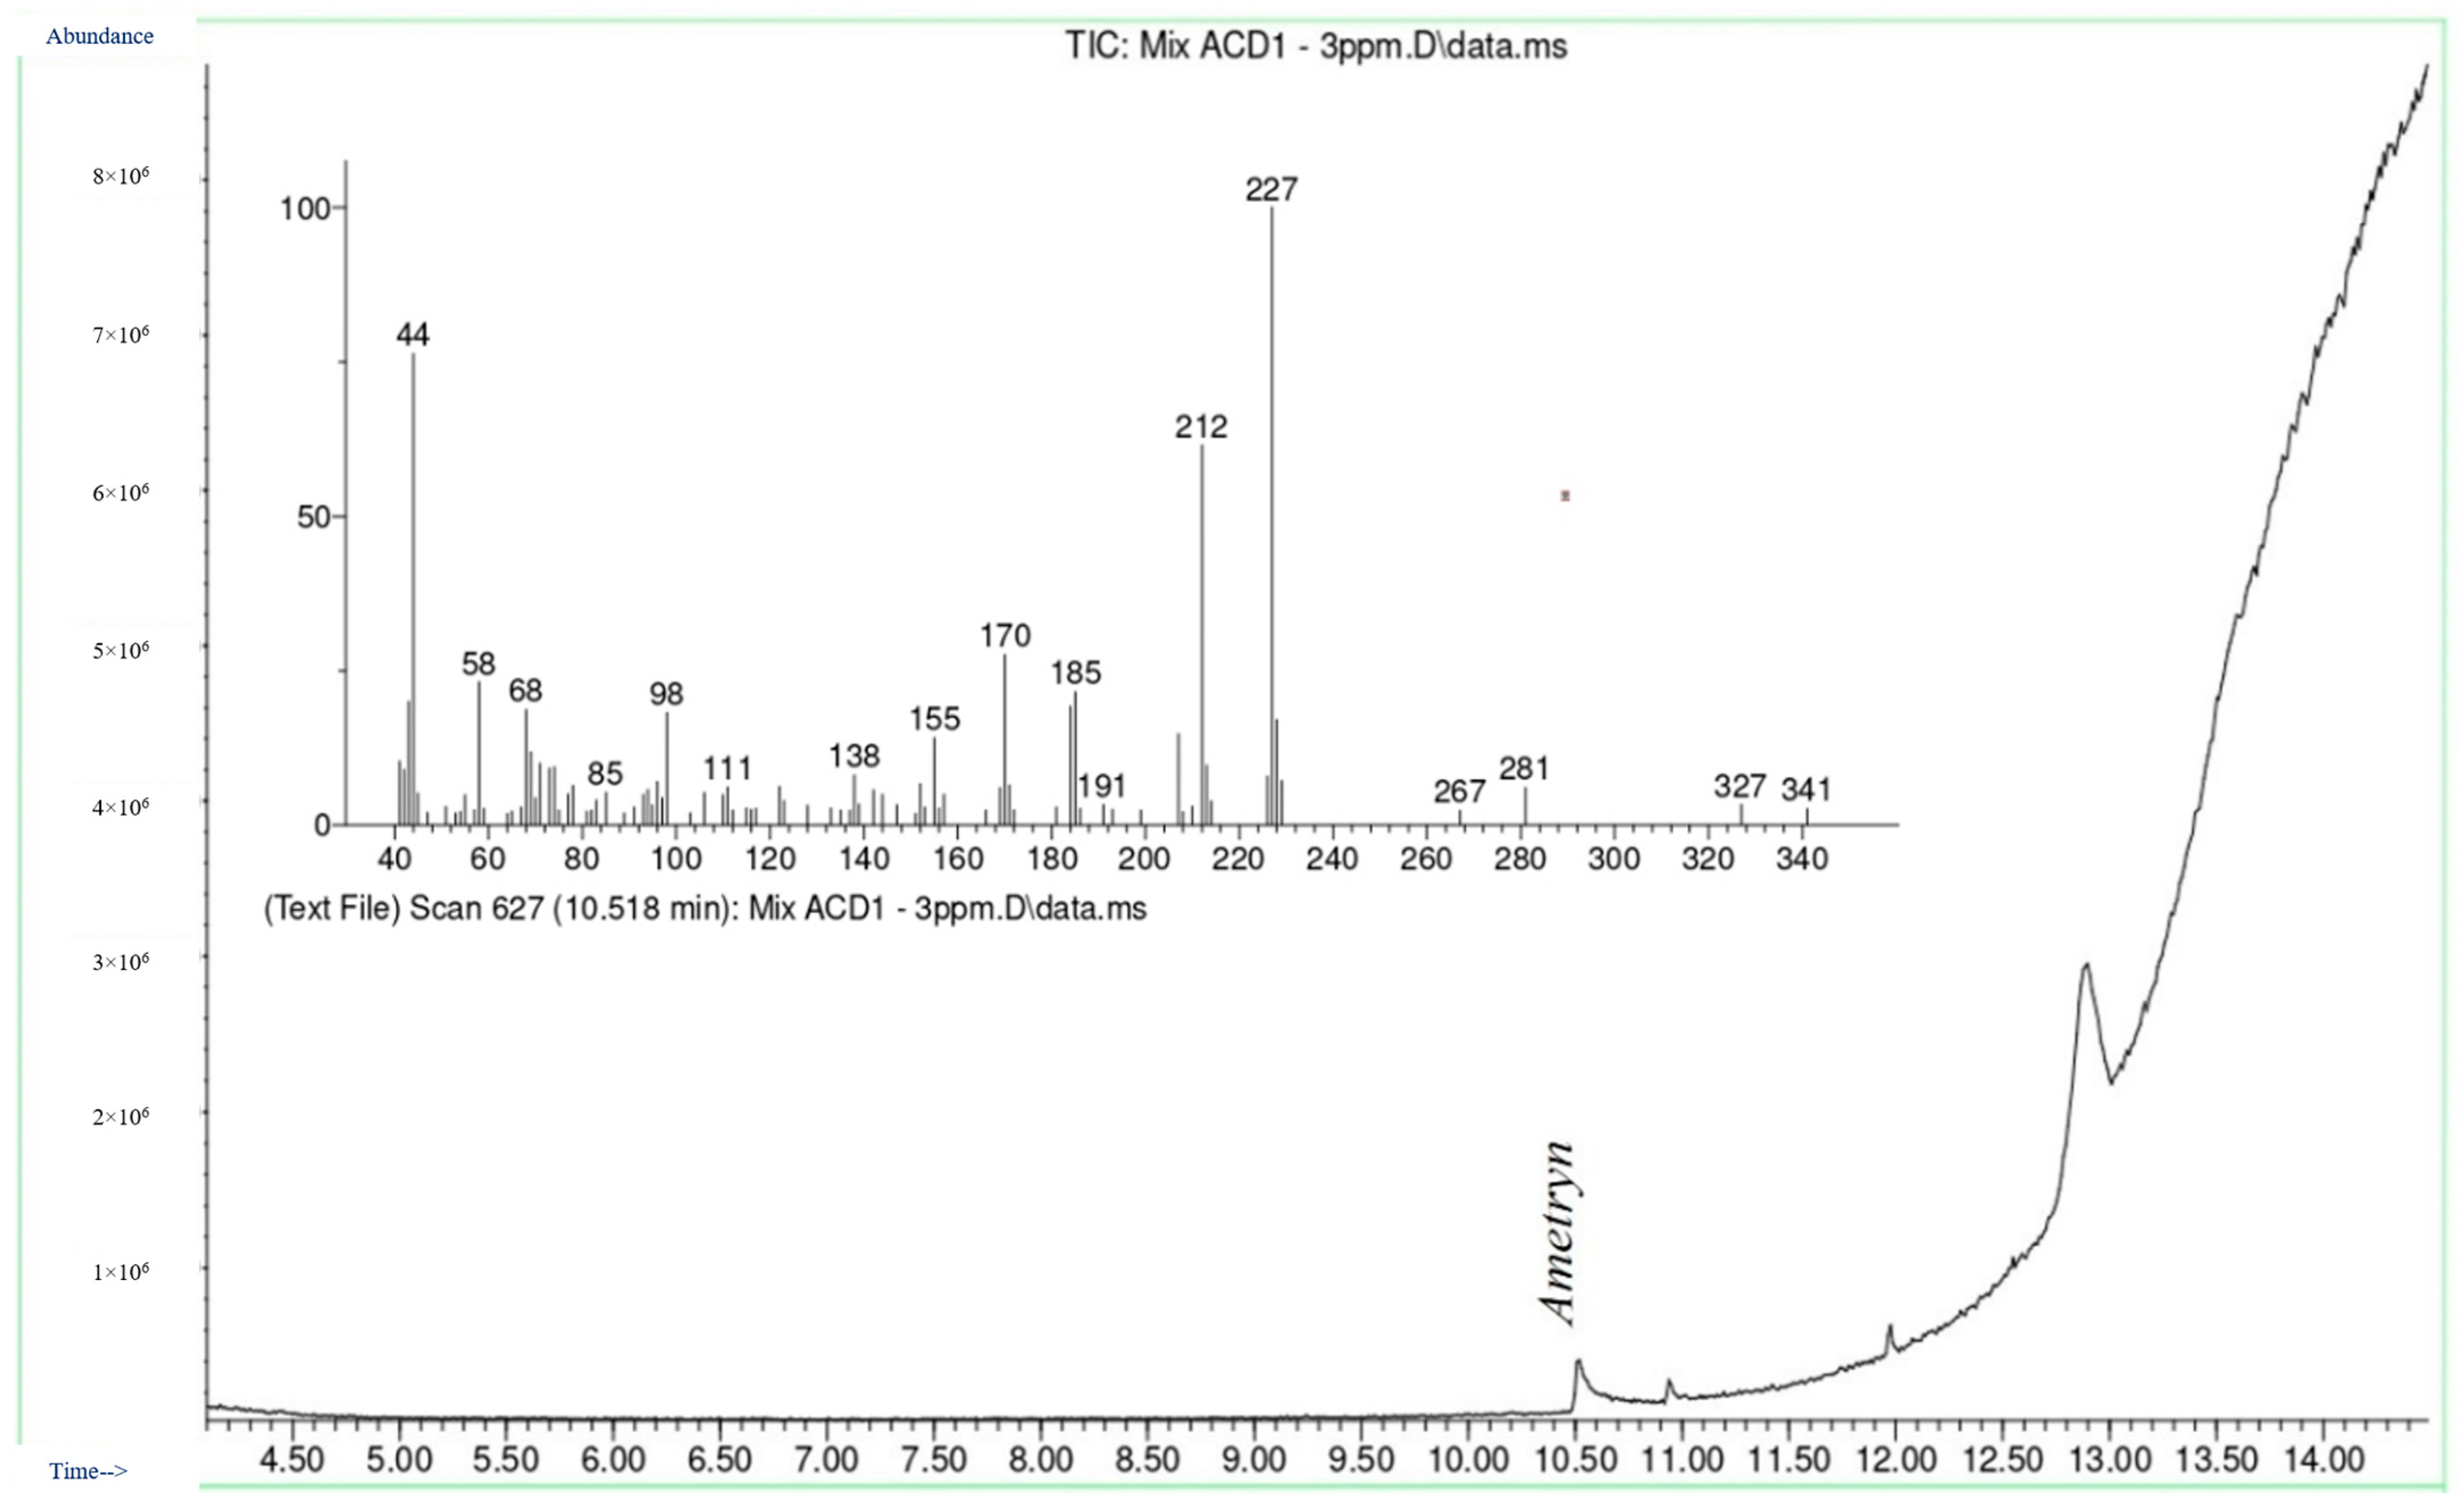
3.1. Chromatographic Analysis by GC-MS
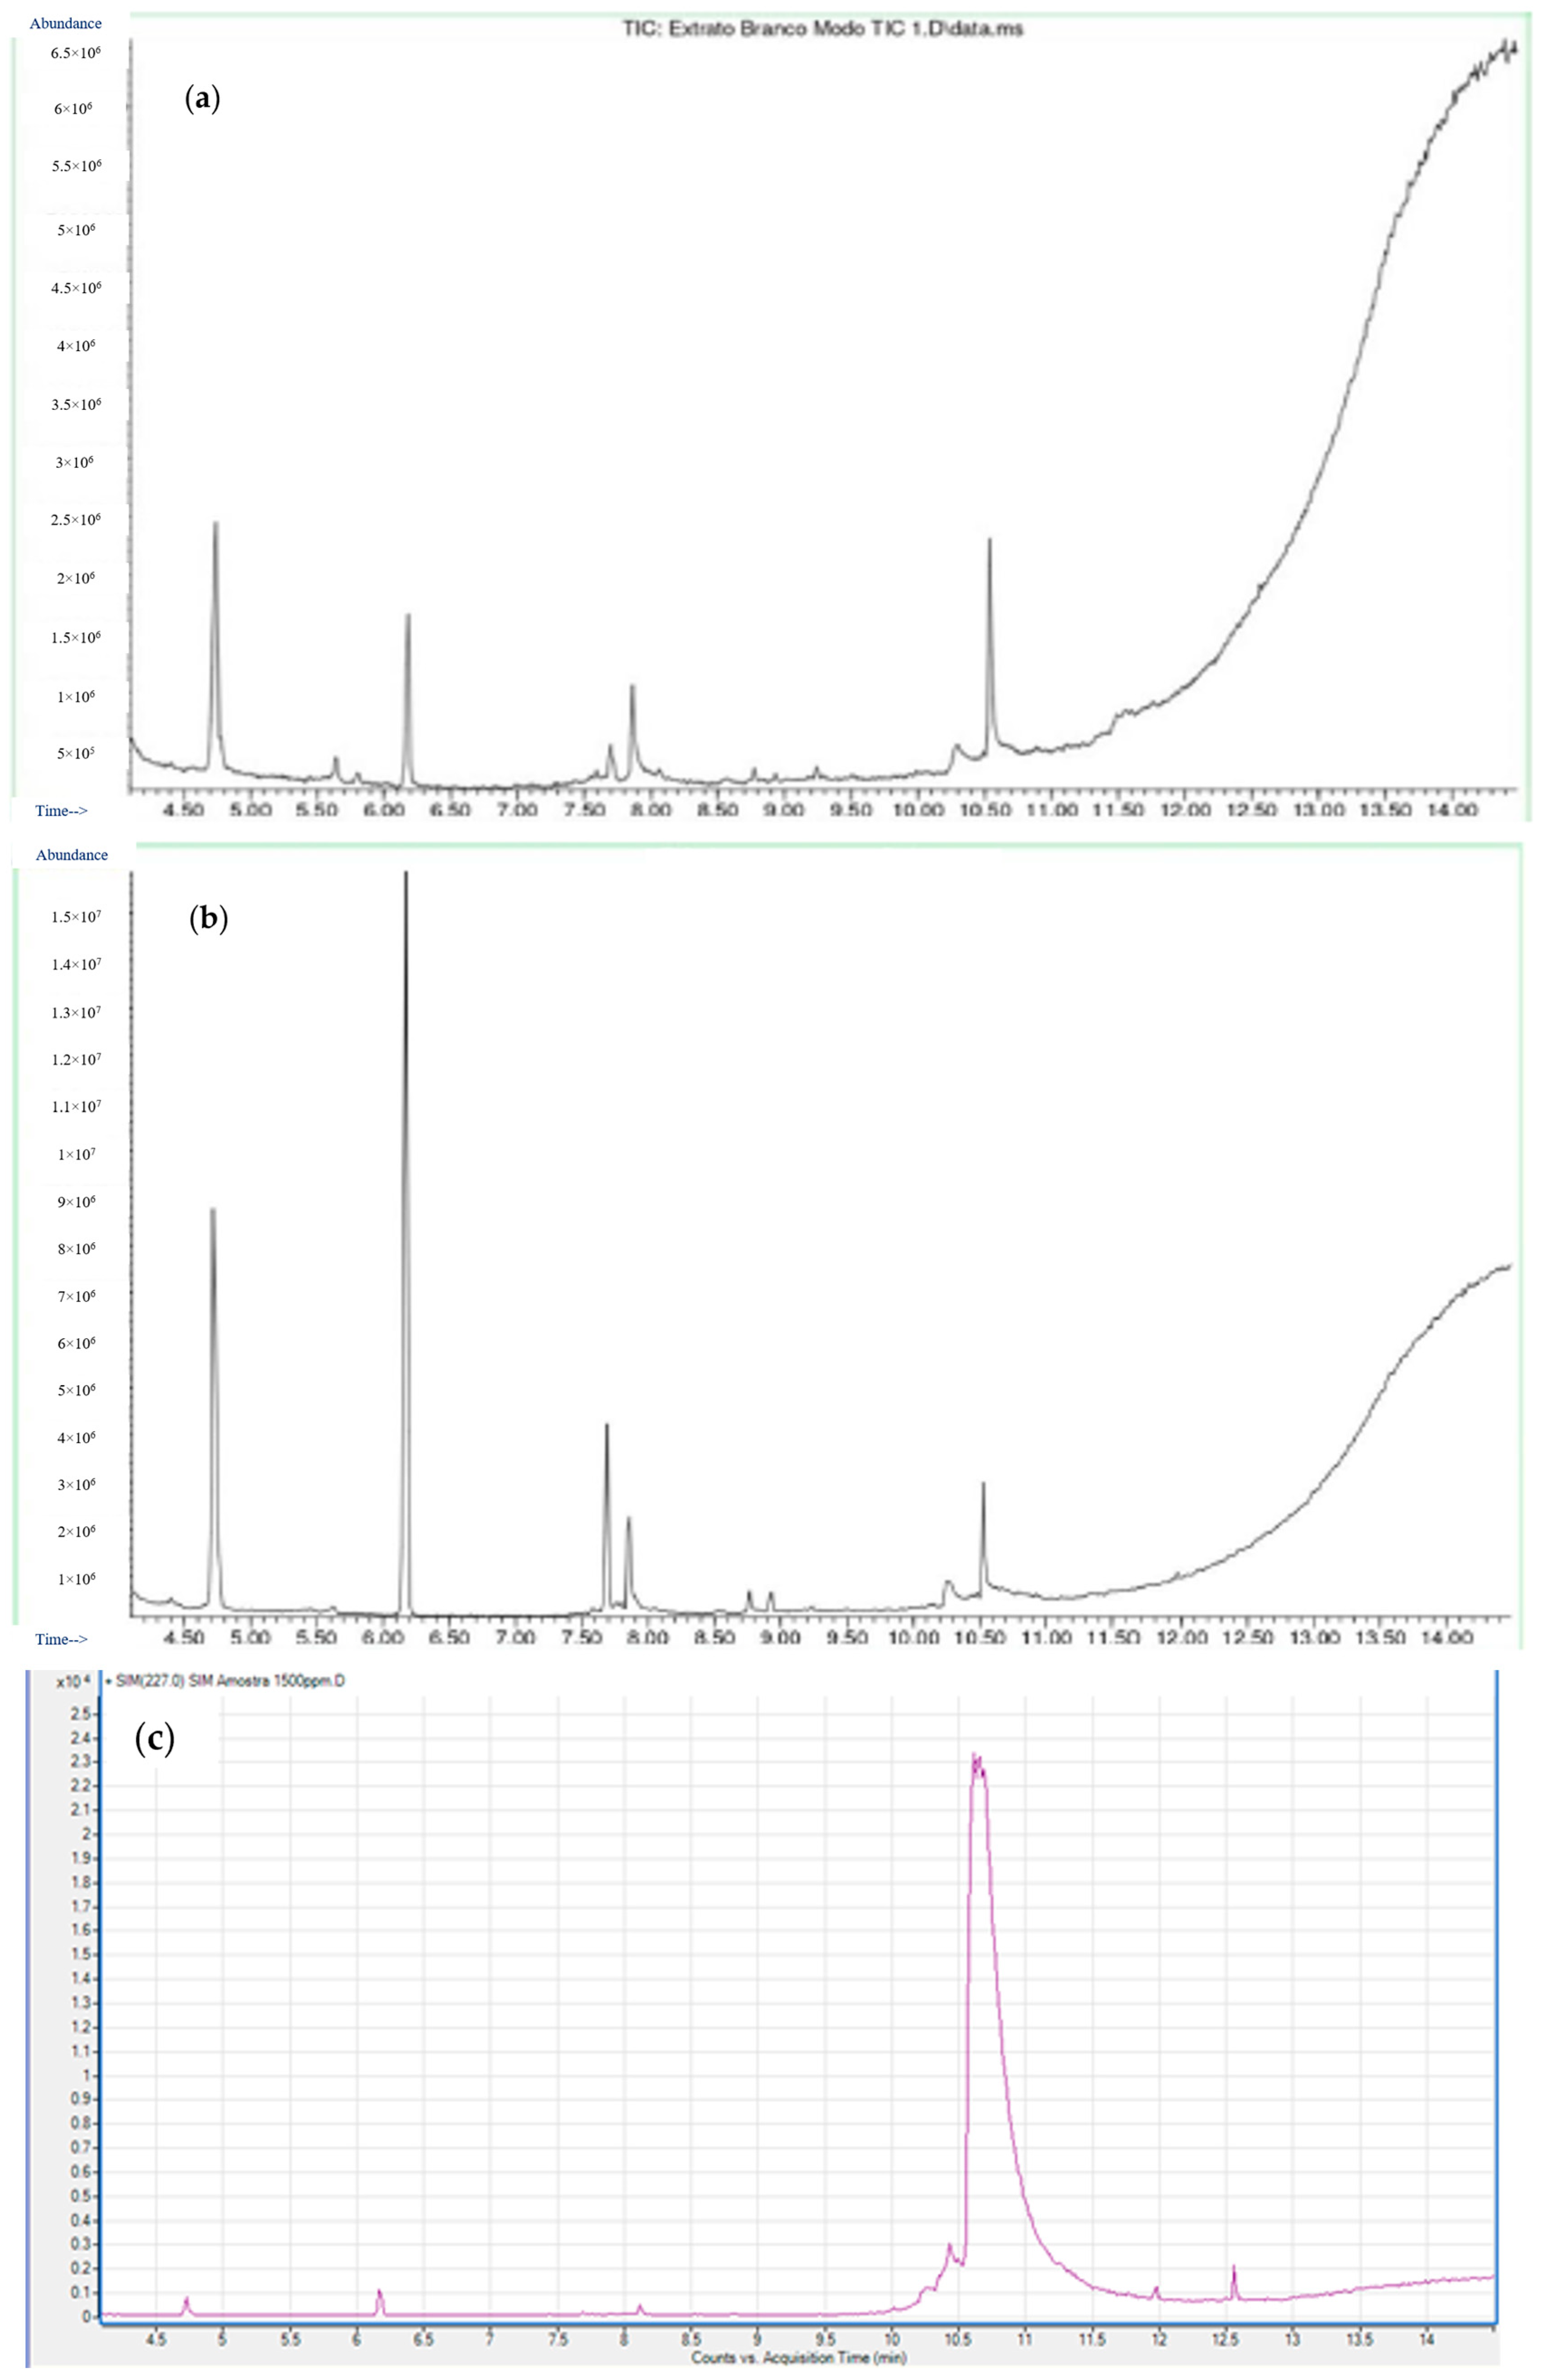
3.2. Selectivity
3.3. Linearity
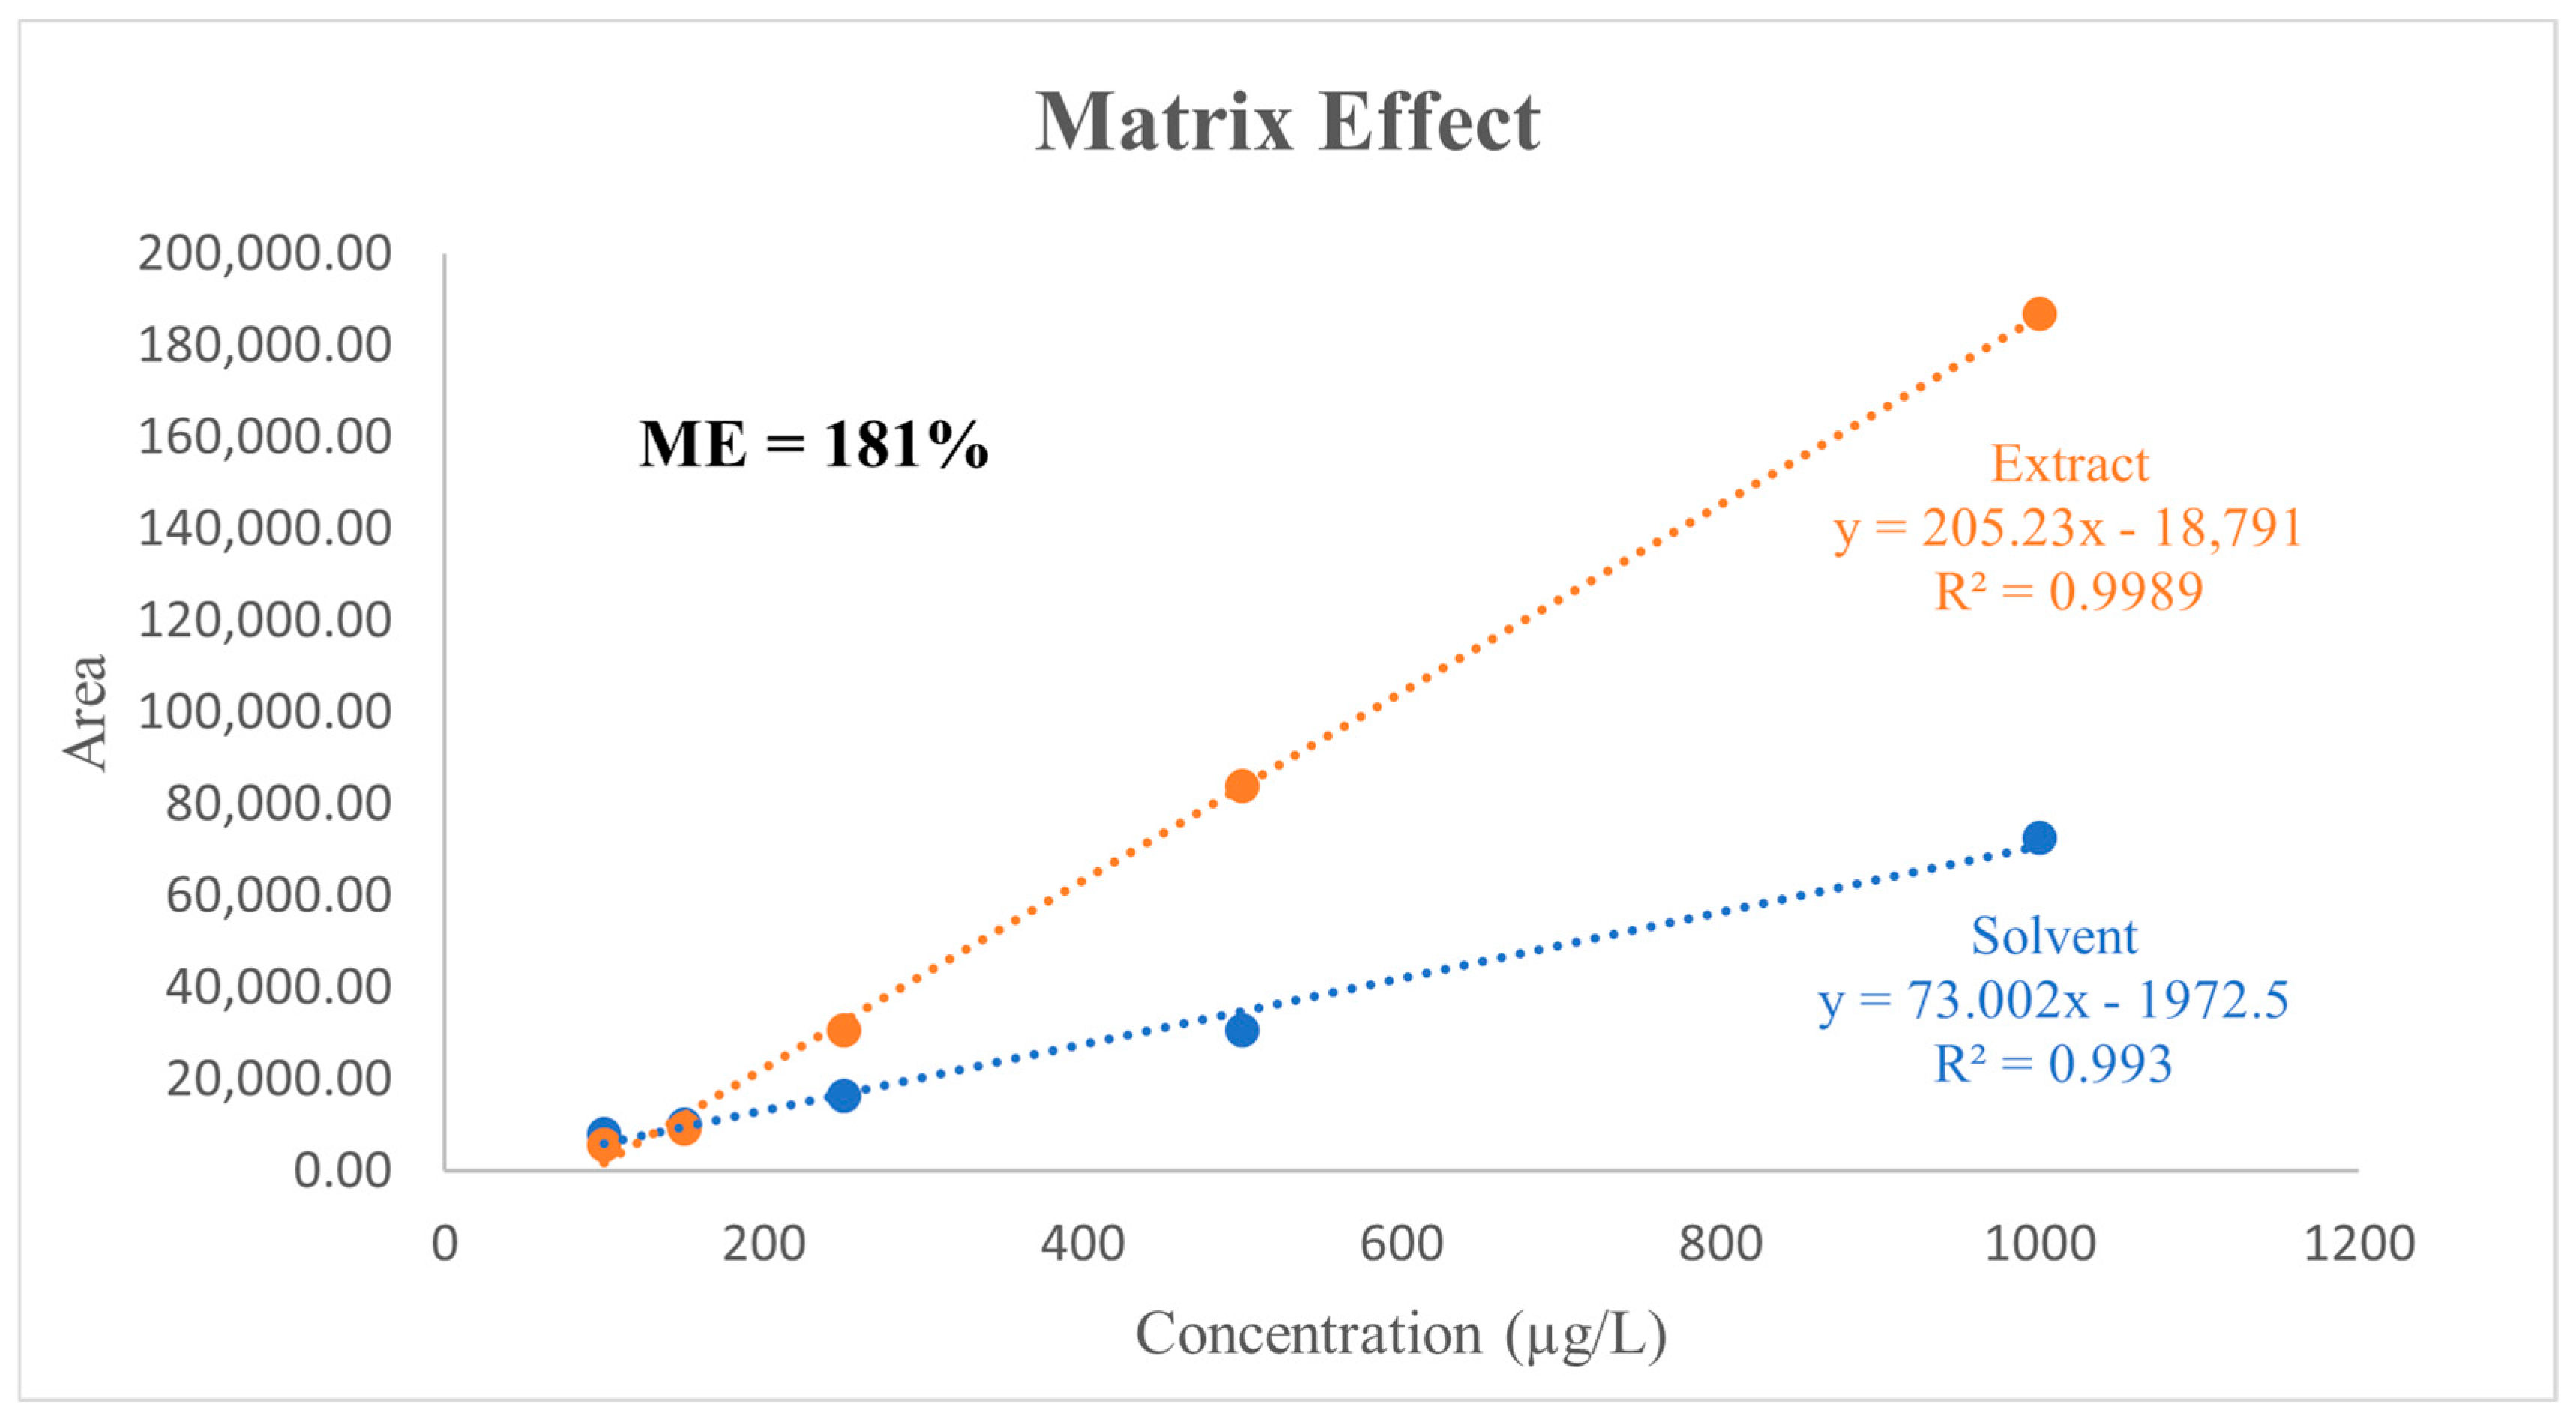
3.4. Matrix Effect
3.5. Sensitivity
3.6. Precision and Accuracy
3.7. Qualitative and Quantitative Analysis of Water Samples
4. Conclusions
Author Contributions
Funding
Data Availability Statement
Acknowledgments
Conflicts of Interest
References
- Shattar, S.F.A.; Zakaria, N.A.; Foo, K.Y. Utilization of montmorillonite as a refining solution for the treatment of ametryn, a second generation of pesticide. J. Environ. Chem. Eng. 2017, 5, 3235–3242. [Google Scholar] [CrossRef]
- Szewczyk, R.; Kuśmierska, A.; Bernat, P. Ametryn removal by Metarhizium brunneum: Biodegradation pathway proposal and metabolic background revealed. Chemosphere 2018, 190, 174–183. [Google Scholar] [CrossRef] [PubMed]
- Agência Nacional de Vigilância Sanitária. Participação Social. Available online: https://antigo.anvisa.gov.br/documents/10181/6243353/CONSULTA+P%C3%9ABLICA+N+1027+GGTOX.pdf/42006f98-70c0-47c6-991a-1bc2f78391e4 (accessed on 9 April 2024).
- Martins, F.C.; Souza, D. New Approaches in Electroanalytical Determination of Triazines-Based Pesticides in Natural Waters. Analytica 2023, 4, 84–101. [Google Scholar] [CrossRef]
- Boussouga, Y.A.; Sacher, F.; Schäfer, A.I. Water quality of The Gambia River: A prospective drinking water supply. Sci. Total Environ. 2023, 878, 162794. [Google Scholar] [CrossRef]
- Tsiantas, P.; Bempelou, E.; Dougla, M.; Karasali, H. Validation and Simultaneous Monitoring of 311 Pesticide Residues in Loamy Sand Agricultural Soils by LC-MS/MS and GC-MS/MS, Combined with QuEChERS-Based Extraction. Molecules 2023, 28, 4268. [Google Scholar] [CrossRef]
- Padhye, L.P.; Srivastava, P.; Jasemizad, T.; Bolan, S.; Hou, D.; Shaheen, S.M.; Rinklebe, J.; Connor, D.O.; Lamb, D.; Wang, H.; et al. Contaminant containment for sustainable remediation of persistent contaminants in soil and groundwater. J. Hazard. Mater. 2023, 455, 131575. [Google Scholar] [CrossRef]
- Vara, M.G.; Postigo, C.; Palma, P.; Bleda, M.J.; Alda, M.L. QuEChERS-based analytical methods developed for LC-MS/MS multiresidue determination of pesticides in representative crop fatty matrices: Olives and sunflower seeds. Food Chem. 2022, 386, 132558. [Google Scholar] [CrossRef]
- Kim, L.; Lee, D.; Cho, H.K.; Choi, S.D. Review of the QuEChERS method for the analysis of organic pollutants: Persistent organic pollutants, polycyclic aromatic hydrocarbons, and pharmaceuticals. Trends Environ. Anal. Chem. 2019, 22, e00063. [Google Scholar] [CrossRef]
- Anastassiades, M.; Lehotay, S.J.; Stajnbaher, D.; Schenck, F.J. Fast and easy multiresidue method employing acetonitrile extraction/partitioning and “dispersive solid-phase extraction” for the determination of pesticide residues in produce. J. AOAC Int. 2003, 86, 412–431. [Google Scholar] [CrossRef]
- Curbelo, M.A.G.; Rodrígues, B.S.; Herrera, A.V.H.; Sálamo, J.G.; Borges, J.H.; Delgado, M.A.R. Evolution and applications of the QuEChERS method. TrAC Trends Anal. Chem. 2015, 71, 169–185. [Google Scholar] [CrossRef]
- SBrondi, H.G.; Macedo, A.N.; Vicente, G.H.L.; Nogueira, A.R.A. Evaluation of the QuEChERS method and gas chromatography-mass spectrometry for the analysis pesticide residues in water and sediment. Bull. Environ. Contam. Toxicol. 2011, 86, 18–22. [Google Scholar] [CrossRef]
- Ribani, M.; Bottoli, C.B.G.; Collins, C.H.; Jardim, I.C.S.F.; Melo, L.F.C. Validation in chromatographic and electrophoretic methods. New Chem. 2004, 27, 771–780. [Google Scholar] [CrossRef]
- Agência Nacional de Vigilância Sanitária. Normas Regulátorias da ANVISA. Available online: https://antigo.anvisa.gov.br/documents/10181/2721567/RDC_166_2017_COMP.pdf/d5fb92b3-6c6b-4130-8670-4e3263763401 (accessed on 9 April 2024).
- Instituto Nacional de Metrologia, Normalização e Qualidade Industrial. Orientação sobre validação de métodos analíticos DOC-CGCRE-008. Available online: https://app.sogi.com.br/Manager/texto/arquivo/exibir/arquivo?eyJ0eXAiOiJKV1QiLCJhbGciOiJIUzI1NiJ9AFFIjAvMTM4ODM3NS9TR19SZXF1aXNpdG9fTGVnYWxfVGV4dG8vMC8wL0RPUS1DZ2NyZS04XzA5LnBkZi8wLzAiAFFBcMYdNmecpDn0m0Dj4vzJmvMJZMAYtW6mtkIlj0C7fk (accessed on 9 April 2024).
- Alcântara, D.B.; Fernandes, T.S.M.; Nascimento, H.O.; Lopes, A.F.; Marília, M.G.G.; Lima, A.C.A.; Carvalho, T.V.; Grinberg, P.; Milhome, M.A.L.; Oliveira, A.H.B.; et al. Diagnostic detection systems and QuEChERS methods for multiclass pesticide analyses in different types of fruits: An overview from the last decade. Food Chem. 2019, 298, 124958. [Google Scholar] [CrossRef]
- Alcântara, D.B.; Riceli, P.; Almeida, A.D.S.; Luz, L.R.; Nascimento, H.O.; Fernandes, T.S.M.; Dionísio, A.P.; Castro, A.C.R.; Nascimento, R.F.; Lopes, G.S.; et al. Development, Optimization, and Validation of an Ultrasound-Assisted Liquid-Liquid Microextraction (UALLME) for Selenomethionine Analyses in Cashew Nut (Anacardium occidentale) by Ultra-Performance Liquid Chromatography Coupled to Electrospray Ionization/Single Quadrupole Mass Spectrometer (UPLC-ESI/QDa). Food Anal. Methods 2022, 15, 3196–3208. [Google Scholar] [CrossRef]
- Harris, D.C. Quantitative Chemical Analysis, 9th ed.; W. H. Freeman and Company: New York, NY, USA, 2017; pp. 127–141. [Google Scholar]
- Alcântara, D.B.; Paz, M.S.O.; Rodrigues, T.H.S.; Fernandes, T.S.M.; Barbosa, P.G.A.; Loiola, A.R.; Grinberg, P.; Zocolo, G.J.; Brito, E.S.; Nascimento, R.F. Organophosphorus pesticide in sapodilla (Manilkara zapota) fruit. J. Braz. Chem. Soc. 2018, 29, 2180–2188. [Google Scholar] [CrossRef]
- Tóth, E.; Tölgyesi, Á.; Simon, A.; Bálint, M.; Ma, X.; Sharma, V.K. An Alternative Strategy for Screening and Confirmation of 330 Pesticides in Ground- and Surface Water Using Liquid Chromatography Tandem Mass Spectrometry. Molecules 2022, 27, 1872. [Google Scholar] [CrossRef]
- Tölgyesi, Á.; Korozs, G.; Tóth, E.; Bálint, M.; Ma, X.; Sharma, V.K. Automation in quantifying phenoxy herbicides and bentazon in surface water and groundwater using novel solid phase extraction and liquid chromatography tandem mass spectrometry. Chemosphere 2022, 286, 131927. [Google Scholar] [CrossRef]
- Schober, P.; Boer, C.; Schwarte, L.A. Correlation Coefficients: Appropriate Use and Interpretation. Anesth. Analg. 2018, 126, 1763–1768. [Google Scholar] [CrossRef]
- Schenck, F.J.; Lehotay, S.J. Does further clean-up reduce matrix enhancement effect in gas chromatography analysis of pesticide residue in food? J. Chromatogr. A 2000, 868, 51–61. [Google Scholar] [CrossRef]
- Lazzari, E.; Silva, E.A.S.; Bjek, T.R.; Schneider, J.K.; Caramão, E.B. Evaluation of the matrix effect in the quantitative bio-oil analysis by gas chromatography. Fuel 2021, 290, 119866. [Google Scholar] [CrossRef]
- Pinho, G.P.; Neves, A.A.; Queiroz, M.E.L.R.; Silvério, F.O. Matrix effect in the quantification of pesticides by gas chromatographyç. New Chem. 2009, 31, 987–995. [Google Scholar] [CrossRef]
- Europan Commission. Guidelines—Maximum Residue Levels. Available online: https://food.ec.europa.eu/plants/pesticides/maximum-residue-levels/guidelines-maximum-residue-levels_en (accessed on 9 April 2024).
- Leontievsky, A.A.; Myasoedova, N.M.; Baskunov, B.P.; Golovleva, L.A.; Bucke, C.; Evans, C.S. Transformation of 2,4,6-trichlorophenol by free and immobilized fungal laccase. Appl. Microbiol. Biotechnol. 2001, 57, 85–91. [Google Scholar] [CrossRef]
- Moraes, M.A.R. Bacteria Associated with the Sponge Hymeniacidon heliophila: Physiological Role and Application in Biotechnology. Master’s Thesis, Biosciences Institute of the University of São Paulo, São Paulo, Brazil, 2022. [Google Scholar] [CrossRef]


| Fcalculated | Ftabulated | Test F | |||||||
|---|---|---|---|---|---|---|---|---|---|
| 2682.2 | 9.28 | Significant | |||||||
| Linear coefficient | Angular coefficient | ||||||||
| a | Sa | tcal | ttab | Teste t | b | Sb | tcal | ttab | Test t |
| 205.226 | 3.96 | 51.79 | 3.182 | Significant | 18,790.8 | 2055.22 | 9.14 | 3.182 | Significant |
| Concentration Level (μg · L−1) | Area ± Standard Deviation (n = 3) | Relative Standard Deviation (RSD/%) |
|---|---|---|
| 100 | 16,223.38 ± 564.87 | 3.48 |
| 150 | 19,888.14 ± 507.67 | 2.55 |
| 250 | 41,364.29 ± 1483.77 | 3.58 |
| 500 | 94,550.56 ± 1580.53 | 1.67 |
| 1000 | 197,394.94 ± 3297.95 | 1.67 |
| Spiking Level (μg · L−1) | Average Concentration/(μg · L−1) ± Standard Deviation (n = 5) | Recovery/% | RSD/% |
|---|---|---|---|
| 100 | 109.39 ± 4.66 | 109.36 | 4.26 |
| 500 | 493.16 ± 46.43 | 98.63 | 9.41 |
| 1000 | 1034.60 ± 66.44 | 103.46 | 6.42 |
Disclaimer/Publisher’s Note: The statements, opinions and data contained in all publications are solely those of the individual author(s) and contributor(s) and not of MDPI and/or the editor(s). MDPI and/or the editor(s) disclaim responsibility for any injury to people or property resulting from any ideas, methods, instructions or products referred to in the content. |
© 2025 by the authors. Licensee MDPI, Basel, Switzerland. This article is an open access article distributed under the terms and conditions of the Creative Commons Attribution (CC BY) license (https://creativecommons.org/licenses/by/4.0/).
Share and Cite
Guimarães, L.F.L.; da Silva, M.Z.F.; do Nascimento, R.F.; Alcântara, D.B. Method Validation and Determination of Ametryn Pesticide in Water Samples by QuEChERS-GC-MS. Chemosensors 2025, 13, 103. https://doi.org/10.3390/chemosensors13030103
Guimarães LFL, da Silva MZF, do Nascimento RF, Alcântara DB. Method Validation and Determination of Ametryn Pesticide in Water Samples by QuEChERS-GC-MS. Chemosensors. 2025; 13(3):103. https://doi.org/10.3390/chemosensors13030103
Chicago/Turabian StyleGuimarães, Luis Felipe Lima, Maria Zillene Franklin da Silva, Ronaldo Ferreira do Nascimento, and Daniel Barbosa Alcântara. 2025. "Method Validation and Determination of Ametryn Pesticide in Water Samples by QuEChERS-GC-MS" Chemosensors 13, no. 3: 103. https://doi.org/10.3390/chemosensors13030103
APA StyleGuimarães, L. F. L., da Silva, M. Z. F., do Nascimento, R. F., & Alcântara, D. B. (2025). Method Validation and Determination of Ametryn Pesticide in Water Samples by QuEChERS-GC-MS. Chemosensors, 13(3), 103. https://doi.org/10.3390/chemosensors13030103