Article

Microextraction of Polycyclic Musks from Surface Water with Deep-Eutectic-Solvent-Coated Membrane Followed by Gas-Chromatography–Mass Spectrometry Analysis

1
LAQV-REQUIMTE, Department of Chemical Sciences, Laboratory of Bromatology and Hydrology, Faculty of Pharmacy, University of Porto, Rua Jorge Viterbo Ferreira n. º 228, 4050-313 Porto, Portugal
2
Department of Chemistry and Environmental Science, National Institute for Alternative Technologies of Detection, Toxicological Evaluation and Removal of Micropollutants and Radioactives (INCT-DATREM), São Paulo State University (UNESP), São José do Rio Preto, SP 15054-000, Brazil
*
Author to whom correspondence should be addressed.
Chemosensors 2025, 13(3), 88; https://doi.org/10.3390/chemosensors13030088
Submission received: 27 December 2024 / Revised: 25 February 2025 / Accepted: 27 February 2025 / Published: 4 March 2025

Abstract

:
Deep eutectic solvents (DESs), a novel class of eco-friendly solvents, are attracting considerable attention in extraction techniques. In this study, a hydrophobic DES, created by combining a quaternary ammonium salt and hexanoic acid, was coated onto a commercial cellulose membrane for polycyclic musks (cashmeran, celestolide, galaxolide, and tonalid) microextraction from surface waters followed by gas-chromatography–mass spectrometry (GC MS) analysis. A series of DESs were synthesized and characterized to identify suitable candidates for use as a coating on cellulose membranes. A factorial design approach was employed to investigate key factors, including DES volume, membrane type, dissolving solvent volume, DES incorporation time, and extraction duration, following a preliminary selection of the DES type, membrane, and dissolving solvent. Under optimized conditions, a cellulose acetate membrane impregnated with DES (TBAB:C6, 1:3 molar ratio) was used for 1 h to extract polycyclic musks from surface water; the extract was then dissolved in methanol prior to the GC-MS analysis. The DES-coated membrane demonstrated a linear detection range from 2.5 to 100 μg/L, with limits of detection (LODs) ranging from 0.06 to 0.15 µg/L, while the LOQ values varied from 0.2 to 0.5 µg/L. The validated method was successfully applied to real samples, allowing us to find the presence of galaxolide and tonalide.

1. Introduction

A wide range of anthropogenic contaminants can be found in water resources. Among these, polycyclic musks (PMs), a class of synthetic musks widely used in various personal care and household products (e.g., skin care lotions, fabric softeners, fragrances, shampoos, detergents, etc.), are being used at an increasing scale [1]. According to a recent report, galaxolide (HHCB) and tonalid (AHTN) were produced or imported in quantities between 1000 and 10,000 tons per year in the European Union (EU) [2].
The primary pathway for these compounds to enter the aquatic environment is through wastewater effluents, mainly because conventional wastewater treatment plants (WWTPs) are not equipped to eliminate most of them. Studies from various WWTPs worldwide, including those in the Czech Republic, China, Thailand, and Northern Italy, have reported high levels of PMs (up to mg/L range) [3,4,5,6]. A recent review of the global distribution and ecological risk assessment of synthetic musks has shown that influent concentrations of HHCB and AHTN are generally higher in Europe and North America than in Asia, indicating higher consumption of these musks in Western countries [7]. Other PMs, such as cashmeran (AHMI), celestolide (DPMI), and traseolide (ATII), have also been detected in some WWTPs at much lower concentrations than HHCB and AHTN. In surface waters, HHCB and AHTN show the highest detection frequencies and concentrations among PMs, usually at levels below 500 ng/L [8]. However, one study in the Nakdong River, Korea, reported exceptionally high concentrations of HHCB at 13,920 ng/L and AHTN at 2800 ng/L [9].
Despite being detected at low concentrations (<500 ng/kg) in aquatic environments, the bioaccumulation of these PMs poses potential risks to ecosystems and human health. For instance, exposure to these compounds has been shown to significantly reduce algal growth rates [10], induce oxidative stress and genetic damage in zebra mussels (Dreissena polymorpha) [11], and impair the growth, survival, and reproduction rates of juvenile gastropods, specifically Potamopyrgus antipodarum [12]. In humans, HHCB has been shown to inhibit the production of critical hormones like progesterone and cortisol [13], which are essential for maintaining pregnancy and reducing the risk of miscarriage in pregnant women.
These substances exhibit estrogenic activity despite having a completely different structure from the endogenous hormone 17estradiol. Musks polycyclic AHTN and HHCB have been evaluated for interactions with estrogen receptors because of their polycyclic nature. They act on estrogen receptor subtypes with varying degrees of affinity by showing both antiestrogenic and estrogenic activity for certain estrogen-receptor-positive cell lines and some of the ER subtypes [1]. Moreover, they were able to demonstrate a certain statistically significant rise in the proliferation rate of human MCF-7 breast cancer cells which indicates that musk substances have estrogenic activity [2].
Given the broad spectrum of PMs levels that can be present in aquatic environments, it is crucial to develop methods that are highly sensitive for their detection and further quantification. In recent years, several studies have highlighted the excellent accuracy and sensitivity for the determination of these substances in surface water, using various extraction techniques, such as ultrasonic-assisted emulsion (UAEME), single-drop microextraction (SDME), dispersive liquid–liquid microextraction (DLLME), microextraction by packed sorbent (MEPS), and QuEChERS (Quick, Easy, Cheap, Effective, Rugged, and Safe), usually followed by mass spectrometry analysis through liquid chromatography (LC) or gas chromatography (GC) [14]. Nevertheless, most current analytical methods are still far from being considered fully environmentally friendly, special due to their consumption of toxic solvents. In response to this challenge, Abbot et al. [15] introduced a new class of ionic liquids (ILs) known as deep eutectic solvents (DESs), which offer a greener alternative to traditional solvents. DESs often arise from the mixture of a hydrogen bond acceptor (HBA) and a hydrogen bond donor (HBD), and their synthesis process is easy, cheap, and green. Hydrophobic DESs formulated with long-chain quaternary ammonium salts and long-chain acids have been effectively used as extractive solvents in various techniques for the selective analysis of contaminants, including certain personal care products [14,16]. This efficacy has stimulated interest in using DESs as sorptive coatings in solid-phase microextraction (SPME) applications, including poly(dimethylsiloxane) (PDMS) coatings [17], thin films on stainless steel mesh [18], and paper substrates [19,20].
In this study, a hydrophobic DES was immobilized on cellulose acetate for the first time, and its extraction capability for four PMs in surface waters was evaluated. After optimizing several extraction parameters, including the type and volume of DES, the type of coated paper, the impregnation and extraction times, and the type and volume of extraction solvent, the DES–cellulose acetate technique followed by the GC-MS analysis was applied to surface water samples collected from seven rivers in Portugal. In addition to assess the potential of the DES–cellulose acetate, this study evaluated the environmental friendliness of the proposed method using the AGREE [21] and BAGI protocol [22].

2. Materials and Methods

2.1. Chemicals and Standard Solutions

Analytical standards of PMs: 4,6,6,7,8,8-hexamethyl-1,3,4,7-tetrahydrocyclopenta[g]isochromene (HHCB, galaxolide, 97% purity), 1-(3,5,5,6,8,8-hexamethyl-6,7-dihydronaphthalen-2-yl)ethenone (AHTN, tonalid, 98.5% purity) 1,1,2,3,3-pentamethyl-2,5,6,7-tetrahydroinden-4-one (DPMI, cashmeran, 98% purity) and 1-(6-tert-butyl-1,1-dimethyl-2,3-dihydroinden-4-yl)ethanone (ADBI, celestolide 98.5% purity) all from Sigma-Aldrich (Steinhem, Germany). Standards solutions were prepared with acetonitrile at 1 g/L. The internal standard d3-tonalid (AHTN d3; >98% pure) was from Dr. Ehrenstorfer GmbH (Augsburg, Germany), 100 µg/µL in iso-octane. All the analytes were kept at −20 °C.
DES preparation: Tetrabutylammonium chloride ([N4444+][Cl]), TBAC > 97% purity), tetrabutylammonium bromide ([N4444+][Br]), TBAB > 98% purity), and CH3(CH2)4CO2H (hexanoic acid, C6, 99% of purity) were all from Sigma-Aldrich.
Acetonitrile (MeCN, HPLC grade) and methanol (MeOH, HPLC grade) were from Merck (Darmstadt, Germany), n-Hexane (HPLC grade) from Honeywell Riedel-de Häen (Seelze, Germany), and ultrapure water from Arium Pro, Sartorius (Göttingen, Germany).
Cellulose membrane Whatman 1 and cellulose nitrate (0.20 µm porosity, 47 mm diameter) were both from Sigma-Aldrich, and dry cellulose acetate (5.7 × 14 cm) was from GenoChem (Valencia, Spain)

2.2. Preparation of DES

The eutectic solvents evaluated were formed using a mixture of TBAB or TBAC and C6 at molar ratios of 1:2 and 1:3. The mixture was heated at 60 °C on a hotplate, under stirring at 220 rpm. After 15 min, most of the mixture had already formed a liquid, but the presence of small globules of TBAB and TBAC forced us to continue the process for up to 30 min, when a completely homogeneous liquid was obtained. Heating was used to decrease the viscosity of C6 and increase the solubility of TBAB and TBAC, facilitating the mixing of the components and enhancing their interaction [23]. The solvents formed were transferred to a Falcon tube and cooled to ambient temperature. In Supplementary Material (Section S1), the data obtained for the DES used in this work are described, namely: density of the solvent (Section S1–Section S1.1), dynamic viscosity (Section S1–Section S1.1), Fourier transform infrared spectra of the DES and their precursors (Section S1-Figures S1 and S2), and differential scanning calorimetry of DES (Section S1–Section S1.3-Figure S3).

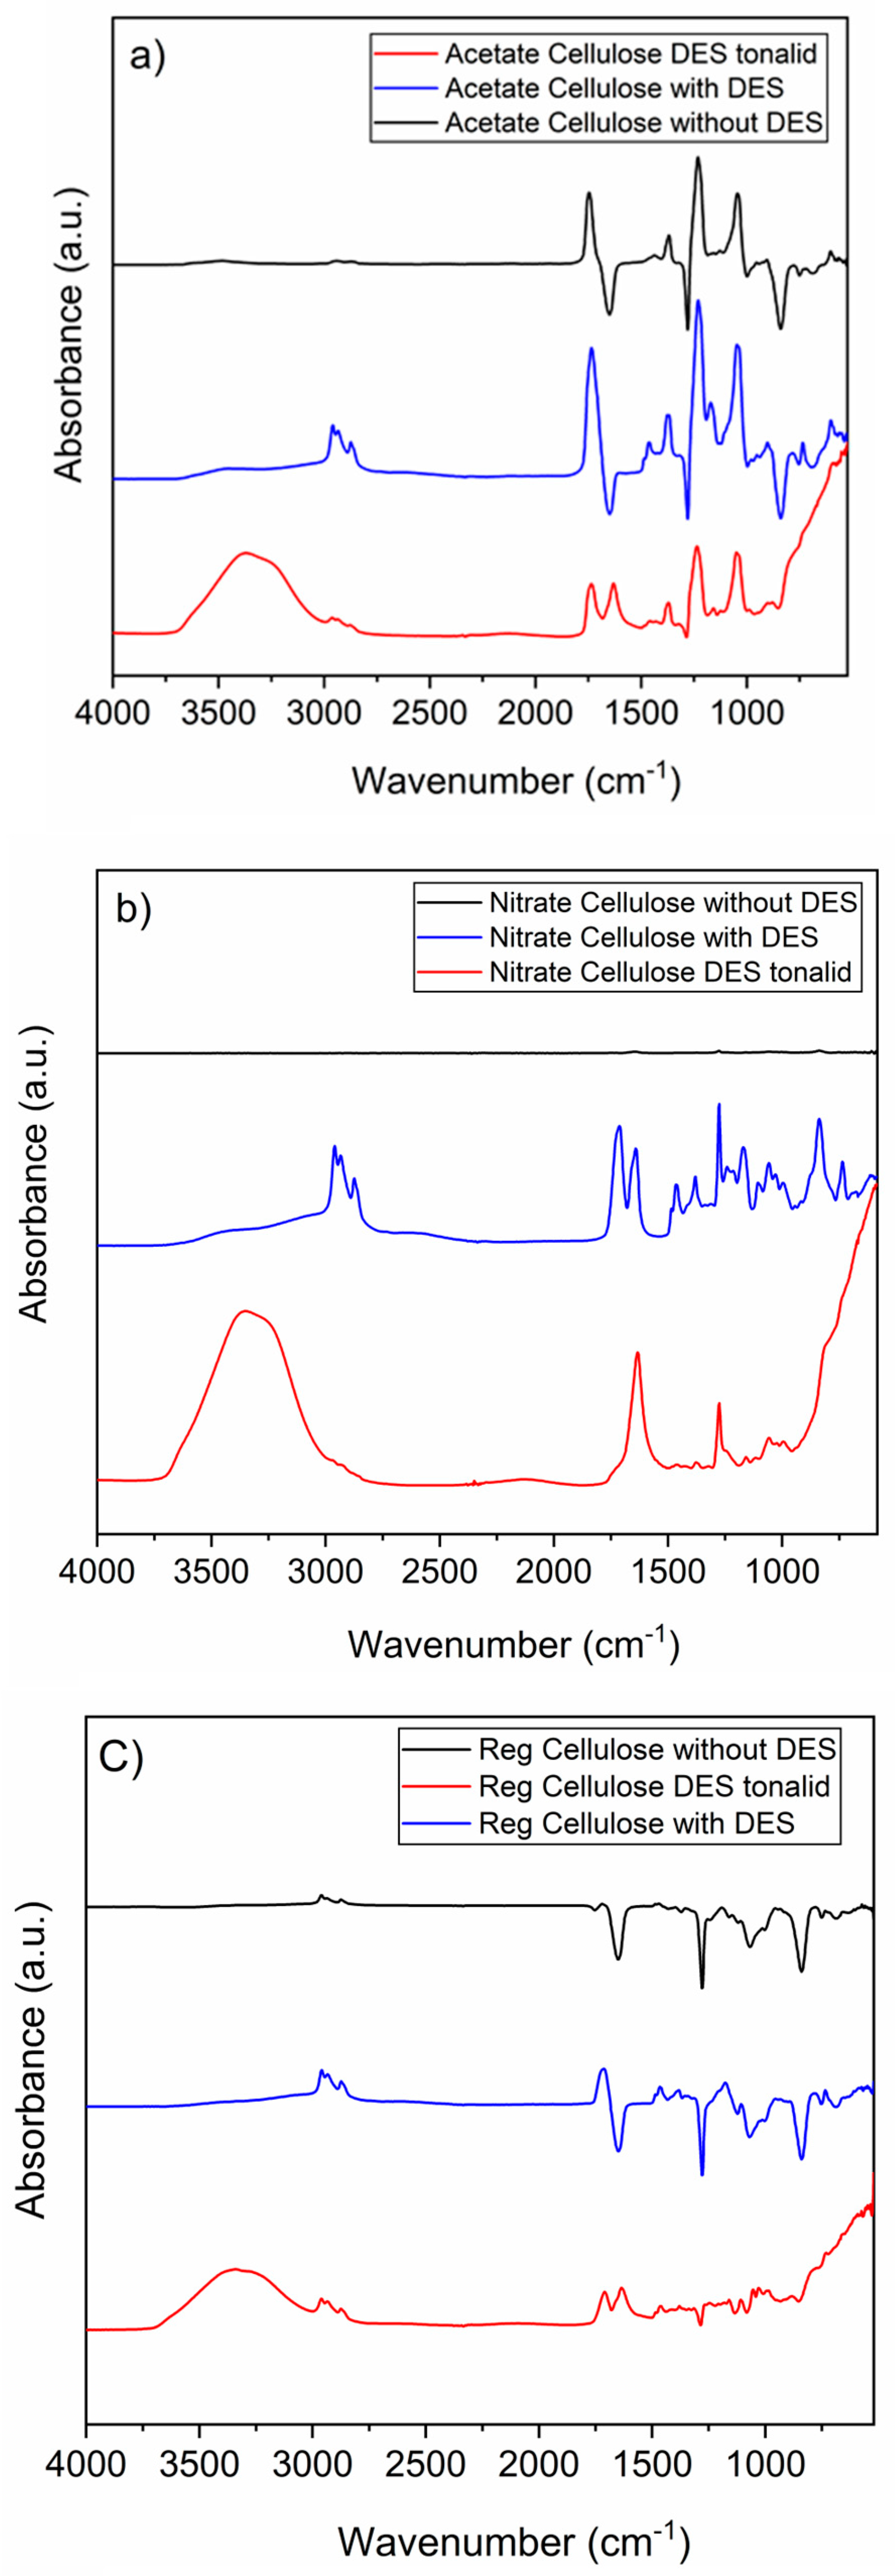
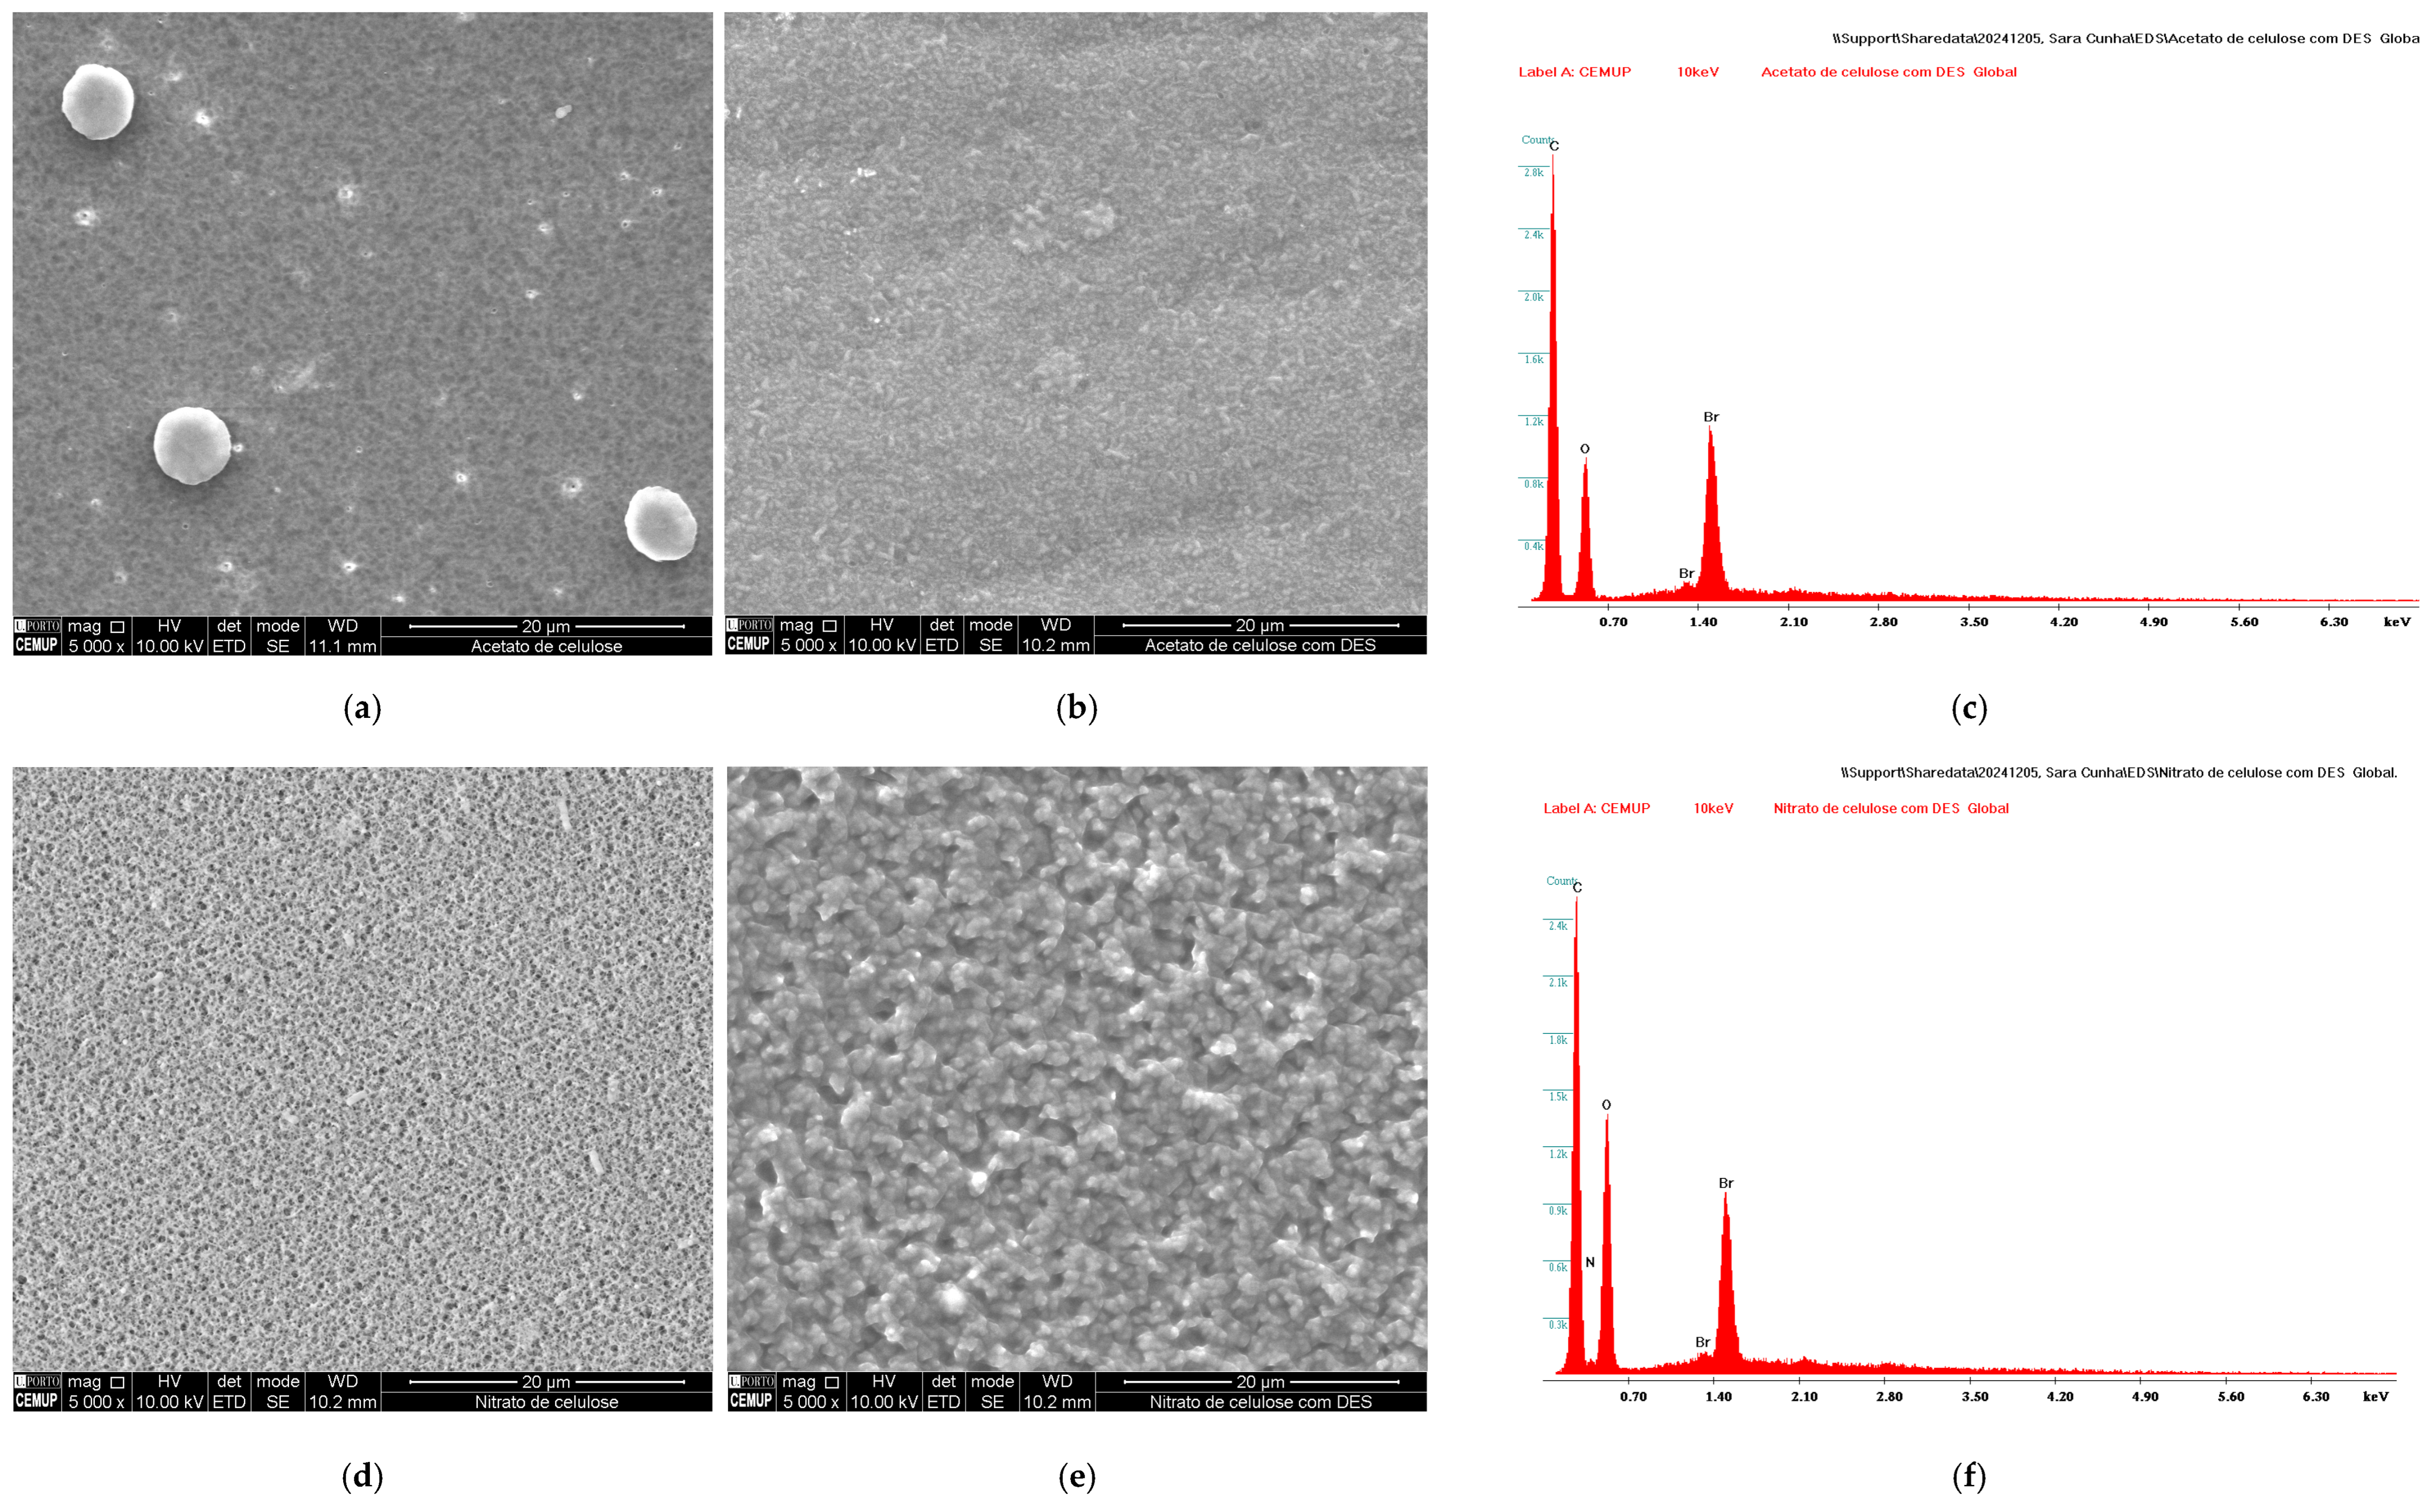
2.3. Characterization of the Coated Membranes

Scanning electron microscopy (SEM) micrographs to study the surfaces and morphologies of coated membranes were taken using an FEI QUANTA 400 FEG ESEM (Eindhoven, The Netherlands) equipped with energy-dispersive X-ray spectrometer (EDX) (PEGASUS X4M) at the Centro de Materiais (CEMUP) of the University of Porto. The nominal resolution was 0.8 nm at 10 kV. For better image quality, the samples were coated with gold and palladium before the micrographs acquisition. Fourier transform infrared spectra were acquired in attenuated total reflectance mode (ATR-FTIR) for individual membranes and DES-coated membranes. The analyses were performed using a Bruker VERTEX 70 spectrometer (Bruker, Karlsruhe, Germany) operated in the range from 4000 to 400 cm−1, with a spectral resolution of 4 cm−1 and 64 scans.

2.4. Microextraction Procedure

Initially, based on Ríos-Gómez [19], the raw cellulose acetate membrane was cut into three × 1 cm strips and impregnated with 100 µL of DES (TBAB:C6, 1:3 molar ratio) using a micropipette. After a 60 min incubation at room temperature, the DES-treated membrane was immersed in 20 mL of the surface water sample contained in a 20 mL vial and placed in an orbital agitator Multi RS-60 from Biosan (Riga, Latvia) for 15 min. Then, the membrane was removed from the vial with tweezers and transferred to a 4 mL vial containing 300 µL of methanol, used as a dissolving solvent, followed by an additional shake for 5 min and centrifuged Sorvall ST 16 from Thermo Scientific (Porton, UK) at 2100 rpm for 4 min. Finally, 150 µL was transferred to a 2 mL vial for gas chromatography–mass spectrometry (GC-MS) analysis, with the addition of 15 µL of AHTN D3 at 2.5 mg/L (see Supplementary Material Section S2—Figure S4).

2.5. Gas Chromatography–Mass Spectrometry Analysis

All analyses were performed using a gas chromatograph 6890 Agilent (Little Falls, DE, USA) coupled to an Agilent 5973B single quadrupole mass spectrometer with electron ionization mode. The GC system was equipped with an electronic pressure control (EPC) and a PAL LSI autosampler (CTC Analytics, Zwingen, Switzerland). The system was operated under Agilent Chemstation, and the acquisition data were made in selective ion monitoring (SIM) mode, each analyte being quantified based on peak area using one target and two qualifier ion(s) per analyte (Supplementary Material Section S3—Table S1). The MS transfer line was held at 280 °C. Mass spectrometric parameters were set as follows: electron ionization with 70 eV energy; ion source temperature, 230 °C; and MS quadrupole temperature, 150 °C.
The chromatographic separation was achieved on a DB-5MS capillary column (30 m × 0.25 mm × 0.25 μm; J&W Scientific (Folson, CA, USA). Ultra-high purity helium (99.999%, Gasin, Leixoes, Portugal) was used as carrier gas at a constant flow of 1 mL/min. The sample extract (1 μL, volume) was injected in pulsed splitless mode at 250 °C as follows: pressure 40 psi until 1 min and purge flow to split vent of 60 mL/min. The oven temperature was maintained at 95 °C for 1.5 min; then, the temperature was ramped to 180 °C at 20 °C/min and then increased to 230 °C at 5 °C/min. Finally, the oven temperature was ramped to 290 °C at 25 °C/min, which was kept for 1.85 min, resulting in a total run of 21 min.

2.6. Statistical Analyses

Initially, the normal distribution of residuals and the homogeneity of variances were evaluated through a Shapiro–Wilk test (sample size n < 50) and Levene’s test, respectively. A Kruskal–Wallis test followed by a Dunn’s post hoc test was used when statistical significance was found. All analyses were performed at a significance level of 0.05 using SPSS software, version 29.0 (IBM Corporation, New York, NY, USA).

3. Results and Discussion

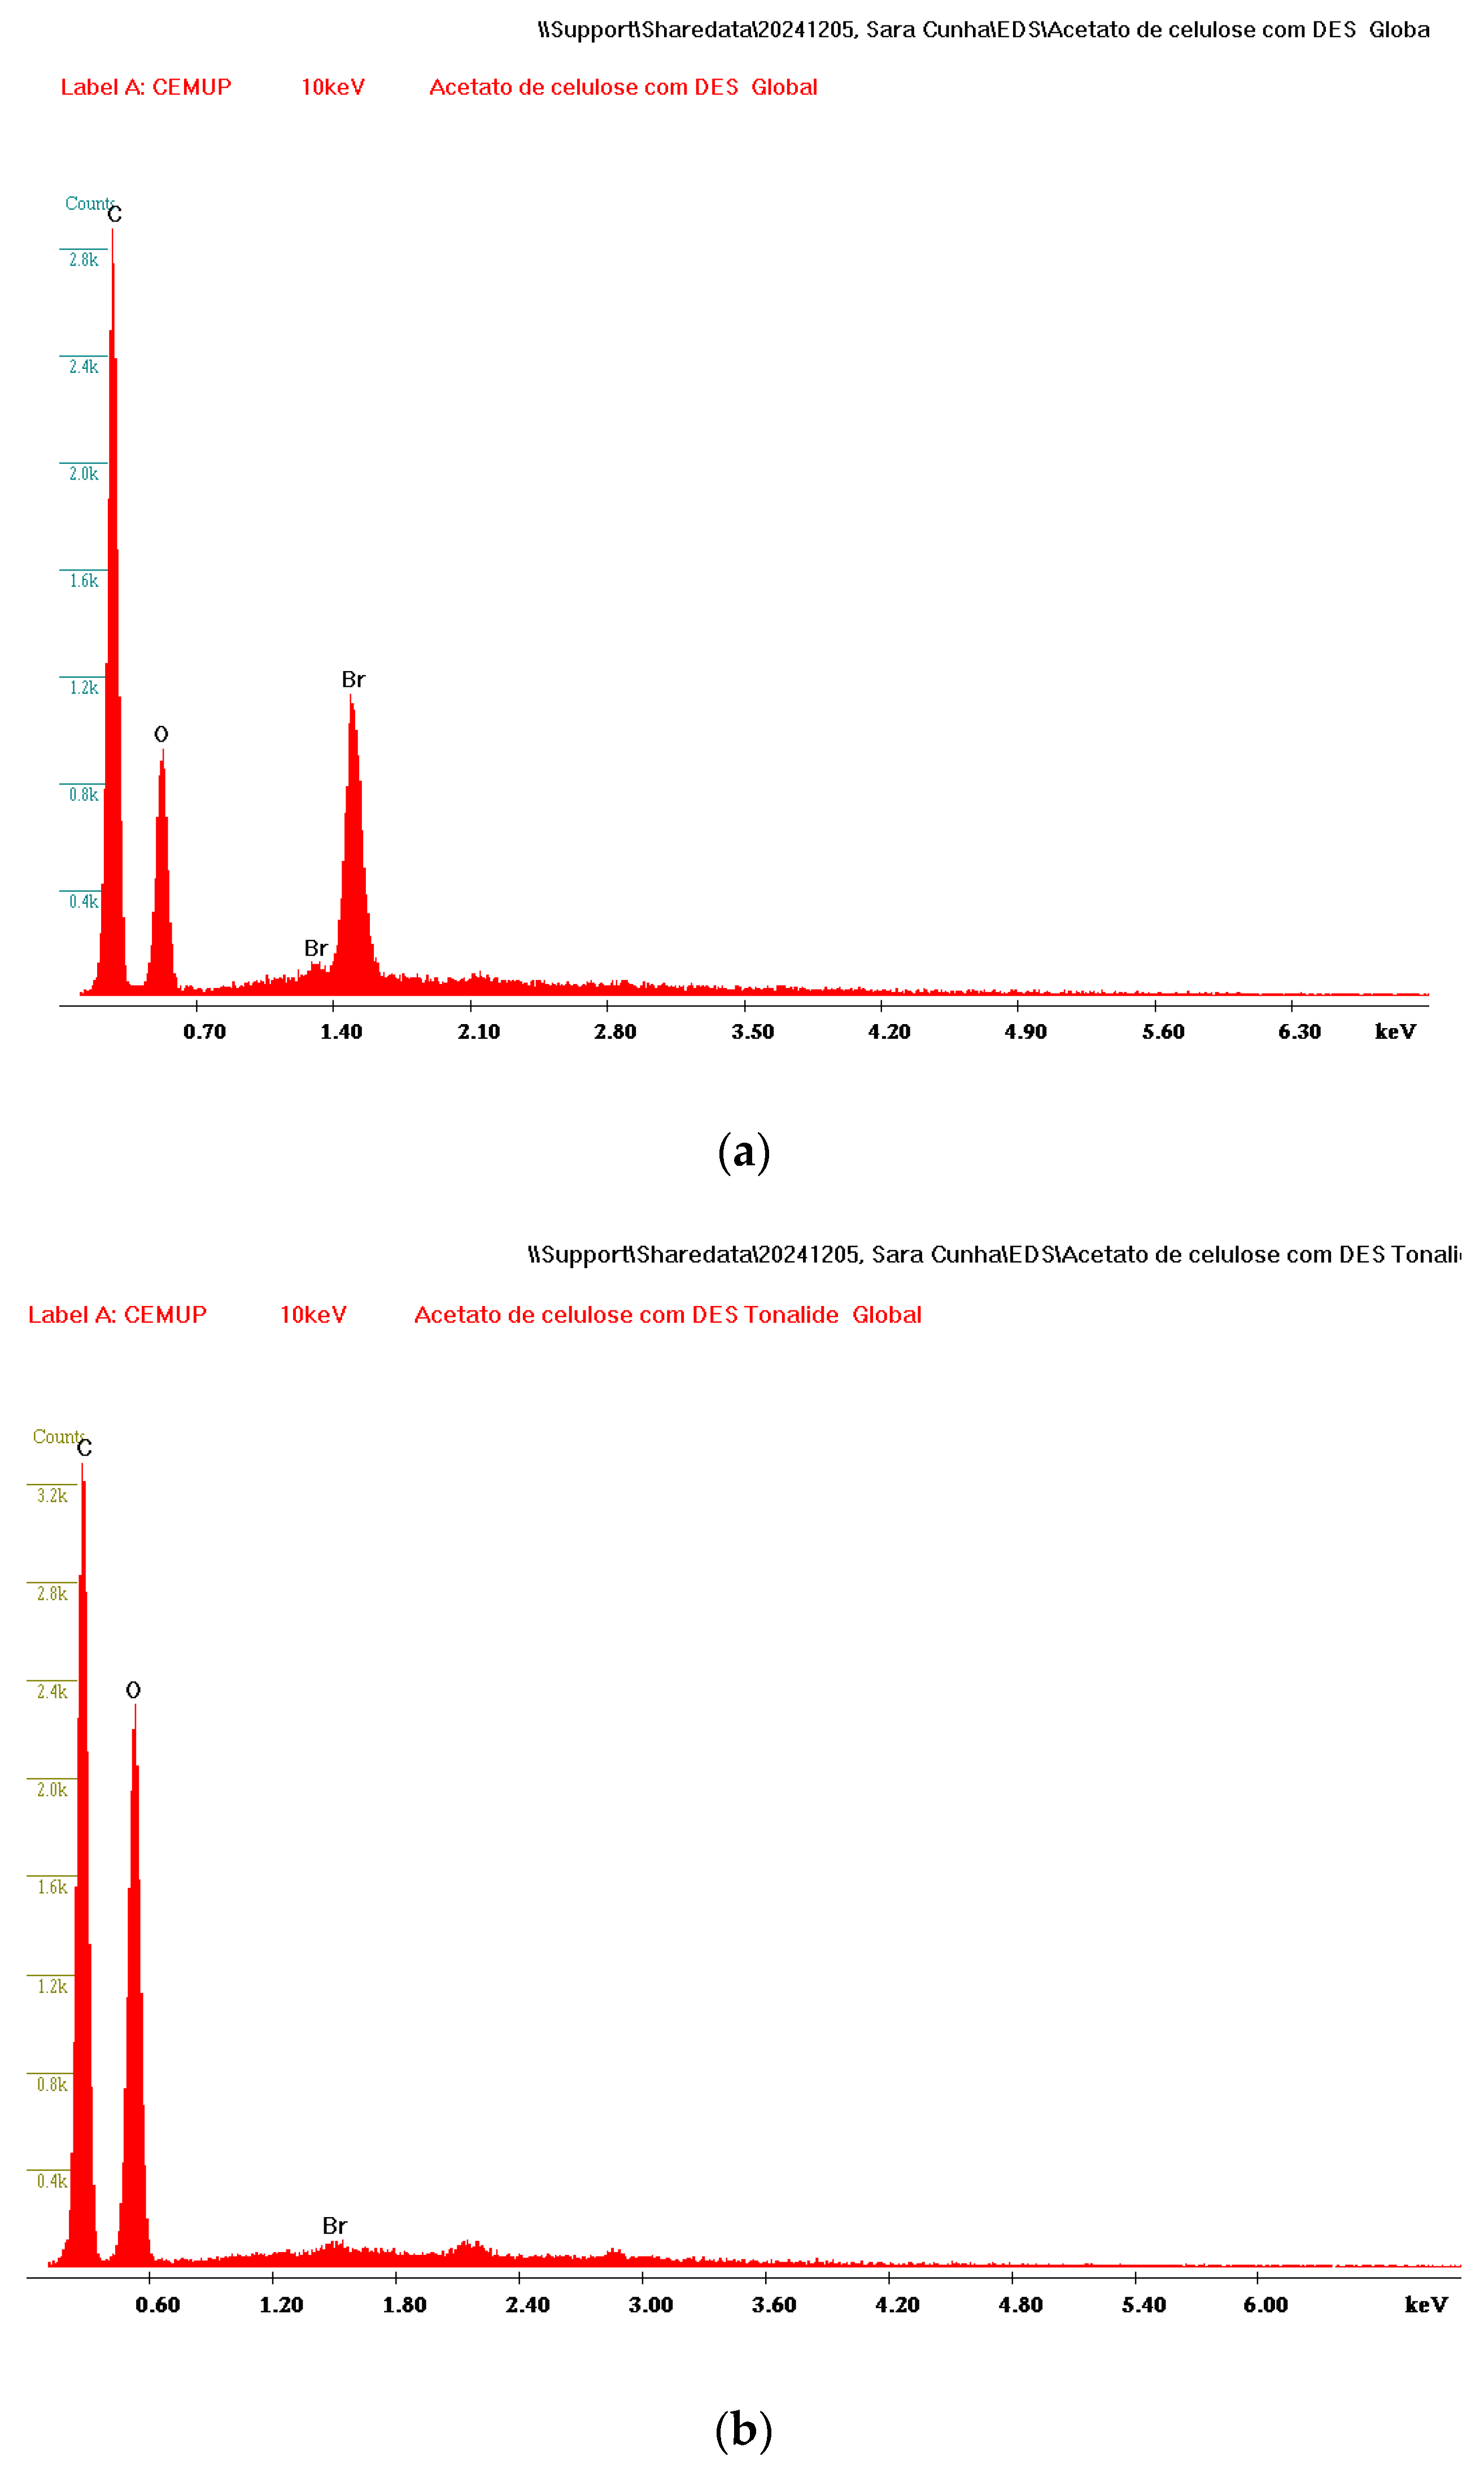
3.1. Characterization of DES-Coated Membrane

ART-FTIR was used to characterize the DES-coated membrane; the obtained spectra are presented in Figure 1. In all the raw membranes, the characteristic bands of cellulose, nitrate cellulose or acetate cellulose, are substituted by the DES (TBAB:C6; 1:3 molar ratio) bands. The spectra confirm the distinct behavior of cellulose acetate, cellulose nitrate and cellulose membranes after modification and interaction with DES and tonalid. For cellulose acetate and regular cellulose, the spectra showed intense bands in the 1750–1800 cm−1 region, corresponding to the stretching vibrations of -C=O bonds, associated with COOR or COOH groups, the stretching vibrations of -C=C bonds originating from aromatic rings, and the in-plane bending of -C-C, -C-O and -C-H bonds. The addition of DES increased the intensity of these bands, indicating enhanced interactions, while the appearance of a symmetrical and asymmetrical C-H at 2980, 2900 and 2850 cm−1 and the subsequent presence of the tonalid led to a general reduction in band intensity, particularly for carboxylic acids, alongside an increase in O-H bond bands, suggesting a reorganization of hydrogen-bonding networks. In contrast, cellulose nitrate membranes showed weak absorption bands in the absence of DES and tonalid. Upon DES modification, characteristic bands for C-H, and C=O groups appeared, highlighting the role of DES in improving membrane properties. The introduction of the tonalid further intensified bands associated with -OH bound groups, indicating strong hydrogen bonding and molecular interactions involving the DES and tonalid within the membrane structure.
Morphologies of DES-coated membranes were studied by scanning electron microscope (SEM) as shown in Figure 2. It can be seen from the figure that the pores of the different membranes were completely unfilled, and no material is presented inside them. However, when the DES was added to the membranes, the pores were completely filled. The cellulose acetate membrane (Figure 2b) demonstrates the highest level of homogeneity, with a uniform distribution of DES and minimal surface accumulation. The cellulose membrane (Figure 2h) also shows good homogeneity, but with slightly more surface accumulation. The cellulose nitrate membrane (Figure 2e) has the least uniform distribution, with more noticeable surface accumulation of DES. All three membranes show complete filling of the pores with DES, but the cellulose acetate membrane stands out for its smooth and homogeneous structure. The cellulose membrane follows, with the cellulose nitrate membrane showing the most irregularities in DES distribution. In addition, it was verified that there is still a small amount of DES accumulated on the surface of the membrane due to the viscosity of the DES. Similar results were also verified by other authors [17,19,20].
The elemental composition was confirmed using energy-dispersive X-ray spectroscopy (EDX). Microscopic qualitative EDX analysis was performed on the surface of the prepared DES-coated membranes to determine the composition of the DES (Figure 2). The analysis confirmed that the coated membranes contain the elements carbon, oxygen, and bromine, with bromine being present in high concentrations in the cellulose acetate membrane. The presence of nitrogen was also verified in the cellulose nitrate membrane, as expected.

3.2. Optimization of DES-Membrane Extraction

Initially, several extraction parameters, including the type of DES, type of membrane, and dissolving solvent, were optimized using a factor-by-factor approach. Subsequently, a multivariable approach was employed to evaluate the volumes of both the DES and the extraction solvent, as well as the impregnation and extraction times. Throughout all experiments, the stirring speed was maintained constant at 250 rpm. All experiments were conducted using 20 mL of ultrapure water spiked with each analyte at a concentration of 50 µg/L, and in all experiments, 150 µL of the final extract was added with 10 µL of AHTN D3 at 2.5 mg/L. A representative chromatogram illustrating the separation of analytes after extraction with TBAB:C6 (1:3 molar ratio) is provided in Supplementary Material Section S4—Figure S5.

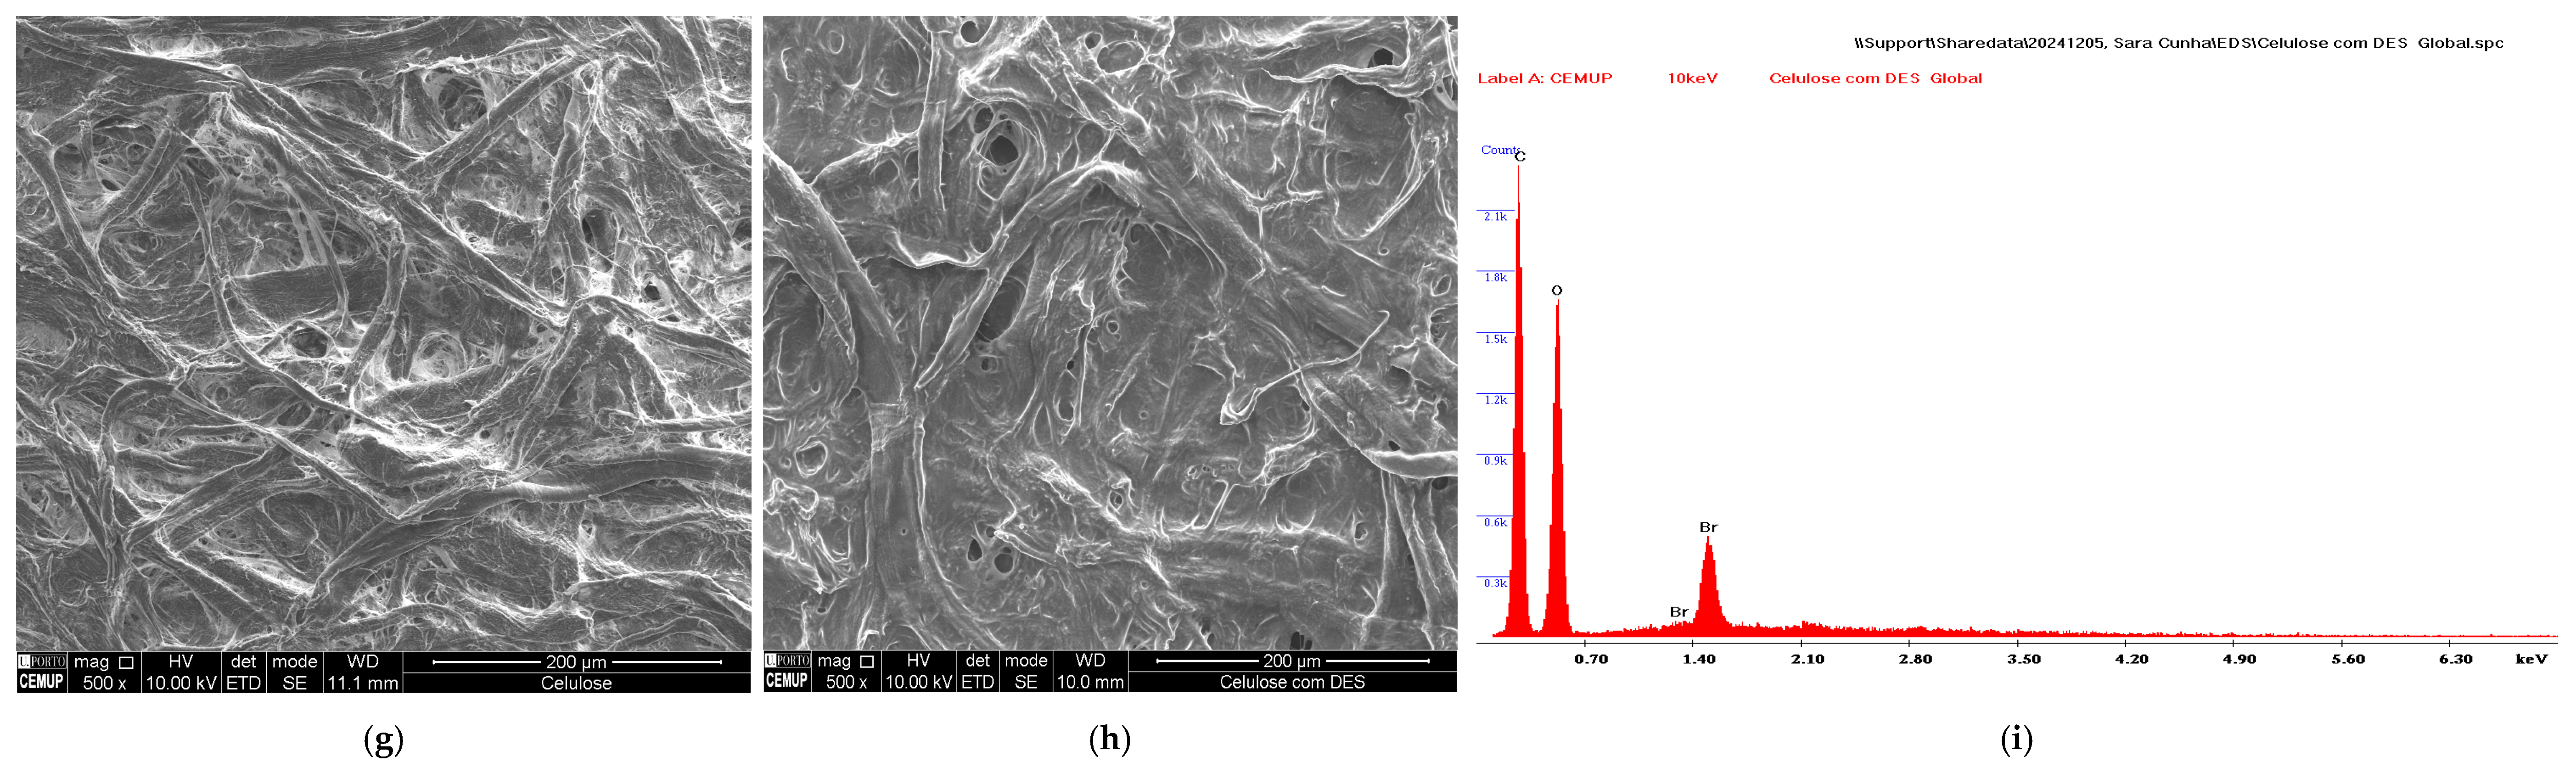
3.2.1. Selection of the DES

Taking into account that the selected analytes presented log Kow values higher than 4.9, the option was to evaluate only hydrophobic DESs for membrane impregnation. Four different hydrophobic DESs, formed by varying molar proportions of TBAB and TBAC and C6 (molar ratio of 1:2 and 1:3) were evaluated using a cellulose membrane. In general, the DES formed via TBAB with C6 at a 1:3 molar offered higher peak areas of the analytes of interest when compared to the other DESs evaluated (Figure 3).

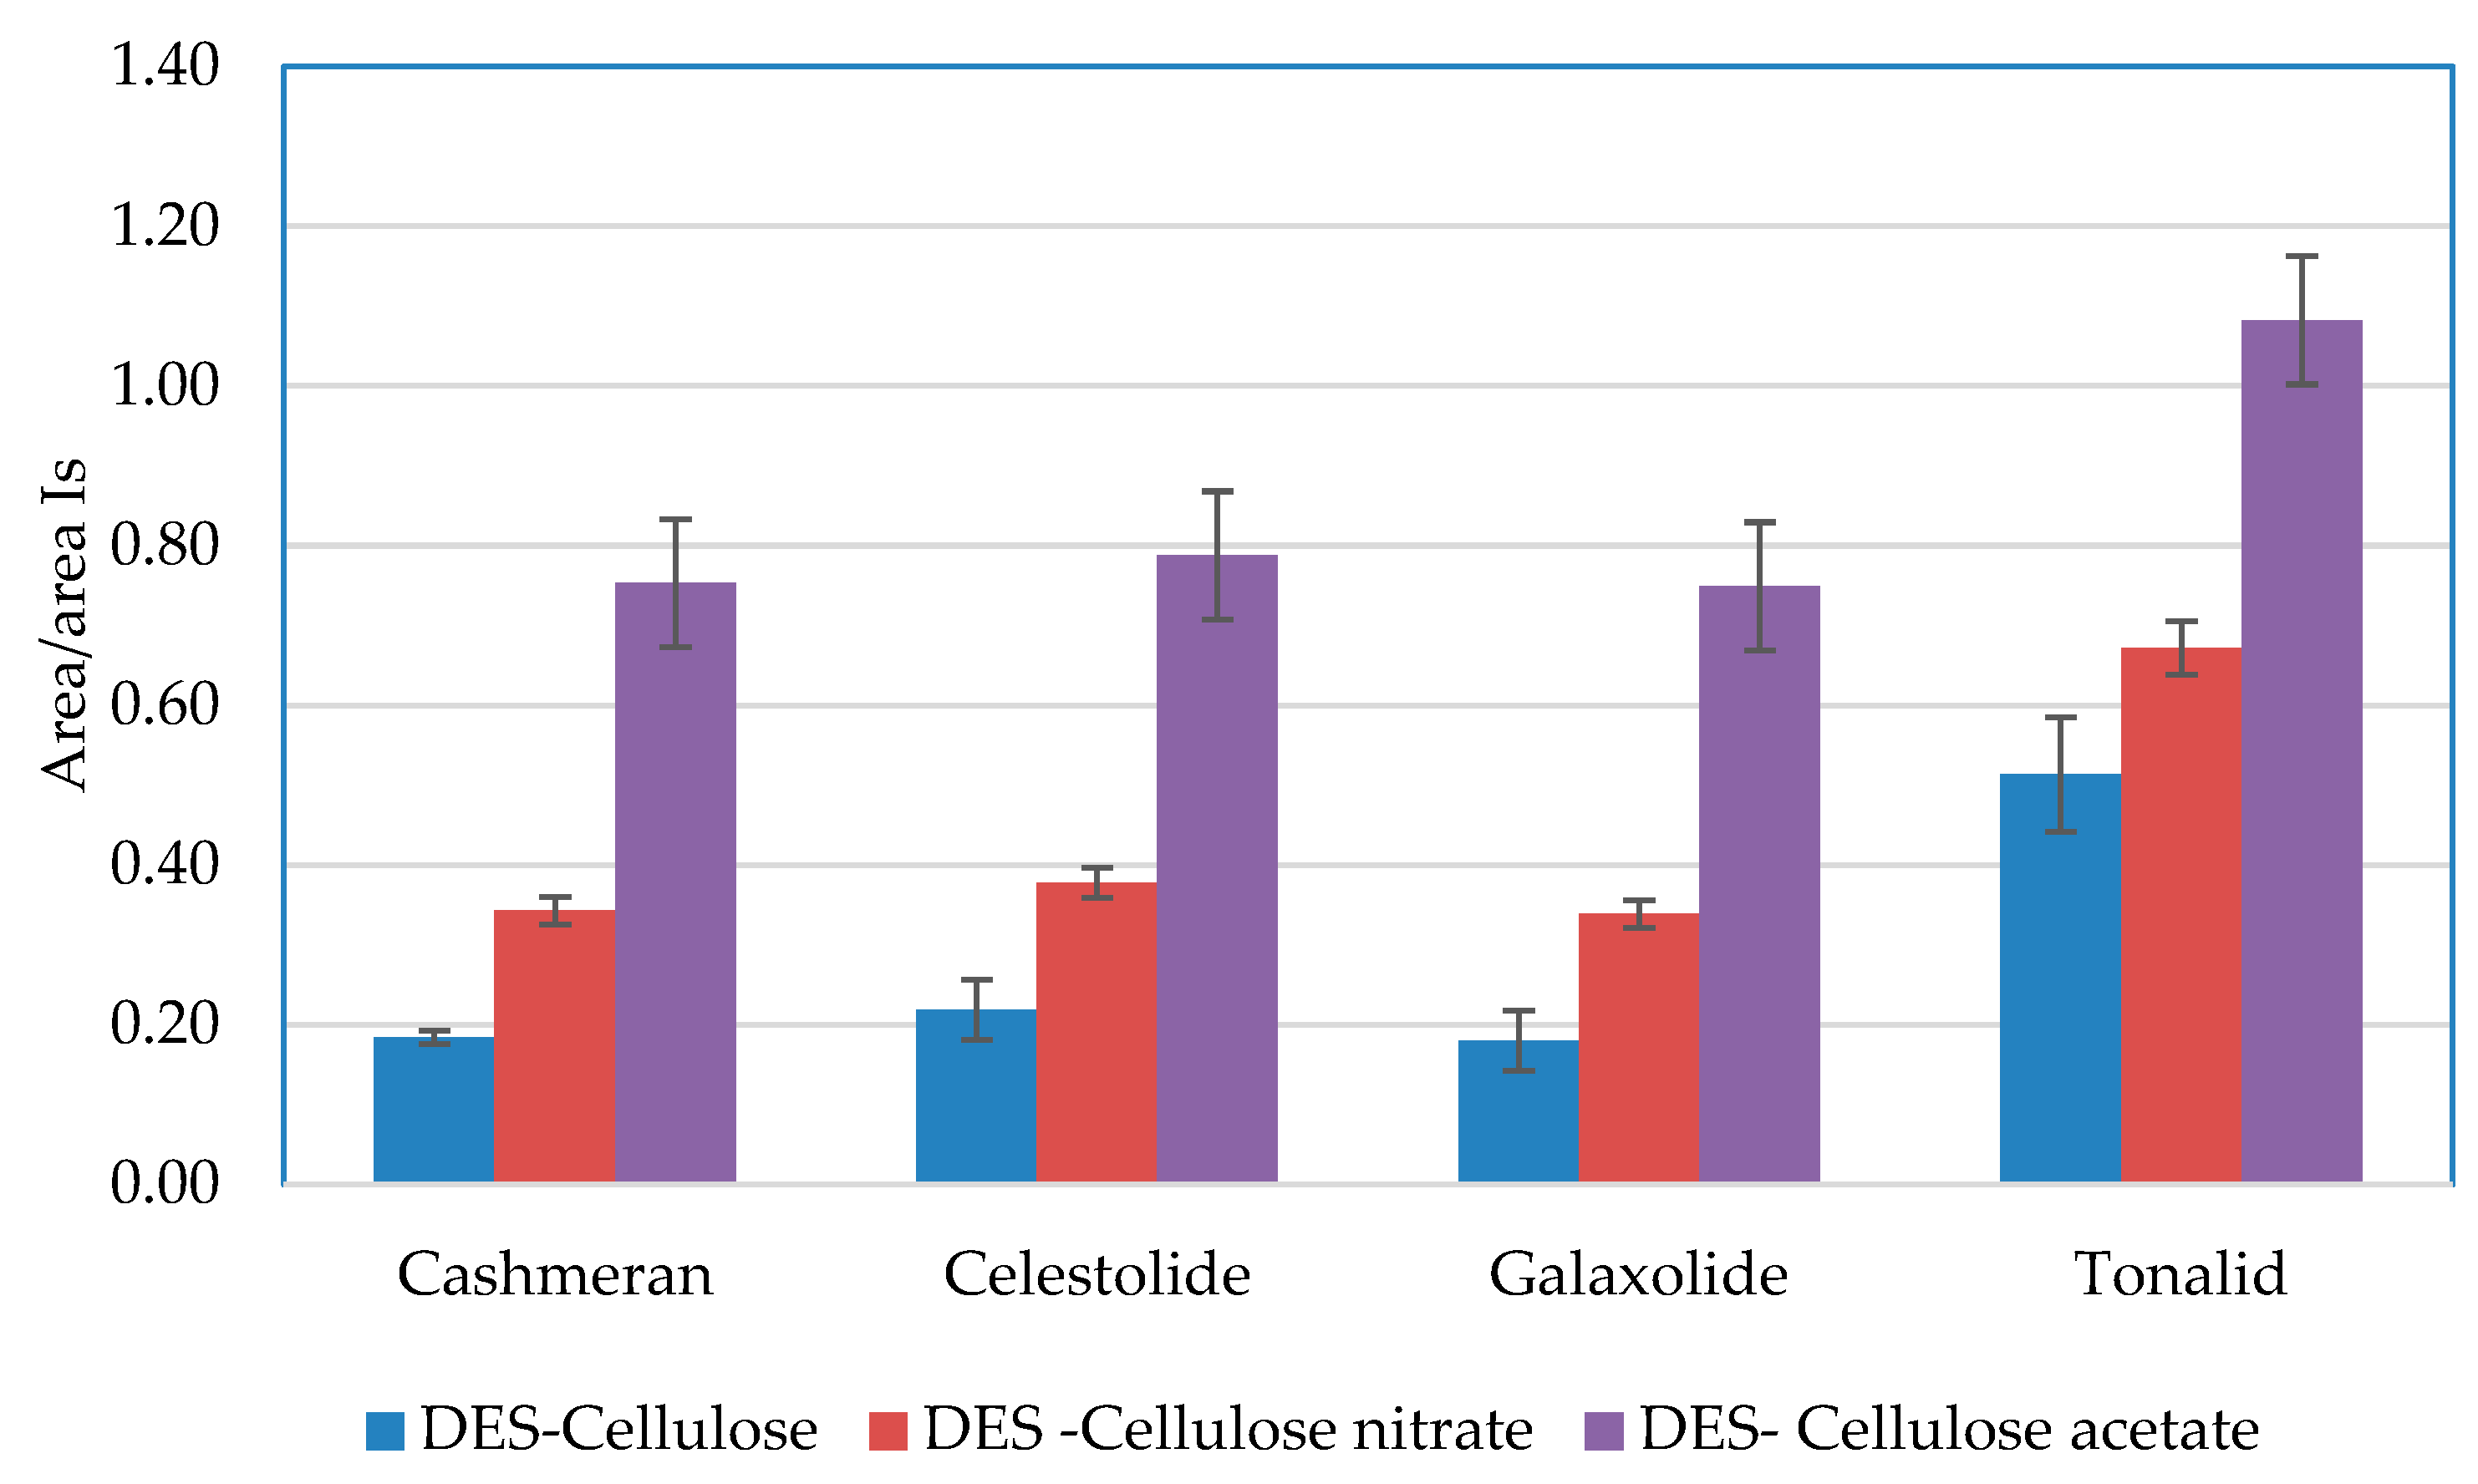
3.2.2. Selection of the Membranes

In this work, cellulose-based membranes, such as cellulose, cellulose nitrate, and cellulose acetate, were evaluated due to their natural abundance, cost-effectiveness, and adsorption characteristics. Additionally, membranes were selected to exhibit reduced swelling capacity, smaller pore sizes, and stronger capillary forces with DES. These characteristics promote the uniform distribution of DESs within the membrane pores, resulting in enhanced separation performance. When impregnated with TBAB:C6 (1:3 molar ratio), all these hydrophilic membranes demonstrated significantly improved adsorption capacity for relevant musk compounds compared to their unmodified membranes.
The high extraction efficiency was achieved with cellulose acetate as shown in Figure 4. This finding can be related to the fact that cellulose acetate membranes are generally stable and retain their structure well when impregnated with DESs, which can further improve their adsorption capabilities. DES impregnation can enhance the surface affinity of the cellulose acetate membrane, allowing it to interact more effectively with musks.
As observed in the microscopic qualitative EDX analysis, the cellulose acetate after tonalid extraction contains higher levels of carbon and oxygen and lower levels of bromine, probably due to the DES-coated membrane interacting with the tonalid (Figure 5).

3.2.3. Selection of Dissolving Solvent

To ensure effective dissolution of the coating, three different solvents were tested: methanol, acetonitrile, and n-hexane. The highest efficiency was achieved with methanol, followed by acetonitrile and n-hexane. Methanol, being a highly polar solvent, exhibited the highest efficiency, likely due to its excellent compatibility with DES, and enhanced its availability for extraction (Figure S6).

3.2.4. Multivariate Approach to Optimize the Volumes of DES and Dissolving Solvent

A Plackett–Burman design was performed to screen sample preparation variables that could affect the extraction efficiency. Four critical variables, namely, the volume of DES used to impregnate the membrane (X1), contact time of DES with the membrane (X2), extraction time (X3), and volume of dissolving solvent (X4), were evaluated within different ranges (Table 1). The Plackett–Burman design matrix included eight trials, so four more than the number of variables to guarantee degrees of freedom enough to calculate the standard error, where the variables were evaluated at two levels: high (+1) and low (−1). Additionally, three replications at the central point were added to the design to check the repeatability of analyses and verify the method performance at the mean level of the range studied, thus resulting in eleven trials [24]. In this way, a representative sample of water was spiked at 50 µg L−1 and then extracted according to the conditions established for each trial of the experimental design (Table 1). Based on the recoveries observed (Table 1), the effect of each sample preparation variable on the extraction efficiency was estimated with the aid of the Statistica 8.0 software (Statsoft Inc., Tulsa, OK, USA), considering a significance level of 5%. Particularly in this section, the results were discussed for tonalid, as an example among the PMs studied.
The variables associated with the DES exerted statistically significant effects (p ≤ 0.05) on the recovery, as well as the volume, of the dissolving solvent employed (Table 2). An increase in the volume of DES used to impregnate the membrane, from 25 to 100 µL, resulted in a positive effect (p ≤ 0.05) of 23.6% on the analytical response. The same behaviour was observed for the time of contact of DES with the membrane, indicating that an increase from 15 to 60 min had a positive effect (p ≤ 0.05) of 31.8% on the recovery of the analyte (Table 2). On the other hand, variations in the extraction time, from 5 to 60 min, resulted in no statistically significant effect (p > 0.05) on the recovery (Table 2), suggesting that a short period does not affect the extraction efficiency. However, alterations in the volume of the dissolving solvent, from 250 to 1000 µL of methanol, had a negative significant impact (p ≤ 0.05) of −55.3% on the recovery (Table 2), indicating that the lowest volumes are more suitable to attain better analytical responses. Therefore, based on the Plackett–Burman design and the practical aspects, the optimal conditions were established as 100 µL of DES for impregnation of the membrane with a contact time of 60 min, followed by extraction of analytes for 15 min and then elution of analytes from the membrane using 300 µL of methanol.

3.3. In-House Validation

Based on the selected experimental conditions for the proposed microextraction technique, the analytical method was validated in terms of linearity, precision, recovery, limit of detection (LOD), and limit of quantification (LOQ). For linearity, seven-point calibration curves in ultrapure water using concentrations ranging from 2.5 µg/L to 100 μg/L were subjected to the entire analytical procedure to assess the slope of the calibration curve, y-intercept, and determination coefficient (R2), as shown in Table 3. Acceptable linearity was obtained, with determination coefficients ranging from 0.9966 to 0.9997.
The LOD and LOQ were assumed as the lowest analyte concentrations in surface water that reliably achieved a signal-to-noise ratio of 3:1 and 10:1, respectively. The obtained LODs were between 0.06 and 0.15 µg/L, while the LOQ values varied from 0.2 to 0.5 µg/L. To date, published information involving DES for the extraction of PMs in surface waters samples is nonexistent [14]. Nevertheless, our LOQs for the analyzed PMs are generally similar than those reported by other researchers using different extraction procedures, as presented in Supplementary Material Section S6—Table S2.
Recovery and precision were determined using one surface water sample spiked with all analytes at three concentration levels, with each test performed six times. The analytes were not detected in the sample. Recoveries were calculated as the ratio of the peak area of the extracted analyte from the sample matrix to the peak area of the extracted analyte from ultrapure water. Table 4 presents the average recoveries and relative standard deviations (RSD). Acceptable relative recoveries were obtained, ranging from 70% to 111.0%. Generally, relative recoveries within the range 80–120% are considered acceptable and indicate that matrix effects do not give rise to significant error in analyte quantification [25]. The RSD values observed were lower than 20% for all analytes in the all-concentration levels evaluated.

3.4. Real Samples

The applicability of the proposed method was evaluated using surface water samples collected from three rivers in the north of Portugal: Leça (Matosinhos, Portugal), Coura (Caminha Portugal), and Douro (Porto, Portugal). All water samples were collected in amber glass bottles and stored in the dark at −20 °C until processing. Only two of the four analytes evaluated were detected, namely HHCB and AHTN. Both analytes were identified in samples from Leça at levels below the LOQ.

3.5. Evaluation of the Analytical Method Through Metric Tools

The proposed protocol was then evaluated regarding its greenness and practicability through the metric tools Analytical Greenness (AGREE) [21] and Blue Applicability Grade Index (BAGI) [22], respectively. Twelve criteria associated with the principles of Green Analytical Chemistry were evaluated, as detailed in Figure 6A. An overall score of 0.51 was obtained, based on a unified scale from 0 (red) to 1 (dark green), indicating a certain greenness of the analytical procedure (Figure 6A). The green features are associated with the reduced number of steps (criterium 4), miniaturized sample preparation (criterium 5), absence of derivatization (criterium 6), number of analytes determined in a single run and the number of samples analyzed per hour (criterium 8), use of reagents from bio-based sources (criterium 10), reduced volume of toxic solvents (criterium 11), and operator’s safety (criterium 12). The non-green aspects of the entire protocol are particularly linked to the GC–MS technique, namely the analytical device positioning with off-line measurement (criterium 3) and energy-intensive instrumentation (criterium 9) (Figure 6A), for which the lowest weight was assigned (weight 1), considering that chromatography systems coupled to mass spectrometry are crucial for the determination of multi-contaminants at trace levels. For all others, the same weight was attributed (weight 3), assuming that all of them are equally important (Figure 6A). As a complement to AGREE, the BAGI evaluates ten attributes based on the practical aspects of White Analytical Chemistry [22]. With an overall score of 65, on a scale between 25 (white) and 100 (dark blue), the analytical method demonstrated a good performance in terms of practicality and applicability (Figure 6B). The proposed procedure highlighted for quantitative and confirmatory analysis (attribute 1), sample preparation scale (attribute 5), number of samples analyzed per hour (attribute 6), non-requirement for additional preconcentration step (attribute 8), and semi-automation with common devices, e.g., GC autosampler (attribute 9) (Figure 6B).

4. Conclusions

This study successfully applied hydrophobic DES for the detection of PM in surface waters, emphasizing the versatility and eco-friendliness of this emerging solvent class. By coating cellulose-based membranes with DES, an innovative microextraction approach was developed and optimized followed by a GC-MS analysis. Following the Green Analytical Chemistry requirements, the Plackett–Burman screening design was used to optimize the extraction conditions through a reduced number of trials, thus saving time and reagent and solvent consumption. The DES composition, membrane type, impregnation duration, and extraction parameters were systematically evaluated, revealing that cellulose acetate membranes impregnated with a DES (TBAB:C6, 1:3 molar ratio) achieved superior extraction efficiencies for all four PMs studied. The optimized method demonstrated a linear detection range of 2.5 to 100 µg/L, with low limits of detection (0.06–0.15 µg/L) and quantification (0.2–0.5 µg/L), meeting the sensitivity requirements for environmental monitoring. The use of DESs in this method offers significant advantages over conventional solvents, including reduced toxicity, enhanced compatibility with hydrophobic analytes, and lower environmental impact. Furthermore, the validated method successfully identified target musks in real-world surface water samples, showcasing its practical applicability in environmental analysis. The greenness and practicality of the proposed method were confirmed by the AGREE and BAGI metric tools, respectively. By integrating green chemistry principles with advanced extraction methodologies, this study contributes to the development of effective and sustainable strategies for addressing the challenges posed by emerging pollutants.

Supplementary Materials

The following are available online at https://www.mdpi.com/article/10.3390/chemosensors13030088/s1. References [26,27,28,29,30,31,32,33,34,35,36,37,38,39,40] are cited in the Supplementary Materials. Figure S1—Infrared spectra for the DES solvent (TBAB:C6, 1:3 molar ratio) (blue line) and its precursors TBAB (TBB-black line) and C6 (CAPH- red line); Figure S2—Infrared spectrum for TBAB; Figure S3—DSC thermogram for the DES solvent (TBAB:C6, 1:3 molar ratio); Figure S4—Microextraction procedure optimized for extraction of polycyclic musk in surface waters; Figure S5—Total ion chromatogram of a standard at 50 µg/L and selected ion chromatogram of cashmeran (7.119 min) and galaxolide (10.81 min); Figure S6—Comparison of the relative peak areas of target analytes using three different dissolvent solvents, Experimental conditions: sample volume, 20 mL; stirring rate, 250 rpm; DES volume, 50 μL; membrane, cellulose acetate; extraction time, 60 min; dissolving solvent volume, 500 μL. Spiked analyte concentration: 50 μg/L for all analytes and 25 μg/L of IS. All extractions were performed in triplicate; Table S1—GC-MS acquisition parameters of the polycyclic musks time o retention, ion of quantification and ions of qualification; Table S2—Comparison of the proposed procedure with other methods for the analysis of PCM in waters.

Author Contributions

Conceptualization and design of the experiments—F.T., J.O.F., R.L. and S.C.C.; Performed the experimental work—F.T., S.C.C. and T.G.; Analyzed the experimental data –F.T., J.O.F., R.L., M.H.P., M.H.G. and S.C.C.; writing—original draft preparation—F.T. and S.C.C.; writing—review and editing—F.T., J.O.F., T.G., M.H.P., L.d.S.S., R.S.L., M.H.G., R.S.L. and S.C.C.; project administration, S.C.C.; funding acquisition, S.C.C. All authors have read and agreed to the published version of the manuscript.

Funding

This work received financial support from PT National Funds (FCT/MCTES, Fundação para a Ciência e Tecnologia and Ministério da Ciência, Tecnologia e Ensino Superior) through the project CleanH2O-2022.03009.PTDC (https://doi.org/10.54499/2022.03009.PTDC).

Institutional Review Board Statement

Not applicable.

Informed Consent Statement

Not applicable.

Data Availability Statement

Data is contained within the article or Supplementary Materials.

Acknowledgments

MHG is grateful for the financial support provided by the São Paulo Research Foundation (FAPESP, grant numbers #2014/50945-4, FAPESP #2021/14581-1, and 2021/14759-5) and the National Institute for Alternative Technologies of Detection, Toxicological Evaluation and Removal of Micropollutants and Radioactives (INCT-DATREM/CNPq, grant number #465571/2014-0. This work received financial support from the PT national funds (FCT/MECI, Fundação para a Ciência e Tecnologia and Ministério da Educação, Ciência e Inovação) through the project UID/50006 -Laboratório Associado para a Química Verde—Tecnologias e Processos Limpos. The authors Acknowledgments APA for the collection of the samples.

Conflicts of Interest

The authors declare no conflicts of interest.

References

  1. Cunha, S.C.; Menezes-Sousa, D.; Mello, F.M.; Miranda, J.A.T.; Fogaca, F.; Alonso, M.B.; Torres, J.P.M.; Fernandes, J.O. Survey on endocrine-disrupting chemicals in seafood: Occurrence and distribution. Environ. Res. 2022, 210, 112886. [Google Scholar] [CrossRef]
  2. Aminot, Y.; Munschy, C.; Héas-Moisan, K.; Pollono, C.; Tixier, C. Levels and trends of synthetic musks in marine bivalves from French coastal areas. Chemosphere 2021, 268, 129312. [Google Scholar] [CrossRef] [PubMed]
  3. Košnář, Z.; Mercl, F.; Chane, A.D.; Pierdonà, L.; Míchal, P.; Tlustoš, P. Occurrence of synthetic polycyclic and nitro musk compounds in sewage sludge from municipal wastewater treatment plants. Sci. Total Environ. 2021, 801, 149777. [Google Scholar] [CrossRef]
  4. Tasselli, S.; Valenti, E.; Guzzella, L. Polycyclic musk fragrance (PMF) removal, adsorption and biodegradation in a conventional activated sludge wastewater treatment plant in Northern Italy. Environ. Sci. Pollut. Res. 2021, 28, 38054–38064. [Google Scholar] [CrossRef]
  5. Ren, S.; Tan, F.; Wang, Y.; Zhao, H.; Zhang, Y.; Zhai, M.; Chen, J.; Wang, X. In situ measurement of synthetic musks in wastewaters using diffusive gradients in thin film technique. Water Res. 2020, 185, 116239. [Google Scholar] [CrossRef]
  6. Juksu, K.; Liu, Y.; Zhao, J.; Yao, L.; Sarin, C.; Sreesai, S.; Klomjek, P.; Traitangwong, A.; Ying, G. Emerging contaminants in aquatic environments and coastal waters affected by urban wastewater discharge in Thailand: An ecological risk perspective. Ecotox. Environ. Safe. 2020, 204, 110952. [Google Scholar] [CrossRef]
  7. Wang, T.; Zou, H.; Li, D.; Gao, J.; Bu, Q.; Wang, Z. Global distribution and ecological risk assessment of synthetic musks in the environment. Environ. Pollut. 2023, 331, 121893. [Google Scholar] [CrossRef] [PubMed]
  8. Lee, I.S.; Lee, S.H.; Oh, J.E. Occurrence and fate of synthetic musk compounds in water environment. Water Res. 2010, 44, 214–222. [Google Scholar] [CrossRef] [PubMed]
  9. Ding, T.; Li, W.; Cai, M.; Jia, X.; Yang, M.; Yang, B.; Li, J. Algal toxicity, accumulation and metabolic pathways of galaxolide. J. Hazard. Mater. 2020, 384, 121360. [Google Scholar] [CrossRef]
  10. Parolini, M.; Magni, S.; Traversi, I.; Villa, S.; Finizio, A.; Binelli, A. Environmentally relevant concentrations of galaxolide (HHCB) and tonalide (AHTN) induced oxidative and genetic damage in Dreissena polymorpha. J. Hazard. Mater. 2015, 285, 1–10. [Google Scholar] [CrossRef]
  11. Pedersen, S.; Selck, H.; Salvito, D.; Forbes, V. Effects of the polycyclic musk HHCB on individual-and population-level endpoints in Potamopyrgus antipodarum. Ecotoxicol. Environ. Saf. 2009, 72, 1190–1199. [Google Scholar] [CrossRef]
  12. Li, Z.; Yin, N.; Liu, Q.; Wang, C.; Wang, T.; Wang, Y.; Qu, G.; Liu, J.; Cai, Y.; Zhou, Q.; et al. Effects of polycyclic musks HHCB and AHTN on steroidogenesis in H295R cells. Chemosphere 2013, 90, 1227–1235. [Google Scholar] [CrossRef] [PubMed]
  13. Vallecillos, L.; Borrull, F.; Pocurull, E. Recent approaches for the determination of synthetic musk fragrances in environmental samples. TrAC Trends Anal. Chem. 2015, 72, 80–92. [Google Scholar] [CrossRef]
  14. Cunha, S.C.; Lapa, R.; Fernandes, J.O. Deep eutectic solvents for microextraction of endocrine (Cunha et al., 2022)disruptor contaminants from water and food: Review. TrAC Trends Anal. Chem. 2024, 171, 117495. [Google Scholar] [CrossRef]
  15. Abbott, A.P.; Capper, G.; Davies, D.L.; Rasheed, R.K.; Tambyrajah, V. Novel solvent properties of choline chloride/urea mixtures. Chem. Commun. 2003, 1, 70–71. [Google Scholar] [CrossRef]
  16. Li, T.; Song, Y.; Xu, J.; Fan, J. A hydrophobic deep eutectic solvent mediated sol-gel coating of solid phase microextraction fiber for determination of toluene, ethylbenzene and o-xylene in water coupled with GC-FID. Talanta 2019, 195, 298–305. [Google Scholar] [CrossRef]
  17. Werner, J.; Zgoła-Grześkowiak, A.; Grześkowiak, T. Development of novel thin-film solid-phase microextraction materials based on deep eutectic solvents for preconcentration of trace amounts of parabens in surface waters. J. Sep. Sci. 2022, 45, 1374–1384. [Google Scholar] [CrossRef]
  18. Quintanilla, I.; Fontàs, C.; Anticó, E. Deep eutectic solvents incorporated in a polymeric film for organophosphorus pesticide microextraction from water samples. Anal. Chim. Acta 2024, 1318, 342940. [Google Scholar] [CrossRef]
  19. Ríos-Gómez, J.; García-Valverde, M.T.; López-Lorente, Á.I.; Toledo-Neira, C.; Lucena, R. Soledad Cárdenas Polymeric ionic liquid immobilized onto paper as sorptive phase in microextraction. Anal. Chim. Acta 2020, 1094, 47–56. [Google Scholar] [CrossRef]
  20. Mansour, F.R.; Omer, K.M.; Płotka-Wasylka, J. A total scoring system and software for complex modified GAPI (ComplexMoGAPI) application in the assessment of method greenness. Green Anal. Chem. 2024, 10, 100126. [Google Scholar] [CrossRef]
  21. Pena-Pereira, F.; Wojnowski, W.; Tobiszewski, M. AGREE—Analytical greenness metric approach and software. Anal. Chem. 2020, 92, 10076–10082. [Google Scholar] [CrossRef] [PubMed]
  22. Manousi, N.; Wojnowski, W.; Plotka-Wasylka, J.; Samanidou, V. Blue applicability grade index (BAGI) and software: A new tool for the evaluation of method practicability. Green Chem. 2023, 25, 7598–7604. [Google Scholar] [CrossRef]
  23. Shishov, A.; Makoś-Chełstowska, P.; Bulatov, A.; Andruch, V. Deep Eutectic Solvents or Eutectic Mixtures? Characterization of Tetrabutylammonium Bromide and Nonanoic Acid Mixtures. J. Phys. Chem. B 2022, 126, 3889–3896. [Google Scholar] [CrossRef]
  24. Rodrigues, M.I.; Iemma, A.F. Experimental Design and Process Optimization, 1st ed.; CRC Press: Boca Raton, FL, USA, 2014. [Google Scholar]
  25. European Commission. Analytical Quality Control and Method Validation Procedures for Pesticide Residues Analysis in Food and Feed. SANTE/11312/2021. 2022. Available online: https://www.eurl-pesticides.eu/docs/public/tmplt_article.asp?CntID=727 (accessed on 1 December 2024).
  26. Shafie, M.H.; Yusof, R.; Gan, C.Y. Synthesis of citric acid monohydrate-choline chloride based deep eutectic solvents (DES) and characterization of their physicochemical properties. J. Mol. Liq. 2019, 288, 111081. [Google Scholar] [CrossRef]
  27. Tang, N.; Liu, L.; Yin, C.; Zhu, G.; Huang, Q.; Dong, J.; Yang, X.; Wang, S. Environmentally benign hydrophobic deep eutectic solvents for palladium (II) extraction from hydrochloric acid solution. J. Taiwan Inst. Chem. Eng. 2021, 121, 92–100. [Google Scholar] [CrossRef]
  28. Hansen, B.B.; Spittle, S.; Chen, B.; Poe, D.; Zhang, Y.; Klein, M.J.; Horton, A.; Adhikari, L.; Zelovich, T.; Doherty, W.B.; et al. Deep Eutectic Solvents: A Review of Fundamentals and Applications. Am. Chem. Soc. 2021, 121, 1232–1285. [Google Scholar] [CrossRef]
  29. Alhadid, A.; Mokrushina, L.; Minceva, M. Formation of glassy phases and polymorphism in deep eutectic solvents. J. Mol. Liq. 2020, 314, 113667. [Google Scholar] [CrossRef]
  30. Drebushchak, V.A. Thermophysical theory of DSC melting peak. J. Therm. Anal. Calorim. 2012, 545–553. [Google Scholar] [CrossRef]
  31. Menczel, J.D.; Kohl, W.S. Differential scanning calorimetry (DSC) in fiber research. In The Textile Institute Book Series, Thermal Analysis of Textiles and Fibers; Jaffe, M., Menczel, J.D., Eds.; Woodhead Publishing: Cambridge, UK, 2020; pp. 17–69. [Google Scholar] [CrossRef]
  32. Fatahi, H.; Claverie, J.; Poncet, S.; Fatahi, H.; Claverie, J.; Poncet, S. Thermal Characterization of Phase Change Materials by Differential Scanning Calorimetry: A Review. Appl. Sci. 2022, 12, 12019. [Google Scholar] [CrossRef]
  33. Schawe, J.E.K.; Pogatscher, S.; Löffler, J.F. Thermodynamics of polymorphism in a bulk metallic glass: Heat capacity measurements by fast differential scanning calorimetry. Thermochim. Acta 2020, 685, 178518. [Google Scholar] [CrossRef]
  34. Morrison, H.G.; Sun, C.C.; Neervannan, S. Characterization of thermal behavior of deep eutectic solvents and their potential as drug solubilization vehicles. Int. J. Pharm. 2009, 378, 136–139. [Google Scholar] [CrossRef] [PubMed]
  35. Pavia, D.L.; Lampman, G.M.; Kriz, G.S.; Vyvyan, J.R. Introdução à Espectroscopia, 4th ed.; Cengage Learning: Singapore, 2010. [Google Scholar]
  36. Delgado-Mellado, N.; Larriba, M.; Navarro, P.; Rigual, V.; Ayuso, M.; García, J.; Rodríguez, F. Thermal stability of choline chloride deep eutectic solvents by TGA/FTIR-ATR analysis. J. Mol. Liq. 2018, 260, 37–43. [Google Scholar] [CrossRef]
  37. Ribeiro, B.D.; Florindo, C.; Iff, L.C.; Coelho, M.A.; Marrucho, I.M. Menthol-based Eutectic Mixtures: Hydrophobic Low Viscosity Solvents. ACS Sustain. Chem. Eng. 2015, 3, 2469–2477. [Google Scholar] [CrossRef]
  38. Lange, C.; Kuch, B.; Metzger, J.W. Occurrence and fate of synthetic musk fragrances in a small German river. J. Hazard. Mater. 2015, 282, 34–40. [Google Scholar] [CrossRef] [PubMed]
  39. Siyan, L.; Fang, Z.; Ruifen, J.; Gangfeng, O. Preparation and evaluation of amino modified graphene solid-phase microextraction fiber and its application to the determination of synthetic musks in water samples. J. Chromat. A 2016, 1429, 1–7. [Google Scholar]
  40. Vimalkumar, K.; Nikhil, N.P.; Arun, E.; Babu-Rajendran, M.R. Synthetic musks in surface water and fish from the rivers in India: Seasonal distribution and toxicological risk assessment. J. Hazard. Mater. 2021, 414, 125558. [Google Scholar] [CrossRef]
Figure 1. FT-IR spectrum of cellulose acetate (a), cellulose (b), and cellulose nitrate (c): raw (black line), with DES (TBAB:C6, 1:3 molar ratio) (blue line) and with DES after extraction of tonalid (red line).
Chemosensors 13 00088 g001
Figure 2. Confirmation of the structure (via SEM images) of cellulose nitrate (a), cellulose nitrate with DES (TBAB: C6, 1:3 molar ratio) (b), cellulose acetate (d), cellulose acetate with DES (TBAB: C6, 1:3 molar ratio) (e), cellulose (g), and cellulose with DES (TBAB: C6, 1:3 molar ratio) (h), as well as the composition (via EDX analysis) of the selected DES with cellulose nitrate (c), cellulose acetate (f), and cellulose (i).
Chemosensors 13 00088 g002aChemosensors 13 00088 g002b
Figure 3. Comparison of the relative peak areas of target analytes using four different DES, including TBAC:C6 (1:2 and 1:3 molar ratios) and TBAB:C6 (1:2 and 1:3 molar ratios). Experimental conditions: sample volume, 20 mL; stirring rate, 250 rpm; DES volume, 50 μL; membrane, cellulose; extraction time, 60 min; dissolving solvent, acetonitrile; dissolving solvent volume, 500 μL. Spiked-analyte concentration: 50 μg/L for all analytes and 25 μg/L of IS. All extractions were performed in triplicate. Different letters in each column of analytes show statistically significant differences (p < 0.05) from the given mean.
Chemosensors 13 00088 g003
Figure 4. Selection of suitable membrane (cellulose, cellulose nitrate, and cellulose acetate) using TBAB:C6 (1:3 molar ratio). Experimental conditions: sample volume, 20 mL; stirring rate, 250 rpm; DES volume, 50 μL; extraction time, 60 min; dissolving solvent, methanol; dissolving solvent volume, 500 μL. Spiked-analyte concentration: 50 μg/L for all analytes and 25 μg/L of IS. All extractions were performed in triplicate.
Chemosensors 13 00088 g004
Figure 5. Composition (via EDX analysis) of the selected DES-coated cellulose acetate after (a) and before (b) tonalid extraction. Experimental conditions: sample volume: 20 mL; stirring rate: 250 rpm; DES volume: 100 μL; membrane: cellulose acetate extraction time: 60 min; spiked tonalid concentration: 50 μg/L.
Chemosensors 13 00088 g005
Figure 6. Evaluation of greenness and practicability of the analytical procedure through the Analytical Greenness—AGREE (A)—and Blue Applicability Grade Index—BAGI (B)—metric tools, respectively. The numbers 1 to 10 were added to the BAGI asteroid pictogram (B) to indicate the attributes evaluated in the metric tool.
Chemosensors 13 00088 g006
Table 1. Plackett–Burman design with the coded (and real) conditions studied for four sample preparation variables, including the percentage of recovery obtained for the tonalid.
TrialX1 (DES Volume, µL)X2 (DES Time, Min)X3 (Extraction Time, Min)X4 (Dissolving Solvent Volume, µL)Recovery (%)
1+1 (100)−1 (15)−1 (5)+1 (1000)16.8
2+1 (100)+1 (60)−1 (5)−1 (250)117.7
3+1 (100)+1 (60)+1 (60)−1 (250)92.9
4−1 (25)+1 (60)+1 (60)+1 (1000)38.2
5+1 (100)−1 (15)+1 (60)+1 (1000)19.6
6−1 (25)+1 (60)−1 (5)+1 (1000)14.5
7−1 (25)−1 (15)+1 (60)−1 (250)49.7
8−1 (25)−1 (15)−1 (5)−1 (250)49.9
CP 10 (62.5)0 (37.5)0 (32.5)0 (625)17.1
CP 20 (62.5)0 (37.5)0 (32.5)0 (625)11.6
CP 30 (62.5)0 (37.5)0 (32.5)0 (625)22.5
CP: central point.
Table 2. Main effect of the sample preparation variables on the analytical response (recovery of tonalid, %) estimated from the Plackett–Burman design.
Variable (Range)Effect (%)Standard Errort (5)p-Value
DES volume (25–100 µL)23.648.052.940.0323 *
DES time (15–60 min)31.818.053.950.0108 *
Extraction time (5–60 min)0.378.050.050.9649
Dissolving solvent volume (250–1000 µL)−55.288.05−6.870.0009 *
* Significant factor: p ≤ 0.05.
Table 3. Figures of merit of the calibration curves, LOD, and LOQ of DES-membrane-coated GC-MS method using the TBAB: C6 (1:3 molar ratio) and acetate cellulose as extraction.
AnalytesLinear Range a (µg/L)Slope ± SD (n = 3)Intercept ± SD (n = 3)R2 bLOD c (µg/L)LOQ d (µg/L)
Cashmeran2.5–1000.1214 ± 0.00140.6486 ± 0.071660.99970.150.5
Celestolide2.5–1000.2004 ± 0.00531.07332 ± 0.27780.99820.060.2
Galaxolide2.5–1000.1020 ± 0.00340.6025 ± 0.17720.99720.150.5
Tonalid2.5–1000.1511 ± 0.00560.7375 ± 0.29050.99660.060.2
a Six calibration levels were used for constructing the calibration curves. b Determination coefficient. c Calculated as three times the signal-to-noise ratio. d Calculated as ten times the signal-to-noise ratio.
Table 4. Recovery and precision, expressed as relative standard deviation (RSD), and repeatability conditions (n = 5), at different concentration levels.
Analytes5 µg/L
% Recovery (RSD)
25 µg/L
% Recovery (RSD)
75 µg/L
% Recovery (RSD)
Cashmeran71 (10)85 (6)97 (4)
Celestolide74 (4)96 (7)99 (3)
Galaxolide83 (13)109 (14)107 (4)
Tonalid89 (8)104 (8)106 (6)
Disclaimer/Publisher’s Note: The statements, opinions and data contained in all publications are solely those of the individual author(s) and contributor(s) and not of MDPI and/or the editor(s). MDPI and/or the editor(s) disclaim responsibility for any injury to people or property resulting from any ideas, methods, instructions or products referred to in the content.

