1. Introduction
A fluidic device with a channel band electrode is typically a rectangular channel of micrometer-scale cross-section with a microelectrode embedded in the bottom wall of the channel through which the solution flows [
1,
2]. Although fluidic devices with channel band microelectrodes present some disadvantages including lower currents and capacitances and potential evaporation of sample, they offer several clear advantages over other electrode layouts, such as [
1]:
- i.
The mass transport is well controllable over a wide range of flow rates.
- ii.
Under laminar flow conditions, hydrodynamics are well-known, which facilitates the precise study of electrode processes.
- iii.
The spent solution flows outside the system, unlike the wall-jet layout where stagnant zones are developed.
- iv.
The fluidic device can be fabricated with a wide range of microfabrication methodologies and materials.
- v.
The flowing solution effectively dissipates heat.
These advantages have facilitated the implementation of fluidic devices with channel band microelectrodes in various applications. In analytical procedures such as chromatography, these devices facilitate continuous monitoring, their well-defined hydrodynamics facilitate analysis of electrode reactions, and they can also be used for spectro-electrochemistry [
1]. Their mass transport improvement due to convection allows the development of sensors and biosensors with improved signal-to-noise ratios, better sensitivities, and lower detection limits. In addition, they allow the use of low amounts of sample and reagents during operation [
3,
4]. Another feature to be considered is that the layout of channel band microelectrodes facilitates the fabrication of electrode arrays for multi-analyte detection assays [
3,
4].
The successful applications of these fluidic devices typically rely on traditional microfabrication methodologies of channel band microelectrodes, which include photolithography, soft lithography, etching, micromachining, laser ablation, and deposition processes such as sputtering, thermal vapor evaporation, and screen-printing [
5]. Nevertheless, these conventional methodologies exhibit several drawbacks, including time-consuming and expensive fabrication processes that lack industrial scalability and require clean rooms with well-controlled conditions. In addition, integrating electrodes and carrying out deposition, surface modification, or (bio)functionalization procedures remain challenging within these approaches [
5,
6,
7,
8]. On the other hand, alternative fabrication technology and materials such as additive manufacturing (also known as 3D printing) and polymers, respectively, are revolutionizing the fabrication methodologies of fluidic devices. Some advantages of polymers lie in their wide range of materials and state forms such as liquid resins, solids, and powders. Polymers are cheap compared to silicon; they offer good optical transparency, electrical insulation, and gas permeability properties [
5].
As a result, additive manufacturing has revolutionized conventional fluidic device fabrication techniques by enabling complex and customized designs. Fused deposition modeling (FDM) technology has been used for the fabrication of fluidic electrochemical devices with channel band electrodes, facilitating the integration of electrodes and channels into a single platform [
9,
10,
11,
12]. In this context, O’Neil et al. in 2019 pioneered the single-step production of functional devices with channel band electrodes using FDM 3D printing [
13]. Recently, important advances related to ensuring the functionality of such FDM 3D-printed systems, including in-channel electrode activation [
14] and surface modification and (bio)functionalization of channel band electrodes [
15], were achieved.
Thus, these fabrication methodologies demonstrate the feasibility of the FDM technique for the development of fluidic electrochemical devices with channel band electrodes. Electrochemical detection with 3D-printed fluidic devices can complement other conventional analytical techniques such as chromatography or be used as a stand-alone analytical solution. However, to build efficient 3D-printed fluidic electrochemical devices with channel band electrodes, it is necessary to consider how physical or geometrical parameters, such as porosity, channel geometry, electrode shape, and fluid velocity, affect the current response at the band electrode [
16].
Flow band electrodes can be schematically represented as a channel with electroactive species solution flowing in and with electrodes lying at the bottom, where three major electrode geometries are usually encountered: bumped, inlaid, and recessed. The bumped geometry, with the electrode protruding from the channel surface, is known for its better collection percentage and higher current yield [
16]. On the other hand, electrodes and milli fluidic devices fabricated using FDM technology present numerous pores along their structure, particularly in the middle and top layers, affecting the quality of the object and conductivity properties [
17,
18,
19,
20,
21]. Particular attention is paid to milli fluidic devices where porosity could affect the current limiting response due to the presence of inner microchannels that can vary the mass transport of species. This can potentially lead to different mass transport zones simultaneously occurring in the system.
Various studies using theoretical models and numerical computations mainly based on finite elements analysis have been proposed to model different convection/diffusion zones produced by mass transport phenomena in single-band microelectrode or band microelectrode arrays [
22,
23,
24,
25]. In addition, other works investigated the conditions under which transient, quasi-steady-state, and convective regimes were achieved on microfluidic channels with band microelectrodes in laminar flow conditions according to device geometry and flow velocity [
26,
27,
28,
29,
30]. In particular, the study of the diffusion, convection, and transition regimes in 3D-printed milli fluidic devices with band electrodes under laminar flow and steady-state conditions has not been previously reported. This is due to the complexity arising from the interplay of numerous parameters related to the geometry of the device, its physical properties derived from the manufacturing method, and the hydrodynamic flow conditions.
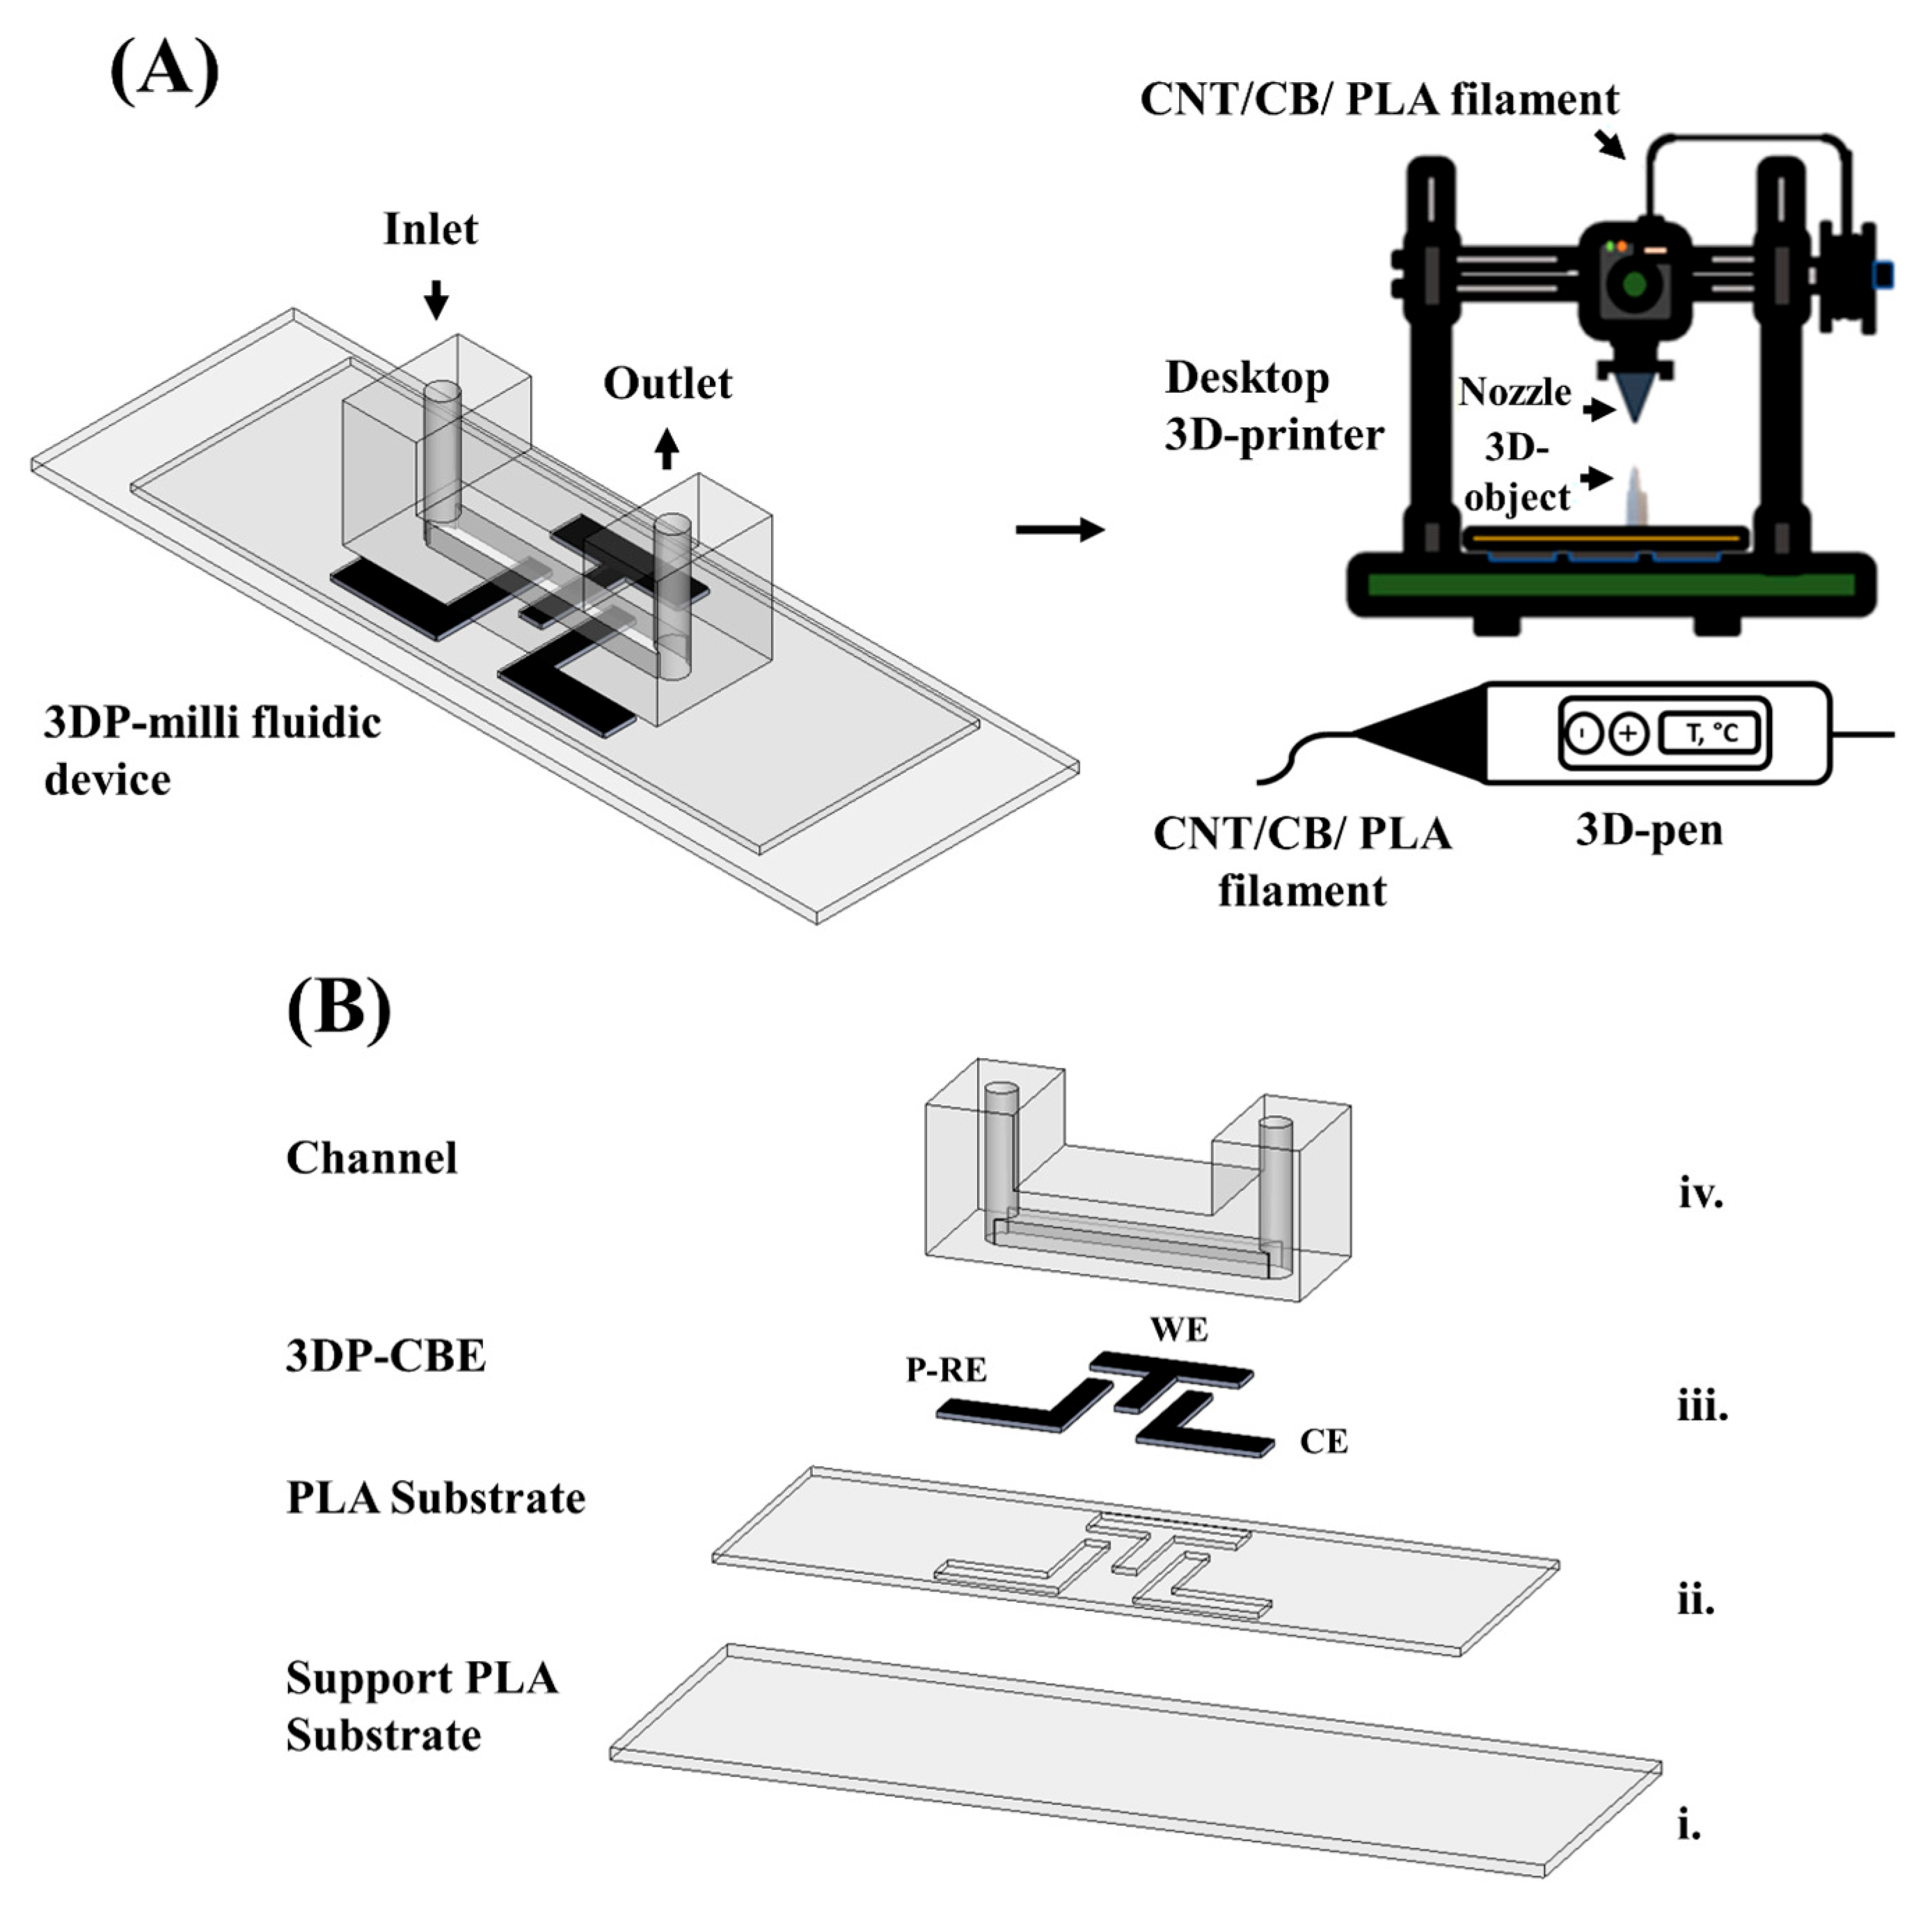
The present study develops an FDM methodology for fabricating a 3D-printed milli fluidic device with channel band electrodes using a conventional desktop 3D printer and a 3D pen. The milli fluidic device with the embedded channel band electrodes (working, counter, and reference) was fabricated following the “print–pause–print” methodology [
15], in which the band electrodes can be activated through a compatible polishing approach followed by the “in-channel” activation methodology [
14].
Meanwhile, numerical simulations were used to study the steady-state amperometric responses of channel band electrodes in milli fluidic systems as a function of electrode shape, device porosity, and flow rates, enabling the formulation of analytical models using dimensionless design parameters. To ensure the reliability of the simulations, numerical computations were validated by replicating previous studies in micrometer-scale systems [
22]. As a result, an adjusted Levich model is proposed to account for non-flat electrode geometries, while two new analytical models—general and transition-specific—predict currents through all mass transport regimes (convection, diffusion, and transition) that can simultaneously emerge due to porosity effects. These advances provide valuable tools for designing next-generation 3D-printed milli fluidic electrochemical platforms with improved performance and scalability.
3. Results and Discussion
3.1. Fabrication and Activation of the 3D-Printed Milli Fluidic Device with Channel Band Electrodes
Different filament activation treatments compatible with the print–pause–print methodology were evaluated prior to the fabrication of the 3D-printed milli fluidic device with channel band electrodes. To achieve this, 3D-printed hybrid carbon electrodes (3DP-H-CEs) were fabricated in a similar design configuration as previously reported by our group [
12]. These 3DP-H-CEs were fabricated not only for activation but also for electrochemical and morphological characterization purposes, as shown in
Supplementary Figures S1 and S2,
Table S7, Methods S1, and Notes S1–S3 [
35,
36]. From the activation study, the polishing time was optimized as follows: electrodes were polished on sandpaper of 600 grit followed by 1200 grit for 1 (P1), 2 (P2), and 4 (P4) minutes. Once the different treatments were evaluated on the 3DP-H-CEs and it was confirmed that the best treatment to activate the electrode surface was P4/EC, the print–pause–print methodology was applied for the fabrication of the 3D-printed milli fluidic device, as described in
Figure 1. This methodology allows polishing directly on the electrodes followed by the in-channel electrochemical activation methodology, as seen in
Figure 4.
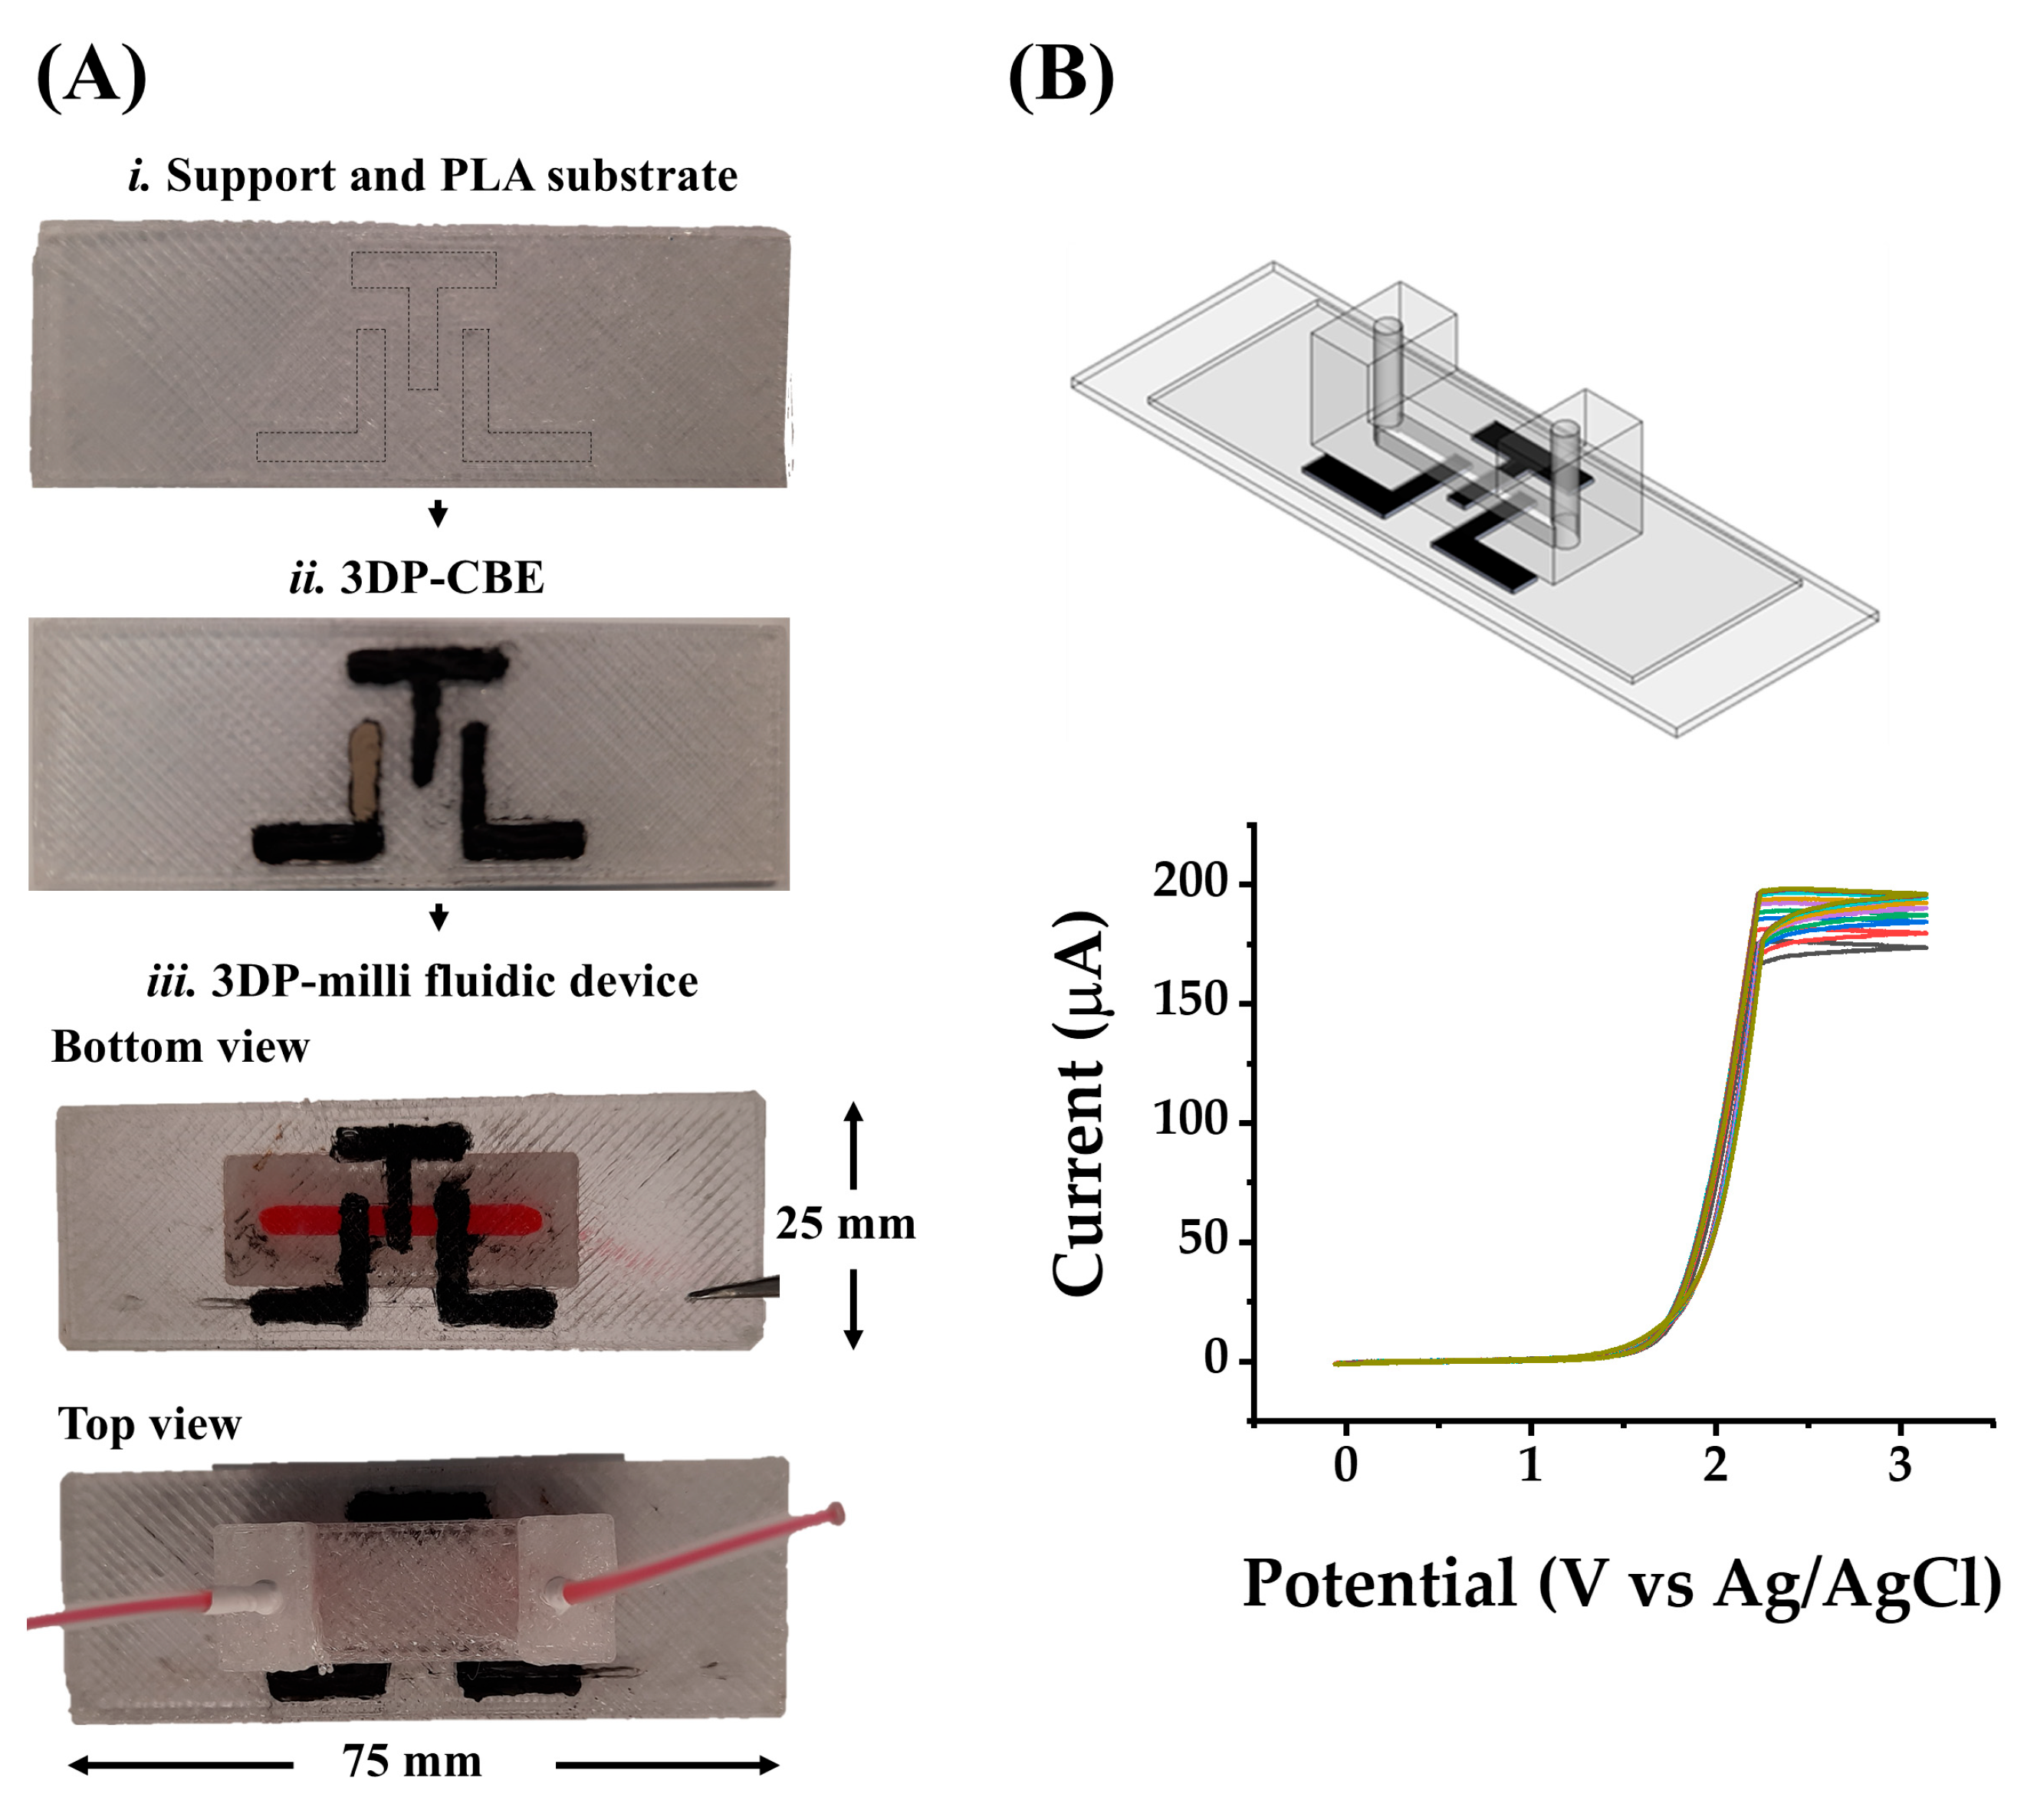
Notice that from the top and bottom view in
Figure 4A, the surface of the support and the PLA substrate looks dirty; this is due to the polishing of the electrodes. On the other hand,
Figure 4B shows the PBS in-channel electrochemical activation of the P4-treated 3DP-CBE applying ten sequential CV scans. As the oxidation of the electrode surface increases with the number of scans, the current response increases from 170 A (first cycle) to 200 A (tenth cycle); meanwhile, the overpotential remained constant at 1.4 V in all cycles. Therefore, like the 3DP-H-CE, the combination of P4 and EC treatments helped in the activation of the 3DP-CBE.
Therefore, this device introduces a manufacturing methodology that brings together different fabrication approaches such as print–pause–print, polishing, and in-channel activation using low-cost equipment such as a conventional desktop 3D printer and a 3D pen. Based on a literature review, it is known that these systems can exhibit high levels of porosity, on the order of 10% and even up to 32% [
17], due to the intrinsic characteristics of the FDM 3D printing technology. However, the deployment of these 3D-printed devices as quantitative chemosensors requires understanding the effect of porosity on the current response, which is currently lacking. Such an investigation would imply considering the effect of multiple printing parameters in the electrochemical performance of the 3D-printed milli fluidic device with channel band electrodes. In order of importance, printing parameters such as layer thickness, infill density, raster deposition angle, printing speed, nozzle temperature, and bed temperature would have to be optimized to ensure the reliable operability of the chemosensor, including long-term stability studies [
37]. However, these studies are outside the scope of the current work. Instead, here, we attempt to achieve a better fundamental understanding of the effect of porosity and other key features such as electrode shape in the current response of the chemosensor using theoretical and computational models. These tools will provide valuable insights about the various mass transport regimes that can be found in these devices, which in the future can be combined with fabrication methodologies, such as the one introduced here, to validate the successful deployment of these types of devices in quantitative sensing.
3.2. Validation Study of Computational Methods
Under stationary conditions, the limiting current response for the validation study of computational methods in simulations and theoretical models, such as the Levich and thin layer expressions in Equations (4) and (5), respectively, was obtained using the following parameters:
n = 1,
F = 96,485 C mol
−1,
c0 = 1 × 10
−6 mol cm
−3, and
D = 7.6 × 10
−6 cm
2 s
−1 [
38], which corresponds to the ferrocene methanol redox probe. To validate the global definitions and structure of the proposed simulation study, the presence of the three main transport regimes that affect the steady-state limiting current in microfluidic systems reported by Amatore et al. [
22] was demonstrated (see
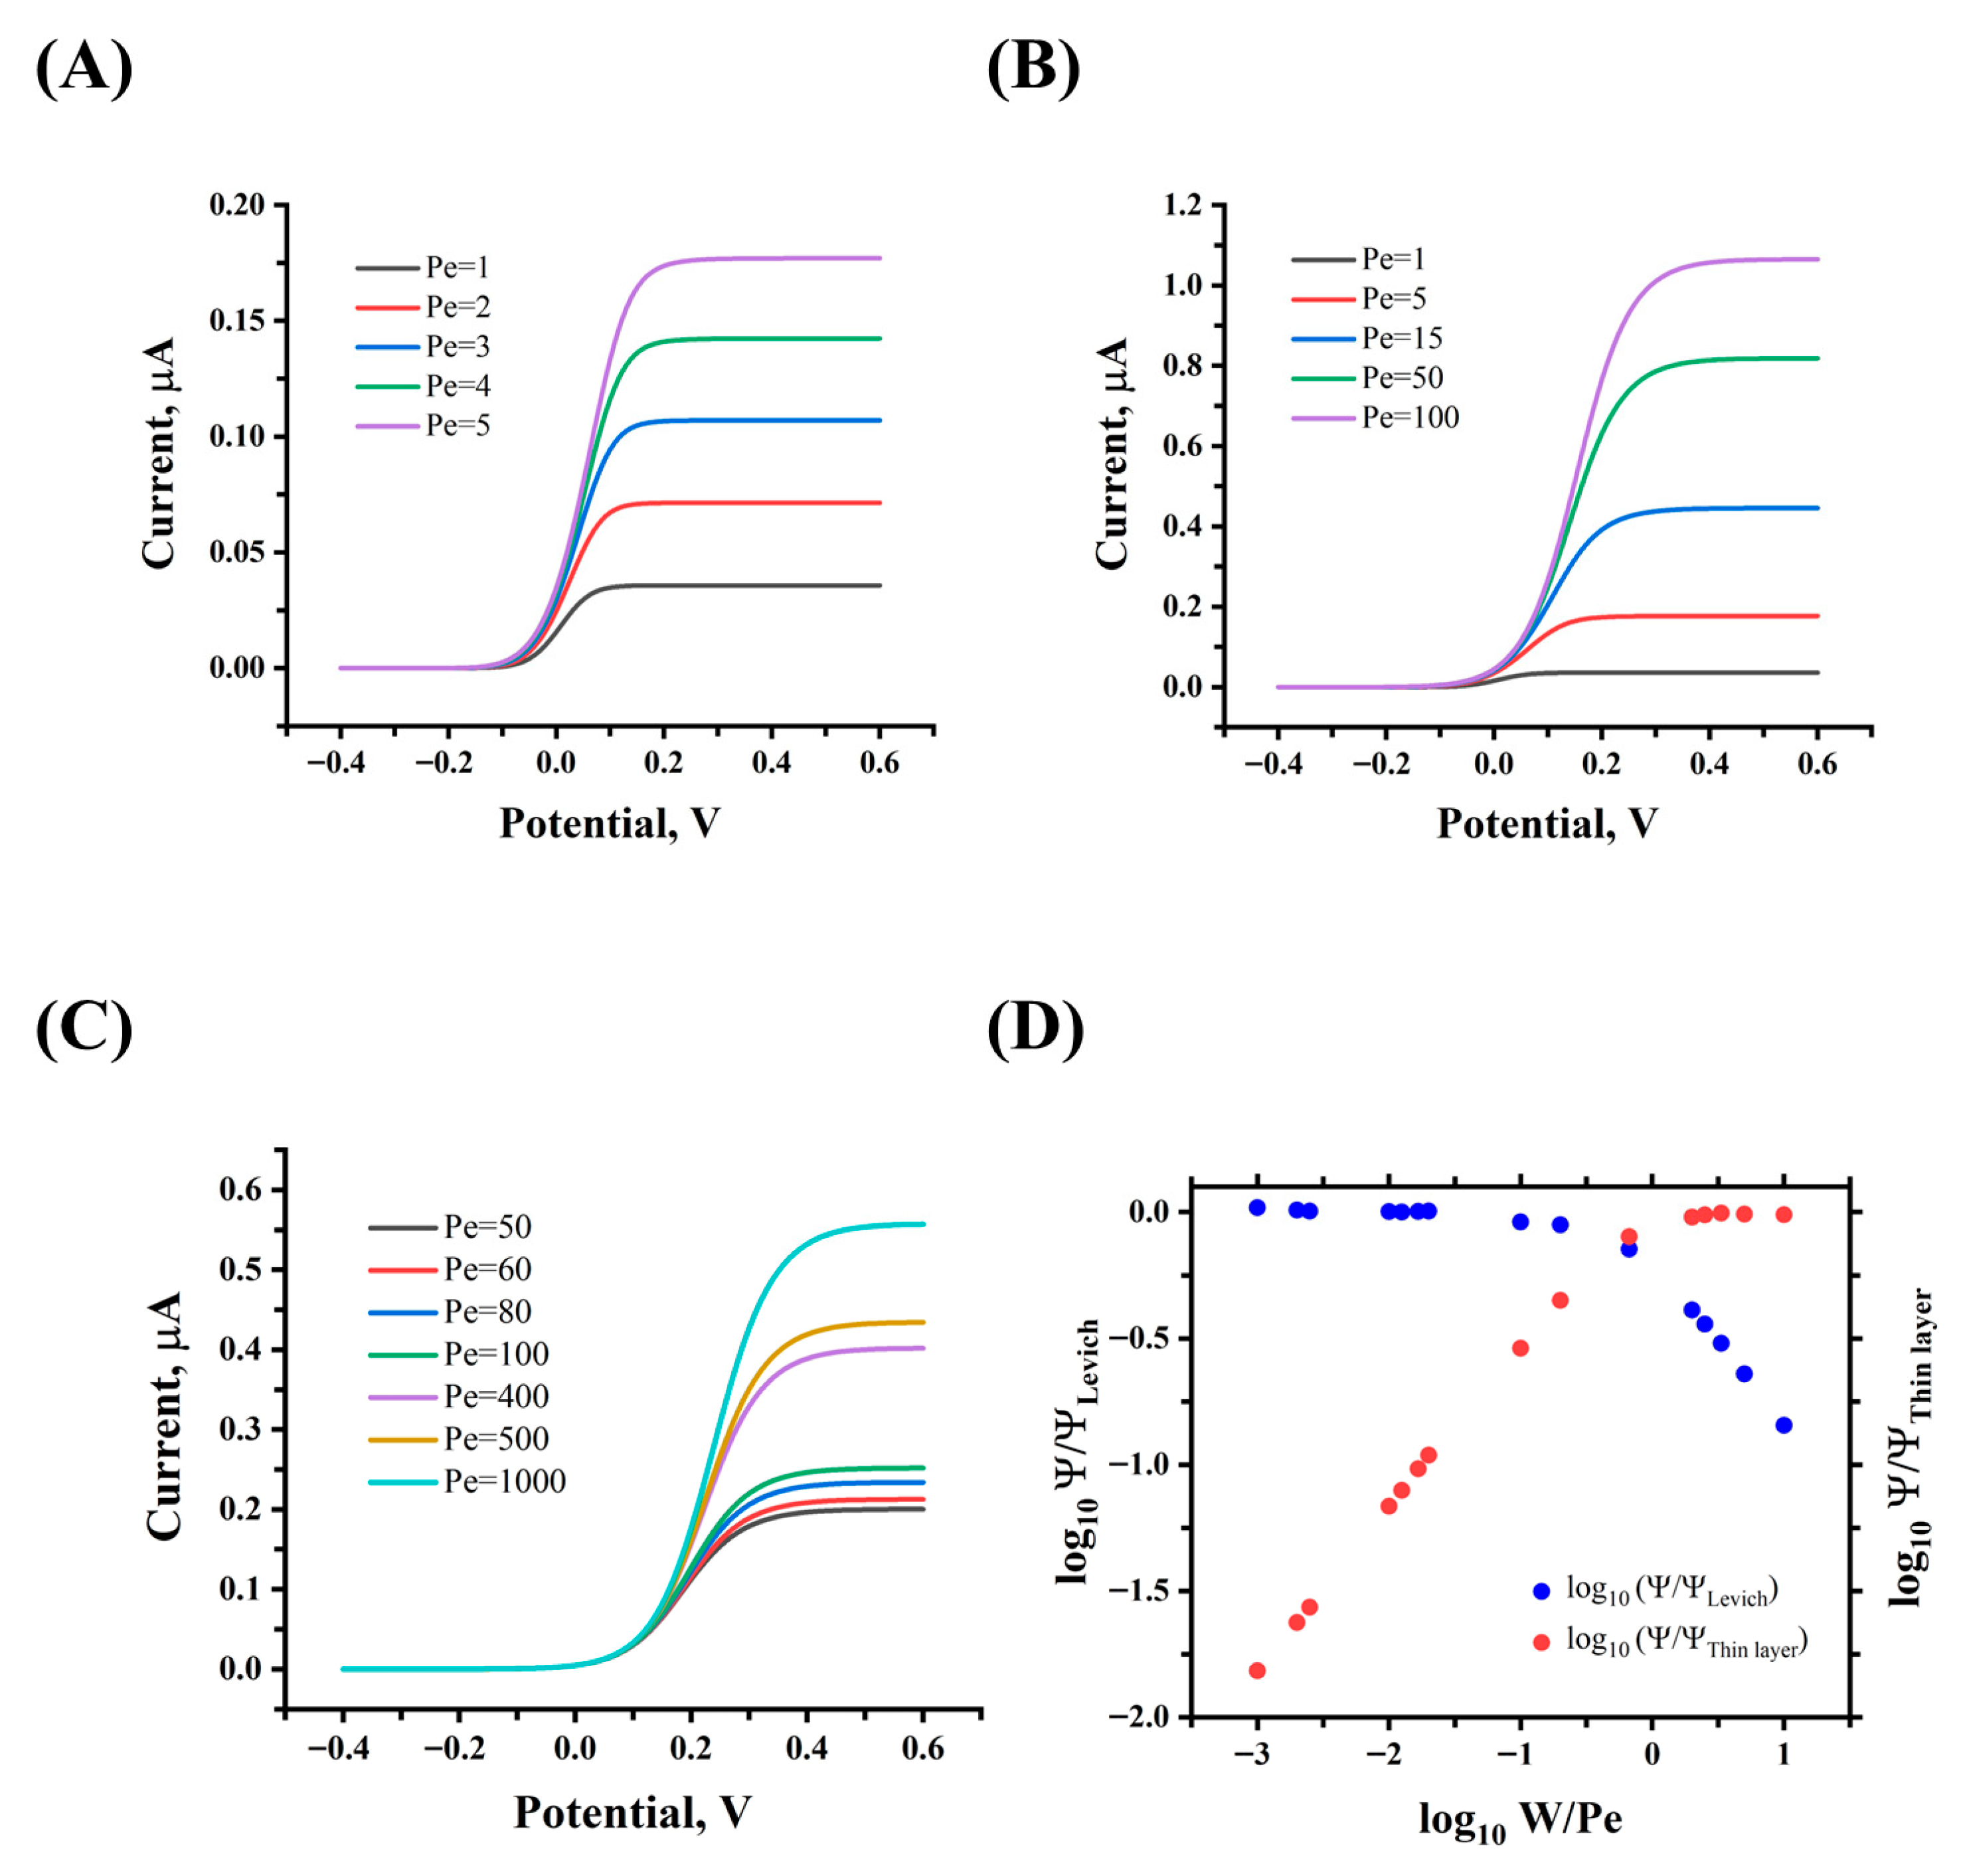
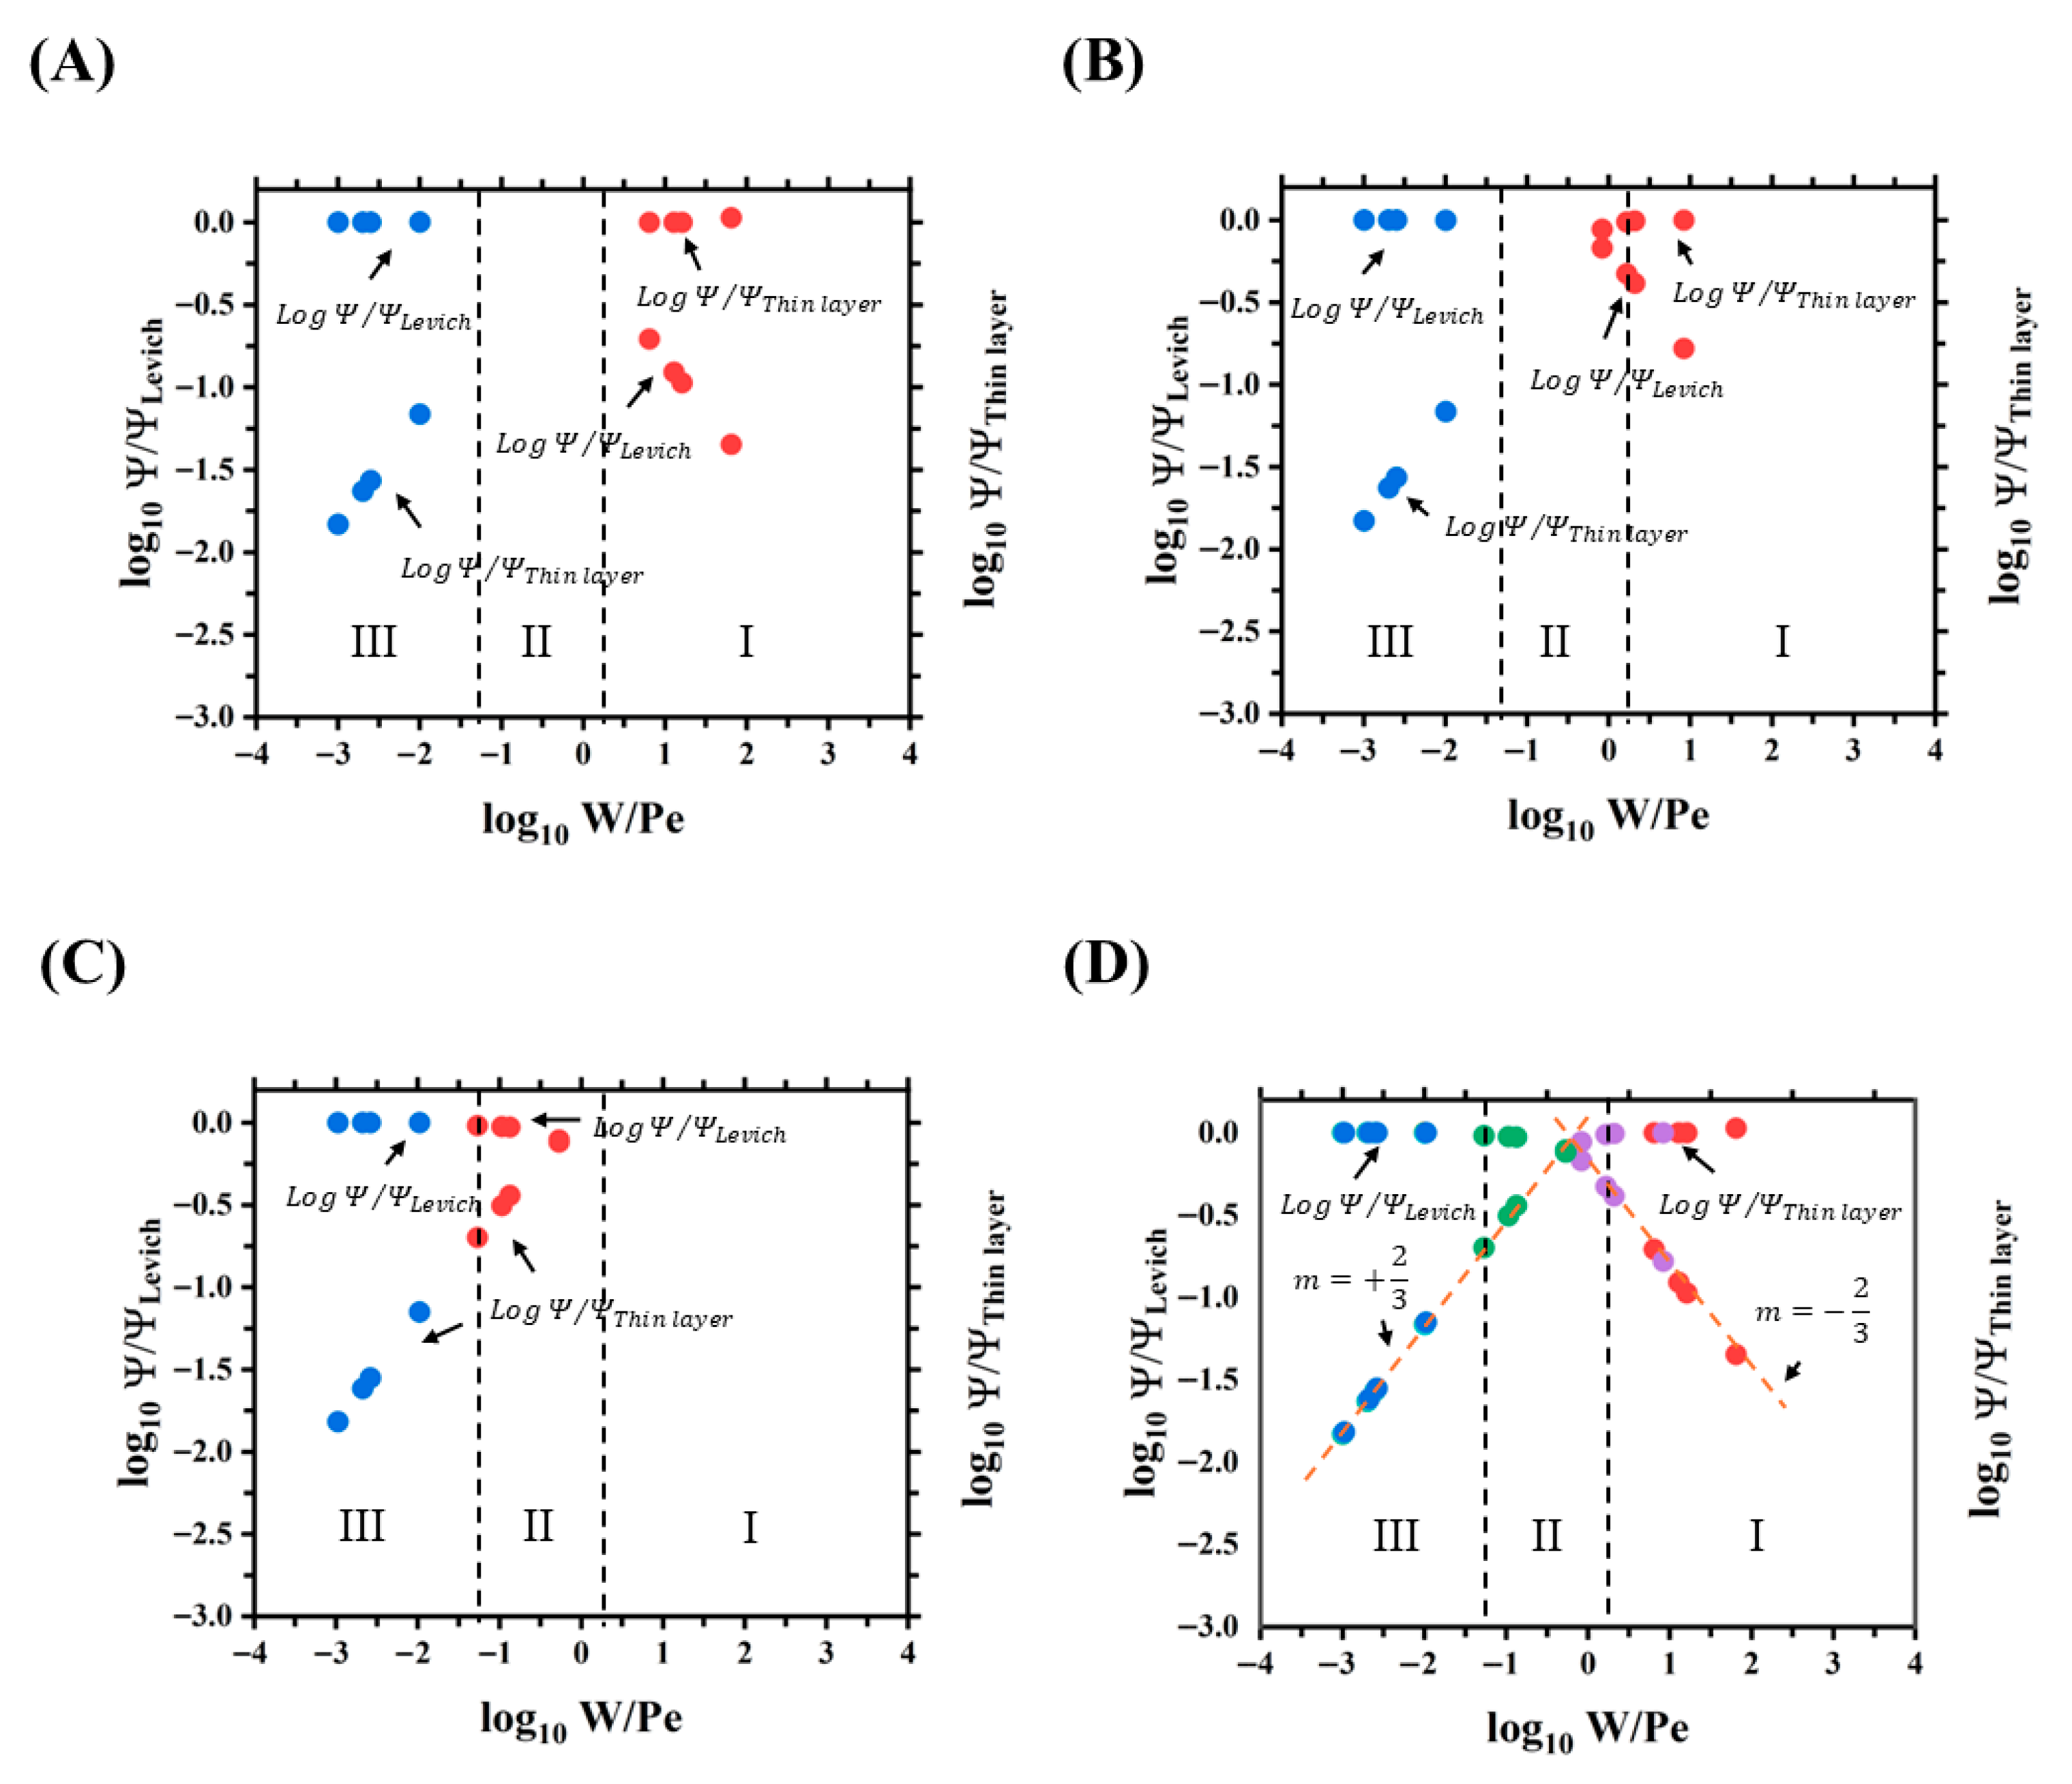
Figure 5).
Zones I and III correspond to the thin layer and Levich regimes, respectively, while zone II is a transition between these two domains so that mixed convection and diffusion contributions occur. Zones I and II are developed from Pe = 1–5 and Pe = 1–100, respectively, with
W = 10, as shown in
Figure 5A,B. Meanwhile, zone III is developed from Pe = 50–1000 with
= 1, as shown in
Figure 5C.
On the other hand,
Figure 5D shows that the current limited response in the three regime zones developed follows the behavior described by Amatore et al. [
22]. The various dimensionless currents
were calculated using Equations (8)–(10) and the currents from
Figure 5A–C. In zone I, the diffusive regime prevails over convection, and the thin layer model successfully explains the current retrieved from the simulations. In zone III, the convective regime prevails over the diffusive one, and the Levich model correctly describes the current measured by the band electrode. Moreover, in zone II, the two flow regimes coexist, but neither Levich nor thin layer can individually describe the current behavior. This successful replication of previously described current regimes in microfluidic systems enables the investigation of similar behavior in larger milli fluidic systems using the established simulation approach.
For the following sections, the limiting current response in simulations and theoretical models, such as the Levich and thin layer expressions in Equations (4) and (5), respectively, was obtained using the following parameters: n = 1, F = 96,485 C mol−1, c0 = 4 × 10⁻⁶ mol cm−3, and D = 6.39 × 10⁻⁶ cm2 s−1, which corresponds to the [Fe(CN)6]4−/3− redox probe.
Prior to studying the effect of electrode height as a design parameter and porosity in current response in a millimeter-scale flow system, a mesh convergence study was carried out to choose the appropriate mesh conditions for computational analysis. This mesh convergence study allowed us to ensure convergence of the current retrieved from simulations (see
Supplementary Figures S3 and S4,
Tables S3 and S4, S8 and S9, Methods S2, and Note S4).
3.3. Effect of Electrode Height
Once the proposed computational model was validated in microfluidic systems and the mesh parameters were chosen, electrode heights were evaluated in larger systems such as 3D-printed electrochemical milli fluidic devices.
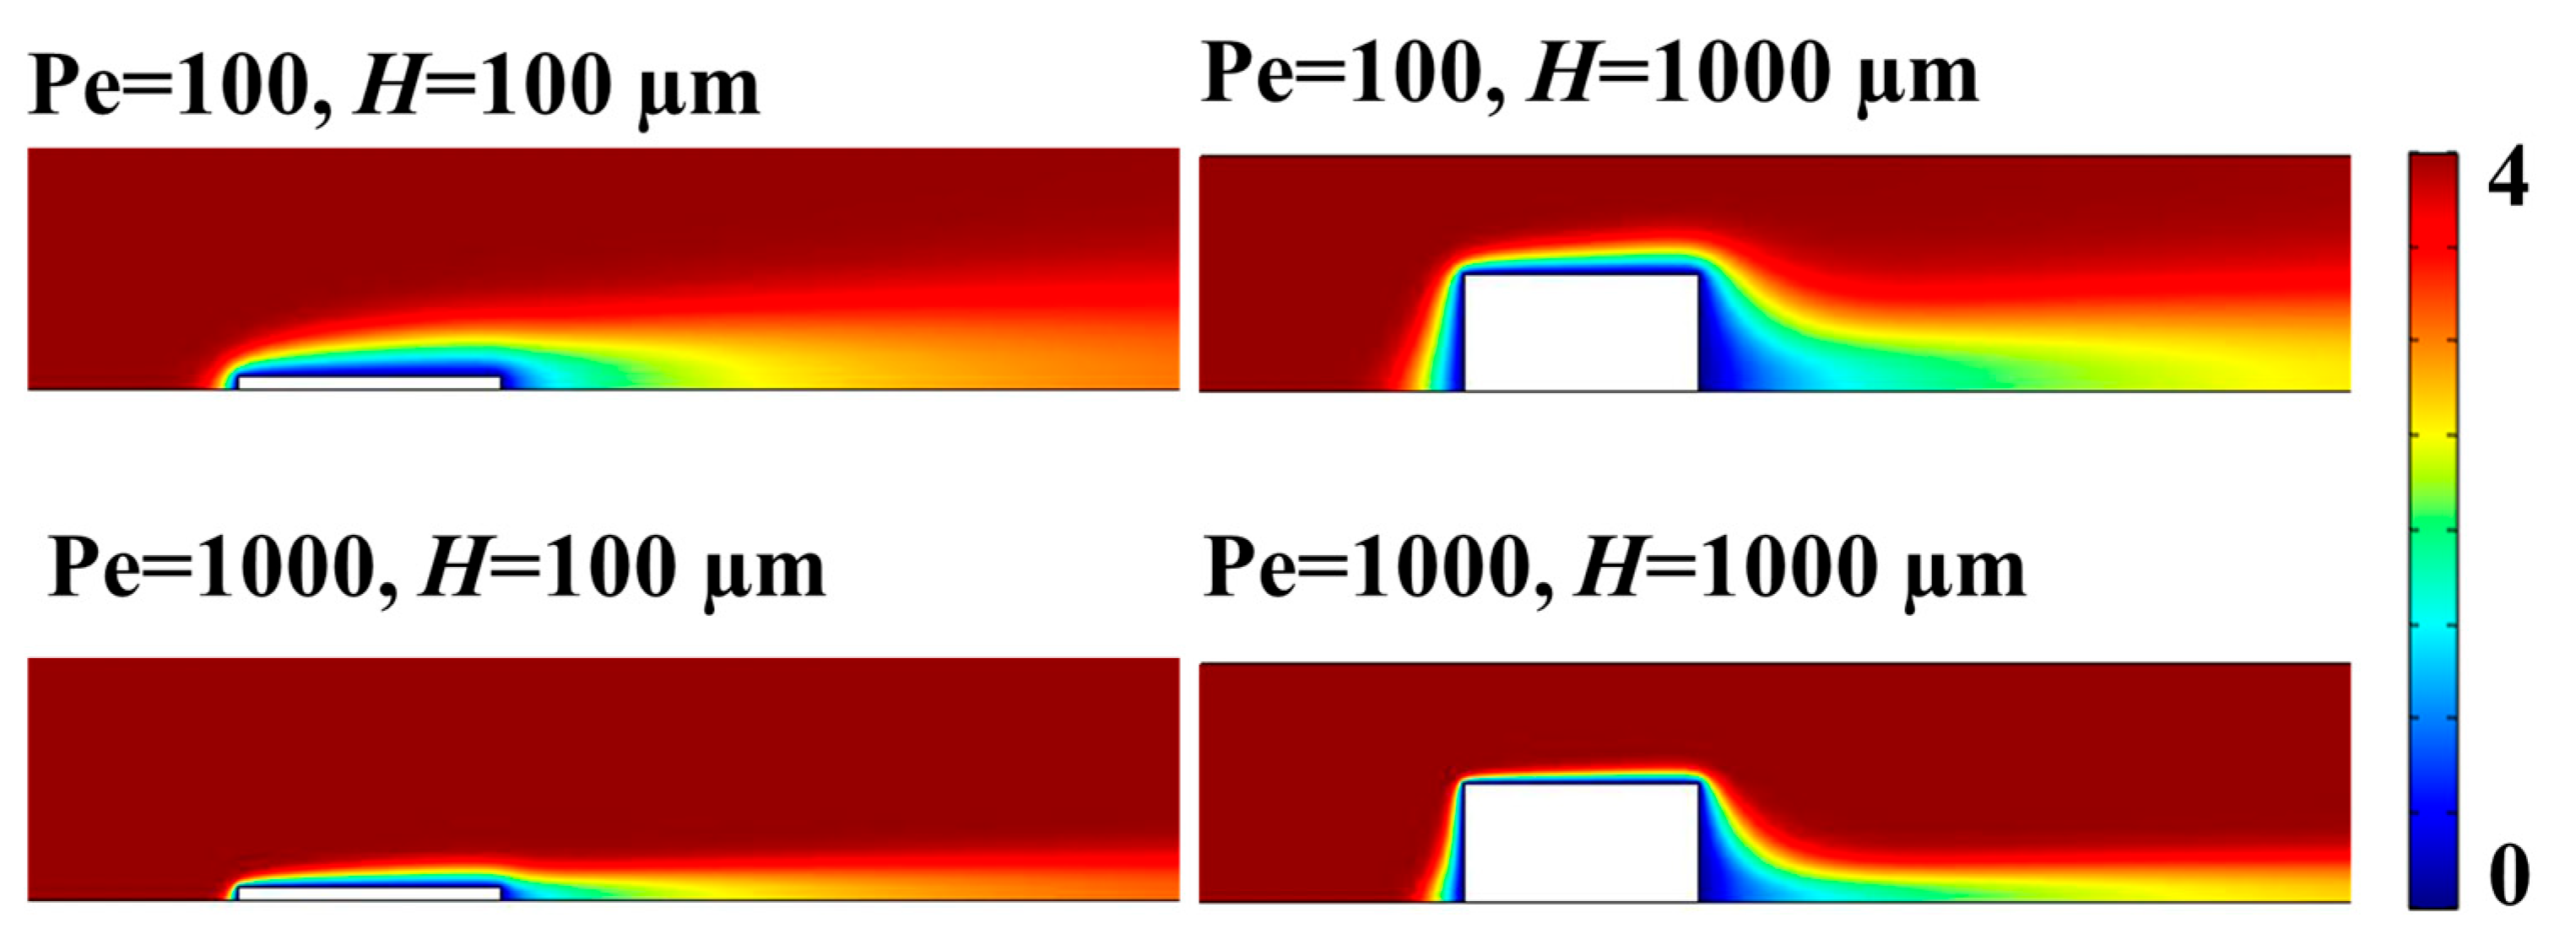
Figure 6 shows the concentration profile for the redox species under current-limited conditions at different electrode heights,
H (100 and 1000 µm) and Pe (100 and 1000) for
under laminar flow conditions.
Figure 6 shows that the convective regime prevails over diffusion in all situations, and the diffusion layer decreases when Pe and
H increase. This means that the total current generated at the electrode can be potentially explained using convective current contributions alone, as it is described in the following. Initially, the limited current was determined from simulations and compared with the theoretical convective current calculated from the Levich equation:
Notice that in this calculation, the effect of the height of the electrode is ignored.
Then, the dimensionless ratio of the total current to the convective current (
is graphed as a function of the dimensionless parameters
and Pe (
) at each
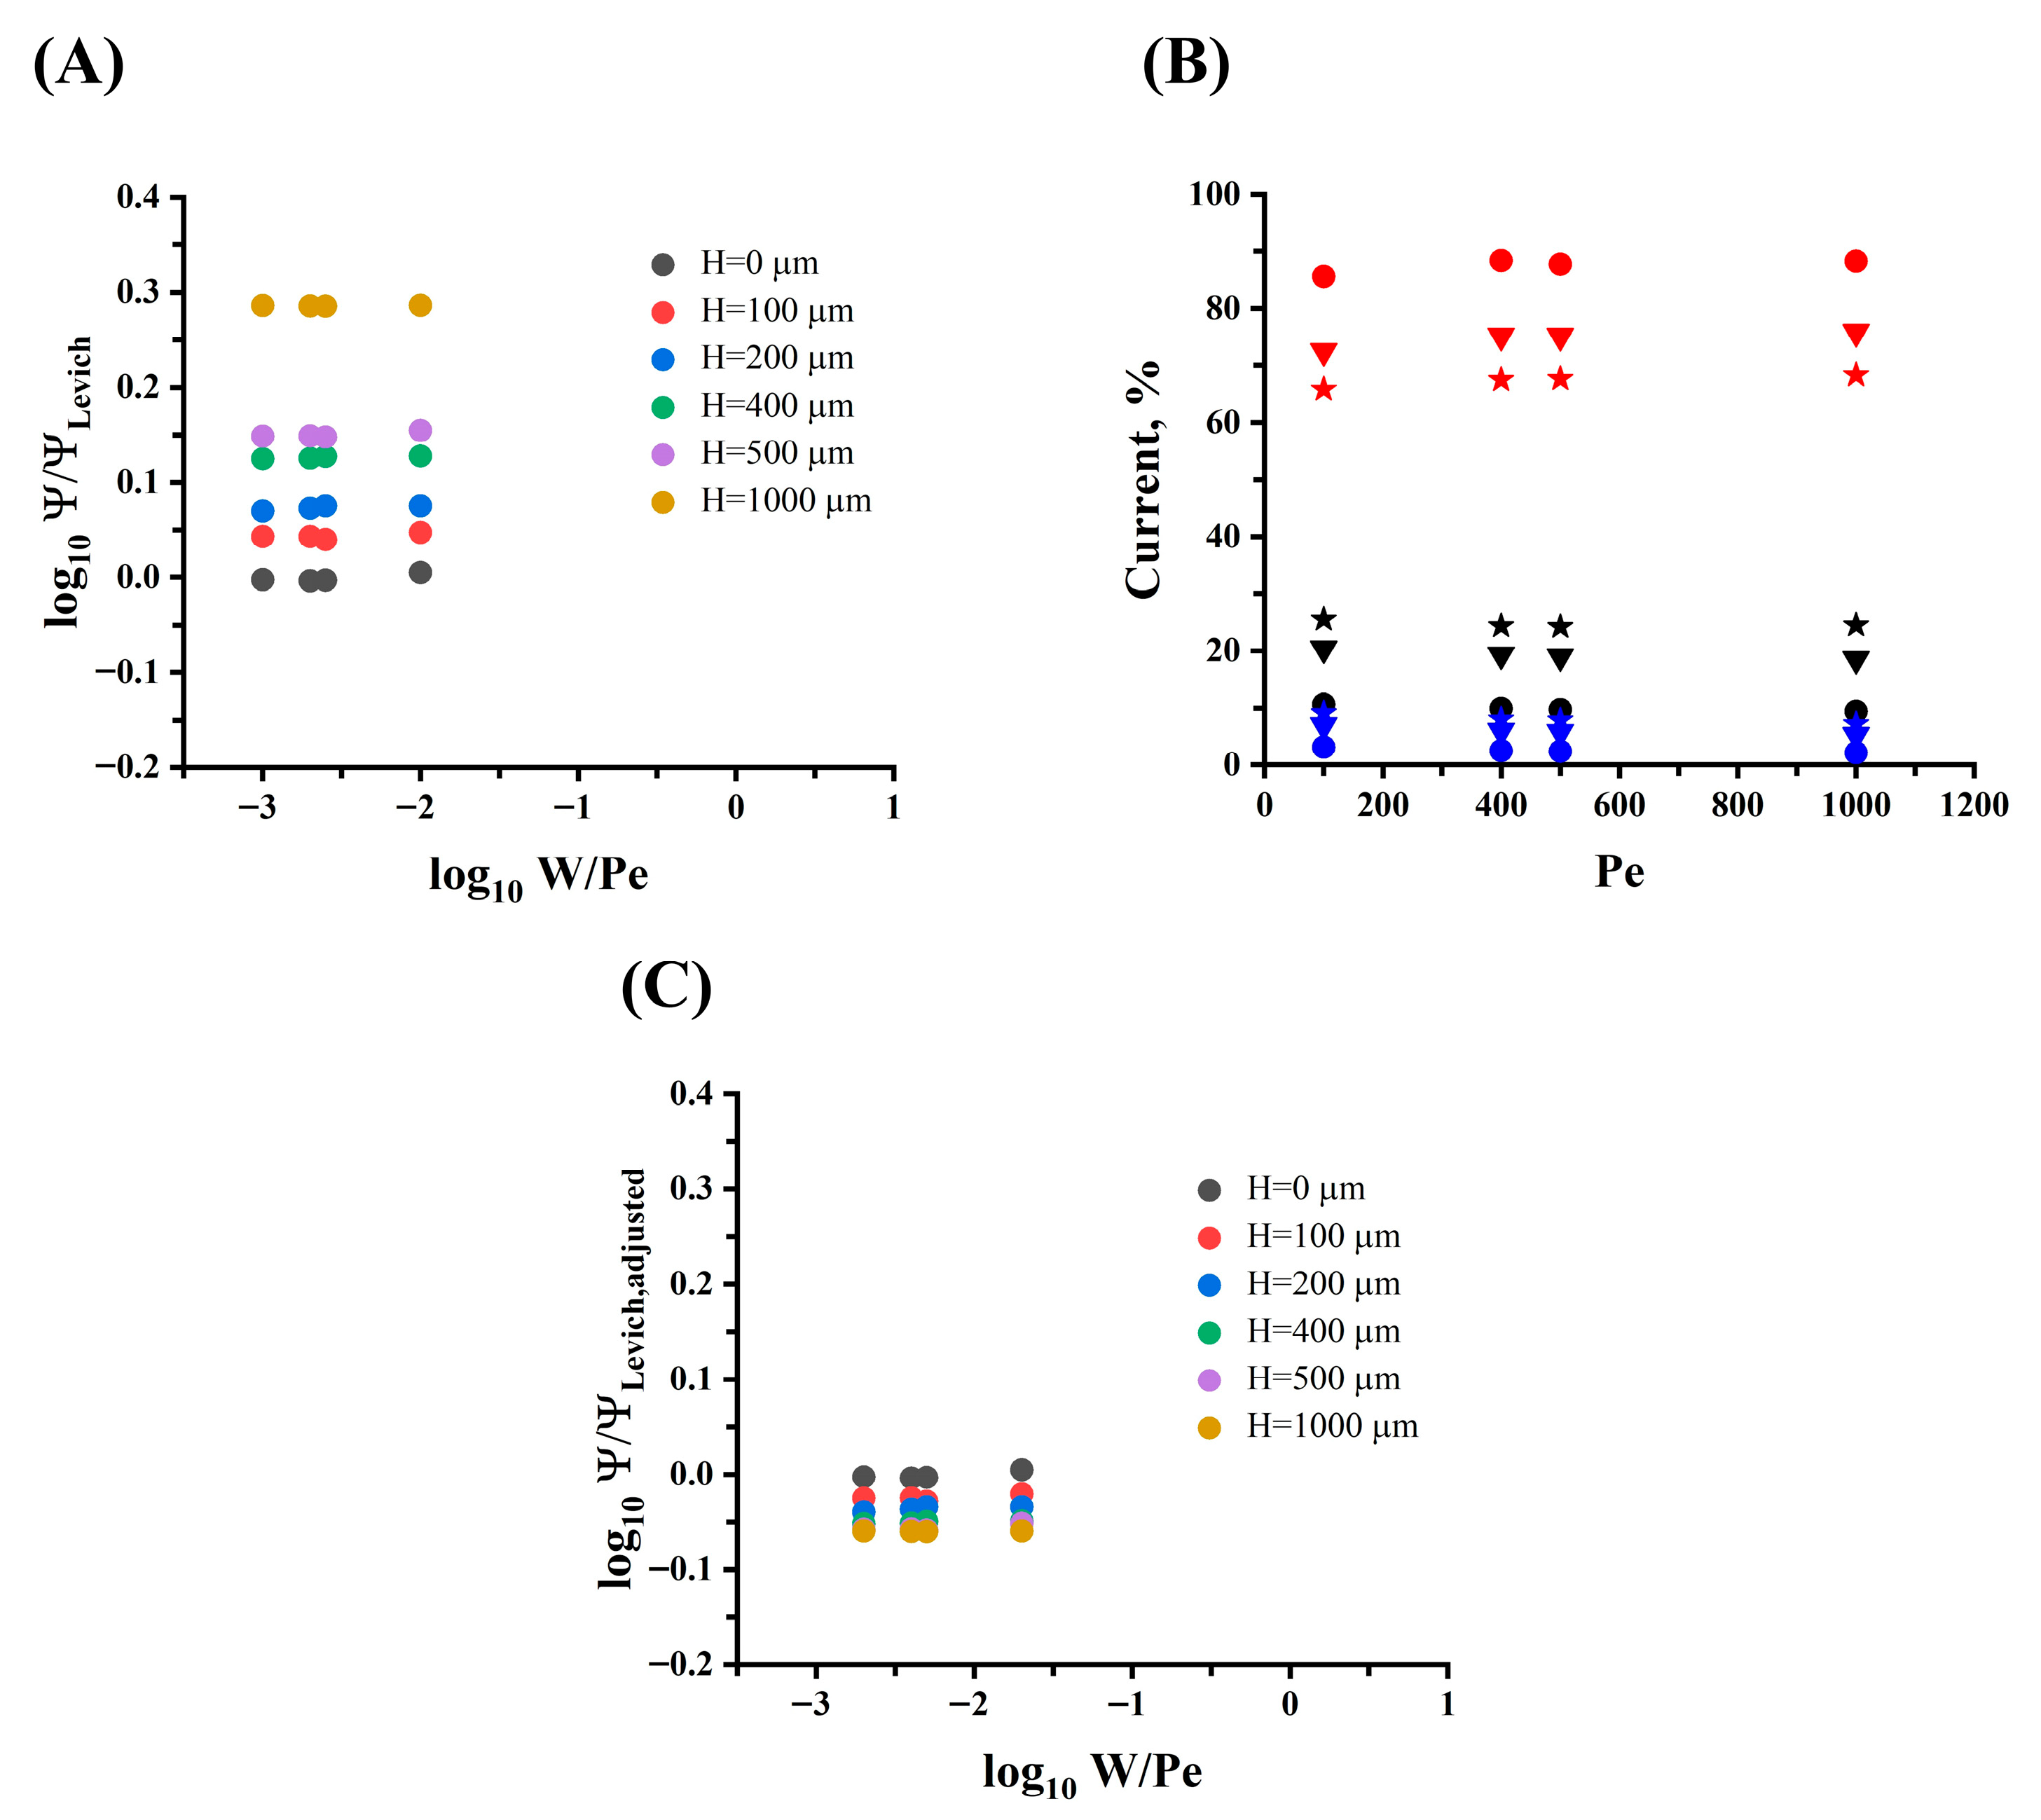
H and Pe, as shown in
Figure 7A. The figure shows that as the electrode height increases, the simulated limiting current increases and moves away from the theoretical limiting current predicted by Levich, so there would be an additional current contribution not yet accounted for.
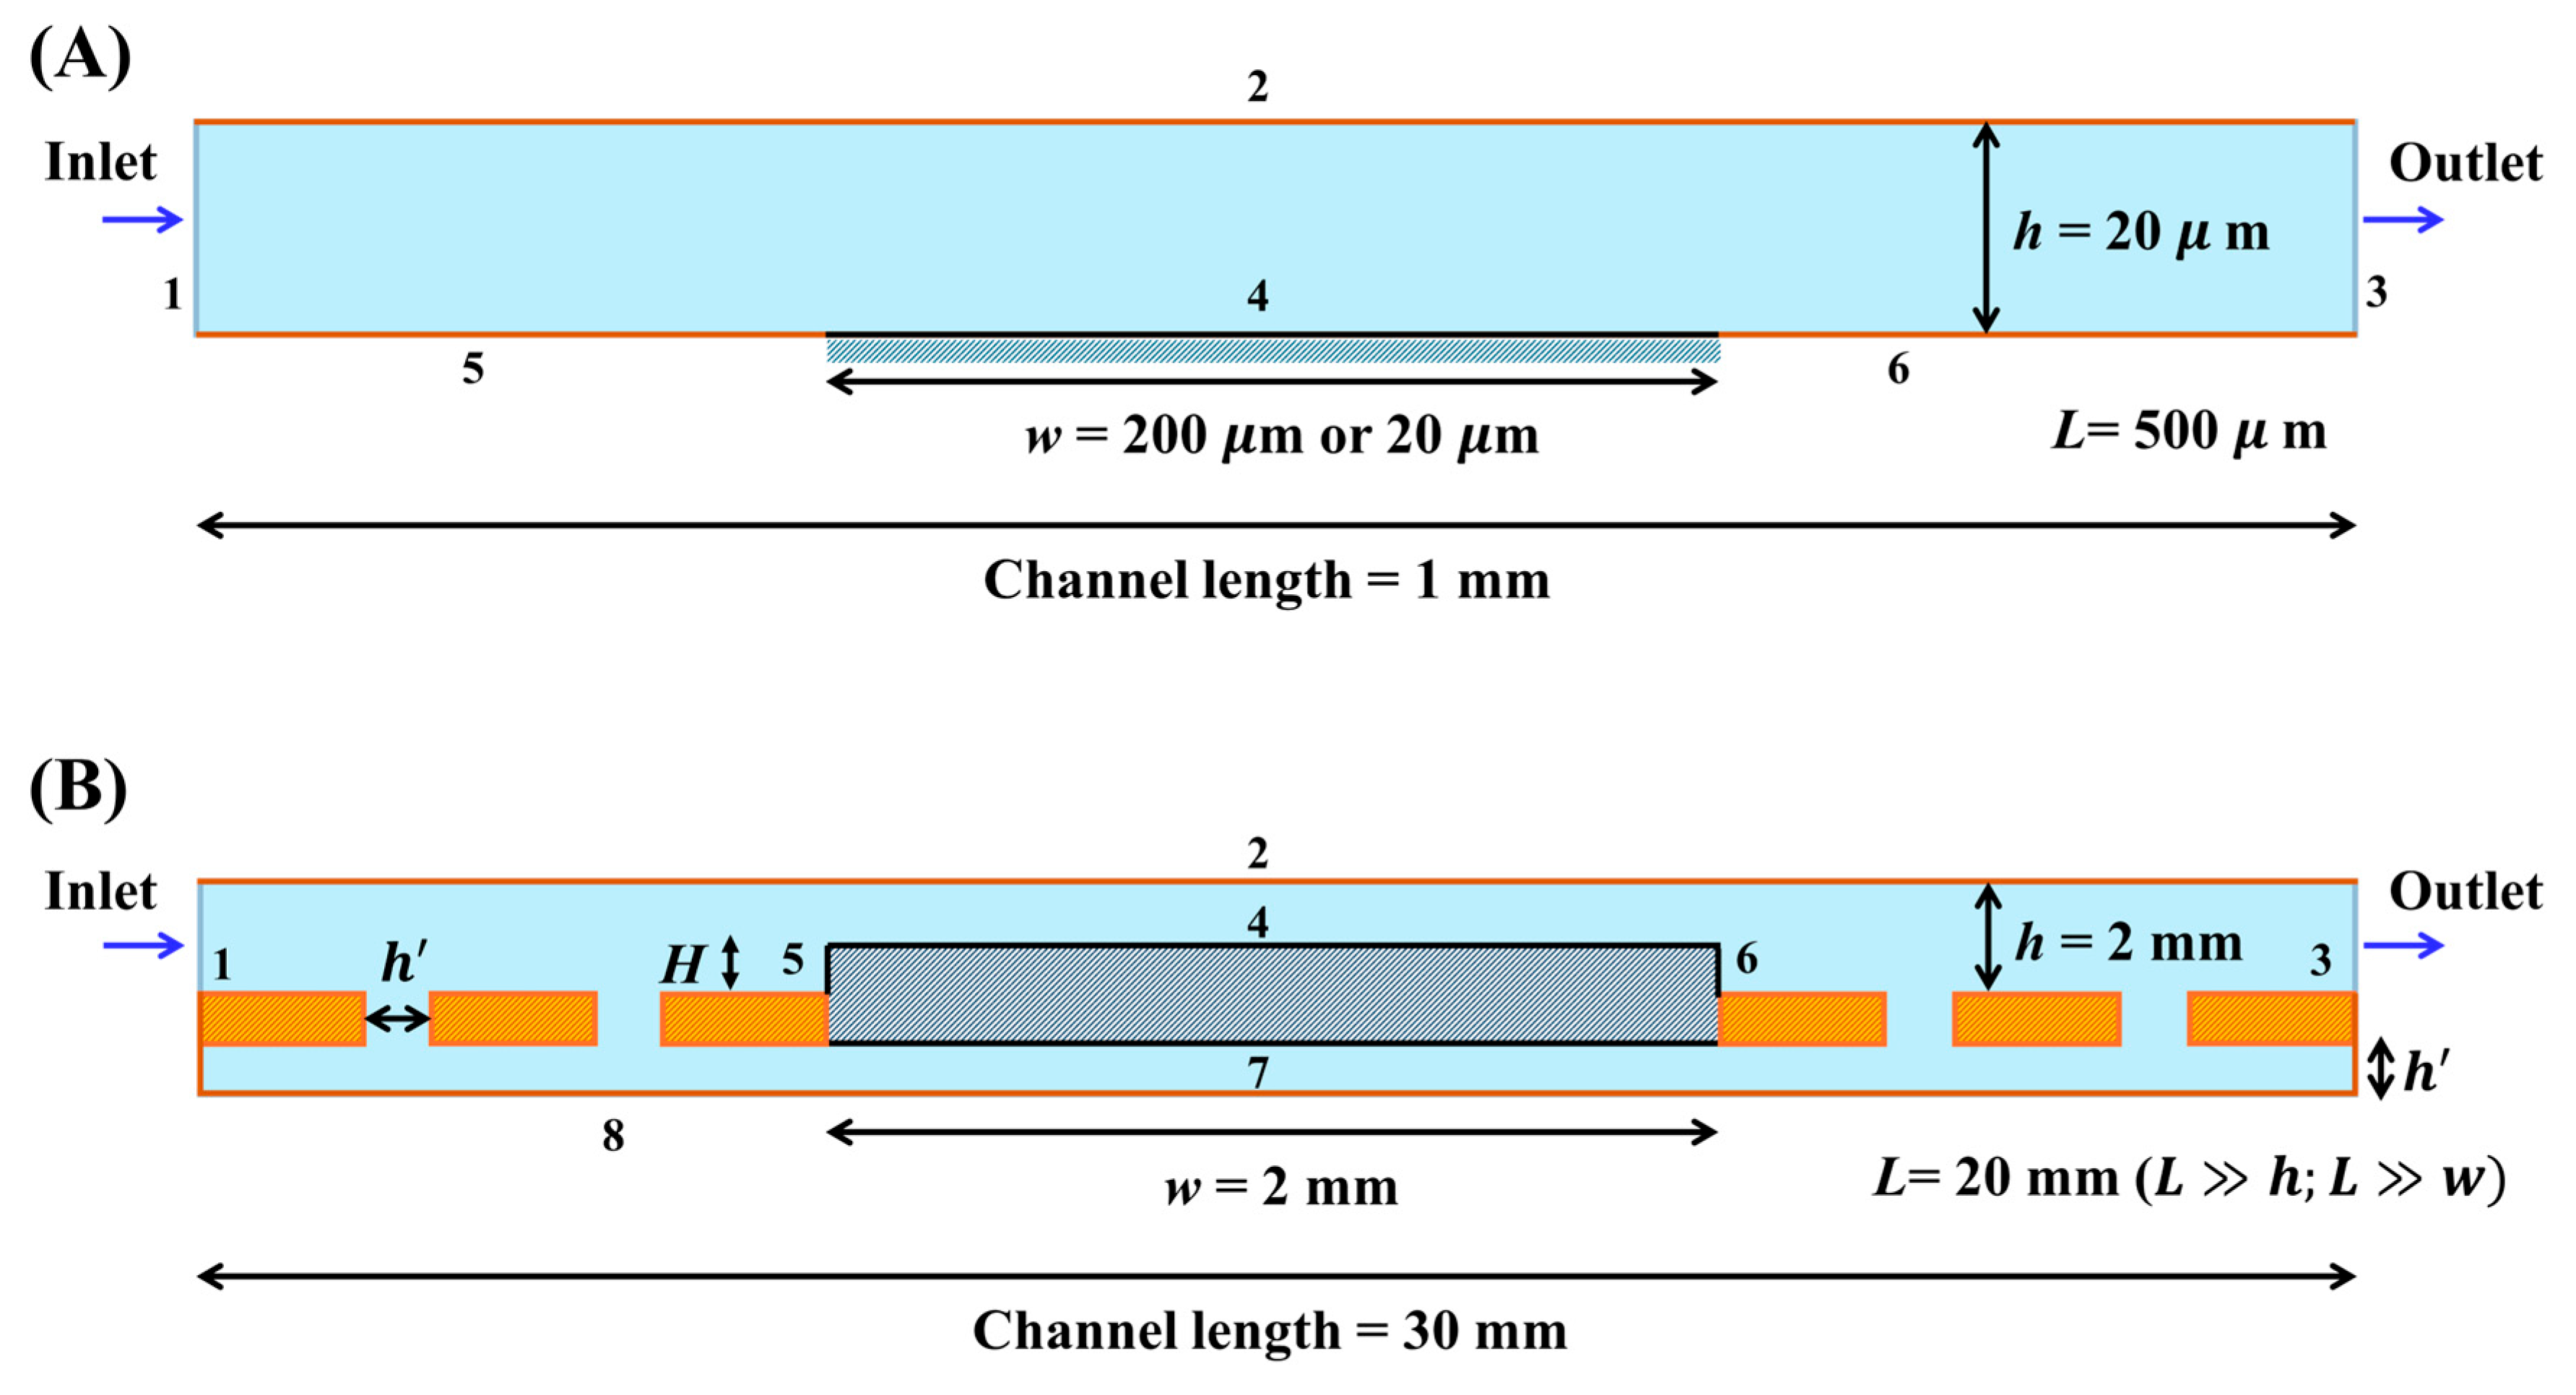
To study this further, the contributions to the total limited current by each of the electrode faces—front (boundary 5), top (boundary 4), and back (boundary 6) in
Figure 3B—were investigated for different electrode heights (100, 200, 400, 500, and 1000 µm), as shown in
Figure 7B and
Supplementary Figure S5.
From
Figure 7B, as
H increases, the contribution of the current generated at the top horizontal face of the electrode decreases, starting with a current contribution of
87% for an
H of 100 µm to a current contribution of
68% for an
H of 1000 µm. Meanwhile, the current contribution from the front and back vertical faces of the electrode increases as the electrode height increases due to the increase in the electrode surface area. The current contribution at the front and back faces is
10% and
3%, respectively, for an
H of 100 µm, and it increases to a current contribution at the front and back of
25% and
7%, respectively, for an
H of 1000 µm. This analysis indicates that current contributions from the front vertical face and the top horizontal face of the electrode represent more than 90% of the total current in all cases studied, meaning that current contributions from the back face of the electrode are small and can be neglected.
Therefore, the Levich model was adjusted to consider:
i. the Levich current contribution due to the electrode width
(
)—that is, the contribution coming from the top horizontal face of the electrode—while accounting for the reduction in the effective channel height (
) due to the electrode height; and
ii. the current contribution due to the electrode height (
)—that is, the contribution coming from the front vertical face of the electrode—as follows:
where all parameters have already been previously defined.
Based on Equations (8) and (12), a dimensionless adjusted Levich current (
) that successfully predicts and normalizes the current generated at the electrode when its height is varying and at various flow conditions is proposed, as shown in
Figure 7C. Compared to
Figure 7A, this adjusted Levich model produces important improvements as the electrode height increases up to half the height of the milli fluidic channel, and this confirms that convective currents represent the main contribution to the total current in such systems.
3.4. Effect of Porosity
The proposed porosity model evaluates different values of porosity ranging from 3% to 10% according to porosity levels reported in the literature for FDM 3D-printed PLA samples [
17,
35]. These levels of porosity correspond to the voids present in the 3D-printed PLA object, and in our case, these voids are present in the PLA material that forms and surrounds the milli fluidic channel structure. The largest voids can measure up to a few millimeters in their longest dimension and typically exhibit elongated non-spherical shapes that run longitudinally along the 3D printing filaments [
17,
35]. Therefore, we propose a porosity model that intends to represent the overall level of porosity on the PLA material that surrounds the milli fluidic channel including the electrode, rather than attempting to model individual pores. As such, in addition to the main channel on top of the electrode, we include a secondary channel below it that is connected to the main channel through vertical channels for the flow of electroactive species. This model enables the measurement of the current simultaneously generated on the top and underside faces of a flat electrode
, as shown in
Figure 3B. Because the dimensions of the vertical and secondary channels (
h’) can be modulated to represent porosity levels, we can study the effect of porosity on the current response.
Currents extracted from the simulations are then compared to currents predicted by the Levich ( in Equation (9)) and thin layer ( in Equation (10)) theoretical models of a flat electrode as a function of and Pe at different porosity values (3%, 5%, and 10%). The flow rate through the top and underside cross-sectional areas of the channels was determined from the simulations, and the appropriate channel heights ( or ) were used to calculate the corresponding and Pe values at the electrode’s top and underside faces.
From
Figure 8, the simulated current generated in the top face of the electrode did not present considerable variations when porosity increased in the range of −3
−2. For example, for the highest flow rate conditions (Pe
= 1000) and
W = 1, the simulated current generated in the top face of the electrode varies from 72.4 µA for 3% porosity to 71.2 µA for 10% porosity. This decrease in current is due to the increase in the fraction of the flow that goes through the pores toward the secondary channel when porosity increases. Therefore, the volumetric flow rate
Q decreases in the main channel, and less current would be generated on the top face of the electrode according to the Levich equation. In addition, from
Figure 8, the current generated in the top face of the electrode is predicted by the Levich model in the range of −3
−2 and porosity values of 3%, 5%, and 10%. This indicates that the current generated on the top face of the electrode in the main channel is a convection-limited current and corresponds to zone III for the specified device design.
As can be seen in
Figure 8A–C, different behaviors of the current generated on the underside face of the electrode through the secondary channel can be observed at different porosity values, suggesting the formation of different mass transport zones. From
Figure 8A,B, the current generated on the underside face of the electrode is predicted by the thin layer model (diffusion-limited current, zone I) for the range of 0.3
2 at 3% and 5% porosity. In addition, from
Figure 8B at 5% porosity, the transition zone begins for values of
0.2 and corresponds to zone II. From
Figure 8C, the current generated on the underside face of the electrode cannot be predicted by the Levich and thin layer models for the range of −1.3
−0.3 at a porosity of 10%. This indicates that the current generated on the underside face of the electrode in the secondary channel is a current limited by a mixture of the diffusion and convection regimes (transition, zone II) for the design of the proposed device at 10% porosity.
Figure 8D shows the different current behaviors generated on the top and underside faces of the electrode due to the presence of varying mass transport zones through the main and secondary channels for the different porosity values evaluated. Therefore, the Levich zone corresponds to the range of −
−1.3, the thin layer zone corresponds to the range of 0.3
+, and the transition zone can be found in the range of −1.3
0.3.
From
Figure 8D, it can also be observed that when the thin layer and Levich current are used as a reference in determining the current through the 3D-printed milli fluidic device, both graphs can be partially described with linear functions with slopes
m = 2/3 and
m = −2/3 (orange dotted lines), respectively (see
Supplementary Note S5).
3.5. Current Prediction Models
Therefore, due to the simultaneous presence of different mass transport regimes in porous milli fluidic systems, it is important to have a mathematical model that predicts the values of the currents in all transport regimes, whether convection, diffusion, or transition. Thus, a mathematical model capable of predicting these current behaviors was proposed. From
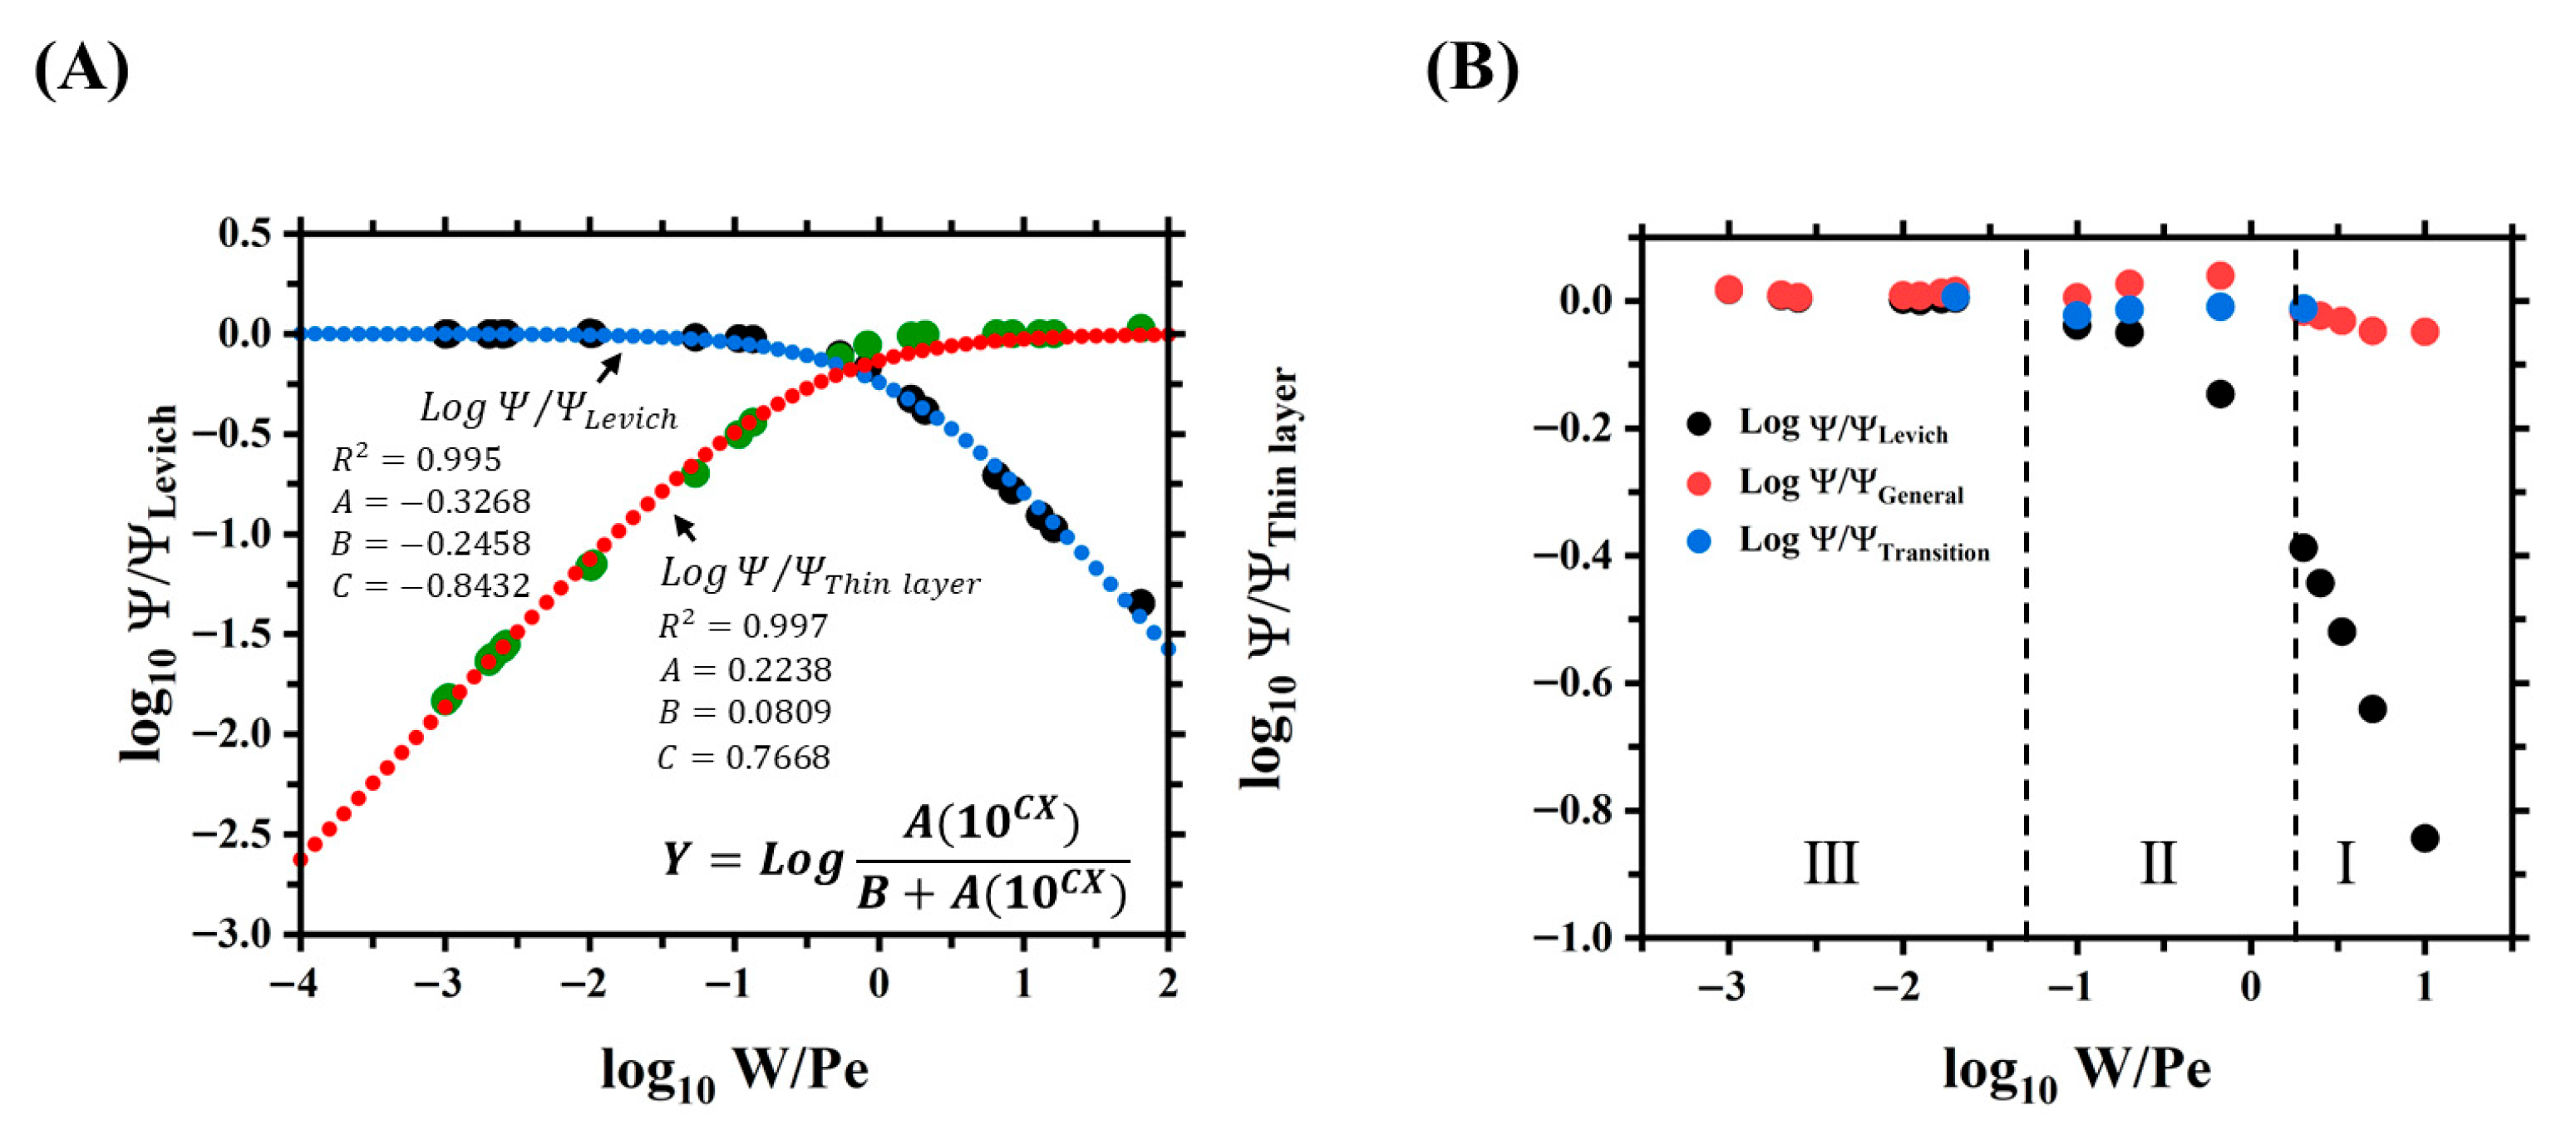
Figure 9A, the mathematical model that describes the data extracted from the simulations and that fits the two graphs either when the thin layer current is used as a reference,
, or when the Levich current is used as a reference,
, as a function of
, is the following:
where
,
, and
are constants obtained by fitting Equation (15) to the simulated current data, as seen in
Figure 9A,B, mathematically corresponding to the slope (
2/3 or
−2/3) previously mentioned, as shown in
Supplementary Table S10 and
Supplementary Note S6. Although the quality of both fittings is high (
for Levich and
for thin layer), we further evaluated their residual sum of squares (
) error in the transition zone, where an analytical model is not currently available.
The error of the fitted model using Levich as a reference was , and a larger was obtained when using the thin layer model as a reference. This indicates that, when fitting over all mass transport regimes, using as a reference is more accurate than using when predicting current values in the transition zone.
As a result, a general model (
) that can normalize the currents in all the different mass transport zones that develop within the 3D-printed device is then proposed based on the fitting that employs
as a reference in
Figure 9A.
where
,
, and
.
Because an analytical model applicable only to the transition regime can potentially provide even more accurate current predictions in zone II, we further used the mathematical model in Equation (15) to fit the current data obtained from simulations only in the transition zone to obtain new values of , , and specific to this regime. Once more, using as a reference current provided a more accurate fitting (, , and ; , and ) than using (, , and ; and ). Note that the RSS error in the transition zone was smaller when only current data from the transition zone was used for the fittin compared to when current data from the three zones was employed for the fitting in the general normalization model.
As a result, a specific model is then proposed that is capable of normalizing currents in the transition zone, called dimensionless transition current (
), based on Equation (15) and
, as follows:
where
,
, and
.
3.6. Deployment of the Models
The models used to predict and normalize currents in all mass transport regimes (
, Equation (16)) and in the transition zone (
, Equation (17)) as a function of
W and
Pe, developed using data from millimeter-scale flow systems, were then applied to flow systems at a much smaller scale. Here we consider the microfluidic system with channel band electrodes studied by Amatore et al. [
22] and used for validating our simulations (see
Section 3.2 and
Figure 5).
Figure 9B shows normalized dimensionless current data obtained from the microfluidic system using different current normalization models, illustrating how: the normalization by
is limited to zone III; the general model (
) successfully normalizes currents in zones I, II, and III; and the transition model (
) appears to provide the best normalization in zone II. Therefore, we further evaluated the accuracy of the dimensionless currents
predicted in the transition zone of the microfluidic system. Higher accuracy was obtained using the transition (zone II)-specific current model (
) with an
RSS = 2.9763 compared to the general model with an
RSS = 3.0942, as expected. For comparison, an
RSS = 133.0930 is obtained when the same currents in the transition zone are predicted using the Levich model
. Thus, the ability of the models proposed in this work to predict and normalize currents in any mass transport regime as well as the transition regime in micro and milli fluidic devices with channel band electrodes is demonstrated.
As a summary, this work highlights that FDM 3D printing is a suitable tool for the fabrication of 3D-printed milli fluidic devices with channel band electrodes. However, further experimental studies are needed to better understand the impact of porosity on the performance of these 3D-printed devices as quantitative chemosensors. At this point, the quantitative electrochemical operation of such 3D-printed devices is described by theoretical and computational models that give us a better understanding of the influence of key features such as electrode shape and porosity, as discussed in previous sections. Notice, however, that in FDM 3D-printed devices, their porous network structure, pore size distribution, and pore proximity to the electrode can restrict the passage of the electroactive species in complex ways, with the subsequent formation of zones where diffusion, convection, or both prevail. The analytical models introduced here are valuable tools to predict current response under such conditions based on the local hydrodynamics of the system. Therefore, our analytical models and simplified porosity models can be validated through future studies where detailed porosity features of FDM 3D printing devices are measured using techniques such as optical profilometry, optical microscopy, micro X-ray computed tomography, and robust design theory to process experimental data [
37]. Then, this porosity information can be incorporated into simulations to give an even more detailed and precise understanding of porosity effects on the current response under both steady-state and transient conditions. Finally, as a general recommendation, researchers are encouraged to adopt computational tools and analytical models, such as the ones introduced in this study, to validate the functionality of 3D-printed sensors before their application.
4. Conclusions
This research introduces an FDM-based approach for prototyping a 3D-printed milli-fluidic device incorporating channel band electrodes. The fabrication process employs the “print–pause–print” technique, enabling electrode activation via a compatible polishing method, followed by an “in-channel” electrochemical activation strategy. The feasibility of the proposed approach was successfully demonstrated with the fabrication and activation of a 3D-printed milli fluidic electrochemical sensor device.
Conversely, computational and theoretical methods facilitated a deeper understanding of the mass transport-limited current regimes in a single band electrode within a 3D-printed milli fluidic channel fabricated using FDM technology. These methods accounted for design and hydrodynamic parameters, as well as variations in electrode shape and channel porosity in such devices. Regarding the electrode shape, a non-flat electrode with a rectangular profile of a certain height was formulated, and its current response was investigated as a function of electrode height. As a result, this study proposed an adjusted Levich model () that successfully integrates convective contributions from the Levich current associated with both the electrode width and height.
Furthermore, from the computational and theoretical analysis, the presence of porosity in a 3D-printed computational model device resulted in current responses simultaneously occurring in more than one of three mass transport regimes within the device: convection (zone III); diffusion (zone I); and transition (zone II), in which both convection and diffusion contributions are expected. Similar to the analysis of microfluidic electrochemical systems with channel band micro electrodes, a zone diagram maps the design and hydrodynamic conditions under which these regimes emerge, as characterized by dimensionless design () and hydrodynamic (Pe) parameters. This zone diagram offers straightforward criteria for optimizing 3D-printed electrochemical milli fluidic devices with channel band electrodes and selecting optimal design and flow conditions for specific electroanalytical applications in a pressure-driven milli fluidic channel.
More importantly, the simultaneous presence of multiple regimes, such as zone III in the main channel on top of the band electrode and zone II in a secondary channel representing porosity under the electrode, signaled the need for models in addition of Levich and thin layer, capable of describing current responses in the transition regime. These limitations were addressed with two analytical models: i. a general model () capable of predicting and normalizing currents across all transport regimes, and ii. a transition (zone II)-specific model () capable of predicting and normalizing currents in the transition zone with high accuracy. The proposed models allow accurate predictions and normalization of the simulated current response in channel band electrodes to optimize both 3D-printed millimeter-scale fluidic electrochemical sensing devices and the more conventional micrometer-scale ones.
